 Open Access Article
Creative Commons Attribution 3.0 Unported Licence
Remarkable impact of low BiYbO3 doping levels on the local structure and phase transitions of BaTiO3†
M.
Deluca
 *ab,
Z. G.
Al-Jlaihawi
 c,
K.
Reichmann
d,
A. M. T.
Bell
c and
A.
Feteira
 *c
*c
aMaterials Center Leoben Forschung GmbH, Roseggerstrasse 12, 8700 Leoben, Austria. E-mail: marco.deluca@mcl.at
bInstitut für Struktur-und Funktionskeramik, Montanuniversitaet Leoben, Peter Tunner Strasse 5, 8700 Leoben, Austria
cMaterials and Engineering Research Institute, Sheffield Hallam University, S1 1WB, Sheffield, UK. E-mail: a.feteira@shu.ac.uk
dInstitute for Chemistry and Technology of Materials, Graz University of Technology Stremayrgasse 9, 8010 Graz, Austria
First published on 15th March 2018
Abstract
In situ Raman spectroscopy shows the simultaneous incorporation of small amounts of Bi3+ and Yb3+ into the lattice of BaTiO3 to break the average symmetry inferred from X-ray powder diffraction analysis and permittivity measurements. In particular, Bi3+ with a stereochemically active lone-pair of electrons induces severe lattice strain and the coexistence of different local crystal symmetries over a wide temperature range, effectively controlling the physical properties, such as the temperature dependence of the permittivity and the Curie temperature. These results show that compositional gradients based in small variations of these two dopants could successfully explain the enhanced thermal stability of the permittivity in core–shell type ceramics, whereas the lower capacitance of the shell can also cap the maximum permittivity at the Curie temperature.
Introduction
Recent research into energy storage, lead-free piezoelectrics and high temperature stable dielectrics has renewed the interest on BaTiO3-solid solutions incorporating Bi3+. In particular, there has been considerable interest in the dielectric and piezoelectric properties of BaTiO3–BiMO3 (M = Al, Sc, Fe, In, Y, Gd, Yb, …)1–5 ceramics, but also on BaTiO3–Bi(MB1MB2)O3 (MB1MB2 = Zn1/2Ti1/2, Zn1/2Zr1/2, Mg1/2Ti1/2, Mg2/3Nb1/3, …).6–8 Interestingly, these solid solutions appear to exhibit some peculiar dielectric phenomena, such as a weakly-coupled relaxor behaviour, which is remarkably stable up to high temperatures and high electric fields. The temperature- and frequency-dependent dielectric response can be simultaneously described by the Curie–Weiss law and the polar nanoregions (PNRs) model applied to traditional relaxors. Nevertheless, Vogel-Fulcher analysis revealed activation energies one order of magnitude higher that those observed for traditional relaxors. Some models have been proposed to explain the aforementioned dielectric characteristics. For example, the BaTiO3–BiAlO3 and BaTiO3–BiScO3 systems have been reported to show a so-called “re-entrant like relaxor behaviour”,9 which manifests itself by the appearance of relaxor-type behaviour at temperatures above the permittivity maximum. Recently, a double rattling ion model1 was proposed to describe the temperature- and frequency-dependence of the polarizability in BaTiO3–BiMO3 materials. Basically, the larger Ba2+ and M3+ ions create oversized A-site cages for Bi3+ions, resulting in off-centering of Bi3+ in order to create shorter Bi–O bonds and thereby relieve the tensile bond strain. Hence, both Bi3+ and Ti4+ prefer displaced positions, and it is the dynamic hopping among these positions that gives rise to the dielectric relaxation. This relaxation is often observed at relatively high BiMO3 contents. At lower BiMO3 contents other phenomena can be observed. For example, the BaTiO3–BiYbO3 system also shows a so-called “ferroelectric-to-relaxor crossover”3 at x = ∼0.05, where the emergence of relaxor-type behaviour occurs in compositions, whose average crystal symmetry is still described by the P4mm tetragonal space group.The average long-range structure of BaTiO3 is well understood. On cooling, the crystal symmetry of BaTiO3 changes successively from cubic (Pm![[3 with combining macron]](https://www.rsc.org/images/entities/char_0033_0304.gif) m) to tetragonal (P4mm) at ∼130 °C, then to orthorhombic (Amm2) at 5 °C and finally to rhombohedral (R3m) at −90 °C. These phase transitions are accompanied by discontinuities in relative permittivity, unit cell volume and frequency of some lattice vibration modes. Indeed, the fundamental properties of BaTiO3 are related to phonons of the optical branch, in particular the paraelectric-to-ferroelectric phase transition appears connected to the softening of the lowest frequency transverse optical (TO) mode. The static dielectric constant and the structural phase transitions of BaTiO3 are also related to phonons of optical frequency. Hence, Raman spectroscopy is often employed to investigate the impact of chemical doping on the lattice dynamics and consequently infer the dielectric behaviour. Pokorny et al.10 demonstrated that site occupancy in doped BaTiO3 can be analysed by Raman spectroscopy, in particular the appearance of an A1g mode was postulated to be a sufficient proof to ascertain either the presence of a dopant in the B-site or the existence of a Ti vacancy. In Bi-substituted BaTiO3, Deluca et al.11 proved that the insertion of Bi3+ into the BaTiO3 lattice promotes tetragonal distortion due to the effect of the stereochemically active lone-pair of Bi3+. This effect, however, seems to be compensated if a large cation (such as Yb) is introduced on the B-site.2 These aspects were probed by Raman spectroscopy. Studies of the impact of low BiMO3 doping contents on the dielectric and vibrational characteristics of BaTiO3–BiMO3 ceramics are seldom, however they may provide a further insight on the peculiar properties of these systems.
m) to tetragonal (P4mm) at ∼130 °C, then to orthorhombic (Amm2) at 5 °C and finally to rhombohedral (R3m) at −90 °C. These phase transitions are accompanied by discontinuities in relative permittivity, unit cell volume and frequency of some lattice vibration modes. Indeed, the fundamental properties of BaTiO3 are related to phonons of the optical branch, in particular the paraelectric-to-ferroelectric phase transition appears connected to the softening of the lowest frequency transverse optical (TO) mode. The static dielectric constant and the structural phase transitions of BaTiO3 are also related to phonons of optical frequency. Hence, Raman spectroscopy is often employed to investigate the impact of chemical doping on the lattice dynamics and consequently infer the dielectric behaviour. Pokorny et al.10 demonstrated that site occupancy in doped BaTiO3 can be analysed by Raman spectroscopy, in particular the appearance of an A1g mode was postulated to be a sufficient proof to ascertain either the presence of a dopant in the B-site or the existence of a Ti vacancy. In Bi-substituted BaTiO3, Deluca et al.11 proved that the insertion of Bi3+ into the BaTiO3 lattice promotes tetragonal distortion due to the effect of the stereochemically active lone-pair of Bi3+. This effect, however, seems to be compensated if a large cation (such as Yb) is introduced on the B-site.2 These aspects were probed by Raman spectroscopy. Studies of the impact of low BiMO3 doping contents on the dielectric and vibrational characteristics of BaTiO3–BiMO3 ceramics are seldom, however they may provide a further insight on the peculiar properties of these systems.
Moreover, minute amounts of trivalent rare-earth (RE3+) are commonly used as dopants in commercial formulations of multilayer ceramic capacitors to improve their reliability. It was found that the electrical properties of A-site RE3+ doped BT are very dependent on the processing conditions, such as the oxygen partial pressure, sintering temperature and rate of cooling from the sintering temperature.12 For example, it was shown that La-doping in BT ceramics fired in air leads to the formation of Ti-vacancies, but the emergence of semiconductivity results from oxygen loss, which appears more favourable in the doped system than in undoped BT.12 It has been also shown that semiconductivity in acceptor doped BaTi1−xHoxO3 ceramics with x = 0.001 to 0.01 is due to the presence of Ti3+. It was suggested that for these diluted Ho contents, each oxygen vacancy is charge compensated by one Ho3+ and one Ti3+, whereas at higher x values charge compensation is achieved by Ho3+ and the samples are insulating.13
Here, the dielectric behaviour of charge compensated (1−x)BaTiO3–xBiYbO3 (0 ≤ x ≤ 0.02) ceramics was investigated using a combination of temperature-dependent dielectric measurements and in situ Raman spectroscopy. In agreement with the dielectric measurements, Raman spectroscopy data show the incorporation of Bi/Yb to have little impact on the cubic-to-tetragonal structural phase transition but to affect dramatically the tetragonal-to-orthorhombic transition. Long-range covalence effects brought by Bi3+ in the (1 − x)BaTiO3–xBiYbO3 system, are evidenced through the comparison with the behaviour of a control sample (1 − y)BaTiO3–yLaYbO3 with y = 0.01, where La3+ does not feature such a lone-pair of electrons. Bi3+ with an ionic radius of 1.45 Å exhibits a 6s26p0 valence electronic configuration, where the 6s2 lone-pair of electrons hybridize with empty 6p0 orbitals of Bi3+ but also with the 2p6 electrons of O2− forming mainly covalent Bi–O bonds, leading to local structural distortion. La3+ with an ionic radii of 1.36 Å exhibits 4d105s25p6 and may also form covalent bonds. Nevertheless, based on the electronegativity difference it can be anticipated that La–O bonds should exhibit a larger ionic character than the Bi–O bonds. Hence, (1 − y)BaTiO3–yLaYbO3 ceramics with y = 0.01 were prepared in order to evaluate the impact of local bond character on the long-range structure. For higher LaYbO3 contents the reader is refer to a previous study by Feteira and Sinclair,14 which shows the coalescence of all structural phase transitions at y = 0.05.
Experimental
Dried BaCO3 (>99.0%), TiO2 (>99.9%, Aldrich), Bi2O3 (>99.9%, Aldrich), Yb2O3 (>99.9%, Aldrich) powders were weighed according to the Ba1−xBixTi1−xYbxO3 formula for x = 0, 0.005, 0.01 and 0.02. These powders were placed into a 250 ml milling polyethylene bottle together with ∼0.5 kg of yttrium-stabilized zirconia milling media and ∼100 ml of propan-2-ol and then mixed on roller ball mill overnight. Mixed powders were dried and then passed through a 500 μm mesh sieve. The sieved powders were pressed into pellets and reacted between 850 and 1000 °C with intermittent re-grinding and re-firing until no change on X-ray diffraction (XRD) data was visible. The fully reacted powders were pressed as 8 mm pellets and fired up to 1300 °C for 2 hours. The pellets were stacked on top of each other and sintered in a closed alumina crucible to limit loss of Bi. Their microstructures (given in the ESI†) were examined by scanning electron microscopy using a SEM equipped with a W-filament. All doped ceramics exhibited similar grain sizes and morphologies. In addition, Ba1−yLayTi1−yYbyO3 with y = 0.01 was prepared as a control sample, in order to contrast the impact of Bi3+ and La3+. Purity and crystal structure analyses were carried out by XRD using a Bruker diffractometer (model D8) set up in transmission geometry and using monochromatic Cu Kα1 radiation. XRD patterns were acquired in the 20–70 2θ range, with a step size of 0.02 degrees with a scan length of 2 seconds per step. Rietveld refinements were done using FULLPROF.15 Raman spectra were obtained with a Renishaw Raman microscope (model InVia) using a 532 nm solid state (100 mW) laser, in back-scattering geometry using a 50 cm−1 edge filter. Temperature dependent Raman measurements were carried out using a Linkam (THMS600) Temperature Controlled Stage. Platinum electrodes were coated onto the faces of the sintered pellets for electrical measurements. Capacitance measurements were carried out with a Novocontrol (model Concept 40) measurement system. Polarisation (P) and strain (S) versus electric field (E) loops were recorded at 1 Hz from −100 °C to 60 °C using an aixACCT system.Results
Room-temperature X-ray data, Fig. 1, shows all (1 − x)BaTiO3–xBiYbO3 (BBTYb) ceramics in the 0 ≤ x ≤ 0.02 range to be isostructural and their average crystal symmetry to be well described by the non-centrosymmetric tetragonal P4mm space group. The degree of tetragonality decreases only marginally, as shown by the decrease of the peak splitting in Fig. 1b and (c).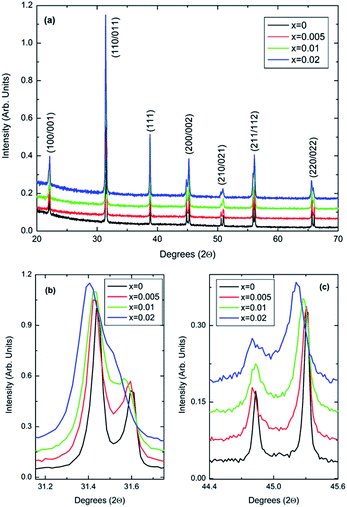 | ||
| Fig. 1 (a–c) Room-temperature XRD data for (1 − x)BaTiO3–xBiYbO3 ceramics in the 0 ≤ x ≤ 0.02 range. | ||
The P4mm tetragonal structure BaTiO3 crystal structure given by R. H. Buttner and E. N. Maslen16 was used as a starting model for Rietveld refinements. All of Yb3+ was placed in the Ti4+ site, whereas Bi3+ was placed in the Ba2+ site. All datasets were successfully refined with single-phase P4mm structures. For x = 0.02 data O2 temperature factor was fixed at zero. Results are given below. Lattice metrics are listed in Table 1. Refined coordinates, temperature factors (Uiso) and bond lengths are given in Table S1 from the ESI.†
| x | 0 | 0.005 | 0.01 | 0.02 |
|---|---|---|---|---|
| a (Å) | 3.99715(5) | 3.99764(7) | 3.99923(7) | 4.00413(10) |
| c (Å) | 4.03660(6) | 4.03578(9) | 4.03444(9) | 4.03492(12) |
| V (Å3) | 64.4937(14) | 64.496(2) | 64.526(2) | 64.692(3) |
| c/a | 1.00987(3) | 1.00954(4) | 1.00880(4) | 1.00769(6) |
The c/a ratio is consistent with the aforementioned small decrease in the degree of tetragonality. Also the increase in the unit cell volume with increasing x is in agreement with the shift of the diffraction peaks towards lower 2θ degrees. On the other hand, the Curie temperatures follow a more irregular trend. First, the Curie temperature, TC, increases slightly from ∼124 °C for undoped BT to ∼134 °C for x = 0.005, as illustrated in Fig. 2. Then it remains almost invariable for x = 0.01 and slightly drops to ∼131 °C for x = 0.02. This might be ascribed to the combined effect of Bi3+ (promoting tetragonality) and Yb3+ (promoting pseudocubicity) substitution at A- and B-sites of BaTiO3, respectively.2,11 In contrast, the dielectric anomaly associated with the tetragonal-to-orthorhombic phase transition shifts dramatically towards lower temperatures with increasing Bi/Yb content. Indeed, it drops from ∼12 °C for undoped BT to ∼ −18 °C for x = 0.005 and subsequently to ∼−37 °C for x = 0.01, eventually merging (at x = 0.02) with the orthorhombic-to-rhombohedral phase transition, which remained almost independent of the Bi/Yb content.
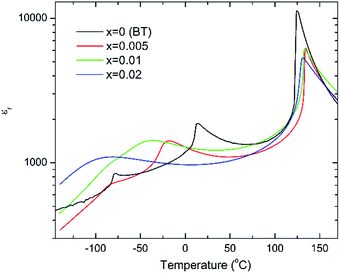 | ||
| Fig. 2 Temperature dependence of the relative permittivity for (1 − x)BaTiO3–xBiYbO3 ceramics measured at 10 kHz. | ||
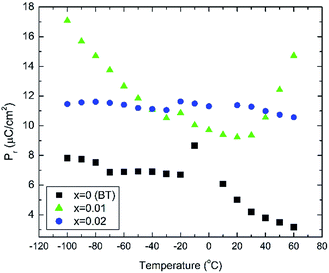
In situ electric field-induced polarisation and strain measurements for x = 0, 0.01 and 0.02 were carried from −100 °C to 60 °C, under an applied electric field of 20 kV cm−1. Temperature dependence of the remanent polarisation, Pr, is illustrated in Fig. 3, whereas temperature dependence of the maximum polarisation, Pmax, and the coercive field, Ec, is given in Fig. S2(a, b) of the ESI.† All values have been extracted from the P–E loops presented in Fig. S3 of the ESI.†
Anomalies in Pr are observed at temperatures similar to those of the dielectric anomalies. These anomalies are more evident in x = 0. In addition, x = 0.02 ceramics exhibit the most temperature stable Pr, also in broad agreement with the temperature dependence of the relative permittivity shown in Fig. 2. Below −30 °C, BBTYb (x = 0.01) exhibits the largest temperature gradient in Pr, however the sudden rise of Pr above 30 °C, should be regarded with caution, because it may be an artefact caused by the larger leakage current exhibited by this composition, which is also corroborated by the rounder P loops, as shown in Fig. S3 of the ESI.†
Fig. 4 shows bipolar electric-field induced strain measurements taken at 50 °C and −100 °C, which in case of undoped BT are temperatures well within the tetragonal and rhombohedral phase fields, respectively.
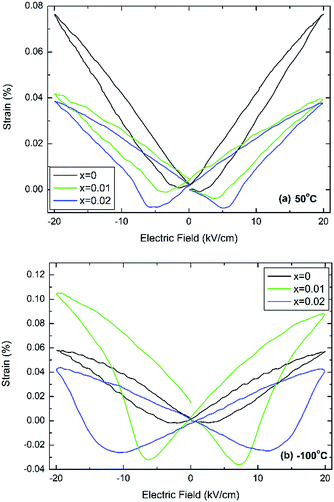 | ||
| Fig. 4 Electric-field induced strain at (a) 50 °C and (b) −100 °C for (1 − x)BaTiO3–xBiYbO3 ceramics. | ||
It is clearly evident that this minor doping mechanism also affects dramatically the electromechanical response. In particular, negative strains associated with domain switching increase with increasing x and decreasing temperatures. Interestingly, at 50 °C the doped compositions exhibit similar field-induced strains, Fig. 4a, but at −100 °C x = 0.01 exhibits a field-induced strain that it is more than the double of the strain shown by 0.02 ceramics, as shown in Fig. 4b. The electric-field associated to the switching of the polarisation parallel to the direction of the electric field increases on cooling, also in agreement with results in Fig. S2b of the ESI,† which appears to increase more dramatically for x = 0.02 ceramics.
In order to rationalise the potential impact of the electronic lone-pair in Bi3+ on the dielectric response, (1 − y)BaTiO3–yLaYbO3 (BLTYb) ceramics with y = 0.01 were prepared. Fig. 5 compares the room-temperature X-ray data for BBTYb ceramics, x = 0 and 0.01, and with those of (1 − y)BaTiO3–yLaYbO3 (BLTYb) ceramics with y = 0.01. The lattice parameters for y = 0.01 were calculated as a = 3.99801(7) Å and b = 4.02584(8) Å leading to a unit cell volume of 64.349(2) Å. The c/a ratio is 1.00696(4), which is smaller than the value calculated for x = 0.01, shown in Table 1.
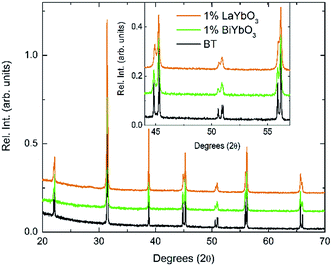 | ||
| Fig. 5 Room-temperature XRD data for (1 − x)BaTiO3–xBiYbO3 and (1 − x)BaTiO3–xLaYbO3 ceramics in the 0 ≤ x ≤ 0.01 range. | ||
Again, they all are isostructural and their average crystal symmetry can be described by the non-centrosymmetric tetragonal P4mm space group. The inset in Fig. 5 shows BLTYb to have a slightly lower degree of tetragonality. Temperature dependence of the relative permittivity of these ceramics is illustrated in Fig. 6. The difference between the dielectric response of the BBTYb (x = 0.01) and BLTYb (y = 0.01) is remarkable. First, TC drops from ∼124 °C for undoped BT to ∼106 °C for BLTYb (y = 0.01), whereas it increases to ∼133 °C for BBTYb (x = 0.01). From XRD data all ceramics appear isostructural, with identical average structure, therefore the dielectric behaviour may be associated to subtleties on the local structure. Similar subtleties were invoked by Liu et al.17,18 to explain the evolution of the dielectric properties in the K0.5Na0.5NbO3–Bi0.5Na0.5TiO3 system. Those authors used both diffraction and Raman spectroscopy to obtain a better picture of the average vs. local structure. Feteira et al.19 have previously used similar approach to investigate some BaTiO3–BiMeO3 systems.
Raman spectroscopy is an excellent investigatory technique to evaluate the impact of doping on the local structure, which ultimately may affect the observed temperature dependence of the dielectric response. Indeed, Raman spectroscopy has a shorter length scale than XRD, thereby it allows the identification of local deformations arising from the difference between the ionic radii of Ba2+ (1.61 Å), Bi3+ (1.45 Å, extrapolated from Shannon), Ti4+ (0.605 Å) and Yb3+ (0.868 Å). Analysis of the temperature dependence of specific spectral features can be employed to elucidate how the local structure evolves with the temperature and consequently how the structural phase transitions are affected. This approach was employed in past studies carried out in single-crystal, ceramic and thin film specimens. Indeed, the temperature dependence of some transverse optical (TO) modes of A1 symmetry has been shown to provide sufficient evidence for either presence or absence of the expected structural phase transitions exhibit by BaTiO3-based crystals, ceramics and thin films. In addition, again the presence or absence of a low frequency overdamped soft mode provides also a good indication for the type of local symmetry, as discussed later.
Unpolarised temperature dependent Raman spectra for BBTYb x = 0, 0.01 and 0.02 and BLTYb y = 0.01 ceramics are shown in Fig. 7a–d. Raman spectra for undoped BaTiO3 ceramics (Fig. 7a) are in broad agreement with the classical work by Perry and Hall20 on single-crystal and with a more recent work by Tenne et al.21 Moreover, at first glance spectra for doped BBTYb ceramics (Fig. 7) exhibit similar features, where three regions assigned to different vibration modes can be immediately distinguishable. At high temperature macroscopically cubic BT possesses four triply degenerate optical vibrations, namely, 3F1u and 1F2u. First-order Raman scattering is symmetry forbidden in paraelectric cubic perovskites, because each ion occupies a center of inversion and all long-wavelength vibrational modes are of odd parity. Nevertheless, non-stoichiometry, inhomogeneous strain distribution, impurities, oxygen vacancies, and dynamic disorder (such as in the paraelectric phase of BT) may break the symmetry and Raman activity can be detected. On cooling, the symmetry of tetragonal BT allows 3(A1 + E) + 1(B1 + E) Raman active optical and 1(A1 + E) acoustic modes.22,23 Further splitting in A1 and E modes to transverse optic (TO) and longitudinal optic (LO) modes occurs due to the long-range electrostatic force associated with lattice ionicity. In the low- to mid-wavenumber region, the Raman spectrum of tetragonal BT is characterised by a broad A1(TO2) mode at ∼260 cm−1 associated with BO6 bending vibrations, an interference dip at ∼180 cm−1 and a mixed mode E(LO2 + TO3) + B1 at ∼311 cm−1, which only appears in presence of long-range polar order. In particular, the mode at 311 cm−1 is related to the cooperative displacement of the central Ti4+ with respect to the rest of the unit cell,23 and the dip at around 180 cm−1 in BaTiO3 is attributed to the anharmonic coupling between the three A1(TO) phonons. Hence, disappearance of the mode at 311 cm−1 and of the interference dip at 180 cm−1 above 150 °C, is consistent with the tetragonal (ferroelectric) to cubic (paraelectric) phase transition. The E(LO2 + TO3) + B1 mode at 311 cm−1 has been shown to persist at temperatures greater than the permittivity maximum in systems with local polar clusters above TC.24
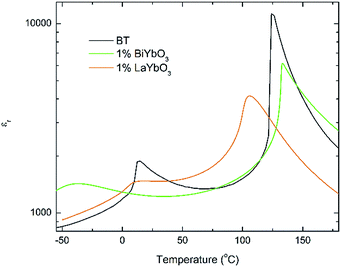 | ||
| Fig. 6 Temperature dependence of the relative permittivity for (1 − x)BaTiO3–xBiYbO3 and (1 − x)BaTiO3–xLaYbO3 ceramics in the 0 ≤ x ≤ 0.01 range. | ||
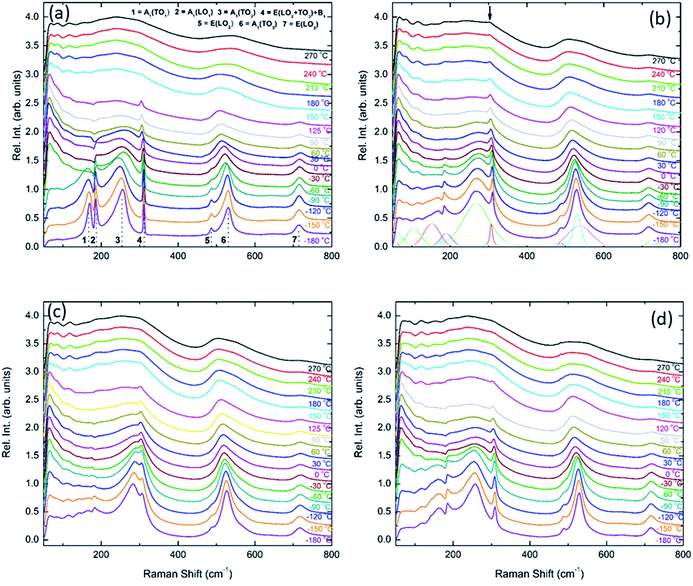 | ||
| Fig. 7 In situ Raman spectroscopy for (a) undoped BaTiO3, (b) 1 mol% doped BiYbO3, (c) 2 mol% doped BiYbO3 and (d) 1 mol% doped LaYbO3. | ||
The aforementioned mode assignment is generally valid only in BT single-crystals. In randomly oriented polycrystalline BT, due to the Raman probe encompassing a finite number of crystallites with various orientations, the directions of the phonon wavevectors are randomly distributed with respect to the crystallographic axes. Consequently, only quasimodes with no true A1, B1 or E symmetry can be measured.25 This is at the basis of the broad spectral signature of polycrystalline BT, and this phenomenon is further complicated in presence of compositional disorder or defects, which cause a relaxation of the Raman selection rules.26 Hence, it was chosen in this work to number consecutively the spectral features rather than providing a precise assignment.
The Raman spectrum of undoped BT at −180 °C, well within the single rhombohedral phase field, presents two sharp modes (1, 2) at 169 cm−1 and 185 cm−1, generally associated with the rhombohedral phase, and a broad mode (3) at 255 cm−1. These were assigned by Tenne et al.21 as A1(TO1), A1(LO1) and A1(TO2), respectively, using single-crystals. The sharp mode (4) at ∼311 cm−1 is the one related to ferroelectricity (i.e. mixed mode E(LO2 + TO3) + B1 in single crystals). In the high-wavenumber region there is a weak mode (5) at 486 cm−1, plus two broad modes (6) and (7) at 530 cm−1 and 714 cm−1, respectively. Mode 6 has been assigned by Tenne et al.21 as A1(TO3). A representative fitting of the investigated spectra is shown at the bottom of Fig. 7b.
Temperature dependent Raman spectra for all compositions are also reported in Fig. 7. The most striking features are the broadening of the FWHM of all modes with increasing temperature, the persistence of mode 4 (at ∼311 cm−1) up to high temperature for 1% BiYbO3 (cf. arrow in Fig. 7b), and the shift of mode 3 (∼255 cm−1) with temperature. The first feature is related to the effect of anharmonic terms in the crystal potential energy, whereas the second one will be discussed later. The temperature dependence of the frequency of mode 3 in undoped BT and doped BBTYb and BLTYb ceramics is compared in Fig. 8.
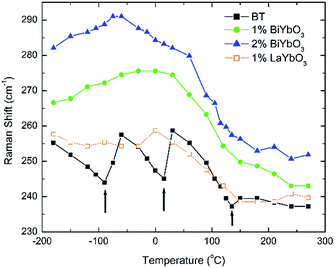 | ||
| Fig. 8 Temperature dependence of the frequency of mode 3 in undoped BT and doped BBTYb and BLTYb ceramics. | ||
With increasing temperature Raman spectra show large changes, the most noticeable being the sudden hardening of the mode 3 at ∼−80 °C and ∼15 °C, respectively. Those changes are well correlated with the dielectric data shown in Fig. 2, and can be used to monitor the rhombohedral-to-orthorhombic and orthorhombic-to-tetragonal structural phase transitions, respectively. At first instance the absence of sudden Raman shifts for the frequency of mode 3 in BBTYb and BLTYb ceramics could suggest the absence of structural phase transitions, however that would be inconsistent with the dielectric data in Fig. 2 and 6, which show clear anomalies. Hence, a strategy to analyse the temperature dependence of the Raman activity in order to extract the maximum information involves monitoring simultaneously the presence of mode 1 (169 cm−1), mode 2 (185 cm−1) and of the overdamped soft mode below 100 cm−1. The simultaneous occurrence of 1 and 2 provides a strong indication for the presence of regions with rhombohedral symmetry,26 whereas identification of tetragonal and orthorhombic symmetries from the spectra is a more delicate procedure, because the overdamped soft mode is detectable in both phases.27 Even in single-crystals the difference between these two phases is not pronounced in unpolarized Raman spectra, as shown by Tenne et al.21 Nevertheless, the overdamped soft mode is not detectable in the rhombohedral phase, as shown in Fig. 7a, in the temperature range −180 °C to −90 °C for undoped BT. Hence, this can be used to ascertain a pure rhombohedral symmetry versus mixed crystal symmetries. Let us now inspect the low temperature Raman spectra for doped materials. For example, at BBTYb (x = 0.01), as shown in Fig. 7b, modes 1 and 2 coexist with a overdamped mode at low frequencies down to temperatures as low as −180 °C. This suggests the coexistence of rhombohedral and possibly orthorhombic symmetries at low temperatures. In the case of the La-doped counterpart, BLTYb (y = 0.01), as shown in Fig. 7d, a similar coexistence is observed only down to −90 °C. In BBTYb (x = 0.02), Fig. 7c, modes 1, 2, and overdamped soft mode also coexist down to −180 °C. It is worth mentioning that overdamping is observed also in the orthorhombic and tetragonal phases and it increases with temperature, in agreement with earlier reported results.21 Finally, the evolution of the mode 4 at ∼311 cm−1 also provides an interesting insight into the polarisation at high temperatures. For undoped BT, this mode disappears in correspondence of TC, whereas in BBTYb (x = 0.01) it persists to temperatures as high as 270 °C, as indicated by the arrow in Fig. 7b. This indicates the persistence of polar clusters with Ti off-centering up to this temperature. With increasing x, this mode disappears again nearby TC, as shown in Fig. 7c. Basically, this mode shows similar behaviour in BT, BBTYb (x = 0.02), and BLTYb (y = 0.01), Fig. 7a, c, d, respectively.
Discussion
Room-temperature X-ray diffraction analysis showed all (1 − x)BaTiO3–xBiYbO3 (BBTYb) (0 ≤ x ≤ 0.02) and (1 − y)BaTiO3–yLaYbO3 (BLTYb) (0 ≤ y ≤ 0.01) ceramics to be isostructural, and their average crystal symmetry to be described by the non-centrosymmetric tetragonal P4mm space group, as shown in Fig. 1 and 3. Moreover, as expected the incorporation of Yb3+ in the B-site of the BT lattice results in the increase of the lattice cell volume due to its larger ionic radii in comparison with Ti4+, as shown in Table 1. Reduction of the degree of tetragonality is also observed in both systems, in particular to a larger extent in the 1 mol% LaYbO3 doped ceramics in comparison with their BiYbO3 counterparts, as shown in Fig. 3. Nevertheless, the compositional dependence of the structural phase transitions for those two systems is profoundly dissimilar, as shown in Fig. 2 and 6. The impact of substitutional doping in both crystal structure and dielectric properties of BaTiO3 has been investigated for more than seventy years. It is often observed that doping affects the temperatures at which the structural phase transitions occur. In most cases, there is a threshold doping level at which the coalescence of those phase transitions also occurs. In the (1 − x)BaTiO3–xBiYbO3 that was reported to occur at x ∼0.05.Let us initially focus on the variation of the Curie temperature, which drops from ∼124 °C for undoped BT to ∼106 °C for 1 mol% LaYbO3, but increases to ∼133 °C for 1 mol% BiYbO3, as shown in Fig. 6 and 2, respectively. Generally, the impact of chemical doping on TC is rationalized in terms of simple ion-size effects and/or changes in the tolerance factor, t, arguments. For instance, partial replacement of Ba2+ (1.61 Å) by the smaller Sr2+ reduces the tolerance factor, and TC decreases, as the cubic polymorph is stabilized at lower temperature. Nevertheless, exceptions to this empirical rule exist, due to subtleties of the local structure. For example, in the case of Ba2+ replacement by Ca2+, TC initially rises up to 138 °C due to A-cation size variance associated with the substantial size mismatch in the ionic radius of the Ba2+ and Ca2+ on the A-site, which induces strain in the lattice. Upon further doping TC decreases because absolute size effects dominate over size variance. Levin et al.28 showed both ferroelectric Ca displacements and their amplification of the Ti off-centring to mitigate the lattice-volume effects. Interestingly, in Ca-doped BT with oxygen vacancies for charge compensation, p-type semiconductivity was attributed to the generation of O− ions.29
Another exception is the replacement of Ba2+ by Pb2+, however in this case the increase in TC is ascribed to stereological effects associated with the presence of a lone-pair of electrons in Pb2+ (6s26p0), which leads to the off-centering of Pb2+. This can also be empirically explained by a simple mixing rule. Basically, a linear variation of TC can be expected between the Curie temperatures for PbTiO3 (TC ∼ 490 °C) and BaTiO3 (TC ∼ 130 °C) due to the co-solubility of those two ferroelectric perovskites. Similarly, an increase of TC for BaTiO3 can be brought by Bi3+, which also exhibits a lone-pair of electrons in Bi3+ (6s26p0). Lattice modifications induced by Bi3+ are expected to impact also the shape of the octahedral cage.30 These lone-pair effects on the distortion of the BaTiO3 lattice were already evidenced by Deluca et al.11 in the (1 − x)BaTiO3–xBi0.5Na0.5TiO3 system: using Raman spectroscopy they proved the correspondence between these structural changes and the increase of TC with increasing x. Similarly, Liu et al. suggested that lone-pair effects underpin the evolution of the dielectric properties in the K0.5Na0.5NbO3–Bi0.5Na0.5TiO3 system. Moreover, above some Bi0.5Na0.5TiO3 content, Bi3+ will impose octahedral tilting. In the present case, the Bi3+ content is in principle rather low to impose any noticeable tilting of octahedra.
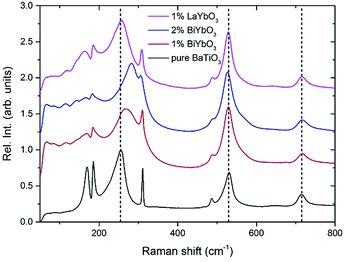
Several past investigations showed that La3+ doping of BaTiO3 according to a Ba1−xLaxTi1−x/4O3 mechanism with the creation of B-site vacancies reduces TC by 24 °C/at%.31 Hence, one can anticipate that the simultaneous incorporation of La3+ and Yb3+ into BaTiO3 would lead to a reduction of TC, as shown in Fig. 6 and also in ref. 14, for higher doping levels. Basically, the TC drops due to a combination of an ion size effect brought by the partial replacement of Ba2+ with the smaller La3+ and a disruption of the correlated Ti4+displacements because of Yb3+ incorporation in the B-site. Plausibly, this latest mechanism should also be operating in the (1 − x)BaTiO3–xBiYbO3 system, therefore the slight increase of TC at low x levels, as shown in Fig. 2, needs to arise from the lone-pair effect caused by Bi3+. The different behaviour between La+3 and Bi3+ can be evidenced by plotting the Raman spectra of pure and substituted BT in function of composition.
Fig. 9 reports the Raman spectra of BT, BBTYb (x = 0.01, 0.02) and BLTYb (x = 0.01) at T = −180 °C. As could clearly be seen, mode 3 (at 255 cm−1) shifts considerably with increasing x for the BBTYb compositions, whereas it experiences only a slight shift in BLTYb. This mode is associated to the vibration of the O–Ti–O bond along the polar axis of the unit cell,11 hence a shift of this mode is associated with changes in bond length. These can be caused either by the presence of a dopant ion with different mass/size substituting on Ti sites, or by structural distortions in the BaTiO3 unit cell. Considering that the composition with 1% LaYbO3 displays a negligible shift of mode 3 compared to the one with 1% BiYbO3, it seems unlikely that these spectral changes in the BiYbO3 compositions are related to Yb3+ substitution. Rather, they are associated with the presence of the Bi3+ at the A-site, whose lone-pair of electrons promotes Bi off-centring and hybridization with oxygen, thereby distorting the O–Ti–O bond.32 The strain induced by Bi3+ addition could be also at the basis of the persistence of the mode 4 (at ∼311 cm−1) well above the Curie temperature, as determined from the permittivity measurements (cf.Fig. 7b and 2). The strain induced by Bi–O bond hybridization could in fact locally stabilize Ti off-centring up to higher temperatures, without the material being macroscopically ferroelectric. This effect is present only for 1% BiYbO3; for x = 0.02 the higher Yb content, which disrupts Ti off-centring, likely prevents persisting polar clusters at high temperatures.
A further indication of this effect is provided by the shift of mode 3 with increasing x in BBTYb. This shift entails an increase of the force constants due the covalent nature of the Bi–O bond.32 Since the mode is known to soften with increasing hydrostatic pressure, the measured mode hardening with the incorporation of Bi3+ suggests the occurrence of local tensile bond strain. This strain engendered by Bi3+ raises TC, however only at very low doping contents (below 0.02) (when for example compared with Ca (up to 0.08)), because this mechanism is mitigated by the disruption to the Ti-correlated displacements, brought in by Yb3+ B-site occupancy.
This can be seen also from the broadening of mode 3 (cf.Fig. 9) evident at low (1%) BiYbO3 content, which is likely related to strain-induced disorder effects at the perovskite A- and B-sites. The decreased FWHM of mode 3 (at ∼255 cm−1) for Bi contents >1% suggests that increased Yb3+ addition reduces the disorder due to strain at the B-site. The broadening of mode 1 (∼169 cm−1), on the other hand, occurs also for La-doped systems and thus is related only to substitutional disorder (i.e. not to strain).
In summary, the lattice disturbance caused by this doping mechanism affects the balance between long-range dipolar coulombic forces and short-range repulsion forces and leads to a larger stability of the tetragonal symmetry (lower polarisability) over both the orthorhombic and rhombohedral (higher polarisability). This is corroborated by the wider temperature range where the tetragonal phase is stable, as illustrated in Fig. 2 for the permittivity behaviour. Here, one should note that the polarization is sustained to a larger temperature because of the influence of Bi3+ on the Ti off-centring along the c-axis, as suggested by the Raman shift of mode 3 (cf.Fig. 7 and 8). These results contradict the current perception, which attributes all of the effect on TC to ferroelectric Bi3+ displacements. This is strictly valid only in systems that are substituted with Bi3+ only on the A-site.11 As soon as a large cation like Yb3+ is also substituted on the B-site, even a low substituent amount is sufficient to disrupt Ti off-centering and destabilize the local polar regions induced by Bi3+, with the consequence that TC shifts again to lower temperatures.
It is also known that doping not only affects the Curie temperature, but also the temperatures at which the two other structural phase transitions occur. Hence, let us now consider how these minor doping contents (BBTYB 0.01 and BLTYb 0.01) affect the temperatures of the rhombohedral-to-orthorhombic (Tr–o) and orthorhombic-to-tetragonal (To–t) phase transitions. The To–t exhibits a small shift towards lower temperature, from ∼12 °C for undoped BT to ∼10 °C for 1 mol% LaYbO3, but a massive drop to ∼−37 °C for 1 mol% BiYbO3, as suggested at first glance from the dielectric anomalies shown in Fig. 6. Raman data in Fig. 7 and 8 provide a significant insight into the local crystal symmetries over the temperature range encompassing the sub-ambient structural phase transitions. First, the coexistence of modes 1 and 2 with an overdamped mode at low frequencies, as shown in Fig. 7b–d suggests the coexistence of rhombohedral and possibly orthorhombic symmetries over wider temperatures. Second, softening of the O–Ti–O mode (3) with increasing temperature can be expected from the lattice thermal expansion, which implies a lowering of the force constants. This softening is interrupted at the phase transitions for undoped BT, as indicated by the arrows in Fig. 8. It is worth to note, that it is known that at these phase transitions there is a change of the volume of the unit cell. For all doped compositions the dramatic frequency jump of mode 3 vanishes, despite still noticeable anomalies in the relative permittivity, as shown in Fig. 2 and 6. Interestingly, the diffuse character of those anomalies may arise from internal strains, which origin has already been discussed above. In addition, these strains are also responsible for the coexistence of different local symmetries over wide temperature ranges. Coexistence of the tetragonal and orthorhombic phases is long known in BaTiO3.11,33,34 Indeed, in all our compositions (including BLTYb) a peak at ∼190 cm−1 is visible in the tetragonal phase, which has previously been assigned to coexistence with the orthorhombic polymorph.33 In summary, Bi3+ causes local distortions, which lead to the coexistence of crystal symmetries over wide temperature ranges, and for that reason the dielectric anomalies are diffuse in contrast with those observed in undoped BT.
Finally, based on the above analysis we propose an enhanced model for the thermal stability of the permittivity in core–shell type BaTiO3 ceramics employed in the manufacturing of MLCCs. It is widely accepted that, in core–shell grains, dopants are present in the shell region, which also shows a compositional gradient, whereas the core region is virtually ferroelectric BT.35 The dielectric measurements in Fig. 2 showed how the dependence of the permittivity at low temperatures can be affected by minor amounts of dopants, whereas the Curie temperature remained virtually unaffected. Hence, an imposed compositional gradient from 0 to 2 mol% in the shell region will create a region with relatively stable permittivity in the low temperature regime. Nevertheless, this region has lower capacitance in comparison with the core region consisting of nearly undoped BT. This lower capacitance will cap the maximum permittivity at the Curie temperature for the core region, as those regions can be regarded as two capacitors in series. For details on how an equivalent circuit for a core–shell type microstructure can be evaluated by AC impedance the reader is referred to the classical paper by West et al.36 and also the recent work by Heath et al.37
Conclusions
A complex set of doping mechanisms operate in (1 − x)BaTiO3–xBiYbO3 system for low levels of x. The simultaneous incorporation of Bi3+ and Yb3+ into ferroelectric BaTiO3 results in the suppression of the low temperature dielectric anomalies. Moreover, Raman spectroscopy analysis provided evidence for a strain mechanism which promotes the coexistence of different crystal symmetries at local level in order to accommodate the local distortions brought in by the presence of a lone-pair of electron in Bi3+. This mechanism may be exploited to tune the permittivity in core–shell BT structures and is precursor of the ferroelectric-to-relaxor crossover observed at higher doping concentrations.Conflicts of interest
There are no conflicts to declare.Acknowledgements
The authors would like to acknowledge the financial support for this project provided by the Christian Doppler Association in partnership with TDK EPC, a company of the TDK Corporation. M. D. gratefully acknowledges support from the Austrian Science Fund (FWF): Project P29563-N36.References
- V. Krayzman, I. Levin, J. Woicik and F. Bridges, Appl. Phys. Lett., 2015, 107, 192903 CrossRef.
- G. Schileo, L. Luisman, A. Feteira, M. Deluca and K. Reichmann, J. Eur. Ceram. Soc., 2013, 33, 1457–1468 CrossRef CAS.
- T. Strathdee, L. Luisman, A. Feteira and K. Reichmann, J. Am. Ceram. Soc., 2011, 94, 2292–2295 CrossRef CAS.
- G. Schileo, A. Feteira, K. Reichmann, M. Li and D. Sinclair, J. Eur. Ceram. Soc., 2015, 35, 2479–2488 CrossRef CAS.
- Z. B. Shen, X. H. Wang, B. C. Luo and L. T. Li, J. Mater. Chem. A, 2015, 3, 18146–18153 CAS.
- R. Muhammad, Y. Iqbal and I. M. Reaney, J. Am. Ceram. Soc., 2016, 99, 2089–2095 CrossRef CAS.
- M. A. Beuerlein, N. Kumar, T. M. Usher, H. J. Brown-Shaklee, N. Raengthon, I. M. Reaney, D. P. Cann, J. L. Jones and G. L. Brennecka, J. Am. Ceram. Soc., 2016, 99, 2849–2870 CrossRef CAS.
- N. Raengthon, T. Sebastian, D. Cumming, I. Reaney and D. Cann, J. Am. Ceram. Soc., 2012, 95, 3554–3561 CrossRef CAS.
- S. S. N. Bharadwaja, S. Trolier-McKinstry, L. E. Cross and C. A. Randall, Appl. Phys. Lett., 2012, 100, 112912 CrossRef.
- J. Pokorny, U. Pasha, L. Ben, O. Thakur, D. Sinclair and I. Reaney, J. Appl. Phys., 2011, 109, 123512 CrossRef.
- M. Deluca, G. Picht, M. Hoffmann, A. Rechtenbach, J. Topfer, F. Schader and K. Webber, J. Appl. Phys., 2015, 117, 134110 CrossRef.
- C. L. Freeman, J. A. Dawson, H. R. Chen, L. Ben, J. H. Harding, F. D. Morrison, D. C. Sinclair and A. R. West, Adv. Funct. Mater., 2013, 23, 3925–3928 CrossRef CAS.
- Y. Liu and A. R. West, J. Am. Ceram. Soc., 2013, 96, 1512–1520 CrossRef CAS.
- A. Feteira and D. Sinclair, J. Mater. Chem., 2009, 19, 356–359 RSC.
- J. Rodriguez-Carvajal, Physica B, 1993, 192, 55–69 CrossRef CAS.
- R. H. Buttner and E. N. Maslen, Acta Crystallogr. Sect. B Struct. Sci., 1992, 48, 764–769 CrossRef.
- L. J. Liu, M. Knapp, H. Ehrenberg, L. Fang, H. Q. Fan, L. A. Schmitt, H. Fuess, M. Hoelzel, H. Dammak, M. P. Thi and M. Hinterstein, J. Eur. Ceram. Soc., 2017, 37, 1387–1399 CrossRef CAS.
- L. J. Liu, M. Knapp, H. Ehrenberg, L. Fang, L. A. Schmitt, H. Fuess, M. Hoelzel and M. Hinterstein, J. Appl. Crystallogr., 2016, 49, 574–584 CAS.
- A. Feteira, D. C. Sinclair and J. Kreisel, J. Am. Ceram. Soc., 2010, 93, 4174–4181 CrossRef CAS.
- C. H. Perry and D. B. Hall, Phys. Rev. Lett., 1965, 15, 700–702 CrossRef CAS.
- D. A. Tenne, X. X. Xi, Y. L. Li, L. Q. Chen, A. Soukiassian, M. H. Zhu, A. R. James, J. Lettieri, D. G. Schlom, W. Tian and X. Q. Pan, Phys. Rev. B, 2004, 69, 174101 CrossRef.
- D. Rousseau, R. Bauman and S. Porto, J. Raman Spectrosc., 1981, 10, 253–290 CrossRef CAS.
- J. D. Freire and R. S. Katiyar, Phys. Rev. B, 1988, 37, 2074–2085 CrossRef CAS.
- U. M. Pasha, H. Zheng, O. P. Thakur, A. Feteira, K. R. Whittle, D. C. Sinclair and I. M. Reaney, Appl. Phys. Lett., 2007, 91, 062908 CrossRef.
- M. S. Jang, M. Takashige, S. Kojima and T. Nakamura, J. Phys. Soc. Jpn., 1983, 52, 1025–1033 CrossRef CAS.
- V. Buscaglia, S. Tripathi, V. Petkov, M. Dapiaggi, M. Deluca, A. Gajovic and Y. Ren, J. Phys. Condens. Matter, 2014, 26, 123512 CrossRef PubMed.
- K. Laabidi, M. D. Fontana and B. Jannot, Solid State Commun., 1990, 76, 765–768 CrossRef CAS.
- I. Levin, V. Krayzman and J. Woicik, Appl. Phys. Lett., 2013, 102, 162906 CrossRef.
- P. R. Ren, N. Maso and A. R. West, Phys. Chem. Chem. Phys., 2013, 15, 20943–20950 RSC.
- P. S. Halasyamani, Chem. Mater., 2004, 16, 3586–3592 CrossRef CAS.
- F. D. Morrison, D. C. Sinclair, J. M. S. Skakle and A. R. West, J. Am. Ceram. Soc., 1998, 81, 1957–1960 CrossRef CAS.
- D. Schutz, M. Deluca, W. Krauss, A. Feteira, T. Jackson and K. Reichmann, Adv. Funct. Mater., 2012, 22, 2285–2294 CrossRef.
- M. H. Frey and D. A. Payne, Phys. Rev. B, 1996, 54, 3158–3168 CrossRef CAS.
- M. Deluca, L. Stoleriu, L. P. Curecheriu, N. Horchidan, A. C. Ianculescu, C. Galassi and L. Mitoseriu, J. Appl. Phys., 2012, 111, 084102 CrossRef.
- J. S. Dean, P. Y. Foeller, I. M. Reaney and D. C. Sinclair, J. Mater. Chem. A, 2016, 4, 6896–6901 CAS.
- A. R. West, D. C. Sinclair and N. Hirose, J. Electroceram., 1997, 1, 65–71 CrossRef CAS.
- J. P. Heath, J. S. Dean, J. H. Harding and D. C. Sinclair, J. Am. Ceram. Soc., 2015, 98, 1925–1931 CrossRef CAS.
Footnote |
| † Electronic supplementary information (ESI) available: Refined coordinates, temperature factors (Uiso) and bond lengths, SEM, P–E and S–E measurements. See DOI: 10.1039/c7ta11096k |
| This journal is © The Royal Society of Chemistry 2018 |

