 Open Access Article
Reversible on–off switching of both spin crossover and single-molecule magnet behaviours via a crystal-to-crystal transformation†
Dong
Shao
 a,
Le
Shi
 a,
Lei
Yin
b,
Bao-Lin
Wang
c,
Zhen-Xing
Wang
 *b,
Yi-Quan
Zhang
 *c and
Xin-Yi
Wang
 *a
*a
aState Key Laboratory of Coordination Chemistry, Collaborative Innovation Center of Advanced Microstructures, School of Chemistry and Chemical Engineering, Nanjing University, Nanjing, 210023, China. E-mail: wangxy66@nju.edu.cn
bWuhan National High Magnetic Field Centre, Huazhong University of Science and Technology, Wuhan, 430074, China
cJiangsu Key Laboratory for NSLSCS, School of Physical Science and Technology, Nanjing Normal University, Nanjing, 210023, China
First published on 27th August 2018
Abstract
The on–off switching of spin-crossover (SCO) and single-molecule magnetism (SMM) remains highly attractive, especially if it involves dynamic crystal-to-crystal transformation. Herein we report the first molecule, a mononuclear cobalt(II) complex, that exhibits on–off switching between SCO and SMM reversibly during crystal-to-crystal transformation. Subtle structural transformation triggered by a simple dehydration–rehydration process induces significant geometrical changes of the CoII center and modification of the supramolecular interactions and switches its colour and magnetic properties (dark red/SCO-on/SMM-off ↔ orange/SCO-off/SMM-on). This work suggests that modification of the weak supramolecular interactions could be very effective in achieving switchable materials involving both SCO and SMM properties.
Introduction
Dynamic molecular materials with tunable physical properties have attracted great attention because of their potential applications as switches and sensors.1 One of the most appealing strategies for these materials is the modification of the coordination environment of the metal center through reversible solid-state transformation, especially in a single-crystal-to-single-crystal (SC–SC) fashion.2–17 Notably, a solid-state transformation could be due to a structural phase transition, which usually causes a macroscopic change in the lattice symmetry but not in the chemical composition.18 On the other hand, it can also occur during a solid state chemical reaction, where the chemical composition of the material is changed, with or without the change of the lattice symmetry.19 In molecular magnetic materials, such a transformation can lead to the tuning of a variety of magnetic properties, such as magnetic ordering,2–5 spin crossover (SCO),6–10 and single-molecule magnetism (SMM).11–17 Interestingly, both SCO and SMM materials have been intensively pursued as magnetically bistable materials. In principle, the magnetic bistability of the SCO complex is related to the ligand field strength of the metal center, while that of the SMM complex mainly depends on the magnetic anisotropy. As the ligand field strength of the metal center is very sensitive to external stimuli, dynamic spin state switching in SCO materials has been vigorously investigated, leading to a myriad of SCO complexes showing various tunable properties. Among them, only a few examples occurred in the SC–SC fashion.7,8 In contrast, since it is very difficult to dynamically tune the magnetic anisotropy of the metal center, few dynamic SMM materials with switchable properties, especially complete on–off switching, have been documented.11,12,17As the saying “you can't have your cake and eat it” states, SMM and SCO properties are usually inimical to each other. For SMM materials, highly anisotropic spin quantum numbers are of paramount importance, which are unfortunately not favoured for SCO complexes because they normally show an isotropic low spin state (S = 0 or 1/2) at low temperatures. Therefore, despite the vast number of SCO and SMM materials reported to date,20–22 compounds exhibiting both bistabilities are very limited.23–29 To achieve the high spin (HS) state preferred for SMM materials, light irradiation to the metastable HS state and partial SCO with HS fractions trapped at low temperature are two successful strategies, leading to several interesting photo-switchable SMM materials.23–26 Nevertheless, reversible on–off switching of both SCO and SMM in one single crystal triggered by a SC–SC transformation remains unknown.
Undoubtedly, the overwhelming majority of SCO systems are based on octahedral FeII/III complexes,20 while CoII compounds are the most studied mononuclear SMM materials including various coordination numbers (2–8) and molecular symmetries.21 To explore the potential of CoII complexes for both SCO and SMM bistabilities, Murugesu and co-workers studied the influence of ligand field on SCO and SMM behaviours in three mononuclear CoII complexes based on terpyridine (terpy) ligands by controlling the coordination environment of CoII ions, where the SMM behaviour could be observed in the five-coordinate CoII-terpy complex while the SCO behaviour was observed in the six-coordinate complex.30 Another example reported by Hayami and co-workers on [Co(C16-terpy)2]2+ showed an unexpected reverse spin transition triggered by a structural phase transition.31 However, the possible SMM behaviour based on the reverse HS state was not studied. Importantly, these results revealed that the magnetism of CoII ions is highly sensitive to minor variations of the coordination environment and reflect the possibility to realize simultaneous tuning of SCO and SMM behaviours through structural perturbation.
Herein, we demonstrate an unprecedented on–off switching of both SCO and SMM behaviors triggered by a reversible SC–SC transformation during dehydration–rehydration of a CoII complex, [CoII(L)2](DPAS)2·DMF·2H2O (1), and its dehydrated form [CoII(L)2](DPAS)2·DMF (2, L = 4′-(4-bromophenyl)-2,2′:6′,2′′-terpyridine and DPAS− = 4-(phenylamino)benzenesulfonate). Detailed structural analyses revealed that the SC–SC transformation alters the local geometry of the Co2+ center and the supramolecular interactions, which in turn leads to a reversible switching of the SCO behavior. Furthermore, the change of the spin states at low temperature results in the switching of the magnetic anisotropy and also the SMM behavior.
Results and discussion
Dark red crystals of 1 were prepared by slow evaporation of the DMF/H2O solution containing the ligand L, NaDPAS, and Co(ClO4)2·6H2O (see the details in experimental methods, ESI†). Thermogravimetric analysis (TGA) of 1 (Fig. S1, ESI†) revealed two desolvation processes: ca. 3.0% weight loss in the 20–80 °C range and ca. 5.0% weight loss in the 250–290 °C range, corresponding to the removal of two H2O molecules (calc. 2.5%) and one DMF molecule (calc. 5.1%). Guided by this TGA result, orange crystals of 2 can be prepared by heating 1 at 130–180 °C. The color change can be monitored by using the variable-temperature single-crystal UV-Vis spectra (Fig. S2, ESI†). Interestingly, this dehydration process occurred in a SC–SC fashion when the dark red crystals of 1 were heated at 180 °C under a dry nitrogen gas flow on the X-ray diffractometer. Upon exposure to air for one day, the orange crystals of 2 return to 1. This reversible dehydration/rehydration process is fully supported by TGA, elemental analyses, powder X-ray diffraction and magnetic studies of 1, 2 and the rehydrated sample 1-re (Fig. S3 and Table S1, ESI†). Attempts to further remove the DMF molecules in a SC–SC fashion were not successful.Single crystal X-ray diffraction analyses were performed on 1 at 100, 150 and 300 K and on the in situ generated single crystal of 2 at 450, 300 and 150 K (see the details in the ESI†). Both compounds crystallized in the triclinic space group P1 at all temperatures measured (Tables S1–S3, ESI†). Their structures are very similar to each other, except for the two H2O molecules in 1. The asymmetric units of both 1 and 2 contain one Co, two unique L ligands (denoted as LA and LB), two DPAS− anions and a lattice DMF molecule (Fig. 1). The CoII center is coordinated to six nitrogen atoms from two tridentate ligands LA and LB in a bis-meridional fashion, resulting in a distorted octahedron. The continuous shape measure (CShM)32 values for different symmetries were calculated using SHAPE 2.0 and are listed in Table S4.† For an ideal octahedron, the CShM value is 0, while more deviation from zero means more distortion. As we can see, the CShM values relative to an ideal octahedron are 3.594 (100 K), 3.632 (150 K) and 4.365 (300 K) for 1, while they are 4.693, 4.653 and 4.667 for 2 at 150, 300, and 400 K, respectively, suggesting a severely distorted Oh symmetry for both Co2+ ions in 1 and 2. The average Co–N bond length decreases smoothly from 2.117 (300 K) to 2.078 (150 K) and to 2.074 Å (100 K) for 1, while it remains almost the same for 2 with 2.118, 2.116 and 2.117 Å at 450, 300 and 150 K, respectively. These bond lengths are in accordance with the reported values for structurally similar CoII-terpy based SCO complexes30,31,33–36 and clearly indicate that 1 undergoes a spin-crossover from 300 to 100 K, while 2 stays in the HS state between 150 and 450 K.
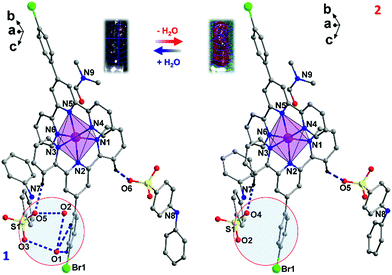 | ||
| Fig. 1 Asymmetric units of 1 and 2. Hydrogen atoms have been omitted for clarity. The purple dashed lines represent H-bonds. The two water molecules in the circle were removed through dehydration. | ||
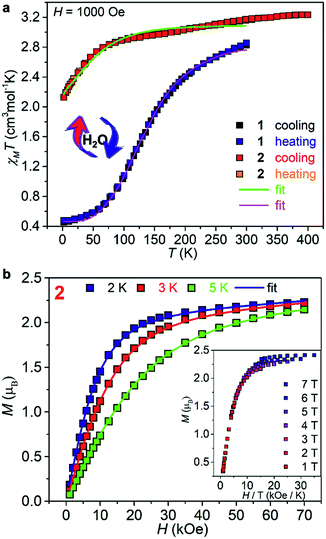
Variable temperature magnetic susceptibilities of 1 and 2, measured using both heating and cooling modes (Fig. 2a), confirmed the different suspected behaviors. At 300 K, a χMT of 2.83 cm3 mol−1 K for 1 indicates the HS state for a CoII center of S = 3/2 with orbital contribution. Upon cooling, the χMT decreases smoothly down to 0.45 cm3 mol−1 K at 2 K, which is consistent with the reported values for a LS CoII center with S = 1/2 and indicates a complete SCO from S = 3/2 to 1/2.35 The SCO temperature is estimated to be T1/2 = 125 K. Upon heating, the χMT curve follows the cooling curve exactly in the temperature range of 2–300 K, suggesting no hysteretic effect, as observed in most CoII SCO materials.35 Furthermore, the thermodynamic χMT curve below 300 K can be simulated by the expression (ln[(1 − nHS)/nHS]) = [ΔH + Γ(1 − 2nHS)]/RT − ΔS/R obtained from a regular solution model,37 giving ΔH = 3.12 kJ mol−1, ΔS = 21.56 J K−1 mol−1, and Γ = 1.86 kJ mol−1. These results are reasonable compared with other reported CoII-terpy-based SCO complexes.38 The relatively small Γ value indicates a small cooperativity associated with the spin crossover. The sample was then kept at 400 K within a SQUID under a flow of He for two hours to obtain 2, whose magnetic susceptibilities were measured in the further cooling and warming processes. A dramatic magnetic change occurred after dehydration. The χMT decreases from 3.18 cm3 mol−1 K at 400 K to 1.96 cm3 mol−1 K at 2 K, which is typical for a mononuclear CoII complex with a HS anisotropic spin center of S = 3/2, and retains its moment at all temperatures.39,40 The final sharp decrease in the χMT curve at low temperature should be mainly due to the intrinsic magnetic anisotropy of the CoII ions.39
To characterize its magnetic anisotropy, field dependent magnetization M(H) of 2 at 2, 3, and 5 K was measured (Fig. 2b). The M values increase continuously and reach 2.29, 2.28, and 2.22 μB at 70 kOe. An effective spin Hamiltonian H = D[Sz2 − S(S + 1)/3] + E(Sx2 − Sy2) + μBBgS (D and E are the axial and rhombic zero-field splitting parameters) was employed to fit the χMT(T) and M(H) curves simultaneously using the PHI program.41 The best fit gave D = −75.1(8) cm−1, E = 0.35(1) cm−1, gx,y = 2.35(2), and gz = 2.68(6). The reduced magnetization curves were also measured (Fig. 2b, inset). The resulting isofield curves exhibit significant separation, indicative of a strong magnetic anisotropy of the CoII centers.
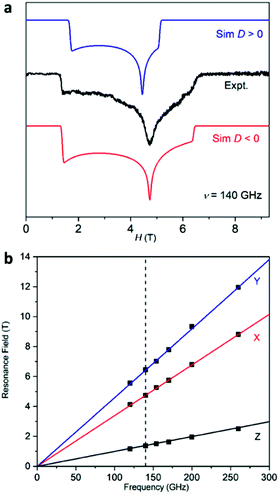
Furthermore, high-frequency and high-field electron paramagnetic resonance (HF-EPR) experiments were performed on 1 and 2 at 2 K. Absorption EPR signals were obtained because of the transmission mode employed in the HF-EPR spectrometer. The spectrum of 1 shows typical S = 1/2 signals as expected for a LS state of 1 at 2 K (Fig. S6, ESI†). Simulations of the data with an S = 1/2 spin Hamiltonian afford gx = 2.22(2), gy = 2.16 (2), and gz = 2.04(5) for 1. As for 2, the experimental spectra of the powder sample were simulated using an S = 3/2 spin Hamiltonian with both positive and negative D values (Fig. 3a). The simulation42 using a negative D value (red line) matches the experimental data better than that using a positive value (blue line) considering the peak positions and shapes, confirming the uniaxial magnetic anisotropy of 2.43 It should be noted that as the magnitude of the D value (−75.1 cm−1 from the SQUID measurement) is out of the frequency range in our measurements (260 GHz, ∼ 9 cm−1), no transitions between the Kramers doublets Ms = ±1/2 and Ms = ±3/2 were observed. The HF-EPR spectra were simulated with the D value estimated from SQUID measurements. In addition, a least-square fit to the entire array of HF-EPR resonances extracted at various microwave frequencies gives the best-fit parameters of gx = 2.25(2), gy = 2.25(2), gz = 2.59(5), D = −75.1(8) cm−1 and E = 23.32(3) cm−1 (Fig. 3b). Of course, we want to point out that as the simulation of the HF-EPR spectra is only an estimation, the obtained g and E values are different from what we have obtained from the SQUID measurements. Anyway, these results clearly reflect the easy-axis anisotropy of 2, which is also suggested by the theoretical calculations (vide post).
To gain further insights into their electronic properties, CASPT2 calculations were performed on the basis of X-ray determined geometries of 1 and 2 (see the details in the ESI†). The calculated energy levels of the ground and first excited doublets on both the HS states of 1 and 2 indicate a strong mixing of the two lowest spin quartets (Table S5, ESI†). Although the energy difference between the lowest two spin-free states (Table S5, ESI†) for each of complexes 1 and 2 is larger than that between the lowest two spin–orbit states (Table S6, ESI†), the spin–orbit ground states are all composed of the lowest two spin-free states not only from the ground one (Table S6, ESI†). Thus, we cannot use the zero-field splitting parameters D and E to depict their magnetic anisotropies. The g tensors of the ground and first excited doublets of the CoII of 1 and 2 were calculated (Table S7, ESI†). The results reveal a high anisotropy with gz ≫ gy > gx in all structures, supporting an easy-axis magnetic anisotropy. Notably, considering that the ground spin–orbit state is not only from the ground spin-free state (Table S6, ESI†), the g tensors calculated using CASPT2 were obtained with respect to the effective spin of CoII being considered as 1/2.43,44 However, the g tensors and also the zero-field splitting parameters D and E using HFEPR were obtained by considering the spin of CoII as 3/2. We noticed that the calculated orientations of gx, gy, and gz on CoII of 2 at 150, 300, and 450 K almost coincide with each other (Fig. S7, ESI†), agreeing well with its HS state in the whole temperature range.
Dynamic magnetic properties of 1 and 2 were also investigated. As for 1, no out-of-phase ac signals (χ′′) were observed under a zero or 1 kOe bias dc field (Fig. S8, ESI†), consistent with its LS state at low temperatures. For 2 on the other hand, although no χ′′ signals were observed under a zero dc field, strong ac signals appeared under static dc fields, revealing its slow magnetic relaxation behaviour (Fig. S9, ESI†). The optimum dc field (1 kOe) to slow down the magnetic relaxation was deduced from the ac measurements under different dc fields (Fig. S9 and S10, inset of Fig. 4b, and Table S8, ESI†). Detailed frequency- and temperature-dependent ac susceptibility data of 2 were then collected under Hdc = 1 kOe (Fig. 4a and S11, ESI†). From these data, semicircle Cole–Cole plots (Fig. S12, ESI†) were obtained and fitted to give the values and distribution of the relaxation time (τ and α, Table S9, ESI†).45 The α values are from 0 to 0.13, suggesting a narrow distribution of relaxation times. From the fit of the high temperature data in the Arrhenius plot (ln(τ) vs. T−1, Fig. 4b) with the Arrhenius law τ = τ0![[thin space (1/6-em)]](https://www.rsc.org/images/entities/char_2009.gif) exp(Ueff/kBT), the effective energy barrier was estimated to be Ueff = 34.1 K (23.6 cm−1) with τ0 = 2.1 × 10⁻⁷ s. The obtained Ueff is far too small compared with the energy gap estimated from the |2D| value (150 cm−1) and also the calculated energy gap between the ground and excited doublets (Table S7†), suggesting that the Orbach relaxation pathway is unlikely for 2. In addition, the slight curvature at low temperature in the Arrhenius plot indicates the existence of multiple relaxation pathways. Detailed analyses support that Raman and direct relaxation mechanisms should dominate in the magnetic relaxation in 2 (see the details in the ESI†). Notably, magnetic measurements on the rehydration sample of 1 and its dehydrated sample confirmed again the reversibility of the dehydration/rehydration process (Fig. S13, ESI†).
exp(Ueff/kBT), the effective energy barrier was estimated to be Ueff = 34.1 K (23.6 cm−1) with τ0 = 2.1 × 10⁻⁷ s. The obtained Ueff is far too small compared with the energy gap estimated from the |2D| value (150 cm−1) and also the calculated energy gap between the ground and excited doublets (Table S7†), suggesting that the Orbach relaxation pathway is unlikely for 2. In addition, the slight curvature at low temperature in the Arrhenius plot indicates the existence of multiple relaxation pathways. Detailed analyses support that Raman and direct relaxation mechanisms should dominate in the magnetic relaxation in 2 (see the details in the ESI†). Notably, magnetic measurements on the rehydration sample of 1 and its dehydrated sample confirmed again the reversibility of the dehydration/rehydration process (Fig. S13, ESI†).
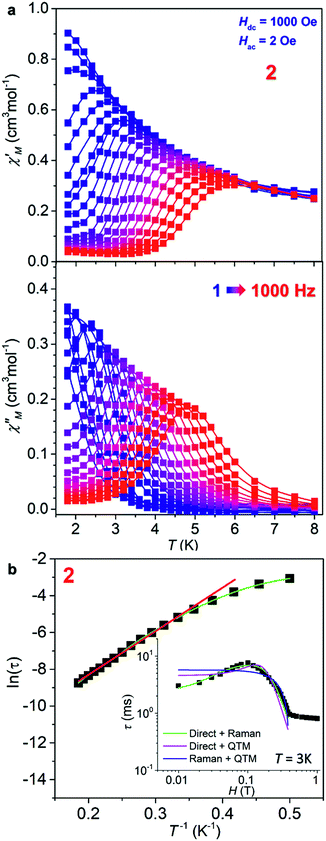 | ||
Fig. 4 (a) The in-phase (χ′) and out-of-phase (χ′′) components of the ac susceptibilities as a function of T of 2 in 1000 Oe dc field at different frequencies (1–1000 Hz). (b) Natural logarithm of the relaxation time ln![[thin space (1/6-em)]](https://www.rsc.org/images/entities/char_2009.gif) τ as a function of the inverse temperature T−1. The straight red line is a fit of the 12 points at highest temperatures to the Arrhenius law ln τ as a function of the inverse temperature T−1. The straight red line is a fit of the 12 points at highest temperatures to the Arrhenius law ln![[thin space (1/6-em)]](https://www.rsc.org/images/entities/char_2009.gif) τ = ln τ = ln![[thin space (1/6-em)]](https://www.rsc.org/images/entities/char_2009.gif) τ0 + Ueff/kBT. The curved green line is the best fit to the sum of the direct and Raman processes (see ESI†). Inset: field dependence of the magnetic relaxation times at 3 K for 2 and its approximation by the different models assuming two magnetic relaxation mechanisms, where only the sum of the direct and Raman processes gives a good fit. τ0 + Ueff/kBT. The curved green line is the best fit to the sum of the direct and Raman processes (see ESI†). Inset: field dependence of the magnetic relaxation times at 3 K for 2 and its approximation by the different models assuming two magnetic relaxation mechanisms, where only the sum of the direct and Raman processes gives a good fit. | ||
The above results clearly show that the SC–SC transformation leads to the reversible on–off switching between SCO and SMM (SCO-on/SMM-off (1) ↔ SCO-off/SMM-on (2)) in one material. Its design principle and structure–property relationship are worth more discussions. The design of this interesting system relies on the unique magnetic properties of the CoII ion. On the one hand, the high magnetic anisotropy of the HS CoII ions has led to numerous CoII-SIMs.39,40 On the other hand, CoII compounds have also played very important roles in SCO materials. Therefore, by tuning the ligand field of the Co-terpy complexes ([Co(terpy)2]2+ and [Co(terpy)X2], X = Cl− or NCS−), Murugesu et al. and Hayami et al. have succeeded in the preparation of unique complexes with either SMM or SCO behaviors.30,31 Here, we developed another strategy by taking advantage of the sensitivity of the CoII SCO compounds. In fact, since the entropy change of SCO for a CoII ion (S = 1/2 ↔ S = 3/2) is much smaller than those for FeII/III ions, the SCO properties of the CoII compounds are more sensitive to small structural changes, as observed in the Co-terpy compounds with long alkyl chains.31 This feature offers a good opportunity to achieve dynamic materials with switchable spin states. As the magnetic anisotropy of the HS CoII is usually large, a dynamic material with switching of SCO and SMM behaviours is also anticipated.
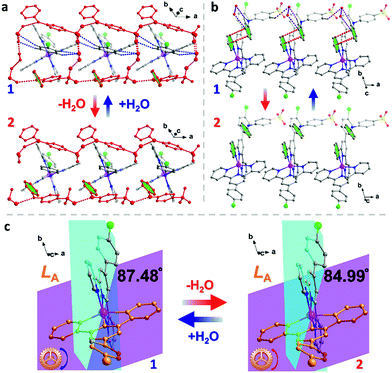
As for its structure–property relationship, careful inspection of the structures provides some clues. A range of supramolecular interactions, including the H-bonds between H2O, DAPS− and L ligands and π–π interactions between the aromatic rings, exist in 1 (Fig. 5 and Table S10, ESI†). Connected by the NH⋯O and OH⋯O H-bonds, the DPAS− anions and water molecules form 1D ladders along the a axis (Fig. 5a). Interestingly, half of the L ligands (LA) are locked inside the square windows of the ladders by the CH⋯O hydrogen bonds between the O atoms from H2O and the SO3− and C–H groups from LA ligands. Furthermore, π–π interactions between the pyridine rings of LB and the benzene rings of the DAPS− anions were also found (Fig. 5b). After dehydration, H-bonds involving H2O molecules are all removed, which has two direct impacts on the supramolecular interactions. (I) The hydrogen bonded ladders no longer exist and the locking effect of the LA ligands is eliminated. (II) The π–π interactions mentioned above are weakened due to the rotation of the benzene rings of the DAPS− anions. Consequently, the L ligands in 2 are much more loosely packed compared to those in 1, which results in a more distorted octahedron of the Co2+ center in 2. This is confirmed by a range of parameters, such as the large CShM value of 2 at 300 K (see above), the larger distortion parameters Σ and Θ of 2 (Table S3, ESI†),46 and the smaller dihedral angle between the least-square planes of the two L ligands (87.48° in 1vs. 84.99° in 2 at 300 K, Fig. 5c). Apparently, the large distortion of the Co2+ octahedron favours the HS state and prevents the SCO from taking place in 2.
Conclusions
In summary, we demonstrated the achievement of the first example of reversible on–off switching of both the SCO and SMM behaviours in one single material through a crystal-to-crystal transformation during dehydration–rehydration. The magnetic switching occurred in a non-porous mononuclear cobalt(II) complex and is triggered by the modification of the ligand field induced by changes in the supramolecular interactions. These results highlight the importance of the weak supramolecular interactions and suggest an alternative strategy for the construction of switchable materials using SCO materials of high sensitivity and high magnetic anisotropy.Conflicts of interest
There are no conflicts to declare.Acknowledgements
This work was supported by the National Key R&D Program of China (2018YFA0306002), NSFC (21522103, 21471077, 91622110, 21701046, and 11774178) and the NSF of Jiangsu Province (BK20150017 and BK20151542). We also thank Prof. Mohamedally Kurmoo for the valuable discussions.Notes and references
- O. Sato, Nat. Chem., 2016, 8, 644–656 CrossRef PubMed.
- M. Magott, O. Stefańczyk, B. Sieklucka and D. Pinkowicz, Angew. Chem., Int. Ed., 2017, 129, 13468–13472 CrossRef.
- M. Reczyński, S. Chorazy, B. Nowicka, B. Sieklucka and S. Ohkoshi, Inorg. Chem., 2017, 56, 179–185 CrossRef PubMed.
- M.-H. Zeng, Z. Yin, Y.-X. Tan, W.-X. Zhang, Y.-P. He and M. Kurmoo, J. Am. Chem. Soc., 2014, 136, 4680–4688 CrossRef PubMed.
- M. Wriedt, A. A. Yakovenko, G. J. Halder, A. V. Prosvirin, K. R. Dunbar and H.-C. Zhou, J. Am. Chem. Soc., 2013, 135, 4040–4050 CrossRef PubMed.
- H.-Y. Wang, J.-Y. Ge, C. Hua, C.-Q. Jiao, Y. Wu, C. F. Leong, D. M. D. Alessandro, T. Liu and J.-L. Zuo, Angew. Chem., Int. Ed., 2017, 56, 5465 CrossRef PubMed.
- W.-B. Chen, J.-D. Leng, Z.-Z. Wang, Y.-C. Chen, Y. Miao, M.-L. Tong and W. Dong, Chem. Commun., 2017, 53, 7820–7823 RSC.
- S. Rodríguez-Jiménez, H. L. C. Feltham and S. Brooker, Angew. Chem., Int. Ed., 2016, 55, 15067–15071 CrossRef PubMed.
- J. S. Costa, S. Rodríguez-Jiménez, G. A. Craig, B. Barth, C. M. Beavers, S. J. Teat and G. Aromí, J. Am. Chem. Soc., 2014, 136, 3869–3874 CrossRef PubMed.
- J. E. Clements, J. R. Price, S. M. Neville and C. J. Kepert, Angew. Chem., Int. Ed., 2014, 53, 10164–10168 CrossRef PubMed.
- D.-Q. Wu, D. Shao, X.-Q. Wei, F.-X. Shen, L. Shi, D. Kempe, Y.-Z. Zhang, K. R. Dunbar and X.-Y. Wang, J. Am. Chem. Soc., 2017, 139, 11714–11717 CrossRef PubMed.
- J. Vallejo, E. Pardo, M. Viciano-Chumillas, I. Castro, P. Amoros, M. Deniz, C. Ruiz-Pérez, C. Yuste-Vivas, J. Krzystek, M. Julve, F. Lloret and J. Cano, Chem. Sci., 2017, 8, 3694–3702 RSC.
- X.-J. Zhang, V. Vieru, X.-W. Feng, J.-L. Liu, Z.-J. Zhang, B. Na, W. Shi, B.-W. Wang, A. K. Powell, L. F. Chibotaru, S. Gao, P. Cheng and J. R. Long, Angew. Chem., Int. Ed., 2015, 54, 9861–9865 CrossRef PubMed.
- S. Fortier, J. J. L. Roy, C.-H. Chen, V. Vieru, M. Murugesu, L. F. Chibotaru, D. J. Mindiola and K. G. Caulton, J. Am. Chem. Soc., 2013, 135, 14670–14678 CrossRef PubMed.
- J.-L. Liu, Y.-C. Chen, Y.-Z. Zheng, W.-Q. Lin, L. Ungur, W. Wernsdorfer, L. F. Chibotaru and M.-L. Tong, Chem. Sci., 2013, 4, 3310–3316 RSC.
- K. Suzuki, R. Sato and N. Mizuno, Chem. Sci., 2013, 4, 596–600 RSC.
- Q. Zhou, F. Yang, B. Xin, G. Zeng, X. Zhou, K. Liu, D. Ma, G. Li, Z. Shi and S. Feng, Chem. Commun., 2013, 49, 8244–8246 RSC.
- M. Fujimoto, The Physics of Structural Phase Transitions, Springer, New York, 2003 Search PubMed.
- G. K. Kolea and J. J. Vittal, Chem. Soc. Rev., 2013, 42, 1755–1775 RSC.
- M. A. Halcrow, Spin Crossover Materials: Properties and Applications, John Wiley & Sons Ltd., New York, 2013 Search PubMed.
- G. A. Craig and M. Murrie, Chem. Soc. Rev., 2015, 44, 2135–2147 RSC.
- D. N. Woodruff, R. E. P. Winpenny and R. A. Layfield, Chem. Rev., 2013, 113, 5110–5148 CrossRef PubMed.
- A. Urtizberea and O. Roubeau, Chem. Sci., 2017, 8, 2290–2295 RSC.
- X. Feng, C. Mathonière, I.-R. Jeon, M. Rouzières, A. Ozarowski, M. L. Aubrey, M. I. Gonzalez, R. Clérac and J. R. Long, J. Am. Chem. Soc., 2013, 135, 15880–15884 CrossRef PubMed.
- C. Mathonière, H.-J. Lin, D. Siretanu, R. Clérac and J. M. Smith, J. Am. Chem. Soc., 2013, 135, 19083–19086 CrossRef PubMed.
- S. Mossin, B. L. Tran, D. Adhikari, M. Pink, F. W. Heinemann, J. Sutter, R. K. Szilagyi, K. Meyer and D. J. Mindiola, J. Am. Chem. Soc., 2012, 134, 13651–13661 CrossRef PubMed.
- I. A. Gass, S. Tewary, A. Nafady, N. F. Chilton, C. J. Gartshore, M. Asadi, D. W. Lupton, B. Moubaraki, A. M. Bond, J. F. Boas, S.-X. Guo, G. Rajaraman and K. S. Murray, Inorg. Chem., 2013, 52, 7557–7572 CrossRef PubMed.
- H.-H. Cui, J. Wang, X.-T. Chen and Z.-L. Xue, Chem. Commun., 2017, 53, 9304–9307 RSC.
- D. Shao, L.-D. Deng, L. Shi, D.-Q. Wu, X.-Q. Wei, S.-R. Yang and X.-Y. Wang, Eur. J. Inorg. Chem., 2017, 3862–3867 CrossRef.
- F. Habib, O. R. Luca, V. Vieru, M. Shiddiq, I. Korobkov, S. I. Gorelsky, M. K. Takase, L. F. Chibotaru, S. Hill, R. H. Crabtree and M. Murugesu, Angew. Chem., Int. Ed., 2013, 52, 11290–11293 CrossRef PubMed.
- S. Hayami, Y. Shigeyoshi, M. Akita, K. Inoue, K. Kato, K. Osaka, M. Takata, R. Kawajiri, T. Mitani and Y. Maeda, Angew. Chem., Int. Ed., 2005, 44, 4899–4903 CrossRef PubMed.
- M. Llunell, D. Casanova, J. Cirera, P. Alemany and S. Alvarez, SHAPE, Version 2.1, Universitat de Barcelona, 2013 Search PubMed.
- X. Zhang, Z.-X. Wang, H. Xie, M.-X. Li, T. J. Woods and K. R. Dunbar, Chem. Sci., 2016, 7, 1569–1574 RSC.
- Y. Guo, X.-L. Yang, R.-J. Wei, L.-S. Zheng and J. Tao, Inorg. Chem., 2015, 54, 7670–7672 CrossRef PubMed.
- S. Hayami, Y. Komatsu, T. Shimizu, H. Kamihata and Y. H. Lee, Coord. Chem. Rev., 2011, 255, 1981–1990 CrossRef.
- A. K. Bar, C. Pichon and J.-P. Sutter, Coord. Chem. Rev., 2016, 308, 346–380 CrossRef.
- C. P. Slichter and H. G. Drickamer, J. Chem. Phys., 1972, 56, 2142 CrossRef.
- A. B. Gaspar, M. C. Munoz, V. Niel and J. A. Real, Inorg. Chem., 2001, 40, 9–10 CrossRef PubMed.
- D. Shao, S.-L. Zhang, L. Shi, Y.-Q. Zhang and X.-Y. Wang, Inorg. Chem., 2016, 55, 10859–10869 CrossRef PubMed.
- S. Gómez-Coca, D. Aravena, R. Morales and E. Ruiz, Coord. Chem. Rev., 2015, 289, 379–392 CrossRef.
- N. F. Chilton, R. P. Anderson, L. D. Turner, A. Soncini and K. S. Murray, J. Comput. Chem., 2013, 34, 1164–1175 CrossRef PubMed.
- Simulations and fitting were performed using SPIN developed by Andrew Ozarowski in the National High Magnetic Field Laboratory, USA.
- L. Chen, H.-H. Cui, S. E. Stavretis, S. C. Hunter, Y.-Q. Zhang, X.-T. Chen, Y.-C. Sun, Z. Wang, Y. Song, A. A. Podlesnyak, Z.-W. Ouyang and Z.-L. Xue, Inorg. Chem., 2016, 55, 12603–12617 CrossRef PubMed.
- L. F. Chibotaru, L. Ungur, C. Aronica, H. Elmoll, G. Pilet and D. Luneau, J. Am. Chem. Soc., 2008, 130, 12445–12455 CrossRef PubMed.
- K. S. Cole and R. H. Cole, J. Chem. Phys., 1941, 9, 341–351 CrossRef.
- J. K. McCusker, A. L. Rheingold and D. N. Hendrickson, Inorg. Chem., 1996, 35, 2100–2112 CrossRef.
Footnote |
| † Electronic supplementary information (ESI) available: Synthesis, physical measurement, and theoretical calculation details. Crystal data in CIF format and additional figures. CCDC 1816022–1816026 and 1840937. For ESI and crystallographic data in CIF or other electronic format see DOI: 10.1039/c8sc02774a |
| This journal is © The Royal Society of Chemistry 2018 |

