Understanding the side-chain effects on A–D–A acceptors: in-plane and out-of-plane†
Qishi
Liu‡
ab,
Zuo
Xiao‡
 b,
Ting
Li
b,
Shangfeng
Yang
b,
Ting
Li
b,
Shangfeng
Yang
 *a,
Wei
You
 *c,
Mingkui
Wang
*d and
Liming
Ding
 *b
*b
aHefei National Laboratory for Physical Sciences at Microscale, Key Laboratory of Materials for Energy Conversion (CAS), Department of Materials Science and Engineering, University of Science and Technology of China, Hefei 230026, China. E-mail: sfyang@ustc.edu.cn
bCenter for Excellence in Nanoscience (CAS), Key Laboratory of Nanosystem and Hierarchical Fabrication (CAS), National Center for Nanoscience and Technology, Beijing 100190, China. E-mail: ding@nanoctr.cn
cDepartment of Chemistry, University of North Carolina at Chapel Hill, NC 27599, USA. E-mail: wyou@unc.edu
dWuhan National Lab for Optoelectronics, Huazhong University of Science and Technology, Wuhan 430074, China. E-mail: mingkui.wang@hust.edu.cn
First published on 19th June 2018
Abstract
Systematic side-chain engineering on nonacyclic acceptor–donor–acceptor (A–D–A) nonfullerene acceptors, NNFA[n, m], was carried out. “n” and “m” stand for the number of alkyl carbon atoms in the in-plane and out-of-plane side chains, respectively. Five acceptors, NNFA[0, 6], NNFA[6, 3], NNFA[6, 6], NNFA[12, 3] and NNFA[12, 6], were prepared and applied in organic solar cells by blending with a wide-bandgap copolymer donor (FTAZ). The alkyl chains substantially affect the NNFAs’ solubility and photovoltaic performance. The solubility varies from 23 mg mL−1 to 226 mg mL−1 in chloroform when changing the total alkyl carbons (2n + 4m). If the total alkyl carbons are equal, the NNFA with longer out-of-plane alkyl chains (higher “m”) shows higher solubility than that with longer in-plane alkyl chains (higher “n”). NNFA[6, 6] and NNFA[12, 3] with medium solubility (∼100 mg mL−1) present suitable miscibility with FTAZ, and afford more favorable morphology and higher device performance than other NNFAs. FTAZ:NNFA[12, 3] solar cells gave the highest power conversion efficiency of 10.81%.
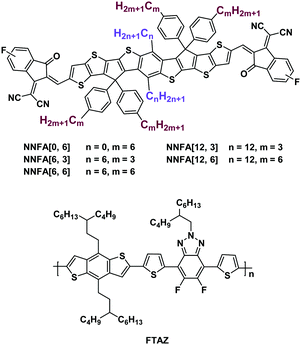
In the past three years, great progress has been made in nonfullerene-acceptor-based organic solar cells.1 The power conversion efficiency (PCE) has been boosted from ∼6% to >14%.2–4 Compared with fullerene acceptors, nonfullerene acceptors (NFAs) show advantages like strong light-harvesting capability, tunable energy levels and good morphology stability.5 Acceptor–donor–acceptor (A–D–A) small molecule acceptors could be the most successful NFAs. These acceptors consist of a ladder-type electron-donating core unit, two strong electron-withdrawing end units and four out-of-plane side chains.1 The strong intramolecular charge transfer (ICT) between the core and end units gives the materials narrow bandgaps and strong light-harvesting capability.6 The out-of-plane side chains can avoid over aggregation of the materials, helping to realize optimal morphology.7 Numerous studies have focused on tailoring the structures of the core and end units.8–23 Less work has been carried out on side-chain engineering. The introduction of in-plane side chains can improve the performance of A–D–A NFAs.24–26 However, how in-plane and out-of-plane side chains affect the material properties and photovoltaic performance is not quite clear. In this work, we employed nonacyclic acceptors, NNFA[n, m], as the model compounds to investigate the side chain effects (Fig. 1). “n” and “m” stand for the number of alkyl carbon atoms in the in-plane and out-of-plane side chains, respectively. The NNFAs’ solubility and photovoltaic performance varied with the change of “n” and “m”. NNFA[6, 6] and NNFA[12, 3] with medium solubility present suitable miscibility with the donor material, and afford better morphology and higher photovoltaic performance than other NNFAs.
The chemical structures of NNFA[n, m] and the copolymer donor FTAZ27 are shown in Fig. 1. Five acceptors with different “n” and “m”, NNFA[0, 6], NNFA[6, 3], NNFA[6, 6], NNFA[12, 3] and NNFA[12, 6], were prepared. The synthesis details are given in the ESI.† The structures of all NNFAs were confirmed by nuclear magnetic resonance (NMR) and mass spectroscopy (see the ESI†).
The solubility for the NNFAs in chloroform was determined by using a literature method.28 The solubility was 74 mg mL−1, 23 mg mL−1, 117 mg mL−1, 96 mg mL−1 and 226 mg mL−1 for NNFA[0, 6], NNFA[6, 3], NNFA[6, 6], NNFA[12, 3] and NNFA[12, 6], respectively. Increasing the total alkyl carbons (2n + 4m) can effectively enhance the solubility of the NNFAs. If the total alkyl carbons are equal, the NNFA with longer out-of-plane alkyl chains (higher “m”) shows higher solubility than those with longer in-plane alkyl chains (higher “n”). For example, the solubility of NNFA[0, 6] is higher than that of NNFA[6, 3] (24 carbons), and the solubility of NNFA[6, 6] is higher than that of NNFA[12, 3] (36 carbons). This result suggests that the solubility of A–D–A acceptors is more sensitive to the out-of-plane alkyl chains.
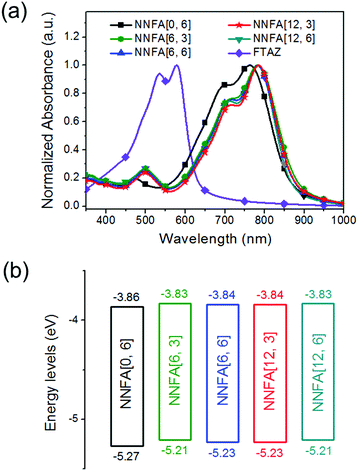
The absorption spectra of NNFAs and FTAZ in chloroform and as films are shown in Fig. S45, ESI† and Fig. 2a, respectively. The optical data are listed in Table 1. In solution, NNFA[0, 6], NNFA[6, 3], NNFA[6, 6], NNFA[12, 3] and NNFA[12, 6] show a strong ICT band at 550–850 nm, presenting an absorption maximum at 730 nm, 747 nm, 747 nm, 748 nm and 747 nm, respectively (Table 1). For films, the absorption maximum shifts to 763 nm, 783 nm, 782 nm, 785 nm and 782 nm, respectively, suggesting the enhanced intermolecular interaction of NNFAs in the solid state. All NNFAs except NNFA[0, 6] give almost identical absorption spectra either in solution or as films. Compared with NNFA[0, 6] with no in-plane side chains, other NNFAs show a red-shift in the absorption spectra and have smaller optical bandgaps (Eoptg). The Eoptg values estimated from the absorption onsets of the NNFA[0, 6], NNFA[6, 3], NNFA[6, 6], NNFA[12, 3] and NNFA[12, 6] films are 1.38 eV, 1.37 eV, 1.37 eV, 1.37 eV and 1.37 eV, respectively. This result suggests that introducing in-plane side chains to NNFAs slightly enhances the electron-donating capability of the core unit and strengthens the ICT, leading to bandgap shrinkage. The FTAZ film absorbs 350–650 nm light, and its absorption is complementary to the NNFAs’ absorption. The energy levels estimated from cyclic voltammetry measurements are shown in Fig. 2b.29 The highest occupied molecular orbital (HOMO) levels for NNFA[0, 6], NNFA[6, 3], NNFA[6, 6], NNFA[12, 3] and NNFA[12, 6] are −5.27 eV, −5.21 eV, −5.23 eV, −5.23 eV and −5.21 eV, respectively, and the lowest unoccupied molecular orbital (LUMO) levels are −3.86 eV, −3.83 eV, −3.84 eV, −3.84 eV and −3.83 eV, respectively. The introduction of in-plane side chains lifts both the HOMO and LUMO levels. The higher LUMO levels of NNFA[6, 3], NNFA[6, 6], NNFA[12, 3] and NNFA[12, 6] are beneficial for the open-circuit voltage (Voc) of solar cells.30 The similar absorption spectra and energy levels of NNFA[6, 3], NNFA[6, 6], NNFA[12, 3] and NNFA[12, 6] suggest that the optical properties and the bandgaps of A–D–A acceptors are less influenced by the length of the in-plane or out-of-plane side chains.
| NNFA[n, m] | λ sol [nm] | λ film [nm] | λ on [nm] |
E
optg![[thin space (1/6-em)]](https://www.rsc.org/images/entities/char_2009.gif) a [eV] a [eV] |
E onox [V] | E onred [V] | HOMOb [eV] | LUMOc [eV] |
E
ecg![[thin space (1/6-em)]](https://www.rsc.org/images/entities/char_2009.gif) d [eV] d [eV] |
|---|---|---|---|---|---|---|---|---|---|
| a E optg = 1240/λon. b HOMO = −(Eonox + 4.8). c LUMO = −(Eonred + 4.8). d E ecg = LUMO–HOMO. | |||||||||
| NNFA[0, 6] | 730 | 763 | 898 | 1.38 | 0.47 | −0.94 | −5.27 | −3.86 | 1.41 |
| NNFA[6, 3] | 747 | 783 | 905 | 1.37 | 0.41 | −0.97 | −5.21 | −3.83 | 1.38 |
| NNFA[6, 6] | 747 | 782 | 905 | 1.37 | 0.43 | −0.96 | −5.23 | −3.84 | 1.39 |
| NNFA[12, 3] | 748 | 785 | 905 | 1.37 | 0.43 | −0.96 | −5.23 | −3.84 | 1.39 |
| NNFA[12, 6] | 747 | 782 | 905 | 1.37 | 0.41 | −0.97 | −5.21 | −3.83 | 1.38 |
The crystallinity of the NNFAs was investigated by performing X-ray diffraction (XRD) measurements (Fig. S47, ESI†). All films gave a broad diffraction peak centered at 2θ of ∼25°, corresponding to a π–π stacking d-spacing of ∼3.6 Å. The alkyl chains show no significant influence on the π–π stacking of NNFA molecules. Weak peaks at 2θ of 6.9° and 5.2° were observed for NNFA[6, 3] and NNFA[6, 6] films, respectively.
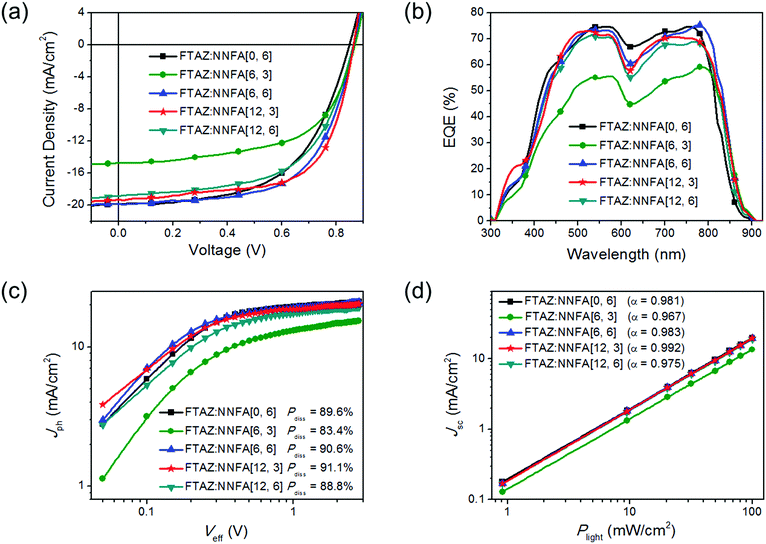
Solar cells with a structure of ITO/ZnO/FTAZ:NNFA[n, m]/MoO3/Ag were made.31 The D/A ratio, active layer thickness and additive content were optimized (Tables S2–S16, ESI†). J–V curves and external quantum efficiency (EQE) spectra of the best cells are given in Fig. 3a and b, respectively, and the device performance data are listed in Table 2. FTAZ:NNFA[n, m] solar cells gave the best performance under the same conditions: a D/A ratio of 1![[thin space (1/6-em)]](https://www.rsc.org/images/entities/char_2009.gif) :
:![[thin space (1/6-em)]](https://www.rsc.org/images/entities/char_2009.gif) 1.4 (w/w), an active layer thickness of ∼80 nm, and without 1,8-diiodooctane additive. The PCEs for NNFA[0, 6], NNFA[6, 3], NNFA[6, 6], NNFA[12, 3] and NNFA[12, 6] solar cells are 9.52%, 7.56%, 10.56%, 10.81% and 9.54%, respectively. The Voc values for NNFA[6, 3], NNFA[6, 6], NNFA[12, 3] and NNFA[12, 6] cells are 0.02–0.03 V higher than those of NNFA[0, 6] cells because of the higher LUMOs. ∼19 mA cm−2 short-circuit current density (Jsc) and >70% EQE were obtained from NNFA[0, 6], NNFA[6, 6], NNFA[12, 3] and NNFA[12, 6] cells. The integrated photocurrent densities from the EQE spectra are consistent with Jsc from J–V measurements (Table 2). Compared with NNFA[0, 6] with no in-plane side chains, NNFA[6, 3], NNFA[6, 6], NNFA[12, 3] and NNFA[12, 6] present broader EQE spectra because of their lower bandgaps. The relatively low Jsc and EQE for NNFA[6, 3] cells suggest poor charge generation. The exciton dissociation probabilities (Pdiss) in all cells were evaluated (Fig. 3c).32 As expected, NNFA[6, 3] cells gave the lowest Pdiss of 83.4%, while the other four cells gave Pdiss of ∼90%. The fill factors (FFs) for NNFA[0, 6], NNFA[6, 3], NNFA[6, 6], NNFA[12, 3] and NNFA[12, 6] cells are 57.0%, 59.1%, 61.3%, 64.7% and 58.7%, respectively. The higher FFs for NNFA[6, 6] and NNFA[12, 3] cells suggest their balanced charge transport. The hole and electron mobilities (μh and μe) were evaluated by using a space charge limited current (SCLC) method (Fig. S48, S49 and Table S17, ESI†).33 The μh/μe values for FTAZ:NNFA[0, 6], FTAZ:NNFA[6, 3], FTAZ:NNFA[6, 6], FTAZ:NNFA[12, 3] and FTAZ:NNFA[12, 6] films are 5.90, 7.26, 4.92, 3.71 and 5.98, respectively. The smaller μh/μe for the FTAZ:NNFA[6, 6] and FTAZ:NNFA[12, 3] films suggests more balanced charge transport, thus delivering higher FF. We also studied bimolecular recombination by plotting Jsc against light intensity (Plight) (Fig. 3d). The data were fitted to a power law: Jsc ∝ Pαlight.34 The α values for NNFA[0, 6], NNFA[6, 3], NNFA[6, 6], NNFA[12, 3] and NNFA[12, 6] cells are 0.981, 0.967, 0.983, 0.992 and 0.975, respectively. Higher α values for NNFA[6, 6] and NNFA[12, 3] cells suggest less charge recombination in the active layer, thus benefiting the FF.35
1.4 (w/w), an active layer thickness of ∼80 nm, and without 1,8-diiodooctane additive. The PCEs for NNFA[0, 6], NNFA[6, 3], NNFA[6, 6], NNFA[12, 3] and NNFA[12, 6] solar cells are 9.52%, 7.56%, 10.56%, 10.81% and 9.54%, respectively. The Voc values for NNFA[6, 3], NNFA[6, 6], NNFA[12, 3] and NNFA[12, 6] cells are 0.02–0.03 V higher than those of NNFA[0, 6] cells because of the higher LUMOs. ∼19 mA cm−2 short-circuit current density (Jsc) and >70% EQE were obtained from NNFA[0, 6], NNFA[6, 6], NNFA[12, 3] and NNFA[12, 6] cells. The integrated photocurrent densities from the EQE spectra are consistent with Jsc from J–V measurements (Table 2). Compared with NNFA[0, 6] with no in-plane side chains, NNFA[6, 3], NNFA[6, 6], NNFA[12, 3] and NNFA[12, 6] present broader EQE spectra because of their lower bandgaps. The relatively low Jsc and EQE for NNFA[6, 3] cells suggest poor charge generation. The exciton dissociation probabilities (Pdiss) in all cells were evaluated (Fig. 3c).32 As expected, NNFA[6, 3] cells gave the lowest Pdiss of 83.4%, while the other four cells gave Pdiss of ∼90%. The fill factors (FFs) for NNFA[0, 6], NNFA[6, 3], NNFA[6, 6], NNFA[12, 3] and NNFA[12, 6] cells are 57.0%, 59.1%, 61.3%, 64.7% and 58.7%, respectively. The higher FFs for NNFA[6, 6] and NNFA[12, 3] cells suggest their balanced charge transport. The hole and electron mobilities (μh and μe) were evaluated by using a space charge limited current (SCLC) method (Fig. S48, S49 and Table S17, ESI†).33 The μh/μe values for FTAZ:NNFA[0, 6], FTAZ:NNFA[6, 3], FTAZ:NNFA[6, 6], FTAZ:NNFA[12, 3] and FTAZ:NNFA[12, 6] films are 5.90, 7.26, 4.92, 3.71 and 5.98, respectively. The smaller μh/μe for the FTAZ:NNFA[6, 6] and FTAZ:NNFA[12, 3] films suggests more balanced charge transport, thus delivering higher FF. We also studied bimolecular recombination by plotting Jsc against light intensity (Plight) (Fig. 3d). The data were fitted to a power law: Jsc ∝ Pαlight.34 The α values for NNFA[0, 6], NNFA[6, 3], NNFA[6, 6], NNFA[12, 3] and NNFA[12, 6] cells are 0.981, 0.967, 0.983, 0.992 and 0.975, respectively. Higher α values for NNFA[6, 6] and NNFA[12, 3] cells suggest less charge recombination in the active layer, thus benefiting the FF.35
| NNFA[n, m] | V oc [V] | J sc [mA cm−2] | FF [%] | PCE [%] |
|---|---|---|---|---|
| a The data in the parentheses are the integrated current density from EQE spectra. b The data in the parentheses are averages for 10 cells. | ||||
| NNFA[0, 6] | 0.84 | 19.83 (19.44)a | 57.0 | 9.52 (9.42)b |
| NNFA[6, 3] | 0.87 | 14.72 (15.17) | 59.1 | 7.56 (7.25) |
| NNFA[6, 6] | 0.87 | 19.86 (19.82) | 61.3 | 10.56 (10.32) |
| NNFA[12, 3] | 0.86 | 19.33 (19.33) | 64.7 | 10.81 (10.58) |
| NNFA[12, 6] | 0.86 | 18.85 (18.52) | 58.7 | 9.54 (9.31) |
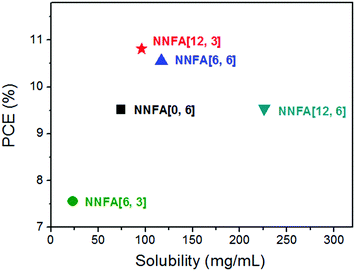
Fullerenes with medium solubility possess suitable miscibility with the donor material, affording better film morphology and higher PCEs.36 We found a similar scenario in NNFAs. Higher PCEs of 10.56% and 10.81% were offered by NNFA[6, 6] and NNFA[12, 3] with medium solubility of 117 mg mL−1 and 96 mg mL−1, respectively (Fig. 4). NNFA[6, 6] and NNFA[12, 3] having suitable miscibility with FTAZ may afford a more favorable film morphology than the other NNFAs. We studied the morphology of FTAZ:NNFA[n, m] blend films by using atomic force microscopy (AFM) (Fig. S50, ESI†). For NNFA[6, 3] with the lowest solubility of 23 mg mL−1, its blend film shows a relatively rough surface, presenting a root-mean-square roughness (Rrms) of 6.09 nm (Fig. S50c, ESI†). Aggregation of the active materials could form in the blend film, yielding a non-uniform film (Fig. S50d, ESI†). For NNFAs with higher solubility, the blend films became much smoother (Rrms ∼ 1 nm), indicating the improved miscibility between the donor and acceptor materials. Nanofibers with ∼10 nm diameters were evenly distributed in FTAZ:NNFA[6, 6] and FTAZ:NNFA[12, 3] blend films. This nanoscale phase separation favors charge generation and transport, leading to higher Jsc and FF for NNFA[6, 6] and NNFA[12, 3] cells.
Conclusions
In summary, we systematically investigated the side chain effect on the material properties and photovoltaic performance of nonacyclic A–D–A acceptors. The introduction of in-plane side chains slightly reduces the bandgap and lifts the LUMO levels of NNFAs. The length of in-plane or out-of-plane side chains slightly influences the optical and electrochemical properties of NNFAs, but significantly affects the solubility. NNFA[6, 6] and NNFA[12, 3] with medium solubility possess suitable miscibility with the donor material, offering more favorable nanoscale phase separation and higher performance than other NNFAs. Finely tuning the side chains is an effective approach for enhancing the photovoltaic performance of A–D–A acceptors.Conflicts of interest
There are no conflicts to declare.Acknowledgements
We greatly appreciate the National Natural Science Foundation of China (U1401244, 21572041, 51503050, 51773045, 21772030, 21704021 and 51572254), the National Key Research and Development Program of China (2017YFA0206600 and 2017YFA0402800) and the Youth Association for Promoting Innovation (CAS) for financial support.References
- C. Yan, S. Barlow, Z. Wang, H. Yan, A. K.-Y. Jen, S. R. Marder and X. Zhan, Nat. Rev. Mater., 2018, 3, 18003 CrossRef.
- Y. Lin, J. Wang, Z. Zhang, H. Bai, Y. Li, D. Zhu and X. Zhan, Adv. Mater., 2015, 27, 1170 CrossRef PubMed.
- Z. Xiao, X. Jia and L. Ding, Sci. Bull., 2017, 62, 1562 CrossRef.
- H. Li, Z. Xiao, L. Ding and J. Wang, Sci. Bull., 2018, 63, 340 CrossRef.
- P. Cheng, G. Li, X. Zhan and Y. Yang, Nat. Photonics, 2018, 12, 131 CrossRef.
- J. Hou, O. Inganäs, R. H. Friend and F. Gao, Nat. Mater., 2018, 17, 119 CrossRef PubMed.
- Y. Lin, F. Zhao, Y. Wu, K. Chen, Y. Xia, G. Li, S. K. K. Prasad, J. Zhu, L. Huo, H. Bin, Z. Zhang, X. Guo, M. Zhang, Y. Sun, F. Gao, Z. Wei, W. Ma, C. Wang, J. Hodgkiss, Z. Bo, O. Inganäs, Y. Li and X. Zhan, Adv. Mater., 2017, 29, 1604155 CrossRef PubMed.
- W. Wang, C. Yan, T.-K. Lau, J. Wang, K. Liu, Y. Fan, X. Lu and X. Zhan, Adv. Mater., 2017, 29, 1701308 CrossRef PubMed.
- T. Li, S. Dai, Z. Ke, L. Yang, J. Wang, C. Yan, W. Ma and X. Zhan, Adv. Mater., 2018, 30, 1705969 CrossRef PubMed.
- Z. Xiao, F. Liu, X. Geng, J. Zhang, S. Wang, Y. Xie, Z. Li, H. Yang, Y. Yuan and L. Ding, Sci. Bull., 2017, 62, 1331 CrossRef.
- Z. Xiao, X. Jia, D. Li, S. Wang, X. Geng, F. Liu, J. Chen, S. Yang, T. P. Russell and L. Ding, Sci. Bull., 2017, 62, 1494 CrossRef.
- T. Li, H. Zhang, Z. Xiao, J. J. Rech, H. Niu, W. You and L. Ding, Mater. Chem. Front., 2018, 2, 700 RSC.
- S. Li, L. Zhan, F. Liu, J. Ren, M. Shi, C.-Z. Li, T. P. Russell and H. Chen, Adv. Mater., 2018, 30, 1705208 CrossRef PubMed.
- J. Sun, X. Ma, Z. Zhang, J. Yu, J. Zhou, X. Yin, L. Yang, R. Geng, R. Zhu, F. Zhang and W. Tang, Adv. Mater., 2018, 30, 1707150 CrossRef PubMed.
- B. Kan, H. Feng, X. Wan, F. Liu, X. Ke, Y. Wang, Y. Wang, H. Zhang, C. Li, J. Hou and Y. Chen, J. Am. Chem. Soc., 2017, 139, 4929 CrossRef PubMed.
- Z. Zhang and X. Zhu, Chem. Mater., 2018, 30, 587 CrossRef.
- S. Xu, Z. Zhou, W. Liu, Z. Zhang, F. Liu, H. Yan and X. Zhu, Adv. Mater., 2017, 29, 1704510 CrossRef PubMed.
- Z. Yao, X. Liao, K. Gao, F. Lin, X. Xu, X. Shi, L. Zuo, F. Liu, Y. Chen and A. K.-Y. Jen, J. Am. Chem. Soc., 2018, 140, 2054 CrossRef PubMed.
- L. Yang, M. Li, J. Song, Y. Zhou, Z. Bo and H. Wang, Adv. Funct. Mater., 2018, 28, 1705927 CrossRef.
- S. Dai, F. Zhao, Q. Zhang, T.-K. Lau, T. Li, K. Liu, Q. Ling, C. Wang, X. Lu, W. You and X. Zhan, J. Am. Chem. Soc., 2017, 139, 1336 CrossRef PubMed.
- D. Xie, T. Liu, W. Gao, C. Zhong, L. Huo, Z. Luo, K. Wu, W. Xiong, F. Liu, Y. Sun and C. Yang, Sol. RRL, 2017, 1, 1700044 CrossRef.
- L. Zuo, X. Shi, S. B. Jo, Y. Liu, F. Lin and A. K.-Y. Jen, Adv. Mater., 2018, 30, 1706816 CrossRef PubMed.
- S. Holliday, R. S. Ashraf, C. B. Nielsen, M. Kirkus, J. A. Röhr, C.-H. Tan, E. Collado-Fregoso, A.-C. Knall, J. R. Durrant, J. Nelson and I. McCulloch, J. Am. Chem. Soc., 2015, 137, 898 CrossRef PubMed.
- J. Wang, W. Wang, X. Wang, Y. Wu, Q. Zhang, C. Yan, W. Ma, W. You and X. Zhan, Adv. Mater., 2017, 29, 1702125 CrossRef PubMed.
- Y. Li, L. Zhong, B. Gautam, H. Bin, J.-D. Lin, F. Wu, Z. Zhang, Z. Jiang, Z. Zhang, K. Gundogdu, Y. Li and L.-S. Liao, Energy Environ. Sci., 2017, 10, 1610 RSC.
- B. Kan, J. Zhang, F. Liu, X. Wan, C. Li, X. Ke, Y. Wang, H. Feng, Y. Zhang, G. Long, R. H. Friend, A. A. Bakulin and Y. Chen, Adv. Mater., 2017, 30, 1704904 CrossRef PubMed.
- S. C. Price, A. C. Stuart, L. Yang, H. Zhou and W. You, J. Am. Chem. Soc., 2011, 133, 4625 CrossRef PubMed.
- N. Sivaraman, R. Dhamodaran, I. Kaliappan, T. G. Srinivasan, P. R. Vasudeva Rao and C. K. Mathews, J. Org. Chem., 1992, 57, 6077 CrossRef.
- Z. Xiao, G. Ye, Y. Liu, S. Chen, Q. Peng, Q. Zuo and L. Ding, Angew. Chem., Int. Ed., 2012, 51, 9038 CrossRef PubMed.
- B. P. Rand, D. P. Burk and S. R. Forrest, Phys. Rev. B: Condens. Matter Mater. Phys., 2007, 75, 115327 CrossRef.
- Z. Xiao, X. Geng, D. He, X. Jia and L. Ding, Energy Environ. Sci., 2016, 9, 2114 RSC.
- J.-L. Wu, F.-C. Chen, Y.-S. Hsiao, F.-C. Chien, P. Chen, C.-H. Kuo, M. H. Huang and C.-S. Hsu, ACS Nano, 2011, 5, 959 CrossRef PubMed.
- J. Cao, Q. Liao, X. Du, J. Chen, Z. Xiao, Q. Zuo and L. Ding, Energy Environ. Sci., 2013, 6, 3224 RSC.
- M. An, F. Xie, X. Geng, J. Zhang, J. Jiang, Z. Lei, D. He, Z. Xiao and L. Ding, Adv. Energy Mater., 2017, 7, 1602509 CrossRef.
- D. Li, Z. Xiao, S. Wang, X. Geng, S. Yang, J. Fang, H. Yang and L. Ding, Adv. Energy Mater., 2018, 8, 1800397 CrossRef.
- P. A. Troshin, H. Hoppe, J. Renz, M. Egginger, J. Y. Mayorova, A. E. Goryochev, A. S. Peregudov, R. N. Lyubovskaya, G. Gobsch, N. S. Sariciftci and V. F. Razumov, Adv. Funct. Mater., 2009, 19, 779 CrossRef.
Footnotes |
| † Electronic supplementary information (ESI) available: Material preparation and characterization, solar cell fabrication and measurements. See DOI: 10.1039/c8qm00238j |
| ‡ Q. Liu and Z. Xiao contributed equally to this work. |
| This journal is © the Partner Organisations 2018 |


