 Open Access Article
Creative Commons Attribution 3.0 Unported Licence
Is iron unique in promoting electrical conductivity in MOFs?†
Lei
Sun
 a,
Christopher H.
Hendon
 a,
Sarah S.
Park
a,
Yuri
Tulchinsky
a,
Ruomeng
Wan
a,
Fang
Wang
a,
Aron
Walsh
a,
Sarah S.
Park
a,
Yuri
Tulchinsky
a,
Ruomeng
Wan
a,
Fang
Wang
a,
Aron
Walsh
 bc and
Mircea
Dincă
 *a
*a
aDepartment of Chemistry, Massachusetts Institute of Technology, Cambridge, MA 02139, USA. E-mail: mdinca@mit.edu
bDepartment of Materials, Imperial College London, London SW7 2AZ, UK
cDepartment of Materials Science and Engineering, Yonsei University, Seoul 03722, South Korea
First published on 20th April 2017
Abstract
Identifying the metal ions that optimize charge transport and charge density in metal–organic frameworks is critical for systematic improvements in the electrical conductivity in these materials. In this work, we measure the electrical conductivity and activation energy for twenty different MOFs pertaining to four distinct structural families: M2(DOBDC)(DMF)2 (M = Mg2+, Mn2+, Fe2+, Co2+, Ni2+, Cu2+, Zn2+); H4DOBDC = 2,5-dihydroxybenzene-1,4-dicarboxylic acid; DMF = N,N-dimethylformamide), M2(DSBDC)(DMF)2 (M = Mn2+, Fe2+; H4DSBDC = 2,5-disulfhydrylbenzene-1,4-dicarboxylic acid), M2Cl2(BTDD)(DMF)2 (M = Mn2+, Fe2+, Co2+, Ni2+; H2BTDD = bis(1H-1,2,3-triazolo[4,5-b],[4′,5′-i]dibenzo[1,4]dioxin), and M(1,2,3-triazolate)2 (M = Mg2+, Mn2+, Fe2+, Co2+, Cu2+, Zn2+, Cd2+). This comprehensive study allows us to single-out iron as the metal ion that leads to the best electrical properties. The iron-based MOFs exhibit at least five orders of magnitude higher electrical conductivity and significantly smaller charge activation energies across all different MOF families studied here and stand out materials made from all other metal ions considered here. We attribute the unique electrical properties of iron-based MOFs to the high-energy valence electrons of Fe2+ and the Fe3+/2+ mixed valency. These results reveal that incorporating Fe2+ in the charge transport pathways of MOFs and introducing mixed valency are valuable strategies for improving electrical conductivity in this important class of porous materials.
Introduction
Metal–organic frameworks (MOFs) that exhibit both high surface area and electrical conductivity are emerging as a new class of materials whose applications reach beyond those typical of porous solids.1 Reports of electrically conductive MOFs in the last few years have addressed both the fundamentals: the nature of the charge carriers and the mechanism of transport,2–6 and the applications: supercapacitors,7 electrocatalysis,8,9 chemiresistive sensing,10,11 and thermoelectrics12 among others. Certain design principles have emerged from these studies, focused for instance on targeting either band-like or hopping conductors,13 yet some of the most basic questions governing electrical conduction in MOFs are still poorly understood. Most obvious among these is the influence of the metal ions on either the band structure of the underlying material or the charge density.In our previous work we have shown that in two isostructural MOFs made from Mn and Fe, the latter leads to considerably improved electrical conductivity by up to six orders of magnitude.5 Additionally, the Fe analogs of M(1,2,3-triazolate)2 (M = Mg2+, Mn2+, Fe2+, Co2+, Cu2+, Zn2+, Cd2+)14,15 and M(TCNQ) (4,4′-bpy) (M = Mn2+, Fe2+, Co2+, Zn2+, Cd2+; TCNQ = 7,7,8,8-tetracyanoquinodimethane; 4,4′-bpy = 4,4′-bipyridyl)16 were reported as being electrically conductive, although the electrical conductivity in the other analogs was not reported. These isolated reports led us to believe that Fe may play an important and unique role in promoting electrical conductivity in MOFs. Here, we compare four structurally distinct classes of MOFs, totalling twenty different materials made from eight different metal ions (M = Mg2+, Mn2+, Fe2+, Co2+, Ni2+, Cu2+, Zn2+, Cd2+) and show that Fe does indeed enable high electrical conductivity in Fe-containing frameworks.
To ascertain the influence of the metal cation on electrical conductivity systematically, we targeted MOFs that feature a broad array of chemical connectivity and composition. Four families of materials that provide this breadth are M2(DOBDC)(DMF)2 (M = Mg2+, Mn2+, Fe2+, Co2+, Ni2+, Cu2+, Zn2+),17–24 M2(DSBDC)(DMF)2 (M = Mn2+, Fe2+),4,5 M2Cl2(BTDD)(DMF)2 (M = Mn2+, Fe2+, Co2+, Ni2+),25 and M(1,2,3-triazolate)2 (M = Mg2+, Mn2+, Fe2+, Co2+, Cu2+, Zn2+, Cd2+).14,15 The first three families of MOFs display honeycomb structures with 1D tubular pores, whereas the M(1,2,3-triazolate)2 materials exhibit cubic structures with three-dimensional pore networks.‡ The metal ions in all these MOFs are formally divalent and octahedrally coordinated (Fig. 1 and S2†).
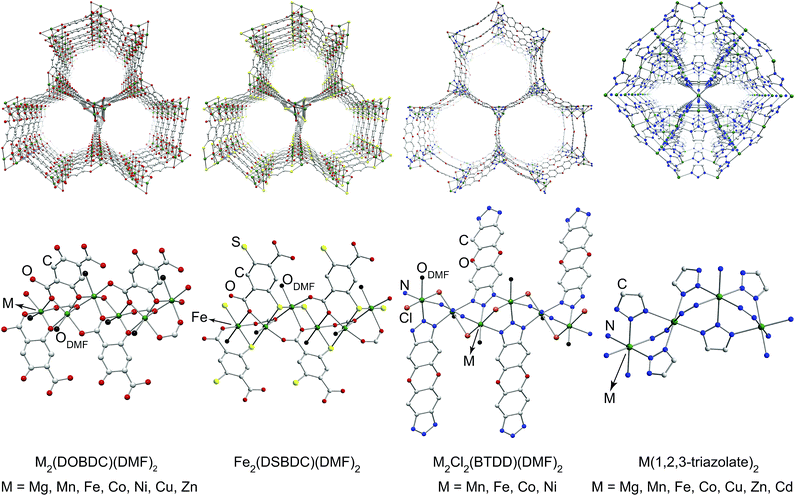 | ||
| Fig. 1 Portions of crystal structures of four families of MOFs emphasizing pores (top) and coordination environment of metal ions (bottom). H atoms and part of DMF molecules have been omitted for clarity. The structure of Mn2(DSBDC)(DMF)2 is shown in Fig. S2 in the ESI.† | ||
Experimental results
All Mn2+-, Fe2+-, and Co2+-based materials were synthesized under air-free conditions. Literature procedures were available for all materials studied here, with the exception of Fe2Cl2(BTDD)(DMF)2 (MIT-20-Fe), which was synthesized by adapting a strategy similar to the preparation of the Mn, Co, and Ni analogs.25 Its structure was assigned on the basis of powder X-ray diffraction (PXRD) analysis, which revealed a pattern that matches those of the other analogs (Fig. S3c†). To ensure consistency, all MOFs were soaked successively in dry and degassed DMF and dichloromethane (DCM) under air-free conditions, and evacuated at 100 °C under vacuum for 2 h. The evacuated materials were kept in a N2-filled glovebox. PXRD and elemental analyses confirmed that all materials retain their structural and compositional integrity as well as phase purity during these manipulations (Fig. S3†). As reported previously, Fe2(DSBDC)(DMF)2 undergoes a spontaneous structural distortion (i.e. a “breathing” deformation) but maintains its connectivity.5 Infrared (IR) spectroscopy revealed vibrational modes at approximately 1650 cm−1 for M2(DOBDC)(DMF)2, M2(DSBDC)(DMF)2, and M2Cl2(BTDD)(DMF)2, confirming that bound DMF completes the octahedral coordination environment of the metal ions in these materials (Fig. S4†).Because some of the MOF crystallites were too small for single crystal studies, electrical properties were measured on pressed pellets in all cases using the standard two-contact probe method26,27 at 300 K, under a N2 atmosphere, and in the dark. PXRD analysis of the pressed pellets revealed patterns that match those of the original materials (Fig. S5†). Plots of the observed current density (J) versus electric field strength (E) for all MOFs are shown in Fig. S6,† and the electrical conductivity values are summarized in Fig. 2 and Table S1.† The Fe-based MOFs exhibit electrical conductivity on the order of 10−8–10−6 S cm−1, whereas the observed electrical conductivity in all other MOFs is six orders of magnitude lower, on the order of 10−14–10−12 S cm−1.
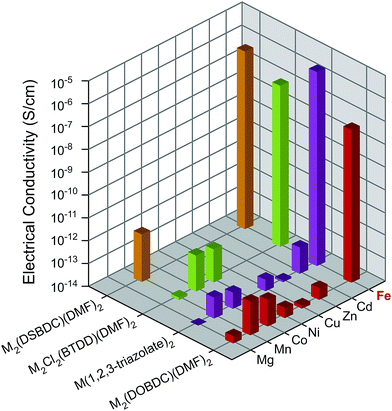 | ||
| Fig. 2 Electrical conductivity in M2(DOBDC)(DMF)2, M2(DSBDC)(DMF)2, M2Cl2(BTDD)(DMF)2, and M(1,2,3-triazolate)2 measured at 300 K, in N2 atmosphere, and in the dark. | ||
To understand the influence of Fe on the electronic structures of these MOFs, we measured the activation energy (Ea) for each material by collecting current–voltage (I–V) curves between 300 K and 350 K under vacuum and in the dark (Fig. S7–S26†). Plotting the electrical conductivity versus temperature for each MOF indicated thermally activated electrical conduction in all cases (Fig. S27†).28 The activation energies were extracted by fitting the electrical conductivity–temperature relationships to the Arrhenius law (see ESI†), and are summarized in Fig. 3 and Table S2.† Here again, we found that the Fe analogs exhibit significantly smaller activation energies than the MOFs based on the other metal ions.
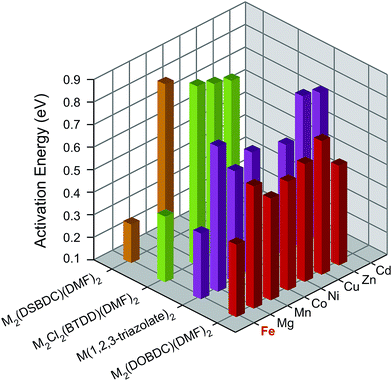 | ||
| Fig. 3 Activation energies of M2(DOBDC)(DMF)2, M2(DSBDC)(DMF)2, M2Cl2(BTDD)(DMF)2, and M(1,2,3-triazolate)2 measured at 300–350 K, in vacuum, and in the dark. | ||
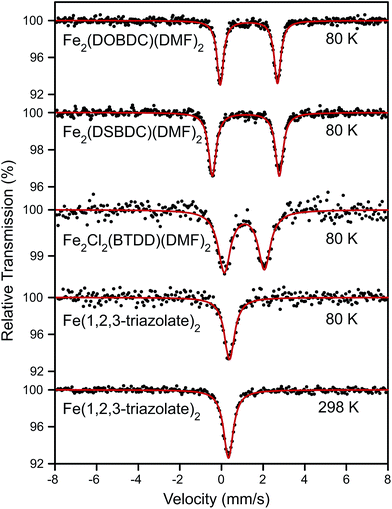
Surmising that the oxidation and spin state of the Fe centers could affect electrical conductivity, we investigated all Fe-based MOFs by 57Fe Mössbauer spectroscopy. At 80 K, the 57Fe Mössbauer spectra of Fe2(DOBDC)(DMF)2, Fe2(DSBDC)(DMF)2, and Fe2Cl2(BTDD)(DMF)2 (Fig. 4) display doublets with isomer shifts δ = 1.318, 1.172, and 1.099 mm s−1, and quadrupole splittings |ΔEQ| = 2.749, 3.218, and 1.923 mm s−1, respectively. These isomer shifts can be unambiguously assigned to high-spin (S = 2) Fe2+ centers.29 At 80 K, the 57Fe Mössbauer spectrum of Fe(1,2,3-triazolate)2 exhibits a singlet with δ = 0.384 mm s−1 and no quadrupole splitting. The singlet feature, characteristic of high symmetry (Oh) Fe centers, persists at 298 K although δ decreases slightly to 0.336 mm s−1 (Fig. 4). Isomer shift values in the range 0.3–0.4 mm s−1 can be assigned to either Fe3+ or low-spin (S = 0) Fe2+.29 We assign this singlet to low-spin (S = 0) Fe2+ because elemental analysis for Fe(1,2,3-triazolate)2 agrees with a majority of Fe2+. However, we cannot rule out the presence of Fe3+ that are not detectable by 57Fe Mössbauer spectroscopy (under our conditions, we estimate the sensitivity at approximately 1%).
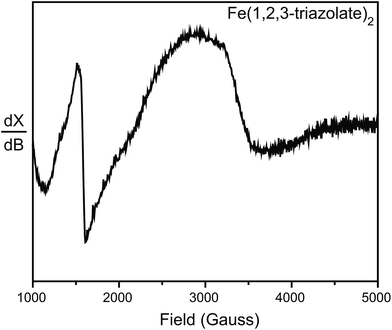
To further probe the possible existence of Fe3+, we performed electron paramagnetic resonance (EPR) experiments, which are sensitive to ppm-level concentrations of Fe3+ under our conditions. The EPR spectrum of Fe(1,2,3-triazolate)2 displayed a broad signal at g ≈ 2.0 and a sharp signal at g ≈ 4.3 (Fig. 5). These are diagnostic of high-spin (S = 5/2) Fe3+ centers.30,31 Although EPR spectra of Fe2(DOBDC)(DMF)2, Fe2(DSBDC)(DMF)2, and Fe2Cl2(BTDD)(DMF)2 revealed only very broad signals, likely due to significant spin–spin relaxation stemming from closely connected high-spin Fe2+ ions, these materials are even more air-sensitive than Fe(1,2,3-triazolate)2.22 It is therefore reasonable to operate under the assumption that all of our Fe MOFs contain Fe3+. Indeed, 57Fe Mössbauer spectroscopic studies revealed that exposure of Fe2(DSBDC)(DMF)2 and Fe2Cl2(BTDD)(DMF)2 to air immediately generates a large amount of Fe3+ (>70%, Fig. S28 and S29†), whereas exposing Fe(1,2,3-triazolate)2 to air for at least one month did not change the isomer shift significantly (δ = 0.340 mm s−1) (Fig. S30†).
N2 sorption measurements for the Fe-based materials revealed Type I isotherms for microporous Fe2(DOBDC)(DMF)2 and Fe(1,2,3-triazolate)2, and a Type IV isotherm for mesoporous Fe2Cl2(BTDD)(DMF)2, with comparatively little gas uptake for Fe2(DSBDC)(DMF)2 (Fig. 6). The corresponding Brunauer–Emmet–Teller (BET) apparent surface areas for Fe2(DOBDC)(DMF)2, Fe2(DSBDC)(DMF)2, Fe2Cl2(BTDD)(DMF)2, and Fe(1,2,3-triazolate)2 were 248, 83, 365, and 443 m2 g−1, respectively (Fig. S31, Table S3†), in line with previous reports and the values expected for each structural type.5
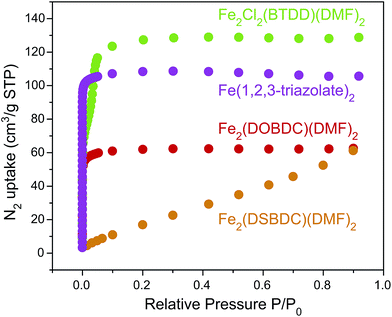 | ||
| Fig. 6 N2 adsorption isotherms (77 K) of Fe2(DOBDC)(DMF)2, Fe2(DSBDC)(DMF)2, Fe2Cl2(BTDD)(DMF)2, and Fe(1,2,3-triazolate)2. | ||
Electronic structure calculations
To further probe the influence of Fe on the electrical properties of MOFs, we evaluated the electronic structures of the M2(DOBDC), M2(DSBDC), and M(1,2,3-triazolate)2 families using density functional theory (DFT) calculations.§ The unit cell of the M2Cl2(BTDD) family proved too large and we were unable to compute its properties with reasonable computational resources. Owing to the structural similarities between the infinite Fe-based chains in Fe2(DEBDC) (E = O, S) and Fe2Cl2(BTDD) we infer that computational results from the former may be extended to understand the latter. In most cases, our studies yielded intuitive electron energies as presented in Fig. 7.¶ One intriguing exception was found for the electronic structure of Co2(DOBDC): previous reports computed with the PBEsol functional showed a ground state high-spin (S = 3/2) electronic structure. In our hands, PBEsol indeed converges to a high-spin structure, but higher level computational analysis with the HSE06 functional surprisingly revealed the contrary: a high-spin Co2+ structure did not converge, and a stable minimum was found only for the low-spin (S = 1/2) configuration. This could be due to the systematic differences in equations of state that arise from the use of different functionals.32 We could not probe this hypothesis given the extremely expensive calculation required to geometrically optimize the Co2+-containing MOF with a hybrid functional.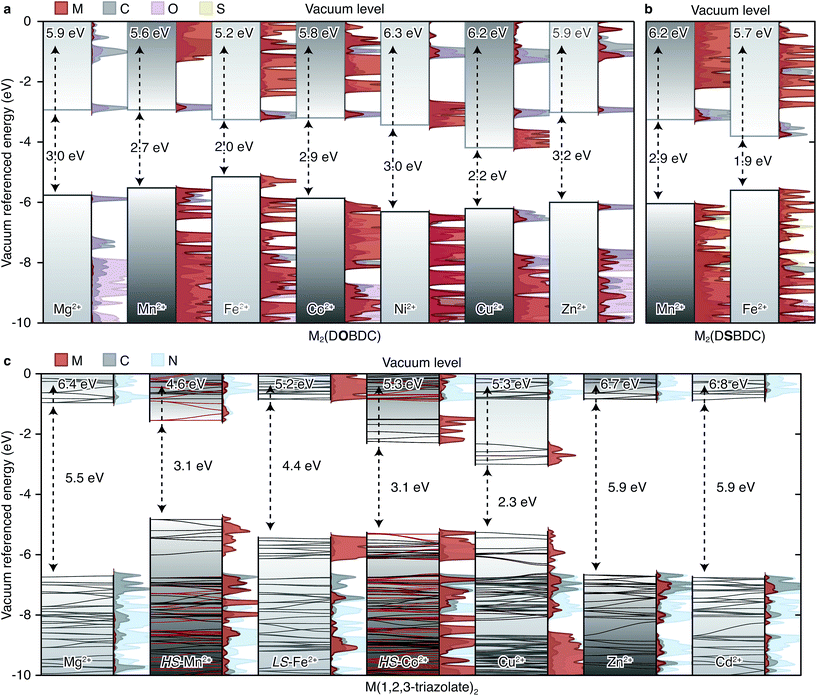 | ||
| Fig. 7 Calculated energy bands and projected density of states (PDOS) of (a) M2(DOBDC), (b) M2(DSBDC), and (c) M(1,2,3-triazolate)2. The electron energies are referenced to the vacuum level using the method presented in ref. 33. EVBM are shown on the top and band gaps are shown in the middle of each sub-figure. | ||
A summary of the band alignments and accompanying projected density of states (PDOS) of the computed MOFs are presented in Fig. 7. The band structures for the M(1,2,3-triazolate)2 materials are superimposed over the schematic band alignment diagrams, to depict the electronic bandwidth. The valence band (VB) maximum energy (EVBM), conduction band (CB) minimum energy (ECBM), and band gap (Eg) of each MOF are listed in Table S4.† The energy levels were referenced to an internal vacuum level using a method reported previously.33
In the M2(DOBDC) family, closed-shell ions, Mg2+ and Zn2+, contribute little to either VB or CB (Fig. 7a). In contrast, open-shell ions, Mn2+, Fe2+, Ni2+, and Cu2+, participate in both VB and CB. More electronegative metal ions, such as Cu2+, contribute to a greater extent to the CB and also lower ECBM, whereas more electropositive metals have greater contribution to the VB and raise EVBM. For instance, Fe-based orbitals dominate the VB of Fe2(DOBDC), which also exhibits the highest EVBM (−5.2 eV) and the smallest band gap (Eg = 2.0 eV) in this family. Cu-based orbitals dominate the CB of Cu2(DOBDC), which exhibits the lowest ECBM (−3.9 eV) and the second smallest band gap (Eg = 2.2 eV). All other MOFs in this family exhibit Eg of approximately 3 eV. These results are qualitatively consistent with the experimental observation that the activation energy of Fe2(DOBDC) is smaller than those of other analogues.
The trends observed for M2(DOBDC) are reproduced in the M2(DSBDC) family. In Fe2(DSBDC) EVBM is increased by 0.5 eV and ECBM is decreased by 0.5 eV relative to the Mn analog, together giving rise to 1.0 eV difference between the Eg values of the two materials (Fig. 7b). This is in line with the smaller activation energy observed experimentally for the Fe analog.
In the M(1,2,3-triazolate)2 family, closed-shell ions again give bands of different parentage than the open-shell ions. Thus, Mg2+, Zn2+, and Cd2+ do not participate in the VB or CB, which are primarily ligand-based and give rise to similar band gaps for the respective MOFs (Eg = 5.5–5.9 eV) (Fig. 7c). On the other hand, the PDOS for the Mn2+, Co2+, and Cu2+ analogs show that metal-based orbitals dominate both VB and CB, with negligible contribution from ligand-based orbitals. Charge carriers in these materials must therefore be localized on the metal ions. As in M2(DOBDC) and M2(DSBDC), EVBM and ECBM are determined by the electronegativity of the metal ions: Mn(1,2,3-triazolate)2 exhibits the highest EVBM (−4.6 eV), and Cu(1,2,3-triazolate)2 exhibits the lowest ECBM (−3.0 eV) and the smallest band gap (Eg = 2.3 eV). These trends qualitatively agree with the activation energies determined experimentally: the Mg2+, Zn2+, and Cd2+ materials exhibit similar activation energies that are generally higher than those of the open-shell systems.
At first glance, Fe(1,2,3-triazolate)2 appears to be anomalous in this family because its computed Eg is large, which should give rise to high Ea and low intrinsic electrical conductivity, in direct contrast with its experimentally determined low Ea and high electrical conductivity. The computational result appears to be particularly unusual given that the Fe2+ centers in this material are low-spin (S = 0), and are therefore unlikely to contribute high-energy charge carriers. Fe3+ ions, however, could provide such charge carriers.
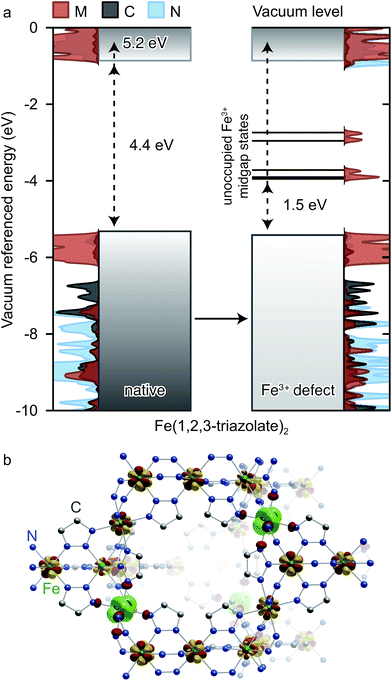
Insight into the effect of Fe3+ on the electronic structure of Fe(1,2,3-triazolate)2 came from DFT analysis of a hypothetical material FeIII1/6FeII5/6(1,2,3-triazolate)21/6+, wherein one sixth of all Fe2+ centers are replaced by Fe3+. Although this Fe3+ concentration is much higher than experimentally observed in Fe(1,2,3-triazolate)2, it simply artificially increases the DOS contributions from states arising from Fe3+ while simultaneously destabilizing the crystal. We were able to obtain a stable structure at this defect concentration and using a core level alignment we were able to align the defective material to the native Fe2+ framework. As shown in Fig. 8a, Fe3+ do not significantly affect the energy of the native Fe(1,2,3-triazolate)2 bands. Instead, they give rise to mid-gap states attributed to the Fe d-electron spin-down channels. These mid-gap states are found only 1.5 eV above EVBM. Such redox-accessible states are expected to persist even at much lower Fe3+ concentration. As a consequence, VB electrons in Fe3+-incorporated Fe(1,2,3-triazolate)2 may be thermally activated into the mid-gap Fe-based states, promoting the formation of hole carriers in the VB. In addition, the spin density distribution in this hypothetical material (Fig. 8b) shows that the spins, and equivalently the unpaired electrons, are partially delocalized among Fe centers. The Fe3+/2+ mixed valency should facilitate inter-iron charge hopping and improve charge mobility. We therefore attribute the high electrical conductivity of Fe(1,2,3-triazolate)2 to the presence of mixed-valent Fe3+/2+.
Discussion
The unique role of Fe in promoting high electrical conductivity across four different families of MOFs that differ in both structure and organic connectivity is highlighted in Fig. 2. Although the particular reasons for this conserved role of Fe across different materials are likely convoluted, Fe stands out among the other metals considered here in several respects. First, among Mg2+, Mn2+, Fe2+, Co2+, Ni2+, Cu2+, Zn2+, and Cd2+ the ionization energy of Fe2+ is the smallest at 30.652 eV (Table S5†).34 Second, the standard reduction potential (298 K) of the aqueous Fe3+/2+ couple, 0.771 V, is smaller than those of the aqueous Mn3+/2+, Co3+/2+, and Cu3+/2+ couples (Table S5†),35 whereas the trivalent states of the other metal ions are essentially inaccessible under similar experimental conditions.||Finally, owing to its large ionic radius and small effective nuclear charge, high-spin Fe2+ (as found in Fe2(DOBDC)(DMF)2, Fe2(DSBDC)(DMF)2, and Fe2Cl2(BTDD)(DMF)2) exhibits the smallest Coulombic attraction between its nucleus and its valence electrons (Table S5†). Together, these suggest that among the metal ions studied here, the valence electrons of high-spin Fe2+ have the highest energy. Because Fe orbitals dominate the VB of Fe2(DOBDC)(DMF)2, Fe2(DSBDC)(DMF)2, and Fe2Cl2(BTDD)(DMF)2, these high-energy electrons raise the EVBM and give rise to small Eg and Ea values. This subsequently leads to a higher probability of thermal activation at room temperature and higher charge density than available for the other metal analogs.
The same arguments do not hold for low-spin Fe2+. Because low-spin Fe2+ and 1,2,3-triazolate do not contribute charge carriers, pure Fe(1,2,3-triazolate)2 should accordingly be electrically insulating. This is indeed predicted by DFT calculations, which show that pure Fe(1,2,3-triazolate)2 exhibits a larger Eg than its Mn2+, Co2+, and Cu2+ analogs (Fig. 7c). Instead, we attribute the observed high electrical conductivity of Fe(1,2,3-triazolate)2 to the presence of a small amount of Fe3+. The presence of Fe3+, and thus the formation of a mixed-valence Fe3+/2+ system was confirmed by EPR spectroscopy (Fig. 5). Furthermore, DFT calculations suggest that mid-gap states, which effectively lower Ea and increase electrical conductivity, become available upon forming Fe3+/2+ mixed valency in Fe(1,2,3-triazolate)2. The presence of Fe3+ cannot be ruled out for the high-spin Fe2+ materials. The influence of Fe3+ would mimic that observed for Fe(1,2,3-triazolate)2. Indeed, Fe2(DOBDC)(DMF)2, Fe2(DSBDC)(DMF)2, and Fe2Cl2(BTDD)(DMF)2 are significantly more sensitive to O2 than Fe(1,2,3-triazolate)2, which makes the presence of trace amounts of Fe3+ in these materials likely. Because the oxidation potential of the other metals are not as accessible, they are less likely to be mixed valent under our experimental conditions.
Conclusions
The foregoing results show a critical, conserved role of Fe in promoting high electrical conductivity across four different MOF families comprising twenty different materials and eight different metal ions. In each family, the Fe2+-based analog exhibits electrical conductivity and activation energy values that are at least 5 orders of magnitude higher and 0.12–0.54 eV smaller, respectively, than those of materials based on Mg2+, Mn2+, Co2+, Ni2+, Cu2+, Zn2+, and Cd2+ ions. Both electronic structure and thermodynamic (i.e. redox accessibility) arguments explain the unique role of Fe within these eight metal ions. Similar arguments might provide hints for the design and discovery of electrically conductive MOFs from other metal ions. Most notably, Cr2+ is a promising candidate because it has similar ionization energy and Coulombic attraction between its nucleus and valence electrons as Fe2+, as well as an accessible Cr3+/2+ redox couple (Table S5†).More generally, our work demonstrates that mixed-valence metal ions improve the electrical conductivity in MOFs. Mixed valency is responsible for the high electrical conductivity in many inorganic solids,36 organic conductors,37,38 and coordination polymers39 because it improves charge density and facilitates charge delocalization. It is also applicable to MOFs, where both metal ions and organic ligands, if redox-active, can lead to mixed-valent states.40,41 This has been shown already with two MOFs based on 1,2,4,5-tetrahydroxybenzene and its derivatives, where the ligands coexist in the semiquinone and quinone states, which gives rise to high electrical conductivity (10−3 to 10−1 S cm−1).42,43 Therefore, redox-active metal ions and organic ligands are desirable when designing electrically conductive MOFs.
Redox matching between metal ions and organic ligands is also critical to improve electrical conductivity in MOFs.44 This requirement is not apparent in the materials studied here because in all four families the ligands are small and neighboring Fe centers have short interatomic distances (<4 Å) such that hopping can occur directly between metal centers. However, in MOFs with large intermetallic separations, organic ligands that have redox couples matched with those of the metal ions may mediate charge hopping. Conversely, redox-inactive or redox-mismatched ligands may block charge hopping. Ligands that facilitate charge transport by participating in hopping (i.e. improving metal-to-ligand charge transfer) should therefore be particularly effective in increasing electrical conductivity in MOFs that support mixed valency.
Acknowledgements
All experimental work was supported by the U.S. Department of Energy, Office of Science, Office of Basic Energy Sciences (U.S. DOE-BES, Award DE-SC0006937). M. D. thanks 3 M, the Sloan Foundation, and the Research Corporation for Science Advancement (Cottrell Scholar Program) for non-tenured faculty funds and the MISTI-Belgium fund for travel support. We thank Prof. S. J. Lippard for use of the Mössbauer spectrometer, Dr M. A. Minier for help with collecting preliminary 57Fe Mössbauer spectra, and Dr D. Sheberla and A. W. Stubbs for helpful discussions. S. S. P. is partially supported by a NSF GRFP (Award No. 1122374). A. W. is supported by the Royal Society, the EPSRC (Grant EP/M009580/1) and the ERC (Grant 277757). The computational work was facilitated by access to the UK National Supercomputer, ARCHER (EPSRC Grant EP/L000202) and access to the Extreme Science and Engineering Discovery Environment (XSEDE), which is supported by National Science Foundation Grant ACI-1053575.Notes and references
- V. Stavila, A. A. Talin and M. D. Allendorf, Chem. Soc. Rev., 2014, 43, 5994–6010 RSC.
- T. C. Narayan, T. Miyakai, S. Seki and M. Dincă, J. Am. Chem. Soc., 2012, 134, 12932–12935 CrossRef CAS PubMed.
- S. S. Park, E. R. Hontz, L. Sun, C. H. Hendon, A. Walsh, T. Van Voorhis and M. Dincă, J. Am. Chem. Soc., 2015, 137, 1774–1777 CrossRef CAS PubMed.
- L. Sun, T. Miyakai, S. Seki and M. Dincă, J. Am. Chem. Soc., 2013, 135, 8185–8188 CrossRef CAS PubMed.
- L. Sun, C. H. Hendon, M. A. Minier, A. Walsh and M. Dincă, J. Am. Chem. Soc., 2015, 137, 6164–6167 CrossRef CAS PubMed.
- A. A. Talin, A. Centrone, A. C. Ford, M. E. Foster, V. Stavila, P. Haney, R. A. Kinney, V. Szalai, F. E. Gabaly, H. P. Yoon, F. Léonard and M. D. Allendorf, Science, 2013, 343, 66–69 CrossRef PubMed.
- D. Sheberla, J. C. Bachman, J. S. Elias, C.-J. Sun, Y. Shao-Horn and M. Dincă, Nat. Mater., 2017, 16, 220–224 CrossRef CAS PubMed.
- E. M. Miner, T. Fukushima, D. Sheberla, L. Sun, Y. Surendranath and M. Dincă, Nat. Commun., 2016, 7, 10942 CrossRef CAS PubMed.
- S. Zhao, Y. Wang, J. Dong, C.-T. He, H. Yin, P. An, K. Zhao, X. Zhang, C. Gao, L. Zhang, J. Lv, J. Wang, J. Zhang, A. M. Khattak, N. A. Khan, Z. Wei, J. Zhang, S. Liu, H. Zhao and Z. Tang, Nat. Energy, 2016, 1, 16184 CrossRef.
- M. G. Campbell, D. Sheberla, S. F. Liu, T. M. Swager and M. Dincă, Angew. Chem., Int. Ed., 2015, 54, 4349–4352 CrossRef CAS PubMed.
- M. G. Campbell, S. F. Liu, T. M. Swager and M. Dincă, J. Am. Chem. Soc., 2015, 137, 13780–13783 CrossRef CAS PubMed.
- K. J. Erickson, F. Léonard, V. Stavila, M. E. Foster, C. D. Spataru, R. E. Jones, B. M. Foley, P. E. Hopkins, M. D. Allendorf and A. A. Talin, Adv. Mater., 2015, 27, 3453–3459 CrossRef CAS PubMed.
- L. Sun, M. G. Campbell and M. Dincă, Angew. Chem., Int. Ed., 2016, 55, 3566–3579 CrossRef CAS PubMed.
- F. Gándara, F. J. Uribe-Romo, D. K. Britt, H. Furukawa, L. Lei, R. Cheng, X. Duan, M. O'Keeffe and O. M. Yaghi, Chem.–Eur. J., 2012, 18, 10595–10601 CrossRef PubMed.
- X. Zhou, Y. Peng, X. Du, J. Zuo and X. You, CrystEngComm, 2009, 11, 1964–1970 RSC.
- S. Shimomura, N. Yanai, R. Matsuda and S. Kitagawa, Inorg. Chem., 2011, 50, 172–177 CrossRef CAS PubMed.
- N. L. Rosi, J. Kim, M. Eddaoudi, B. Chen, M. O'Keeffe and O. M. Yaghi, J. Am. Chem. Soc., 2005, 127, 1504–1518 CrossRef CAS PubMed.
- P. D. C. Dietzel, Y. Morita, R. Blom and H. Fjellvåg, Angew. Chem., Int. Ed., 2005, 44, 6354–6358 CrossRef CAS PubMed.
- P. D. C. Dietzel, B. Panella, M. Hirscher, R. Blom and H. Fjellvåg, Chem. Commun., 2006, 959–961 RSC.
- W. Zhou, H. Wu and T. Yildirim, J. Am. Chem. Soc., 2008, 130, 15268–15269 CrossRef CAS PubMed.
- P. D. C. Dietzel, R. Blom and H. Fjellvåg, Eur. J. Inorg. Chem., 2008, 3624–3632 CrossRef CAS.
- E. D. Bloch, L. J. Murray, W. L. Queen, S. Chavan, S. N. Maximoff, J. P. Bigi, R. Krishna, V. K. Peterson, F. Grandjean, G. J. Long, B. Smit, S. Bordiga, C. M. Brown and J. R. Long, J. Am. Chem. Soc., 2011, 133, 14814–14822 CrossRef CAS PubMed.
- R. Sanz, F. Martínez, G. Orcajo, L. Wojtas and D. Briones, Dalton Trans., 2013, 42, 2392–2398 RSC.
- W. L. Queen, M. R. Hudson, E. D. Bloch, J. A. Mason, M. I. Gonzalez, J. S. Lee, D. Gygi, J. D. Howe, K. Lee, T. A. Darwish, M. James, V. K. Peterson, S. J. Teat, B. Smit, J. B. Neaton, J. R. Long and C. M. Brown, Chem. Sci., 2014, 5, 4569–4581 RSC.
- A. J. Rieth, Y. Tulchinsky and M. Dincă, J. Am. Chem. Soc., 2016, 138, 9401–9404 CrossRef PubMed.
- F. Wudl and M. R. Bryce, J. Chem. Educ., 1990, 67, 717–718 CrossRef CAS.
- L. Sun, S. S. Park, D. Sheberla and M. Dincă, J. Am. Chem. Soc., 2016, 138, 14772–14782 CrossRef CAS PubMed.
- G. Grosso and G. Pastori Parravicini, in Solid State Physics, Academic Press, Amsterdam, Netherland, 2nd edn, 2014, pp. 609–642 Search PubMed.
- P. Gütlich, E. Bill and A. X. Trautwein, in Mössbauer Spectroscopy and Transition Metal Chemistry – Fundamentals and Applications, Springer-Verlag, Berlin, Heidelberg, Germany, 2011, pp. 73–135 Search PubMed.
- H. Rager and H. Schneider, Am. Mineral., 1986, 71, 105–110 CAS.
- R. S. Muralidhara, C. R. Kesavulu, J. L. Rao, R. V. Anavekar and R. P. S. Chakradhar, J. Phys. Chem. Solids, 2010, 71, 1651–1655 CrossRef CAS.
- A. J. Jackson, J. M. Skelton, C. H. Hendon, K. T. Butler and A. Walsh, J. Chem. Phys., 2015, 143, 184101 CrossRef PubMed.
- K. T. Butler, C. H. Hendon and A. Walsh, J. Am. Chem. Soc., 2014, 136, 2703–2706 CrossRef CAS PubMed.
- In CRC Handbook of Chemistry and Physics, Section 10 Atomic, Molecular, and Optical Physics, ed. W. M. Haynes, D. R. Lide, and T. J. Bruno, CRC Press, Boca Raton, United States, 97th edn, 2016, pp. 10-197–10-199 Search PubMed.
- In CRC Handbook of Chemistry and Physics, Section 5 Thermo, Electro & Solution Chemistry, ed. W. M. Haynes, D. R. Lide, and T. J. Bruno, CRC Press, Boca Raton, United States, 97th edn, 2016, pp. 5-78–5-84 Search PubMed.
- A. R. West, in Solid State Chemistry and Its Applications, Wiley, Chichester, United Kingdom, 2nd edn, 2014, pp. 359–444 Search PubMed.
- G. Saito and Y. Yoshida, Top. Curr. Chem., 2012, 312, 67–126 CrossRef CAS PubMed.
- A. Kobayashi, E. Fujiwara and H. Kobayashi, Chem. Rev., 2004, 104, 5243–5264 CrossRef CAS PubMed.
- G. Givaja, P. Amo-Ochoa, C. J. Gómez-García and F. Zamora, Chem. Soc. Rev., 2012, 41, 115–147 RSC.
- D. M. D'Alessandro, J. R. R. Kanga and J. S. Caddy, Aust. J. Chem., 2011, 64, 718–722 CrossRef.
- C. F. Leong, P. M. Usov and D. M. D'Alessandro, MRS Bull., 2016, 41, 858–864 CrossRef.
- L. E. Darago, M. L. Aubrey, C. J. Yu, M. I. Gonzalez and J. R. Long, J. Am. Chem. Soc., 2015, 137, 15703–15711 CrossRef CAS PubMed.
- J. A. DeGayner, I.-R. Jeon, L. Sun, M. Dincă and T. D. Harris, J. Am. Chem. Soc., 2017, 139, 4175–4184 CrossRef CAS PubMed.
- B. J. Holliday and T. M. Swager, Chem. Commun., 2005, 23–36 RSC.
- A. F. Cozzolino, C. K. Brozek, R. D. Palmer, J. Yano, M. Li and M. Dincă, J. Am. Chem. Soc., 2014, 136, 3334–3337 CrossRef CAS PubMed.
Footnotes |
| † Electronic supplementary information (ESI) available: Experimental details, PXRD patterns, IR spectra, table of electrical conductivity, table of activation energies, current density vs. electrical field strength curves, current–voltage curves at various temperatures, temperature dependence of electrical conductivity, 57Fe Mössbauer spectra, magnetic susceptibility plots, BET surface area analysis, table of various properties of divalent metal ions, and calculation details. See DOI: 10.1039/c7sc00647k |
| ‡ In M2(DOBDC)(DMF)2, M2Cl2(BTDD)(DMF)2, and M(1,2,3-triazolate)2, the MOFs are isostructural in each family, with the only difference among them being metal ions. Although Mn2(DSBDC)(DMF)2 and Fe2(DSBDC)(DMF)2 bear the same topology, the coordination environments of Mn and Fe differ. Whereas the former exhibits two crystallographically distinct Mn sites, the latter has only one crystallographically distinct Fe site (Fig. 1 and S2†). The connectivity in the (–Mn–S–)∞ chains is otherwise conserved, such that the subtle difference in the local coordination environment should not affect the electrical properties significantly. |
| § For DFT calculations, the coordinating DMF molecules were removed for M2(DOBDC) and M2(DSBDC). See detailed discussion in ESI.† |
| ¶ The spin states of Mn2+ ions in Mn2(DOBDC) and Mn(1,2,3,-triazolate)2 were reported to be S = 5/2.14,45 Variable-temperature direct-current magnetic susceptibility measurements for Mn2(DSBDC), Co2(DOBDC), and Co(1,2,3-triazolate)2 also revealed high-spin ground states for the Mn2+ and Co2+ ions, respectively. See details in the ESI, Fig. S32–S34.† |
| || The inclusion of a Co3+ in a natively Co2+ framework is not expected to introduce mid-gap states as the defect site would almost certainly be low spin. |
| This journal is © The Royal Society of Chemistry 2017 |

