 Open Access Article
Creative Commons Attribution 3.0 Unported Licence
Using a chitosan nanolayer as an efficient pH buffer to protect pH-sensitive supramolecular assemblies
D. V.
Andreeva
 a,
A.
Kollath
b,
N.
Brezhneva
cd,
D. V.
Sviridov
c,
B. J.
Cafferty
e,
H.
Möhwald
d and
E. V.
Skorb
 *df
*df
aCenter for Soft and Living Matter, Institute of basic science, Ulsan National Institute of Science and Technology, 44919 Ulsan, Republic of Korea
bPhysical Chemistry II, University of Bayreuth, Universitätsstraße 30, 95440 Bayreuth, Germany
cBelarusian State University, 4 Nezavisimosti ave., 220030 Minsk, Belarus
dMax Planck Institute of Colloids and Interfaces, Am Mühlenberg 1, 14424 Potsdam, Germany. E-mail: skorb@pikg.mpg.de
eDepartment of Chemistry and Chemical Biology, Harvard University, 02138 Cambridge, MA, USA
fLaboratory of Solution Chemistry of Advanced Materials and Technologies (SCAMT) ITMO University St. Petersburg, 197101, Russian Federation
First published on 4th July 2017
Abstract
It is attractive to control the properties of macro objects and films by employing simple nanolayer composites, as in the case of nanoarchitectured Layer-by-Layer (LbL) coating. In this paper, we use chitosan as a surface-based pH buffer to protect adsorbed supramolecular fibres from pH-mediated disassembly. Protons are generated on a titania surface under illumination at 405 nm leading to an appreciable pH change on the surface. We find that supramolecular polymers that are highly sensitive to pH change will not disassemble after irradiation if a nanolayer of chitosan is present. We propose that chitosan can be used as an efficient pH-responsive protective layer for pH sensitive soft materials.
Introduction
Recently1–3 the pH buffering activity of Layer-by-layer (LbL) assemblies of weak and strong polyelectrolytes was shown to protect metal surfaces. Local pH changes cause corrosion of metal surfaces, but binding of protons to the weak polyelectrolytes was found to inhibit the corrosion events. Thus, a nanolayer with buffering ability, resulting from the chemistry of the LbL architecture, was shown to be critical for protecting a metal surface from corrosion.A logical continuation of that work was to use local pH changes during irradiation of semiconductor surfaces.4–8 For example, local pH changes are generated by irradiation of TiO2 surfaces. Light-pH coupling in TiO2/pH sensitive LbL assemblies was shown to be efficient for high-amplitude non-destructive manipulation of soft matter deposited on the semiconductor surface.4,5 The composite systems were promising for dynamic regulation of adsorption/desorption of proteins,6 bacteria,9 and preosteoblast.5 Thus, dynamic sensors, antifouling coatings and dynamic protein separation and cleaning systems were proposed. However, the question of proton dynamics within polyelectrolyte-based LbL assemblies remains open. It is unclear if protons are buffered effectively and if pH-sensitive soft matter can be protected against acidification of the local medium.
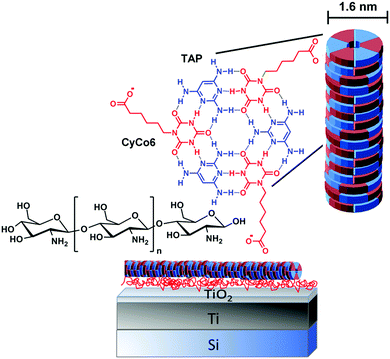
Here, we examine the ability of a chitosan nanolayer absorbed to a TiO2 surface to stabilize surface-bound supramolecular assemblies against environmental pH change (Fig. 1).
Specifically, we investigate the stability of supramolecular polymers formed by triaminopyrimidine (TAP) and cyanuric acid modified with a hexanoic acid side chain (CyCo6), supramolecular polymers that are known to be extremely sensitive to pH change.10–12
Results and discussion
First, we formed a photoactive titania surface suitable for deposition of soft-matter. It is known that the ultraviolet irradiation of photoactive titania generates electron/hole pairs that may induce a photoreaction.13 The titania is hydrophilic14 and has a layer of adsorbed water.15 Reactions with surface adsorbed water molecules can result in a possible pH change on the surface.16 In the scope of photocatalytic reactions one can assume the possible formation of H+ and OH− due to oxidation (ox) and reduction (red) reactions involving photogenerated charge carriers on the semiconductor surface. That is, water splitting on a semiconductor can cause the formation of H+ and/or OH−. We recently studied, in detail, the process of water splitting on a titania surface17 focusing on H+ and OH− (not H2 and O2 as usual (note, that there is no obvious gas bubbling in our system)) and we observed that this process leads to a pronounced local surface acidification of the irradiated surface and subsequent pH change. The overall pH does not change, although, a pH gradient on the surface may exist.17 Thus the inorganic surface and its nanostructuring may be involved in the reaction through process location (Fig. 2). | ||
| Fig. 2 Possible reorientation of titania groups and water under irradiation and reactions with photogenerated photohole (h+) and photoelectron (e−). | ||
The water oxidation reaction on TiO2 is initiated by a nucleophilic attack of a H2O molecule on the photogenerated hole at the O site bridging two Ti atoms, and as a result TiO·HO–Ti and later TiOOH and TiOOTi are formed.18 During these oxygen photoevolution reactions protons are released. At the same time, the photogenerated electrons reduce the surface Ti(4+) enabling adsorption of H2O, and then O2 attacks it immediately to form superperoxo TiOO.19 As a result a hydroxide ion OH− is released. Then it is reduced to peroxo Ti(OO) which evolves to hydroperoxo TiOOH upon protonation. At the end, the surface is covered by hydroxyl groups.
This approach can also generate a high concentration of reactive oxygen species and free radicals that may cause degradation of soft matter deposited on the surface of the semiconductor.10 In order to avoid degradation events, we produced a nanometer thick layer of TiO2via partial oxidation of a deposited layer of titania on silicon wafers. Morphological properties of the surface after sonochemical treatment were characterized in details in our previous work.20 It is important here that the ultrasonically generated nanolayer of TiO2 shows mild photoactivity under 405 nm illumination; which produces H+ on the surface. A pH indicator shows an increase in fluorescence, seen in Fig. 3, on the surface after irradiation, corresponding to a pH that is less than 5 on irradiated surface.
We were interested in knowing how many photons are needed to release enough protons from the surface to locally change the pH from 7 to 5. If, for example, a 1 cm2 surface of TiO2 is irradiated in order to achieve a pH = 5 (assuming [H+] = 10−5 M or 6 × 10¹⁸ L−1 and a coating with a thickness of 50 nm, that is, V = 5 × 10⁻¹⁰ L), then the concentration of protons in the system is [H+] = 3 × 10⁹ protons cm−2, which is about 0.003% of the lattice sites of a typical solid (1015 lattice sites cm−2). This means that only 0.003% of the surface atoms have to be charged to achieve pH = 5, if no losses exist. Even if we consider a low radiation intensity of 1 mW cm−2 = 1016 photons cm−2 s−1 for a quantum yield proton/photon conversion of 0.01% the photons from 1 ms irradiation would create enough protons on the TiO2 surface to achieve LbL activation on the surface of TiO2.
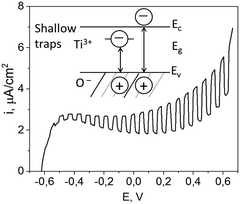
The polarization curve recorded under the chopped illumination with 405 nm laser source (shown in Fig. 4) demonstrates that the TiO2 film has a pronounced photoactivity under the illumination, with a photocurrent onset potential of −0.6 V (vs. Ag/AgCl electrode). The observed photosensitivity in the visible range could be attributed to the optical transitions involving electronic states in the forbidden zone which result from highly defective structure inherent in titania generated via intense ultrasonic treatment.20
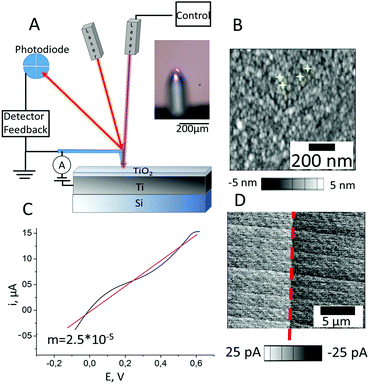
In addition to obtaining a classical I–V curve under chopped illumination we used conductive atomic force microscopy (C-AFM) to perform a local I–V study of the TiO2 surface under illumination. Fig. 5A shows the experimental set-up, there (i) we can use one extra 405 nm laser and focus it in the position of measurement, and (ii) with the use of a special metal (TiIr) tip we can study I–V in specific locations along the surface (examples are shown in yellow in Fig. 5B) and generate a current map. The C-AFM measurements were performed under ambient conditions with very sensitive current detection (from 1 pA). The C-AFM tip was used as a movable electrode to measure the I–V curves on the TiO2. Fig. 5B shows an average I–V curve that, assuming a linear fit, was used to calculate a TiO2 resistance of ca. 2.5 × 10⁻⁵ Ω−1.
In the following we will discuss how the photoactivity of the TiO2 surface and a series of photocatalytic reactions yields a local change in pH,8 and triggers conformational changes of pH sensitive soft matter. Previously,4 we demonstrated that the photons from 10 ms of light irradiation would create enough protons on the TiO2 surface to achieve conformational changes of polyelectrolytes and LbL assemblies on the surface of TiO2. It is a high priority of ours to understand how photo-initiated processes on TiO2 lead to transformation of light into an appreciable pH change, including localization of the effect.
A chitosan layer with a thickness of approximately 2 nm was deposited on titania. Angle-dependent X-ray photoelectron spectroscopy (XPS) measurements (Fig. 6) were used to calculate the layer thickness (d) by measuring the positions of titanium (Ti) atoms in the bottom layer of the surface. Such a method is commonly used to calculate the thickness of self-assembled monolayer (SAM) using the position of the surface-bound sulfur atom.21
For these measurements, the free electron mean path exponentially decays with distance. We fixed the position of the analyzer with the lens axis 50° away from the incident beam. The take-off angle (θ) was defined as the angle between the substrate surface and the axis of the analyzer. The incident angle (γ) was defined as the angle between beam incidence and the substrate surface. We rotated the sample holder to collect the Ti2p with θ = 90° (normal emission, γ = 40°) and θ = 40° (normal emission, γ = 90°). To normalize the footprint of incident light between two different angles, the effective intensity (Iθ) is given by
Iθ = I![[thin space (1/6-em)]](https://www.rsc.org/images/entities/i_char_2009.gif) cos(90° − γ) cos(90° − γ) | (1) |
| Iθ = Ie−d/λsinθ | (2) |
 | (3) |
 | (4) |
We also examined the chitosan layer using AFM with simultaneous irradiation of the surface with 405 nm laser before (Fig. 7A and C), during (Fig. 7B and D) and after irradiation (Fig. 8).
 | ||
| Fig. 8 AFM images showing the change of chitosan layer morphology during relaxation of the surface: in 1 min (A), and 10 min (B) after irradiation. | ||
The AFM images (Fig. 4A–D) confirm that the surface of chitosan increases in net positive charge under irradiation. For comparison, the effect of smoothing of the chitosan layer by decreasing the solution pH was observed previously by Lee et al.20 and was explained to result from a change of surface forces due to chitosan protonation. Here, irradiation triggers a local pH change on the semiconductor, and also may cause protonation of chitosan. It is important to note that the layer of chitosan under irradiation remains on the surface and is not detached. An explanation for the stability of the protonated nanolayer on the surface is that together with the rearrangement and structural change of chitosan chains upon protonation, ion diffusion/migration and charge regulation, chitosan forms structured hydrogen-bond networks in humid environments and a practically semicrystalline phase structure. This rigid behavior of chitosan may be a big advantage for using a chitosan nanolayer over other weak polyelectrolyte nanolayers for providing polyelectrolyte assembly stability.
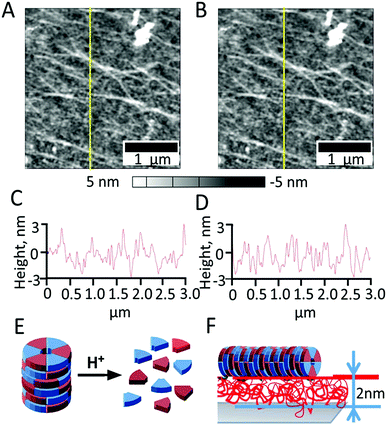
We next employed pH indicators to compare photoinduced pH changes at the surface of pristine TiO2 covered with chitosan (Fig. 7F) vs. bare TiO2 (Fig. 3), to support the buffering activity of the chitosan layer. The pH indicator under irradiation didn’t show any fluorescence when surfaces of TiO2 containing a chitosan layer were analyzed, suggesting that the released protons are absorbed by chitosan molecules on the surface, effectively buffering the pH.
After the irradiation is stopped (Fig. 8), slow relaxation of the chitosan film is observed and the polymer layer reaches an equilibrium within app. 10 min. The blurriness of the AFM images can be explained due to simultaneous changes in the surface structure as a result of chitosan relaxation during acquisition.
We next examined the ability of the chitosan nanolayer to protect supramolecular structures from disassembly caused by environmental pH-change (Fig. 9). We chose TAP-CyCo6-based supramolecular polymers due to their ultrasensitive pH response.10 Supramolecular polymers are formed in water by combining TAP and CyCo6. The monomers self-assemble into hexameric rosette structures, and hydrophobic interactions between rosettes lead to the formation of micron-length supramolecular polymers.12 The bidirectional pH-response of this supramolecular polymer system results from the presence of an acidic monomer (Cyco6) and a basic monomer (TAP). The pH response is highly sensitive because the pKas of the monomers are matched at 7, therefore any change in pH from neutrality will cause disassembly of the supramolecular polymers, with complete disassembly at pH below 5.5 and above 8.5.
We next examined if the chitosan nanolayer has enough buffering activity to protect the TAP-CyCo6 supramolecular polymers from pH-mediated disassembly caused by irradiation of the titanium surface (Fig. 6E). The supramolecular polymers were formed in water buffered with sodium phosphate at pH 6.5 and then deposited on the chitosan nanolayer. The AFM image of the surface after TAP-CyCo6 fiber deposition is shown in Fig. 6.
Next, irradiation resulted in photoreactions on the TiO2 surface4 leading to acidification in irradiated areas. As discussed above, in the absence of chitosan the surface pH would be expected to drop to pH 5, which would disassemble the supramolecular structures. The assemblies were, however, still observed after irradiation, even when irradiation was performed with a laser power of 9 mW for 10 min, demonstrating that chitosan nanolayer has a strong buffering capacity Fig. 6F.
Conclusions
In order to develop applications for chitosan-based materials, it will be essential to understand the efficiency of chitosan as a buffering material. Here we report that a chitosan nanolayer can be utilized as a proton sponge, thus protecting the integrity of supramolecular assemblies (even those that are highly sensitive to pH variation, such as TAP-CyCo6 assemblies) to surface-mediated pH changes. We provide further evidence here that due to the unique characteristics of chitosan chains, caused in part by charge pairing with TiO2 and the rigidity of the chains,22 chitosan may strongly interact with TiO2 and prevent penetration of protons through the chitosan nanolayer, thus protecting supramolecular assemblies associated with the nanolayer surface.Thus we find that nanolayers of chitosan can be used in the development of surface-based material that are otherwise sensitive to environmental pH change. Particularly, for materials used in double stimuli-responsive devices that are incorporated in living systems, as chitosan exhibits pH protective properties near physiological pH. In spite of many applications of chitosan, there have been few systematic studies conducted with regard to the chitosan nanolayer buffering activity on surfaces.
Experimental
Materials
Silicon (Si) wafers (100) were from CrysTech Kristralltechnologie. Absolute ethanol AnalR NORMAPUR from VWR Chemicals was used as received. Low molecular weight chitosan, acquired from Aldrich with a molecular weight between 50![[thin space (1/6-em)]](https://www.rsc.org/images/entities/char_2009.gif) 000 and 190
000 and 190![[thin space (1/6-em)]](https://www.rsc.org/images/entities/char_2009.gif) 000 Da and a degree of deacetylation (DA) ≥75% was used as received for experiments. Acetic acid was purchased from EMD. Hydrochloric acid (1 M, HCl) and sodium hydroxide (1 M, NaOH) were acquired from Grüssing. Millipore water (Milli-Q Plus 185) was used for preparation of aqueous solutions and sample washing.
000 Da and a degree of deacetylation (DA) ≥75% was used as received for experiments. Acetic acid was purchased from EMD. Hydrochloric acid (1 M, HCl) and sodium hydroxide (1 M, NaOH) were acquired from Grüssing. Millipore water (Milli-Q Plus 185) was used for preparation of aqueous solutions and sample washing.
Titania photoactive layer preparation
Si wafers with polished surface were used as substrate for titanium layers of 2 μm thickness deposited by physical vapour deposition using a BA 510 from Fa. Balzers, Liechtenstein. Ti covered Si wafers were fixed in a homemade sample holder for high intensity ultrasound (HIUS) modification. The samples were sonicated for 1 min in ethanol at a sonotrode to surface distance of 5 mm. Cavitation was produced by a UIP1000hd ultrasonic device from Hielscher Ultrasound Technology equipped with a B2-1.8 booster and a BS2d22 sonotrode (head area 3.8 cm2). The operating frequency was 20 kHz with a maximum intensity of 140 W cm−2 and an amplitude of 106 μm. The sonication medium was cooled using an ice bath to approximately 333 K.20Chitosan assembly
Chitosan solution was prepared by dissolving 50 mg of chitosan in 4.95 ml of 1 wt% acetic acid to obtain 1 wt% chitosan solutions (pH ≈ 4). The pH of the chitosan solution was increased to pH 6.5 by addition of aqueous sodium hydroxide solution (0.1 M). Chitosan solution was deposited on the chosen substrates for 10 min by depositing drops of chitosan solution onto the substrates. Afterwards, the substrates were dried using an air pistol. The surface was washed twice.Supramolecular assembly
For details on the synthesis of CyCo6 and TAP-CyCo6 supramolecular polymer formation and characterization see ref. 10 Briefly, supramolecular fibers were formed by combining TAP and CyCo6 at 50 mM in an aqueous solution containing 200 mM sodium phosphate (pH 6.5). The solution was then deposited onto a substrate, which had first been prepared with chitosan. The substrate was then washed once with ice-cooled water to remove excess assemblies and phosphate buffer.Surface characterization was performed using a Cypher S Atomic Force Microscope (AFM) from Asylum Research (Santa Barbara, California) equipped with an OTESPA-R3 Bruker cantilever with a spring constant of 26 N m−1 and a frequency of 300 kHz for imaging purposes. For in situ irradiation experiments, Asylum Research AC160TS-R3 cantilevers were used with spring constant and frequency corresponding to the OTESPA-R3 Bruker cantilever. The cantilevers were coated with Al in both cases. AFM imaging was carried out in tapping mode. Contact mode was used for conductive AFM using an ORCA cantilever holder (nA, μA) and an Asylum Research ASYELEC-01 cantilever with a spring constant of 2 N m−1 and a frequency of 70 kHz. The cantilevers were coated with TiIr with a tip radius of 28+/110 nm. Current–voltage curves were collected from specific surface positions in contact mode driving the sample surface from −4 to +4 V. Current maps of the surface were carried out in contact mode applying no surface bias. A blue laser with a wavelength of 405 nm incorporated into the Cypher S AFM was used as irradiation source. Irradiation power of the laser and irradiation time were varied between 2–9 mW and 1–10 min. The generally chosen laser power of 2 mW corresponds to a laser intensity of approximately 6 μW μm−2 given the laser diameter to be approximately 20 μm. An AFM image of the same surface position was taken after every irradiation cycle of 1 min with either the same or increasing laser power. AFM images were analyzed using the Asylum AR14 software. Current–voltage curves were analyzed using Origin Pro.
Photoelectrochemical measurements were performed using a three-electrode quartz cell using titania samples as a working electrode (WE), Pt wire as a counter electrode (CE) and Ag/AgCl (1 M KCl) as a reference electrode (RE) in 0.1 M NaOH solution. The measurements were carried out using a CompactStat potentiostat (Ivium Technologies, the Netherlands). The photodiode with wavelength λ = 410 nm was used as a source of light and kept at a distance 5 cm away from the quartz cell.
X-ray photoelectron spectroscopy (XPS)
Measurements were performed at the X-ray photoelectron spectroscopy (XPS) measurements were performed with a Scienta ESCA-300 spectrometer. The spectra were taken using a monochromatized aluminum source Al Kα (E = 1487 eV), MX-650 VG Scienta. The base pressure in the analytical chamber was 5 × 10⁻⁹ mbar. The spectra acquisition was carried out in normal emission geometry with analyzer energy resolution of 0.15 eV. To probe the Ti 2p, C 1s, N 1s and O 1s, their excitation energies were used. The spectra were acquired in normal emission geometry, and the resolution was better than 0.1 eV. The spatial depth distribution of the different elements in the film, XPS spectra were taken at normal emission (90° take-off-angle) and grazing emission (10°) of the photoelectrons and compared. The uncertainty of ±2 Å takes into account the fitting errors and the angular misalignment due to sample mounting.Acknowledgements
This work was supported by the projects A11 SFB840, and RSCF grant no. 17-79-20186. A. K. thanks also the Elite Network Bavaria. We thank Olga Baidukova for the help with system discussion. Open Access funding provided by the Max Planck Society.Notes and references
- D. V. Andreeva, D. Fix, H. Möhwald and D. G. Shchukin, Adv. Mater., 2008, 20, 2789 CrossRef CAS PubMed.
- E. V. Skorb, D. Fix, D. V. Andreeva, H. Möhwald and D. G. Shchukin, Adv. Funct. Mater., 2009, 19, 2373 CrossRef CAS.
- D. V. Andreeva, E. V. Skorb and D. G. Shchukin, ACS Appl. Mater. Interfaces, 2010, 2, 1954 CAS.
- S. A. Ulasevich, G. Brezesinski, H. Möhwald, P. Fratzl, F. H. Schacher, S. K. Poznyak, D. V. Andreeva and E. V. Skorb, Angew. Chem., Int. Ed., 2016, 55, 13001 CrossRef CAS PubMed.
- S. A. Ulasevich, N. Brezhneva, Y. Zhukova, H. Möhwald, P. Fratzl, F. H. Schacher, D. V. Sviridov, D. V. Andreeva and E. V. Skorb, Macromol. Biosci., 2016, 16, 1422 CrossRef CAS PubMed.
- D. V. Andreeva, I. Melnyk, O. Baidukova and E. V. Skorb, ChemElectroChem, 2016, 3, 1306 CrossRef CAS.
- Y. Zhukova and E. V. Skorb, Adv. Healthcare Mater., 2017, 6, 1600914 CrossRef PubMed.
- E. V. Skorb, H. Möhwald and D. V. Andreeva, Adv. Mater. Interfaces, 2017, 4, 1600282 CrossRef.
- J. Gensel, T. Borke, N. Pazos-Perez, A. Fery, D. V. Andreeva, E. Betthausen, A. H. E. Müller and E. V. Skorb, Adv. Mater., 2012, 24, 985 CrossRef CAS PubMed.
- B. J. Cafferty, R. R. Avirah, G. B. Schustera and N. V. Hud, Chem. Sci., 2014, 5, 4681 RSC.
- C. Li, B. J. Cafferty, S. C. Karunakaran, G. B. Schustera and N. V. Hud, Phys. Chem. Chem. Phys., 2016, 18, 20091 RSC.
- B. J. Cafferty, I. Gállego, M. C. Chen, K. I. Farley, R. Eritja and N. V. Hud, J. Am. Chem. Soc., 2013, 135, 2447 CrossRef CAS PubMed.
- E. V. Skorb, L. I. Antonouskaya, N. A. Belyasova, D. G. Shchukin, H. Möhwald and D. V. Sviridov, Appl. Catal., B, 2008, 84, 94 CrossRef CAS.
- E. V. Skorb, E. A. Ustinovich, A. I. Kulak and D. V. Sviridov, J. Photochem. Photobiol., A, 2008, 193, 97 CrossRef CAS.
- Z. Zhang, K. Yao, Y. Liu, C. Jin, X. Liang, Q. Chen and L.-M. Peng, Adv. Funct. Mater., 2007, 17, 2478 CrossRef CAS.
- E. V. Skorb, D. G. Shchukin, H. Möhwald and D. V. Sviridov, J. Mater. Chem., 2009, 19, 4931 RSC.
- H. Maltanava, S. K. Poznyak, D. V. Andreeva, M. C. Quevedo, A. C. Bastos, J. Tedim, M. G. S. Ferreira and E. V. Skorb, ACS Appl. Mater. Interfaces, 2017 DOI:10.1021/acsami.7b05209.
- R. Nakamura and Y. Nakato, J. Am. Chem. Soc., 2004, 126, 1290 CrossRef CAS PubMed.
- R. Nakamura, A. Imanishi, K. Murakoshi and Y. Nakato, J. Am. Chem. Soc., 2003, 125, 7443 CrossRef CAS PubMed.
- A. Kollath, N. Brezhneva, E. V. Skorb and D. V. Andreeva, Phys. Chem. Chem. Phys., 2017, 19, 6286 RSC.
- O. Dannenberger, K. Weiss, H. J. Himmel, B. Jager, M. Buck and C. Woll, Thin Solid Films, 1997, 307, 183 CrossRef CAS.
- D. W. Lee, C. Lim, J. N. Israelachvili and D. S. Hwang, Langmuir, 2013, 29, 14222 CrossRef CAS PubMed.
| This journal is © the Owner Societies 2017 |


