 Open Access Article
Recent research progress of polymer donor/polymer acceptor blend solar cells
Hiroaki
Benten
*,
Daisuke
Mori
,
Hideo
Ohkita
and
Shinzaburo
Ito
Department of Polymer Chemistry, Graduate School of Engineering, Kyoto University, Katsura, Nishikyo, Kyoto 615-8510, Japan. E-mail: benten@photo.polym.kyoto-u.ac.jp; Fax: +81 75 383 2617; Tel: +81 75 383 2614
First published on 25th February 2016
Abstract
Polymer/polymer blend solar cells based on a blend of two types of conjugated polymers acting as an electron donor (hole transport) and acceptor (electron transport) have recently attracted considerable attention, because they have numerous potential advantages over conventional polymer/fullerene blend solar cells. The highest power conversion efficiency (PCE) was slightly above 2% five years ago, whereas PCEs of beyond 8% are the state-of-the-art today, and the efficiency gap between polymer/polymer and polymer/fullerene systems has closed very rapidly. In this review, we provide an overview of recent progress towards the performance enhancement of polymer/polymer blend solar cells. In addition, we discuss the future outlook and challenges regarding PCEs beyond 10%.
1. Introduction
The continued increase in energy consumption worldwide necessitates the development of a global energy supply based on limitless resources, which should also generate less greenhouse gases than fossil-fuel-based energy sources. In this regard, the exploitation of photovoltaic energy is a promising approach that has the potential to solve the energy supply problems emerging in the foreseeable future. In particular, organic photovoltaics (OPVs) have gained increasing attention as an inexpensive source of renewable energy owing to their unique advantages, which include high throughput and large-area production with low-cost printing processes.1,2 Among the various OPVs, the most widely studied solar cells consist of a bulk-heterojunction (BHJ) structure in which a conjugated polymer is mixed with a low-molecular-weight fullerene derivative.3–5 In these systems, the conjugated polymer acts as an electron donor and the fullerene derivative acts as an electron acceptor. The power conversion efficiency (PCE) of polymer/fullerene blend solar cells has been enhanced significantly over the past two decades, and exceeds 10% in single-junction cells.6–9On the other hand, polymer/polymer blend solar cells that utilize conjugated polymers as both an electron donor and an electron acceptor have recently attracted considerable attention, because they have numerous potential advantages over conventional polymer/fullerene blend solar cells.10–13 In particular, the flexible molecular design of not only the donor, but also the acceptor material provides extensive scope for tuning the optical, electronic, morphological, and mechanical properties of the blended films. For instance, conjugated polymers have high absorption coefficients (α) in the visible and near-infrared (IR) spectral regions. Therefore, polymer/polymer blends can harvest a large fraction of solar light, leading to a large short-circuit photocurrent density (JSC). Furthermore, the adjustment of the highest occupied molecular orbital (HOMO) and lowest unoccupied molecular orbital (LUMO) levels of the donor and acceptor polymers allows the open-circuit voltage (VOC) to increase above 1 V. In addition, the formation of a phase-separated interpenetrating polymer network offers a continuous pathway for charge carrier transport, for wide ranges of donor and acceptor material blending ratios, leading to a high fill factor (FF). Finally, all-polymer blends yield superior thin-film formation properties, including flexibility and mechanical robustness, which are extremely beneficial for the large-scale production of solar cell modules via solution processes.14
As a result of their many advantages, various polymer acceptors have been considered as an alternative to fullerene derivatives such as [6,6]-phenyl-C61-butyric acid methyl ester (PCBM); however, the majority of these polymers have exhibited significantly lower electron mobility (μe) than the fullerene derivatives. Moreover, the BHJ phase-separated structures are typically larger in polymer/polymer blends than in polymer/fullerene blends, resulting in lower charge generation efficiency. Consequently, despite the attractive features of these materials, the development of polymer/polymer blend solar cells has lagged behind that of their polymer/fullerene counterparts, with the PCEs of the former being approximately 2% until 2012. Very recently, however, significant strides have been made towards enhancing the PCEs of polymer/polymer blend solar cells, owing to considerable efforts expended on developing low-bandgap polymer acceptors with both high-μe and high electron affinity (similar to those of fullerene derivatives) and, also, attempts to optimize the blend morphology.
In this review, we briefly present the fundamental characteristics of polymer/polymer blend solar cells, provide an overview of recent progress towards enhancing their photovoltaic performance, and discuss research on the optimal blend morphology and free charge-carrier generation at donor/acceptor heterojunctions of polymer blends. Finally, we discuss the future outlook and challenges regarding the achievement of PCEs of 10% and higher.
2. Operation of polymer/polymer blend solar cells
2.1 Blend morphology for BHJs
Blends of two different polymers are likely to form a large phase-separated structure; this is an inherent characteristic of polymers with a long main chain. According to the Flory–Huggins theory,15,16 the change in the Gibbs free energy when two polymers are mixed (ΔGmix) can be derived as follows: | (1) |
2.2 Photovoltaic conversion mechanism
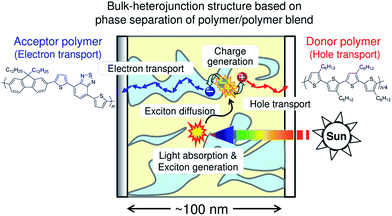
Fig. 1 is a schematic illustration of the working mechanism of polymer/polymer blend solar cells. Photovoltaic conversion processes can be divided into several sequential processes: (1) absorption of an incident photon by the constituent polymers, leading to the formation of polymer singlet excitons; (2) diffusion of the excitons to a donor/acceptor domain interface (heterojunction); (3) charge transfer at the interface driven by either the LUMO–LUMO or HOMO–HOMO energy offsets of the donor and acceptor polymers, along with dissociation of the interfacial charge transfer state into free charge carriers; and (4) transport of the free charge carriers to the anode and cathode through bicontinuous networks of donor (hole-transporting) and acceptor (electron-transporting) polymers.10,11,22–25 As a result, the incident photon energy can be converted into electricity and a direct current is supplied to an external circuit. Among these conversion processes, exciton diffusion to the domain interface is particularly important, because the diffusion length of a polymer singlet exciton (LD) is typically as short as only 10 nm.17–21 Therefore, excitons generated at a distance of more than 10 nm from the donor/acceptor domain interface cannot contribute to the photocurrent generation. In addition, even if charge carriers are converted from the excitons, the charges generated in isolated polymer domains cannot be transported by the electrodes. The overall photovoltaic performance is, thus, significantly affected by the morphological characteristics of the blends, such as the domain size, domain composition (purity), and domain connectivity. The ideal BHJ structure for efficient charge generation and transport is considered to be a nanostructured blend based on bicontinuous interpenetrating networks of pure donor and acceptor domains with a characteristic spacing length of ∼10 nm, which is comparable to LD.3. Efficiency enhancement of polymer/polymer blend solar cells over the past decade
Here, we describe the research progress with regard to the efficiency enhancement of polymer/polymer blend solar cells over the past decade. The solar cell performances of the devices discussed in this section are summarized in Table 1. Fig. 2 shows selected PCEs reported for polymer/polymer blend solar cells over the past 10 years. Although the PCE remained at approximately 2% for a long period of time, it increased rapidly from 2012 onwards, and PCEs of over 8% have already been reported. In Fig. 3, these PCEs are plotted as functions of the corresponding device parameters: JSC, VOC, and FF. Among the device parameters, an increase in JSC is most strongly correlated with an increase in PCE (see the broken line in Fig. 3a). As indicated by the various symbols in Fig. 2 and 3, the enhancement of polymer/polymer blend solar cell efficiency can be discussed by considering the development of polymer acceptors.| Donor | Acceptor | D![[thin space (1/6-em)]](https://www.rsc.org/images/entities/char_2009.gif) : :![[thin space (1/6-em)]](https://www.rsc.org/images/entities/char_2009.gif) A blend ratio (w/w) A blend ratio (w/w) |
Thickness (nm) | PCE (%) | J SC (mA cm−2) | V OC (V) | FF | EQEmax (%) | μ h (cm2 V−1 s−1) | μ e (cm2 V−1 s−1) | Device type | Ref. | |
|---|---|---|---|---|---|---|---|---|---|---|---|---|---|
| 2015 | J51 | P(NDI2OD-T2) | 2![[thin space (1/6-em)]](https://www.rsc.org/images/entities/char_2009.gif) : :![[thin space (1/6-em)]](https://www.rsc.org/images/entities/char_2009.gif) 1 1 |
120 | 8.27 | 14.18 | 0.83 | 0.702 | 75 | 2.50 × 10⁻⁴ | 2.16 × 10⁻⁴ | Normal | 77 |
| 2015 | PTB7-Th | PNDIS-HD | 1![[thin space (1/6-em)]](https://www.rsc.org/images/entities/char_2009.gif) : :![[thin space (1/6-em)]](https://www.rsc.org/images/entities/char_2009.gif) 1 1 |
115 | 7.73 | 18.8 | 0.81 | 0.51 | 85 | 3.11 × 10⁻⁴ | 7.25 × 10⁻³ | Inverted | 76 |
| 2015 | PTB7-Th | P(NDI2DT-FT2) | 1![[thin space (1/6-em)]](https://www.rsc.org/images/entities/char_2009.gif) : :![[thin space (1/6-em)]](https://www.rsc.org/images/entities/char_2009.gif) 1 1 |
110 | 6.71 | 13.53 | 0.81 | 0.62 | 66 | 5.50 × 10⁻⁴ | 4.90 × 10⁻⁴ | Inverted | 75 |
| 2015 | PBDTTTPD | PNDIT-HD | 1.3![[thin space (1/6-em)]](https://www.rsc.org/images/entities/char_2009.gif) : :![[thin space (1/6-em)]](https://www.rsc.org/images/entities/char_2009.gif) 1 1 |
130 | 6.64 | 11.22 | 1.06 | 0.56 | 70 | 2.84 × 10⁻⁵ | 1.55 × 10⁻⁵ | Normal | 14 |
| 2015 | PBDTTT-C-T | 30PDI | 1![[thin space (1/6-em)]](https://www.rsc.org/images/entities/char_2009.gif) : :![[thin space (1/6-em)]](https://www.rsc.org/images/entities/char_2009.gif) 1 1 |
90 | 6.29 | 18.55 | 0.79 | 0.45 | 91 | 2.60 × 10⁻³ | 1.00 × 10⁻³ | Inverted | 74 |
| 2015 | PTB7-Th | PNDIT-HD | 1.3![[thin space (1/6-em)]](https://www.rsc.org/images/entities/char_2009.gif) : :![[thin space (1/6-em)]](https://www.rsc.org/images/entities/char_2009.gif) 1 1 |
90–100 | 5.96 | 13.46 | 0.79 | 0.56 | 70 | 2.80 × 10⁻⁴ | 8.40 × 10⁻⁴ | Inverted | 73 |
| 2015 | PBDTBDD-T | P(NDI2OD-T2) | 1![[thin space (1/6-em)]](https://www.rsc.org/images/entities/char_2009.gif) : :![[thin space (1/6-em)]](https://www.rsc.org/images/entities/char_2009.gif) 1 1 |
85–90 | 5.8 | 11.7 | 0.87 | 0.575 | 55 | 1.10 × 10⁻³ | — | Normal | 72 |
| 2015 | PTB7-Th | P(NDI2OD-T2) | 1![[thin space (1/6-em)]](https://www.rsc.org/images/entities/char_2009.gif) : :![[thin space (1/6-em)]](https://www.rsc.org/images/entities/char_2009.gif) 1 1 |
100 | 5.2 | 13.9 | 0.74 | 0.49 | 60 | — | — | Normal | 62 |
| 2015 | PPDT2FBT | P(NDI2OD-T2) | 1![[thin space (1/6-em)]](https://www.rsc.org/images/entities/char_2009.gif) : :![[thin space (1/6-em)]](https://www.rsc.org/images/entities/char_2009.gif) 0.7 0.7 |
90–100 | 5.1 | 11.9 | 0.85 | 0.51 | 59 | 2.00 × 10⁻⁴ | 4.70 × 10⁻⁵ | Normal | 71 |
| 2015 | PTP8 | P(NDI2OD-T2) | 2![[thin space (1/6-em)]](https://www.rsc.org/images/entities/char_2009.gif) : :![[thin space (1/6-em)]](https://www.rsc.org/images/entities/char_2009.gif) 1 1 |
92 | 4.35 | 8.43 | 0.978 | 0.528 | 46–47 | 4.78 × 10⁻⁵ | 8.48 × 10⁻⁵ | Normal | 70 |
| 2015 | PTQ1 | P(NDI2OD-T2) | 7![[thin space (1/6-em)]](https://www.rsc.org/images/entities/char_2009.gif) : :![[thin space (1/6-em)]](https://www.rsc.org/images/entities/char_2009.gif) 3 3 |
100 | 3.9 | 8.02 | 0.85 | 0.57 | 45 | 6.27 × 10⁻⁵ | 1.02 × 10⁻⁴ | Normal | 62 |
| 2015 | PBDTTT-C-T | PNDIBTOC8 | 6![[thin space (1/6-em)]](https://www.rsc.org/images/entities/char_2009.gif) : :![[thin space (1/6-em)]](https://www.rsc.org/images/entities/char_2009.gif) 4 4 |
— | 3.14 | 7.65 | 0.9 | 0.456 | 33 | 4.20 × 10⁻⁴ | 2.80 × 10⁻⁴ | Normal | 69 |
| 2015 | PTB7-Th | PQP | 1![[thin space (1/6-em)]](https://www.rsc.org/images/entities/char_2009.gif) : :![[thin space (1/6-em)]](https://www.rsc.org/images/entities/char_2009.gif) 1 1 |
— | 3.08 | 7.72 | 0.7 | 0.57 | 38 | 1.34 × 10⁻⁴ | 1.75 × 10⁻⁷ | Normal | 68 |
| 2015 | P3HT | PDPP2TzT | 2![[thin space (1/6-em)]](https://www.rsc.org/images/entities/char_2009.gif) : :![[thin space (1/6-em)]](https://www.rsc.org/images/entities/char_2009.gif) 1 1 |
115 | 3 | 7.8 | 0.64 | 0.61 | 30 | — | — | Inverted | 67 |
| 2015 | PBDTBDD-T | PBDTNDI-T | 1.5![[thin space (1/6-em)]](https://www.rsc.org/images/entities/char_2009.gif) : :![[thin space (1/6-em)]](https://www.rsc.org/images/entities/char_2009.gif) 1 1 |
— | 2.88 | 5.62 | 0.86 | 0.596 | 43 | — | — | Normal | 66 |
| 2015 | PTB7 | PCPDT-PDI | 1![[thin space (1/6-em)]](https://www.rsc.org/images/entities/char_2009.gif) : :![[thin space (1/6-em)]](https://www.rsc.org/images/entities/char_2009.gif) 1 1 |
80–90 | 2.13 | 7.25 | 0.7 | 0.42 | 34 | 1.30 × 10⁻⁴ | 9.80 × 10⁻⁶ | Normal | 63 |
| 2015 | PBDTTT-C-T | C3 | 1![[thin space (1/6-em)]](https://www.rsc.org/images/entities/char_2009.gif) : :![[thin space (1/6-em)]](https://www.rsc.org/images/entities/char_2009.gif) 1 1 |
— | 1.85 | 4.75 | 0.79 | 0.49 | 19.6 | 1.80 × 10⁻⁴ | 1.00 × 10⁻⁴ | Normal | 65 |
| 2015 | P3HT | PPDI25-co-NDI75 | 3![[thin space (1/6-em)]](https://www.rsc.org/images/entities/char_2009.gif) : :![[thin space (1/6-em)]](https://www.rsc.org/images/entities/char_2009.gif) 1 1 |
— | 1.54 | 3.62 | 0.68 | 0.624 | 22.5 | 3.70 × 10⁻⁴ | 3.00 × 10⁻⁵ | Normal | 64 |
| 2015 | PTB7 | PCPDT-NDI | 1![[thin space (1/6-em)]](https://www.rsc.org/images/entities/char_2009.gif) : :![[thin space (1/6-em)]](https://www.rsc.org/images/entities/char_2009.gif) 1 1 |
80–90 | 1.12 | 3.85 | 0.74 | 0.39 | — | — | — | Normal | 63 |
| 2015 | P3HT | P(NDI2OD-T2) | 1![[thin space (1/6-em)]](https://www.rsc.org/images/entities/char_2009.gif) : :![[thin space (1/6-em)]](https://www.rsc.org/images/entities/char_2009.gif) 1 1 |
100 | 0.65 | 2.53 | 0.49 | 0.53 | 19 | — | — | Normal | 62 |
| 2014 | PTB7-Th | P(NDI2OD-T2) | 1![[thin space (1/6-em)]](https://www.rsc.org/images/entities/char_2009.gif) : :![[thin space (1/6-em)]](https://www.rsc.org/images/entities/char_2009.gif) 1 1 |
100 | 5.73 | 13 | 0.794 | 0.556 | 60 | 3.40 × 10⁻⁴ | 3.60 × 10⁻⁴ | Normal | 61 |
| 2014 | NT | P(NDI2OD-T2) | 1![[thin space (1/6-em)]](https://www.rsc.org/images/entities/char_2009.gif) : :![[thin space (1/6-em)]](https://www.rsc.org/images/entities/char_2009.gif) 1 1 |
90 | 5 | 11.5 | 0.77 | 0.56 | 52–53 | 2.50 × 10⁻⁴ | 6.90 × 10⁻⁴ | Inverted | 60 |
| 2014 | PSEHTT | PNDIS-HD | 1![[thin space (1/6-em)]](https://www.rsc.org/images/entities/char_2009.gif) : :![[thin space (1/6-em)]](https://www.rsc.org/images/entities/char_2009.gif) 1 1 |
70–80 | 4.81 | 10.47 | 0.76 | 0.6 | 61.3 | 5.40 × 10⁻⁴ | 2.60 × 10⁻⁴ | Inverted | 59 |
| 2014 | PTB7-Th | P(NDI2OD-T2) | 1.3![[thin space (1/6-em)]](https://www.rsc.org/images/entities/char_2009.gif) : :![[thin space (1/6-em)]](https://www.rsc.org/images/entities/char_2009.gif) 1 1 |
110–120 | 4.6 | 10.61 | 0.821 | 0.53 | 53.6 | 4.20 × 10⁻⁴ | 6.70 × 10⁻⁶ | Inverted | 58 |
| 2014 | Pil-2T-PS5 | P(TP) | — | 93 | 4.21 | 8.77 | 1.04 | 0.46 | 46 | 2.00 × 10⁻⁴ | 2.00 × 10⁻⁵ | Inverted | 57 |
| 2014 | PBDTTT-C-T | P(PDI-DTT) | 1![[thin space (1/6-em)]](https://www.rsc.org/images/entities/char_2009.gif) : :![[thin space (1/6-em)]](https://www.rsc.org/images/entities/char_2009.gif) 1 1 |
60–85 | 3.45 | 8.55 | 0.752 | 0.515 | 43 | 2.64 × 10⁻⁴ | 3.37 × 10⁻⁵ | Normal | 56 |
| 2014 | PTB7 | P(NDI2OD-T2) | 1![[thin space (1/6-em)]](https://www.rsc.org/images/entities/char_2009.gif) : :![[thin space (1/6-em)]](https://www.rsc.org/images/entities/char_2009.gif) 1.5 1.5 |
120 | 2.66 | 6.28 | 0.799 | 0.53 | 27 | 3.90 × 10⁻⁶ | 4.80 × 10⁻⁴ | Inverted | 55 |
| 2014 | P3HT | P(NDI2OD-T2) | 1![[thin space (1/6-em)]](https://www.rsc.org/images/entities/char_2009.gif) : :![[thin space (1/6-em)]](https://www.rsc.org/images/entities/char_2009.gif) 0.75 0.75 |
310 | — | — | — | 0.67 | — | 1.20 × 10⁻³ | 4.00 × 10⁻³ | Normal | 54 |
| 2014 | P3HT | P(NDI2OD-T2) | 1![[thin space (1/6-em)]](https://www.rsc.org/images/entities/char_2009.gif) : :![[thin space (1/6-em)]](https://www.rsc.org/images/entities/char_2009.gif) 0.75 0.75 |
310 | — | — | — | 0.5 | — | 2.00 × 10⁻³ | 7.00 × 10⁻³ | Normal | 54 |
| 2014 | P3HT | F8TBT | 1![[thin space (1/6-em)]](https://www.rsc.org/images/entities/char_2009.gif) : :![[thin space (1/6-em)]](https://www.rsc.org/images/entities/char_2009.gif) 1 1 |
80 | 1.87 | 3.29 | 1.35 | 0.42 | 20 | — | — | Normal | 53 |
| 2014 | P3HT | PFDTBT-OC6 | 1![[thin space (1/6-em)]](https://www.rsc.org/images/entities/char_2009.gif) : :![[thin space (1/6-em)]](https://www.rsc.org/images/entities/char_2009.gif) 2 2 |
80 | 1.80 | 2.93 | 1.36 | 0.45 | 22 | — | — | Normal | 52 |
| 2013 | PTQ1 | P(NDI2OD-T2) | 7![[thin space (1/6-em)]](https://www.rsc.org/images/entities/char_2009.gif) : :![[thin space (1/6-em)]](https://www.rsc.org/images/entities/char_2009.gif) 3 3 |
85 | 4.1 | 8.85 | 0.84 | 0.55 | 50 | 1.13 × 10⁻⁵ | 2.58 × 10⁻³ | Normal | 51 |
| 2013 | TTV7 | PC-NDI | 2![[thin space (1/6-em)]](https://www.rsc.org/images/entities/char_2009.gif) : :![[thin space (1/6-em)]](https://www.rsc.org/images/entities/char_2009.gif) 1 1 |
80–90 | 3.68 | 7.71 | 0.88 | 0.54 | 40 | 3.70 × 10⁻⁴ | 1.70 × 10⁻⁴ | Normal | 50 |
| 2013 | PSEHTT | PNDIS-HD | 1![[thin space (1/6-em)]](https://www.rsc.org/images/entities/char_2009.gif) : :![[thin space (1/6-em)]](https://www.rsc.org/images/entities/char_2009.gif) 1 1 |
70 | 3.26 | 7.78 | 0.76 | 0.55 | 47 | 2.00 × 10⁻⁴ | 1.00 × 10⁻⁴ | Inverted | 49 |
| 2013 | P3HT | PDI-diTh | 1![[thin space (1/6-em)]](https://www.rsc.org/images/entities/char_2009.gif) : :![[thin space (1/6-em)]](https://www.rsc.org/images/entities/char_2009.gif) 1.5 1.5 |
120–130 | 2.17 | 7.65 | 0.52 | 0.55 | 40 | — | — | Inverted | 48 |
| 2013 | PTB7 | P(NDI2OD-T2) | 1![[thin space (1/6-em)]](https://www.rsc.org/images/entities/char_2009.gif) : :![[thin space (1/6-em)]](https://www.rsc.org/images/entities/char_2009.gif) 1 1 |
70 | 1.1 | 3.4 | 0.62 | 0.39 | — | — | — | Normal | 47 |
| 2012 | P3HT | PF12TBT | 1![[thin space (1/6-em)]](https://www.rsc.org/images/entities/char_2009.gif) : :![[thin space (1/6-em)]](https://www.rsc.org/images/entities/char_2009.gif) 1 1 |
60 | 2.7 | 3.88 | 1.26 | 0.55 | — | — | — | Normal | 46 |
| 2012 | P3HT | PF-NDI | 2![[thin space (1/6-em)]](https://www.rsc.org/images/entities/char_2009.gif) : :![[thin space (1/6-em)]](https://www.rsc.org/images/entities/char_2009.gif) 1 1 |
— | 1.63 | 3.63 | 0.68 | 0.66 | 30 | — | — | Normal | 45 |
| 2012 | P3HT | P(NDI2OD-T2) | 1![[thin space (1/6-em)]](https://www.rsc.org/images/entities/char_2009.gif) : :![[thin space (1/6-em)]](https://www.rsc.org/images/entities/char_2009.gif) 0.75 0.75 |
275 | 1.4 | 3.77 | 0.56 | 0.65 | 22 | — | — | Normal | 44 |
| 2012 | P3HT | P(NDI-TCPDTT) | 1![[thin space (1/6-em)]](https://www.rsc.org/images/entities/char_2009.gif) : :![[thin space (1/6-em)]](https://www.rsc.org/images/entities/char_2009.gif) 1.5 1.5 |
410 | 1.1 | 2.43 | 0.63 | 0.7 | 16 | — | — | Normal | 44 |
| 2012 | P3HT | PNDIBS | 1![[thin space (1/6-em)]](https://www.rsc.org/images/entities/char_2009.gif) : :![[thin space (1/6-em)]](https://www.rsc.org/images/entities/char_2009.gif) 3 3 |
— | 0.88 | 3.79 | 0.53 | 0.44 | 19 | — | — | Normal | 43 |
| 2011 | PT1 | PC-PDI | 2![[thin space (1/6-em)]](https://www.rsc.org/images/entities/char_2009.gif) : :![[thin space (1/6-em)]](https://www.rsc.org/images/entities/char_2009.gif) 1 1 |
— | 2.23 | 6.35 | 0.7 | 0.5 | 43 | — | — | Normal | 42 |
| 2011 | P3HT | PF12TBT | 1![[thin space (1/6-em)]](https://www.rsc.org/images/entities/char_2009.gif) : :![[thin space (1/6-em)]](https://www.rsc.org/images/entities/char_2009.gif) 1 1 |
70 | 2 | 3.94 | 1.19 | 0.42 | 27 | — | — | Normal | 41 |
| 2011 | POPT | CN-PPV | — | — | 2 | 5.44 | 1.06 | 0.35 | — | — | — | Normal | 40 |
| 2011 | P3HT | P(NDI2OD-T2) | 1![[thin space (1/6-em)]](https://www.rsc.org/images/entities/char_2009.gif) : :![[thin space (1/6-em)]](https://www.rsc.org/images/entities/char_2009.gif) 2 2 |
— | 0.62 | 2.39 | 0.48 | 0.54 | 15.8 | — | — | Normal | 39 |
| 2011 | P3HT | P(NDI2OD-T2) | 1![[thin space (1/6-em)]](https://www.rsc.org/images/entities/char_2009.gif) : :![[thin space (1/6-em)]](https://www.rsc.org/images/entities/char_2009.gif) 2 2 |
— | 0.16 | 0.48 | 0.50 | 0.67 | — | — | — | Normal | 39 |
| 2010 | P3HT | F8TBT | 1![[thin space (1/6-em)]](https://www.rsc.org/images/entities/char_2009.gif) : :![[thin space (1/6-em)]](https://www.rsc.org/images/entities/char_2009.gif) 1 1 |
75–80 | 1.85 | 3.3 | 1.14 | 0.49 | 26.1 | — | — | Inverted | 38 |
| 2009 | PPHT | PDI-PPV copolymer | 1![[thin space (1/6-em)]](https://www.rsc.org/images/entities/char_2009.gif) : :![[thin space (1/6-em)]](https://www.rsc.org/images/entities/char_2009.gif) 1 1 |
— | 2.32 | 2.98 | 0.6 | 0.39 | — | — | — | Normal | 37 |
| 2009 | POPT | CN-PPV | — | — | 2 | — | — | — | — | — | — | Normal | 36 |
| 2009 | PTZV-PT | DOCN-PPV | 1![[thin space (1/6-em)]](https://www.rsc.org/images/entities/char_2009.gif) : :![[thin space (1/6-em)]](https://www.rsc.org/images/entities/char_2009.gif) 1 1 |
60 | 0.8 | 3.14 | 0.85 | 0.288 | 25 | — | — | Normal | 35 |
| 2008 | Polythiophene derivative 2 | P(PDI-DTT) derivative | 3![[thin space (1/6-em)]](https://www.rsc.org/images/entities/char_2009.gif) : :![[thin space (1/6-em)]](https://www.rsc.org/images/entities/char_2009.gif) 1 1 |
60 | 1.48 | 5.02 | 0.69 | 0.43 | 37 | — | — | Normal | 34 |
| 2007 | P3HT | F8TBT | 1![[thin space (1/6-em)]](https://www.rsc.org/images/entities/char_2009.gif) : :![[thin space (1/6-em)]](https://www.rsc.org/images/entities/char_2009.gif) 1 1 |
70 | 1.8 | 4 | 1.25 | 0.45 | 26 | — | — | Normal | 33 |
| 2007 | Polythiophene derivative 1 | P(PDI-DTT) | 1![[thin space (1/6-em)]](https://www.rsc.org/images/entities/char_2009.gif) : :![[thin space (1/6-em)]](https://www.rsc.org/images/entities/char_2009.gif) 1 1 |
— | 1 | 4.2 | 0.63 | 0.39 | 44 | — | — | Normal | 32 |
| 2006 | MDMO-PPV | PF1CVTP | — | 40–50 | 1.5 | 3 | 1.4 | 0.37 | 40 | — | — | Normal | 31 |
| 2005 | M3EH-PPV | CN-ether-PPV | 1![[thin space (1/6-em)]](https://www.rsc.org/images/entities/char_2009.gif) : :![[thin space (1/6-em)]](https://www.rsc.org/images/entities/char_2009.gif) 1 1 |
55 | 1.7 | 3.57 | 1.36 | 0.354 | 31 | — | — | Normal | 30 |
| 2004 | M3EH-PPV | CN-ether-PPV | 1![[thin space (1/6-em)]](https://www.rsc.org/images/entities/char_2009.gif) : :![[thin space (1/6-em)]](https://www.rsc.org/images/entities/char_2009.gif) 1 1 |
60 | 1.0 | 3.2 | 1.0 | 0.25 | — | — | — | Normal | 29 |
| 2004 | M3EH-PPV | CN-ether-PPV | 1![[thin space (1/6-em)]](https://www.rsc.org/images/entities/char_2009.gif) : :![[thin space (1/6-em)]](https://www.rsc.org/images/entities/char_2009.gif) 1 1 |
45 | 0.75 | 3.3 | 0.65 | 0.35 | 23.5 | — | — | Inverted | 29 |
| 1998 | POPT | MEH-CN-PPV | — | — | 1.9 | — | — | — | 29 | — | — | Normal | 28 |
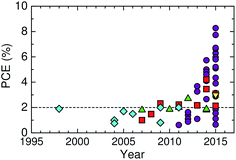 | ||
| Fig. 2 Efficiency enhancement of polymer/polymer blend solar cells based on different polymer acceptors: cyanated phenylenevinylene-based polymers (diamonds); fluorene and BT-based polymers (triangles); thiazole-bridged diketopyrrolopyrrole-polymer (inverted triangle);67 PDI-based polymers (squares); and NDI-based polymers (circles). | ||
 | ||
| Fig. 3 Power conversion efficiencies of polymer/polymer blend solar cells with corresponding device parameters: (a) JSC; (b) VOC; and (c) FF. Each symbol represents a different polymer acceptor: cyanated phenylenevinylene-based polymers (diamonds); fluorene and BT-based polymers (triangles); thiazole-bridged diketopyrrolopyrrole-polymer (inverted triangle);67 PDI-based polymers (squares); and NDI-based polymers (circles and stars). | ||
In the earliest development stage, cyano-substituted phenylenevinylene (CN-PPV) polymers were most widely used as polymer acceptors. Then, fluorene and benzothiadiazole (BT)-based copolymers were considered as electron acceptors. Both CN-PPV derivatives (the diamonds in Fig. 2 and 3) and fluorene and BT-based copolymers (the triangles in Fig. 2 and 3) yield a high VOC (>1 V), because of their relatively shallow LUMO energy levels. However, the JSC and FF are low, because the light absorption ability of these polymer acceptors is limited to the visible region and, also, their μe values are relatively low (∼10−5 cm2 V−1 s−1). Consequently, the PCEs of most devices based on these acceptors remained at less than 2% for a long period of time.
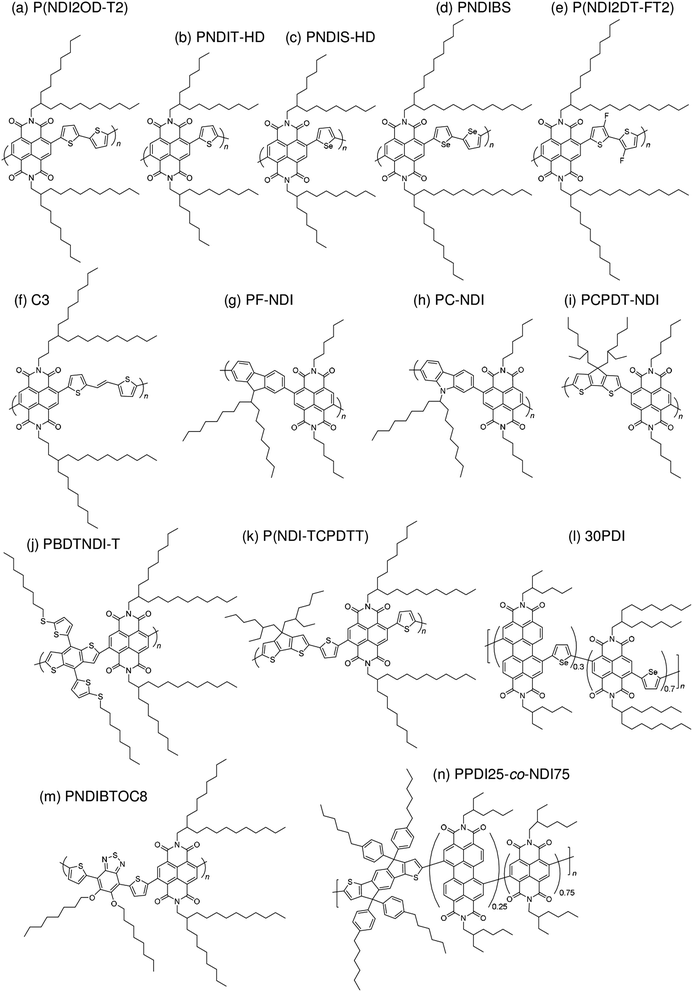
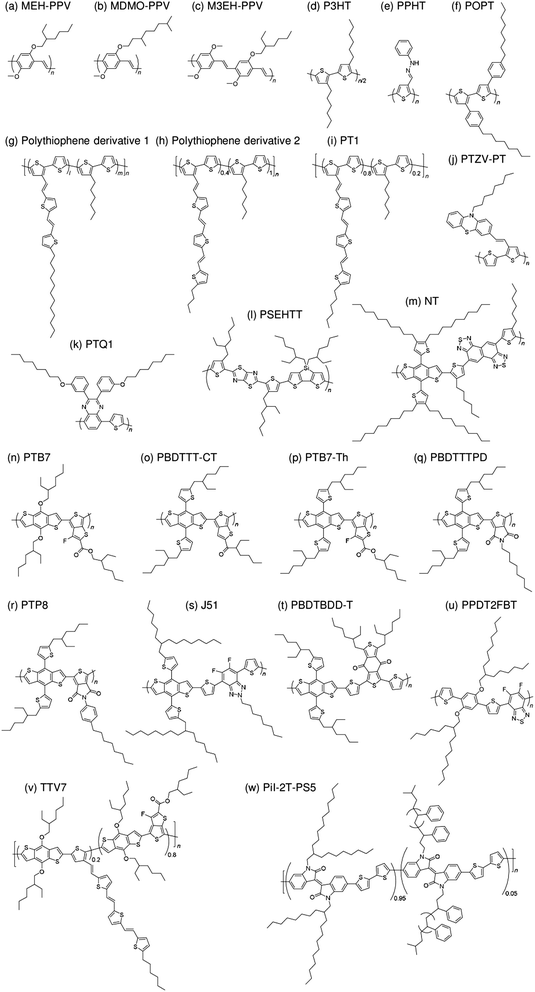
Subsequently, copolymers based on two kinds of rylene diimides, perylene diimide (PDI; squares in Fig. 2 and 3) and naphthalene diimide (NDI; circles and stars in Fig. 2 and 3) were synthesized as polymer acceptors that exhibit high μe, high electron affinities similar to those of fullerenes, and absorption bands from the visible to the near-IR region. From 2012 onwards, several kinds of NDI-based polymers were combined with low-bandgap polymer donors to enhance the light absorptivity of the photoactive blend layer in the near-IR region, leading to an increase in JSC and considerable improvement in the PCE. The chemical structures of polymer acceptors employed in polymer/polymer blend solar cells are shown in Fig. 4–7, and those of polymer donors are illustrated in Fig. 8.
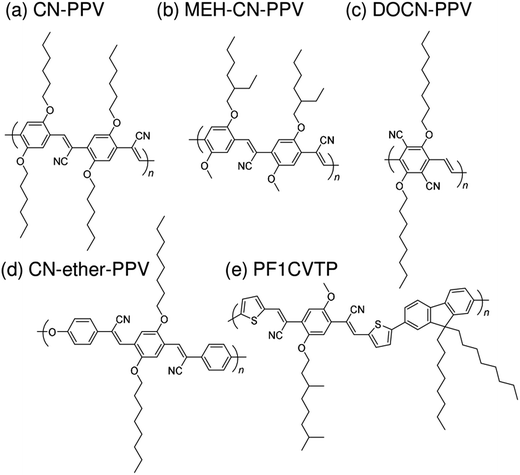 | ||
| Fig. 4 Chemical structures of cyanated phenylenevinylene-based polymer acceptors: (a) CN-PPV; (b) MEH-CN-PPV; (c) DOCN-PPV; (d) CN-ether-PPV; and (e) PF1CVTP. | ||
 | ||
| Fig. 5 Chemical structures of fluorene and BT-based polymer acceptors: (a) F8TBT; (b) PF12TBT; and (c) PFDTBT-OC6. | ||
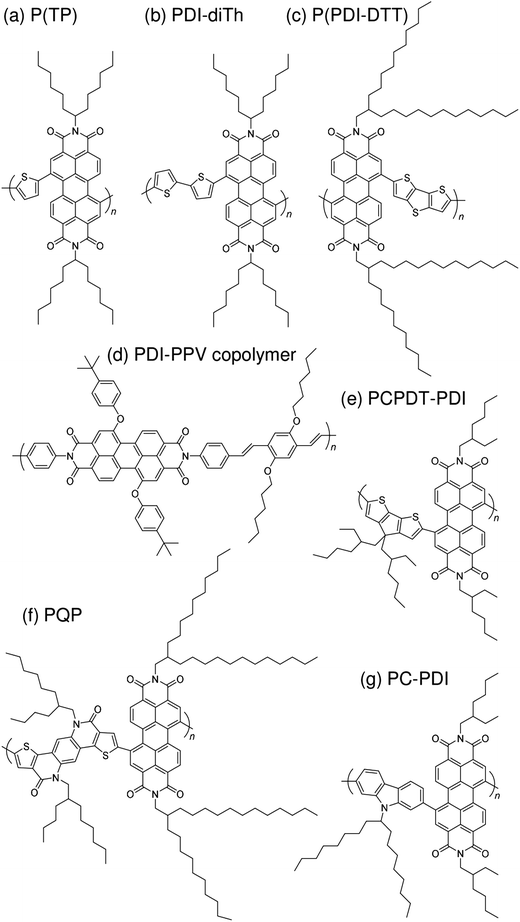 | ||
| Fig. 6 Chemical structures of PDI-based polymer acceptors: (a) P(TP); (b) PDI-diTh; (c) P(PDI-DTT); (d) PDI-PPV copolymer; (e) PCPDT-PDI; (f) PQP; and (g) PC-PDI. | ||
3.1 Cyanated phenylenevinylene-based polymer acceptors
Halls et al. reported the pioneering work on polymer/polymer blend solar cells in 1995.26 They employed a polymer blend film of two soluble poly(p-phenylenevinylene) (PPV) derivatives, poly[2-methoxy-5-(2′-ethyl)-hexyloxy-p-phenylenevinylene] (MEH-PPV) and cyano-PPV (CN-PPV), as a photoactive layer. The phase-separated structures were as small as 10–100 nm, as observed in transmission electron microscopy images, which was consistent with efficient photoluminescence (PL) quenching in the blend. As a result, the polymer blend device exhibited a photoresponse corresponding to polymer absorption. In the same year, Yu et al. reported a similar study.27 The polymer combination they employed (MEH-PPV and MEH-CN-PPV) was almost identical to that reported by Halls et al., although the CN-PPV side chain differed slightly. The polymer blend device exhibited an energy conversion efficiency of 0.9%, which was 20 times larger than that of pure MEH-PPV and ∼100 times larger than that of pure MEH-CN-PPV. (Note that the conversion efficiency was measured at an intensity of ∼10−6 W cm−2.) These findings demonstrate that blending of conjugated donor and acceptor polymers can provide not only donor/acceptor interfaces for the generation of charge carriers, but also interpenetrating networks to transport charge carriers to each electrode.A decade after these pioneering studies, a PCE exceeding 1% was obtained for polymer blend solar cells, with some effort. In 2005, Kietzke et al. reported polymer blend solar cells based on poly[2,5-dimethoxy-1,4-phenylene-1,2-ethenylene-2-methoxy-5-(2-ethylhexyloxy)-(1,4-phenylene-1,2-ethenylene)] (M3EH-PPV) and poly[oxa-1,4-phenylene-1,2-(1-cyano)ethylene-2,5-dioctyloxy-1,4-phenylene-1,2-(2-cyano)ethylene-1,4-phenylene] (CN-ether-PPV).30 These devices exhibited a PCE of 1.7% under white light illumination at 100 mW cm−2. Kietzke et al. attributed this high efficiency to the formation of a vertically graded composition structure in the blended layer, as a result of the different solubilities of the M3EH-PPV and CN-ether-PPV in chlorobenzene. In 2006, Koetse et al. reported polymer/polymer blend solar cells based on poly[2-methoxy-5-(3,7-dimethyloctyloxy)-1,4-phenylenevinylene] (MDMO-PPV) and poly[9,9-dioctylfluorene-2,7-diyl-alt-1,4-bis[2-(5-thienyl)-1-cyanovinyl]-2-methoxy-5-(3,7-dimethyl-octyloxy)benzene] (PF1CVTP).31 For a device prepared with an additional thin layer (∼5 nm) of the acceptor material between the photoactive blend layer and the electron-collecting electrode, the highest PCE of 1.5% was obtained under AM 1.5G illumination at 100 mW cm−2. Further, in 2009, Fréchet et al. reported polymer/polymer bilayer solar cells based on poly[3-(4-n-octyl)-phenylthiophene] (POPT) and MEH-CN-PPV.36 These researchers synthesized POPT using a modified Grignard metathesis (GRIM) procedure. Because of the high number-average molecular weight (Mn) and regioregularity of POPT, MEH-CN-PPV can be spin-coated directly on top of a GRIM POPT film to yield bilayer POPT/MEH-CN-PPV devices with a PCE of 2.0%.
3.2 Fluorene and benzothiadiazole (BT)-based polymer acceptors
In 2007, McNeil et al. reported a PCE of 1.8% for polymer/polymer blend solar cells based on regioregular poly(3-hexylthiophene) (P3HT) and poly[9,9-dioctylfluorene-2,7-diyl-alt-[4,7-bis(3-hexylthien-5-yl)-2,1,3-benzothiadiazole]-2′,2′′-diyl] (F8TBT).33 Later, in 2010, Huck et al. reported nanopatterned P3HT/F8TBT solar cells fabricated using a nanoimprinting technique.38 The nanopatterned polymer solar cells exhibited a PCE of 1.85%, with a pattern size of 25 nm on a 50 nm pitch, which is comparable to LD. Moreover, in 2014, Li et al. reported solar cells made from blends of P3HT-nanowires and F8TBT, for which a PCE of 1.87% was achieved.53In 2011, Ito et al. reported a PCE of 2.0% for polymer/polymer blend solar cells based on P3HT and poly[2,7-(9,9-didodecylfluorene)-alt-5,5-[4′,7′-bis(2-thienyl)-2′,1′,3′-benzothiadiazole]] (PF12TBT).41 These researchers further improved the PCE of P3HT/PF12TBT solar cells to 2.7% through the use of PF12TBT with a high weight-average molecular weight (Mw) of 78![[thin space (1/6-em)]](https://www.rsc.org/images/entities/char_2009.gif) 000 g mol−1.46 In addition, in 2014, Xie et al. reported a PCE of 1.80% for polymer/polymer blend solar cells based on P3HT and poly[2,7-(9,9′-octyl-fluorene)-alt-5,5-(4′,7′-di-2-thienyl-5′,6′-bis(hexyloxy)-2′,1′,3′-benzothiadiazole)] (PFDTBT-OC6).52
000 g mol−1.46 In addition, in 2014, Xie et al. reported a PCE of 1.80% for polymer/polymer blend solar cells based on P3HT and poly[2,7-(9,9′-octyl-fluorene)-alt-5,5-(4′,7′-di-2-thienyl-5′,6′-bis(hexyloxy)-2′,1′,3′-benzothiadiazole)] (PFDTBT-OC6).52
3.3 PDI-based polymer acceptors
With regard to the development of PDI-based acceptors, in 2007, Zhan et al. first used a PDI-based copolymer, PDI-dithienothiophene copolymer P(PDI-DTT), as a polymer acceptor.32 The P(PDI-DTT) thin films exhibited a deep LUMO energy of 3.9 eV, a μe of 1.3 × 10⁻² cm2 V−1 s−1 in the field-effect transistor (FET) configuration, and significant absorption ranging from the visible to the near-IR region. A PCE of more than 1% was reported for a device made by blending P(PDI-DTT) with a polythiophene derivative as the donor. Following modulation of the chemical structure of the corresponding donor and acceptor polymers, Zhan et al. improved the PCE to 1.48%.34In 2011, a comprehensive study on PDI-based polymer acceptors was conducted by Hashimoto et al.42 These authors synthesized six kinds of PDI-based co-polymers (X-PDI) including those with the co-monomers vinylene (V), thiophene (T), dithienopyrrole (DTP), fluorene (F), dibenzosilole (DBS), and carbazole (C) as X. The highest PCE of 2.23% was achieved for polymer/polymer blend solar cells based on a P3HT analogue incorporating tris(thienylenevinylene) side chains (PT1) and a PDI-carbazole copolymer (PC-PDI). Subsequently, in 2013, Pei et al. reported polymer/polymer blend solar cells with a PCE of 2.17%, which were obtained by employing the PDI-dithiophene copolymer (PDI-diTh) as the acceptor and P3HT as the donor.48 In 2014, Zhan et al. utilized binary additives to optimize the blend morphology and achieved a PCE of 3.45% for blend solar cells based on P(PDI-DTT) and PBDTTT-C-T as the acceptor and donor, respectively.56 Finally, Bao et al. reported a PCE of 4.4% for polymer/polymer blend solar cells based on an isoindigo-based polymer donor with polystyrene side chains (PiI-2T-PS5) and a PDI-thiophene copolymer [P(TP)].57
3.4 NDI-based polymer acceptors
The first study on the development of an NDI-based copolymer appeared in 2009, when Facchetti et al. reported poly[[N,N′-bis(2-octyldodecyl)-naphthalene-1,4,5,8-bis(dicarboximide)-2,6-diyl]-alt-5,5′-(2,2′-bithiophene)] [P(NDI2OD-T2); Polyera ActivInk™ N2200] having a deep LUMO energy of 3.9 eV and remarkable stability under ambient conditions.78 This polymer exhibited an excellent μe of up to 0.45–0.85 cm2 V−1 s−1 in the FET configuration and a high μe of >10−3 cm2 V−1 s−1 evaluated from the space-charge limited current.In the early development stage of these materials, the photovoltaic properties of solar cells utilizing P(NDI2OD-T2) as an acceptor were investigated by blending with donor P3HT. In 2011, the initial P3HT/P(NDI2OD-T2) blend solar cell PCEs were reported to be only 0.21% and 0.17%, by Sirringhaus et al.79 and Fréchet et al.,40 respectively. In the same year, Loi et al. obtained a high FF of 0.67 for P3HT/P(NDI2OD-T2) blend solar cells for the first time, which is comparable to the values reported for efficient polymer/fullerene blends.39 However, the PCE of these devices was 0.16%, because of their limited JSC value of 0.48 mA cm−2. The formation of large domains in the blends, which is driven by preferential segregation and crystallization, is the dominating factor behind the relatively poor JSC, which limits the overall device performance.80 In 2012, it was found that the addition of chloronaphthalene (CN) suppressed the pre-aggregation of P(NDI2OD-T2) in solution and resulted in a marked improvement in the JSC.44,81 A PCE of 1.4% with a JSC of 3.77 mA cm−2 and a FF of 0.65 was achieved for P3HT/P(NDI2OD-T2) blends prepared from a p-xylene and cyanonaphthalene binary mixture as a spin-coating solvent.44 However, the JSC and PCE values remained significantly lower than those of its P3HT/PCBM counterpart blends, confirming that the morphological characteristics differ between polymer and small molecule acceptor blends.
3.5 Beyond 4%—combination of a low-bandgap polymer donor and rylene diimide-based polymer acceptors
In 2012, McNeill et al. combined P(NDI2OD-T2) with a low-bandgap polymer, poly[[4,8-bis[(2-ethylhexyl)oxy]benzo[1,2-b:4,5-b']dithiophene-2,6-diyl][3-fluoro-2-[(2-ethylhexyl)carbonyl]thieno[3,4-b]thiophenediyl]] (PTB7) instead of P3HT.47 The use of PTB7 as the donor polymer resulted in a spectral response with improved matching to the solar spectrum. An initial PCE of 1.1% was reported, with a peak external quantum efficiency (EQE) of 18% at a wavelength of 680 nm. Marks et al. examined the effect of a spin-coating solvent on the device performance of PTB7/P(NDI2OD-T2) blends and improved the PCE up to 2.66% via spin-coating from a xylene solution.55 In 2013, Jenekhe et al. reported a PCE of 3.26% for polymer blend solar cells based on poly[(4,4′-bis(2-ethylhexyl)dithieno[3,2-b:2′,3′-d]silole)-2,6-diyl-alt-(2,5-bis(3-(2-ethylhexyl)thiophen-2-yl)thiazolo[5,4-d]thiazole)] (PSEHTT) and an NDI-selenophene copolymer (PNDIS-HD).49 The PSEHTT/PNDIS-HD blend film exhibited balanced electron and hole transport, which explains the high photovoltaic performance. Later, these researchers improved the device performance via spin-coating of blend films from a solvent mixture of chlorobenzene and dichlorobenzene, achieving a PCE of 4.8%.59In 2013, Ito et al. reported a PCE of 4.1% for polymer/polymer blend solar cells based on poly[2,3-bis-(3-octyloxyphenyl)quinoxaline-5,8-diyl-alt-thiophene-2,5-diyl] (PTQ1) and P(NDI2OD-T2).51 These devices exhibited the highest performance at a PTQ1 fraction of 70 wt%. Also in 2013, Tajima et al. reported a PCE of 3.68% for polymer/polymer blend solar cells based on a PTB7 analogue incorporating tris(thienylenevinylene) side chains (TTV7) and an NDI-carbazole copolymer (PC-NDI) as the donor and acceptor, respectively.50 Owing to the tris(thienylenevinylene) side chains, TTV7 exhibited superior miscibility with PC-NDI than with PTB7, resulting in a well-mixed blend morphology and, hence, an improved photocurrent. In 2014, Ito et al. reported a PCE of 5.7% for polymer/polymer blend solar cells based on poly[[2,6'-4,8-di(5-ethylhexylthienyl)benzo[1,2-b;3,3-b]dithiophene][3-fluoro-2[(2-ethylhexyl)carbonyl]thieno[3,4-b]thiophenediyl]] (PTB7-Th) and P(NDI2OD-T2).61 The main reason for this high PCE was that both the generation and collection efficiencies of the free charge carriers were as high as 80%; these values are comparable to those for polymer/fullerene blend solar cells, which suggests that there is no inherent disadvantage to polymer/polymer blend solar cells.
In 2015, Kim et al. reported polymer/polymer blend solar cells based on poly[(2,5-bis(2-hexyldecyloxy)phenylene)-alt-(5,6-difluoro-4,7-di(thiophen-2-yl)benzo[c][1,2,5]thiadiazole)] (PPDT2FBT) and P(NDI2OD-T2).71 The device PCE increased from 1.54% to 3.59% with the increase in the PPDT2FBT Mn from 12![[thin space (1/6-em)]](https://www.rsc.org/images/entities/char_2009.gif) 000 to 40
000 to 40![[thin space (1/6-em)]](https://www.rsc.org/images/entities/char_2009.gif) 000 g mol−1. The PCE was further improved to 5.10% when diphenylether (DPE) was used as an additive. In 2015, Kim et al. reported polymer/polymer blend solar cells based on PTB7-Th and a series of NDI-thiophene copolymers (PNDIT-R, R = alkyl) with different side chains.73 The phase-separated domain size in the blend exhibited a sensitive dependence on the side chains, and was suppressed to the greatest extent for PNDIT-HD with a 2-hexyldecyl group. As a result, the highest PCE of 5.96% was obtained for PTB7-Th/PNDIT-HD blend solar cells. Kim et al. further reported polymer/polymer blend solar cells based on poly[4,8-bis(5-(2-ethylhexyl)thiophen-2-yl)benzo[1,2-b:4,5-b′]dithiophene-alt-1,3-bis(thiophen-2-yl)-5-(2-hexyldecyl)-4H-thieno[3,4-c]pyrrole-4,6(5H)-dione] (PBDTTTPD) as a donor and poly[[N,N′-bis(2-hexyldecyl)-naphthalene-1,4,5,8-bis(dicarboximide)-2,6-diyl]-alt-5,5′-thiophene] (PNDIT-HD) as an acceptor. The PBDTTTPD/PNDIT-HD blend solar cells exhibited a PCE of 6.64% with a relatively large VOC of 1.06, due to the deep HOMO energy level of the donor PBDTTTPD (−5.49 eV).14 In the same year, Jen et al. synthesized P(NDI2OD-T2) derivatives containing a fluorinated dithiophene unit in the main chain, P(NDI2DT-FT2). Fluorination on the polymer backbone leads to enhanced crystallinity and electron transport ability, and also enlarges the HOMO–LUMO band gap of the polymer acceptor. Consequently, the PTB7-Th/P(NDIDT-FT2) blend solar cells exhibited higher FF and larger VOC values than those of the corresponding PTB7-Th/P(NDI2OD-T2) blends, yielding a higher PCE of 6.71%.75 Also in 2015, Jenekhe et al. reported polymer/polymer blend solar cells based on a benzodithiophene-thieno[3,4-b]thiophene copolymer (PBDTTT-C-T) and a series of NDI-selenophene/PDI-selenophene random copolymers (xPDI, x = 10, 30, or 50 mol%).74 The PBDTTT-C-T/30PDI blend films exhibited the optimal phase-separated morphology and, hence, yielded the highest PCE of 6.29%. Notably, the maximum value of the external quantum efficiency (EQE) exceeded 90%, and the JSC was as high as 18.55 mA cm−2.
000 g mol−1. The PCE was further improved to 5.10% when diphenylether (DPE) was used as an additive. In 2015, Kim et al. reported polymer/polymer blend solar cells based on PTB7-Th and a series of NDI-thiophene copolymers (PNDIT-R, R = alkyl) with different side chains.73 The phase-separated domain size in the blend exhibited a sensitive dependence on the side chains, and was suppressed to the greatest extent for PNDIT-HD with a 2-hexyldecyl group. As a result, the highest PCE of 5.96% was obtained for PTB7-Th/PNDIT-HD blend solar cells. Kim et al. further reported polymer/polymer blend solar cells based on poly[4,8-bis(5-(2-ethylhexyl)thiophen-2-yl)benzo[1,2-b:4,5-b′]dithiophene-alt-1,3-bis(thiophen-2-yl)-5-(2-hexyldecyl)-4H-thieno[3,4-c]pyrrole-4,6(5H)-dione] (PBDTTTPD) as a donor and poly[[N,N′-bis(2-hexyldecyl)-naphthalene-1,4,5,8-bis(dicarboximide)-2,6-diyl]-alt-5,5′-thiophene] (PNDIT-HD) as an acceptor. The PBDTTTPD/PNDIT-HD blend solar cells exhibited a PCE of 6.64% with a relatively large VOC of 1.06, due to the deep HOMO energy level of the donor PBDTTTPD (−5.49 eV).14 In the same year, Jen et al. synthesized P(NDI2OD-T2) derivatives containing a fluorinated dithiophene unit in the main chain, P(NDI2DT-FT2). Fluorination on the polymer backbone leads to enhanced crystallinity and electron transport ability, and also enlarges the HOMO–LUMO band gap of the polymer acceptor. Consequently, the PTB7-Th/P(NDIDT-FT2) blend solar cells exhibited higher FF and larger VOC values than those of the corresponding PTB7-Th/P(NDI2OD-T2) blends, yielding a higher PCE of 6.71%.75 Also in 2015, Jenekhe et al. reported polymer/polymer blend solar cells based on a benzodithiophene-thieno[3,4-b]thiophene copolymer (PBDTTT-C-T) and a series of NDI-selenophene/PDI-selenophene random copolymers (xPDI, x = 10, 30, or 50 mol%).74 The PBDTTT-C-T/30PDI blend films exhibited the optimal phase-separated morphology and, hence, yielded the highest PCE of 6.29%. Notably, the maximum value of the external quantum efficiency (EQE) exceeded 90%, and the JSC was as high as 18.55 mA cm−2.
Very recently, Jenekhe et al. reported a remarkable improvement in the photocurrent of polymer blend solar cells based on PTB7-Th and an NDI-selenophene copolymer (PNDIS-HD), obtained via a simple film aging process.76 The optimum PCE of 7.73% with a JSC of 18.8 mA cm−2 and a maximum EQE of 85% was obtained after the film was aged in a glovebox at room temperature for 72 h; this value is significantly larger than the PCE of 3.66% that was obtained following thermal annealing at 175 °C for 10 min. It is worth noting that the highest yet achieved PCE of 8.27% was reported by Li et al. during the preparation of this review.77 This high PCE was achieved for a polymer/polymer blend based on a medium-bandgap benzodithiophene-alt-benzotriazole copolymer (J51) and low-bandgap P(NDI2OD-T2) pair, as the donor and acceptor, respectively. A large JSC of 14.18 mA cm−2 due to complementary absorption from visible to near-IR wavelengths, along with an excellent FF approaching 0.7, are key components in order to obtain a PCE of more than 8%.
Certified polymer/polymer blend solar cells with a PCE of 6.47% have been demonstrated by the Polyera Corporation team, although the materials have not been disclosed. This PCE was certified by the National Renewable Energy Laboratory, and this is the highest certified performance of a polymer/polymer blend solar cell to date.82
4. Blend morphology control
Simple spin-coating of the photoactive layer from a blend solution of polymers in a single solvent usually results in an undesirable morphology, with problematic features such as large phase separation,83 inhomogeneous internal phase composition,80,84–86 and reduced ordering of the polymer chains;87 this morphology is known to correlate with poor device performance. Therefore, control of the morphology of polymer/polymer blends is an important aspect of the recent remarkable enhancement of the resultant PCEs, in conjunction with the synthesis of new polymer acceptors. Optimization of the blend morphology has been attempted using processing techniques such as solvent engineering (using low-boiling-point (low-bp) solvents, mixed solvents, solvent additives) and thermal annealing, or by adjusting the polymer molecular weight, donor/acceptor blending ratios, and chemical structures of the polymer side chains. These techniques can affect the degree of phase separation, the polymer chain ordering, and the orientation of the crystalline domains in the blend films, thereby facilitating the formation of a morphology preferable to charge generation and transport. Among these processing methods, studies on solvent engineering, thermal annealing, polymer molecular weight, donor/acceptor (D![[thin space (1/6-em)]](https://www.rsc.org/images/entities/char_2009.gif) :
:![[thin space (1/6-em)]](https://www.rsc.org/images/entities/char_2009.gif) A) blend ratios, and the use of polymer nanowires are reviewed here. Further, we discuss the recent research progress with regard to the preparation and application of fully conjugated donor–acceptor block copolymers as the photoactive layers of polymer solar cells.
A) blend ratios, and the use of polymer nanowires are reviewed here. Further, we discuss the recent research progress with regard to the preparation and application of fully conjugated donor–acceptor block copolymers as the photoactive layers of polymer solar cells.
4.1 Solvent engineering
Ito et al. have studied the effect of the choice of the spin-coating solvent on the device performance of polymer/polymer blend solar cells based on a semicrystalline donor P3HT and an amorphous acceptor PF12TBT.41Fig. 9 shows the current density–voltage (J–V) characteristics of P3HT/PF12TBT blend solar cells fabricated from spin-coating solutions with different bp solvents: o-dichlorobenzene (DCB, bp = 181 °C), chlorobenzene (CB, bp = 132 °C), and chloroform (CF, bp = 61 °C). The JSC was as low as 1 mA cm−2 for the devices fabricated from the high-bp solvents (DCB and CB). In contrast, a significant increase in JSC to 4 mA cm−2 was observed for the device fabricated from the low-bp solvent (CF).
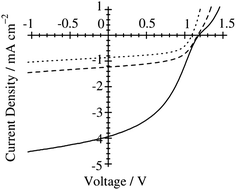 | ||
Fig. 9
J–V characteristics of P3HT/PF12TBT solar cells under AM 1.5G 100 mW cm−2 illumination. The devices were fabricated via spin-coating from DCB (dotted line), CB (dashed line), and CF (solid line) solutions of P3HT and PF12TBT (1![[thin space (1/6-em)]](https://www.rsc.org/images/entities/char_2009.gif) : :![[thin space (1/6-em)]](https://www.rsc.org/images/entities/char_2009.gif) 1 weight ratio) and annealed at 140 °C for 10 min. Adapted with permission from (ref. 41). Copyright 2011, American Chemical Society. 1 weight ratio) and annealed at 140 °C for 10 min. Adapted with permission from (ref. 41). Copyright 2011, American Chemical Society. | ||
In addition, atomic force microscopy (AFM) revealed marked differences in the surface morphologies of the three blend films (Fig. 10). For the blend film spin-coated from DCB, phase-separated structures were clearly observed: each domain had a lateral dimension of a few micrometers. For the blend film fabricated from CB, smaller but still distinct phase-separated structures were observed: each domain had a lateral dimension of a few hundred nanometers. In either case, the phase-separated domains were significantly larger than the LD value of typical conjugated polymers (≤10 nm).19 In contrast, no distinct phase-separated structure was observed for the blend film fabricated from CF, suggesting a well-mixed blend morphology of P3HT and PF12TBT comparable to LD. Suppressing the spontaneous growth of phase separation during spin-coating is the key to obtaining devices with large JSC based on polymer/polymer blend systems.
![[thin space (1/6-em)]](https://www.rsc.org/images/entities/char_2009.gif) :
:![[thin space (1/6-em)]](https://www.rsc.org/images/entities/char_2009.gif) CN (50
CN (50![[thin space (1/6-em)]](https://www.rsc.org/images/entities/char_2009.gif) :
:![[thin space (1/6-em)]](https://www.rsc.org/images/entities/char_2009.gif) 50) mixed solvent exhibited a large increase in JSC and PCE due to the finer mixing of polymers in the film, compared with reference devices obtained from pure p-xylene (Fig. 11).
50) mixed solvent exhibited a large increase in JSC and PCE due to the finer mixing of polymers in the film, compared with reference devices obtained from pure p-xylene (Fig. 11).
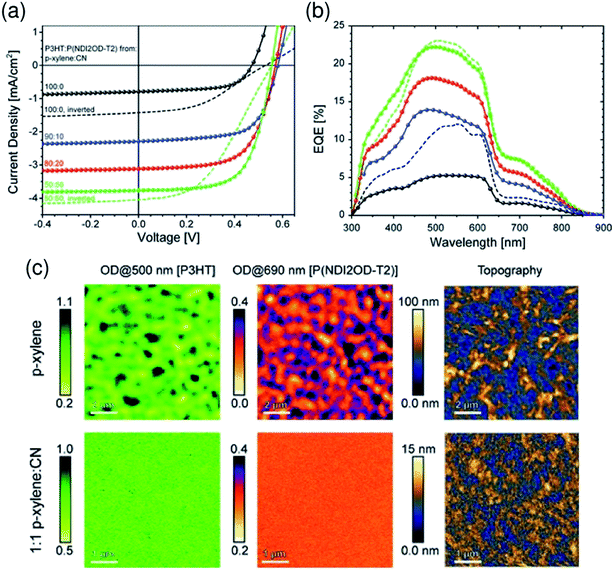 | ||
Fig. 11 (a) J–V characteristics and (b) corresponding EQE spectra of P3HT/P(NDI2OD-T2) BHJ solar cells under simulated AM 1.5 illumination. The blend layer was spin-coated from solvent mixtures of p-xylene and CN. The p-xylene![[thin space (1/6-em)]](https://www.rsc.org/images/entities/char_2009.gif) : :![[thin space (1/6-em)]](https://www.rsc.org/images/entities/char_2009.gif) CN mixing ratios are 100 CN mixing ratios are 100![[thin space (1/6-em)]](https://www.rsc.org/images/entities/char_2009.gif) : :![[thin space (1/6-em)]](https://www.rsc.org/images/entities/char_2009.gif) 0 (black), 90 0 (black), 90![[thin space (1/6-em)]](https://www.rsc.org/images/entities/char_2009.gif) : :![[thin space (1/6-em)]](https://www.rsc.org/images/entities/char_2009.gif) 10 (blue), 80 10 (blue), 80![[thin space (1/6-em)]](https://www.rsc.org/images/entities/char_2009.gif) : :![[thin space (1/6-em)]](https://www.rsc.org/images/entities/char_2009.gif) 20 (red), and 50 20 (red), and 50![[thin space (1/6-em)]](https://www.rsc.org/images/entities/char_2009.gif) : :![[thin space (1/6-em)]](https://www.rsc.org/images/entities/char_2009.gif) 50 (green). (c) Near-field scanning optical microscopy (SNOM) images of blends of corresponding solar cells fabricated from p-xylene (top) and 1 50 (green). (c) Near-field scanning optical microscopy (SNOM) images of blends of corresponding solar cells fabricated from p-xylene (top) and 1![[thin space (1/6-em)]](https://www.rsc.org/images/entities/char_2009.gif) : :![[thin space (1/6-em)]](https://www.rsc.org/images/entities/char_2009.gif) 1 p-xylene 1 p-xylene![[thin space (1/6-em)]](https://www.rsc.org/images/entities/char_2009.gif) : :![[thin space (1/6-em)]](https://www.rsc.org/images/entities/char_2009.gif) CN (bottom), taken at 500 and 690 nm in order to probe the P3HT and P(NDI2OD-T2) fractions of the blend, respectively. The scale bar is expressed in terms of the optical density (OD), defined via OD = −log10(I/I0), where I0 and I are the incident and transmitted photon fluxes, respectively. The AFM height images were obtained from independent measurements using a Si-cantilever. Reproduced with permission from (ref. 44). Copyright 2012, Wiley-VCH Verlag GmbH & Co. KGaA, Weinheim. CN (bottom), taken at 500 and 690 nm in order to probe the P3HT and P(NDI2OD-T2) fractions of the blend, respectively. The scale bar is expressed in terms of the optical density (OD), defined via OD = −log10(I/I0), where I0 and I are the incident and transmitted photon fluxes, respectively. The AFM height images were obtained from independent measurements using a Si-cantilever. Reproduced with permission from (ref. 44). Copyright 2012, Wiley-VCH Verlag GmbH & Co. KGaA, Weinheim. | ||
Recent studies by Kim et al. have shown that additives enhance the order of P(NDI2OD-T2) chains in blend films and improve the device PCE.58,71 For PTB7-Th/P(NDI2OD-T2) blend solar cells prepared from a CF solution, the addition of 1,8-diiodooctane (DIO) (1.25 vol%) enhances the crystallinity of P(NDI2OD-T2) and causes an increase in μe by a factor of more than 10, while maintaining proper mixing of the polymers. Consequently, JSC increases in the presence of DIO, boosting the PCE to 4.60% from 3.41%.58 A similar positive effect of an additive on the P(NDI2OD-T2) crystallinity and μe has also been observed for PPDT2FBT/P(NDI2OD-T2) blend solar cells prepared from a CF solution. The addition of DPE (1.0 vol%) was found to primarily increase JSC, which boosted the PCE to 5.10% from 3.59%.71 Hou et al. have reported that the FF is enhanced from 0.530 to 0.596 through the use of CN (3 vol%) as an additive for PBDTBDD-T/PBDTNDI-T blend solar cells prepared from CB.66 These researchers ascribed the improvement in the FF to the higher domain purity and enhanced molecular ordering of the blend film, as induced by processing with CN. Consequently, the device PCE was improved from 2.18% to 2.88%. In addition, Zhan et al. have demonstrated that binary additives synergistically boost the efficiency of a polymer/polymer blend solar cell.56 These researchers used PDI-2DTT and DIO as additives for PBDTTT-C-T/P(PDI-DTT) blend solar cells prepared from DCB (Fig. 12). In this configuration, the additive PDI-2DTT suppresses aggregation of the P(PDI-DTT) acceptor and enhances the donor/acceptor mixing, while the DIO facilitates aggregation and crystallization of the donor PBDTTT-C-T. Consequently, the combination of PDI-2DTT (2 wt%) and DIO (6 vol%) leads to suitable phase separation and improved and balanced charge carrier mobilities, which enhance both JSC and FF and boost the PCE to 3.45% from 1.18%.
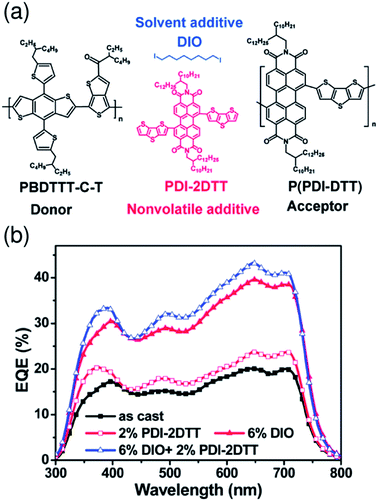 | ||
| Fig. 12 (a) Chemical structures of the PBDTTT-C-T donor, P(PDI-DTT) acceptor, PDI-2DTT, and DIO. (b) EQE spectra of PBDTTT-C-T/P(PDI-DTT) blend solar cells without or with additives under AM 1.5G solar simulator illumination at 100 mW cm−2. Reproduced with permission from (ref. 56). Copyright 2013, The Royal Society of Chemistry. | ||
Very recently, Jenekhe et al. applied film aging to control the blend morphology of polymer/polymer blend solar cells.76 In that study, blend films comprised of a PTB7-Th donor with a PNDIS-HD acceptor were prepared via spin-coating from a CB solution, and the wet films were placed in an argon-filled glovebox to dry at room temperature for 72 h. The slow self-organization of the blends facilitated by the slow solvent evaporation at room temperature resulted in enhanced μe, smaller mean crystalline domain sizes, and the existence of a more amorphous mixed region compared to the control blend films, which were processed using thermal annealing after spin-coating. The resultant PTB7-Th/PNDIS-HD blend solar cells exhibited a PCE of 7.7% and a JSC of 18.8 mA cm−2, with a maximum EQE of 85% (Fig. 13).
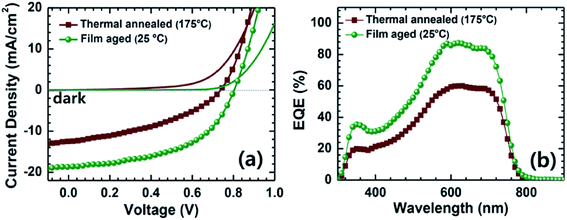 | ||
Fig. 13 (a) J–V curves and (b) EQE spectra of PTB7-Th/PNDIS-HD (1![[thin space (1/6-em)]](https://www.rsc.org/images/entities/char_2009.gif) : :![[thin space (1/6-em)]](https://www.rsc.org/images/entities/char_2009.gif) 1 w/w) blend solar cells with thermally annealed (175 °C, 10 min) or film-aged (25 °C, 72 h) active layers. Adapted with permission from (ref. 76). Copyright 2015, Wiley-VCH Verlag GmbH & Co. KGaA, Weinheim. 1 w/w) blend solar cells with thermally annealed (175 °C, 10 min) or film-aged (25 °C, 72 h) active layers. Adapted with permission from (ref. 76). Copyright 2015, Wiley-VCH Verlag GmbH & Co. KGaA, Weinheim. | ||
4.2 Thermal annealing
Thermal annealing of finely mixed blend films provides a convenient means for tuning the domain size from a few nanometers to tens of nanometers. Previously, Ito et al. have investigated the effect of nanoscale phase separation on device performance.41,90Fig. 14a shows the observed annealing temperature dependence of the photovoltaic parameters of a P3HT/PF12TBT blend solar cell fabricated via spin-coating from a CF solution.41 The as-spun device exhibited a very small JSC and FF before annealing, and the PCE was as low as 0.27%. However, the device performance after annealing for 10 min had a significant dependence on the annealing temperature, and the highest PCE of 2.0% was obtained following annealing at 140 °C.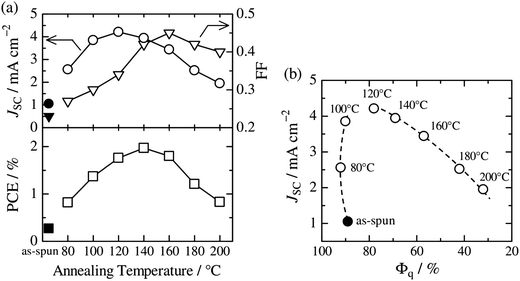 | ||
Fig. 14 (a) Device parameter dependence on annealing temperature: JSC (open circles), FF (open inverted triangles), and PCE (open squares). The solid symbols represent the device parameters before thermal annealing. (b) Plots of JSC against the respective Φq value of PF12TBT. These parameters were measured for P3HT/PF12TBT blend solar cells fabricated via spin-coating from a CF solution of P3HT and PF12TBT (1![[thin space (1/6-em)]](https://www.rsc.org/images/entities/char_2009.gif) : :![[thin space (1/6-em)]](https://www.rsc.org/images/entities/char_2009.gif) 1 weight ratio). The broken lines are guides for the eye. Reproduced with permission from (ref. 41). Copyright 2011, American Chemical Society. 1 weight ratio). The broken lines are guides for the eye. Reproduced with permission from (ref. 41). Copyright 2011, American Chemical Society. | ||
Note that the PL of a constituent polymer is quenched when polymer excitons generated in the blend film can arrive at the interface with other polymers. Therefore, the PL quenching efficiency (Φq) provides information about the size and purity of the domains on a length scale comparable to LD. In Fig. 14b, JSC is plotted against the Φq values of PF12TBT, in order to extract the relationship between the blend nanomorphology and JSC. The high value of the Φq (∼90%) of the as-spun film indicates a well-mixed blend structure with a domain size close to LD. Further, the measured Φq values remained as high as 80–90%, even for films annealed at 80–120 °C. On the other hand, JSC increased steeply from 1.1 mA cm−2 for the as-spun device to 4.2 mA cm−2 for the device annealed at 120 °C. In contrast, both Φq and JSC decreased following annealing at temperatures above 120 °C.
This behavior suggests that thermal annealing causes two-step structural changes in the blend. In the first step, for temperatures up to 120 °C, the small but phase-separated domains are purified by expulsion of the minor component polymer chains. The PF12TBT-rich domains in the as-spun blend film seem to involve minor P3HT chains. The isolated P3HT chains in the PF12TBT matrix can serve as charge transfer/quenching sites for PF12TBT excitons, but cannot contribute to the photocurrent, because the resultant holes on the P3HT chains have no pathways to the electrode. The annealing treatment below 120 °C induces homogeneity between the individual domains in the compositions, while keeping the domain size close to LD. In that case, JSC increases with annealing at elevated temperature. In the second step, thermal annealing at temperatures higher than 120 °C causes enlargement of the phase-separated structures, which is accompanied by growth of the domain size beyond LD and a decrease in the domain interface area. These structural changes reduce both Φq and JSC.
The increase in the FF with thermal annealing can be explained in terms of the improved charge carrier mobility, as shown in Fig. 15.91 The value of μe increases steadily with temperature even in the temperature range below 120 °C, suggesting that the PF12TBT-rich amorphous domains increase in purity, even if the domain coarsening is frozen. The electron transport is improved by the exclusion of the isolated P3HT chains from the PF12TBT domains. Meanwhile, thermal annealing increases the value of μh, because it promotes ordering of the semicrystalline P3HT chains and growth of the adjacent P3HT nanodomains, resulting in the formation of an electrically interconnected crystalline phase for hole transport. Because of the annealing temperature dependence of JSC and FF, the maximum PCE is obtained through annealing at 140 °C, which establishes a balance between charge generation and transport. Ito et al. have also spectroscopically investigated morphology-dependent charge generation and recombination properties in P3HT/PF12TBT blends using transient absorption (TA) measurements, which were then correlated with the temperature dependence of the device EQEs.91
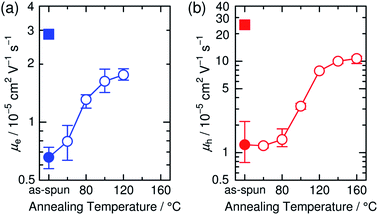 | ||
| Fig. 15 (a) Electron and (b) hole mobilities of P3HT/PF12TBT blend films (circles) with respect to annealing temperature. The squares in (a) and (b) indicate the electron and hole mobilities, respectively, of the as-spun PF12TBT neat and as-spun P3HT neat films. Reproduced with permission from (ref. 91). Copyright 2015, Wiley-VCH Verlag GmbH & Co. KGaA, Weinheim. | ||
4.3 Polymer molecular weight
Ito et al. have studied the influence of the Mw on the device performance of blends based on P3HT and PF12TBT, using three PF12TBTs with different Mw's: L-PF12TBT (Mw = 8500), M-PF12TBT (Mw = 20![[thin space (1/6-em)]](https://www.rsc.org/images/entities/char_2009.gif) 000), and H-PF12TBT (Mw = 78
000), and H-PF12TBT (Mw = 78![[thin space (1/6-em)]](https://www.rsc.org/images/entities/char_2009.gif) 000).46 The photovoltaic performance exhibited the following dependence on Mw:
000).46 The photovoltaic performance exhibited the following dependence on Mw:
• The PCE improved from 1.9 to 2.7% with increasing Mw;
• The optimal annealing temperature that yields the maximum PCE increased from 100 to 120 and then to 140 °C with increasing Mw;
• The improvement in the PCE can primarily be ascribed to an increase in the FF, as both JSC and VOC are almost identical among the three optimized devices.
Fig. 16 shows the J–V characteristics of P3HT/L-PF12TBT and P3HT/H-PF12TBT solar cells. Following thermal annealing at 100 °C (broken lines), which yielded the optimum PCE for P3HT/L-PF12TBT, JSC reached a maximum value of 4 mA cm−2 for both P3HT/L-PF12TBT and P3HT/H-PF12TBT. On the other hand, the FF was still as low as 0.41 for P3HT/L-PF12TBT and 0.37 for P3HT/H-PF12TBT. Following annealing at an elevated temperature of 140 °C (solid lines), the FF increased and reached 0.50 for P3HT/L-PF12TBT and 0.55 for P3HT/H-PF12TBT. However, such high-temperature annealing yielded a significantly decreased JSC for P3HT/L-PF12TBT. On the other hand, it was possible to maintain the maximum value of JSC for P3HT/H-PF12TBT. Consequently, the PCE of P3HT/H-PF12TBT could be improved even after annealing at 140 °C, and this specimen yielded the highest PCE value of 2.7% among the examined devices. As shown in Fig. 16, high-temperature annealing is required in order to improve the PCE, because of its positive effect on the FF. On the other hand, small domain structures comparable in size to LD should be retained during annealing. Ito et al.'s study46 demonstrates that the ideal blend morphology that yields both large JSC and FF values at the same time is achieved using H-PF12TBT. In a device with high-Mw PF12TBT, efficient charge generation is maintained even at high annealing temperatures, because the rate of domain bloating decelerates owing to the reduced diffusion mobility of the PF12TBT chains. On the other hand, the charge collection efficiency also increases during the annealing, through both domain purification of the PF12TBT and ordering of the P3HT chains.
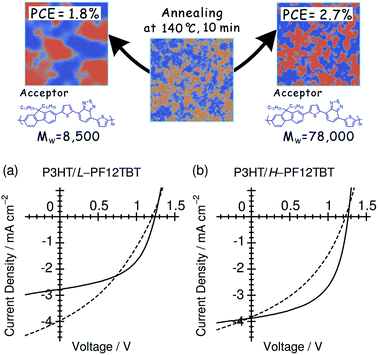 | ||
Fig. 16
J–V characteristics of (a) P3HT/L-PF12TBT and (b) P3HT/H-PF12TBT blend solar cells under AM 1.5G illumination from a calibrated solar simulator with an intensity of 100 mW cm−2. The device was fabricated by spin-coating a CF solution of P3HT and PF12TBT (1![[thin space (1/6-em)]](https://www.rsc.org/images/entities/char_2009.gif) : :![[thin space (1/6-em)]](https://www.rsc.org/images/entities/char_2009.gif) 1 weight ratio) and annealed at 100 °C (broken lines) and 140 °C (solid lines) for 10 min. Reproduced with permission from (ref. 46). Copyright 2012, American Chemical Society. 1 weight ratio) and annealed at 100 °C (broken lines) and 140 °C (solid lines) for 10 min. Reproduced with permission from (ref. 46). Copyright 2012, American Chemical Society. | ||
Kim et al. have studied the effect of the polymer molecular weight on the photovoltaic characteristics of blends based on a pair of semicrystalline donor PPDT2FBT and P(NDI2OD-T2) acceptor polymers, PPDT2FBT/P(NDI2OD-T2), using three PPDT2FBTs with different Mn's: PPDT2FBTL (Mn = 12![[thin space (1/6-em)]](https://www.rsc.org/images/entities/char_2009.gif) 000), PPDT2FBTM (Mn = 24
000), PPDT2FBTM (Mn = 24![[thin space (1/6-em)]](https://www.rsc.org/images/entities/char_2009.gif) 000), and PPDT2FBTH (Mn = 40
000), and PPDT2FBTH (Mn = 40![[thin space (1/6-em)]](https://www.rsc.org/images/entities/char_2009.gif) 000).71 These researchers fabricated the devices via spin-coating from a CF solution and compared their performances (Fig. 17).
000).71 These researchers fabricated the devices via spin-coating from a CF solution and compared their performances (Fig. 17).
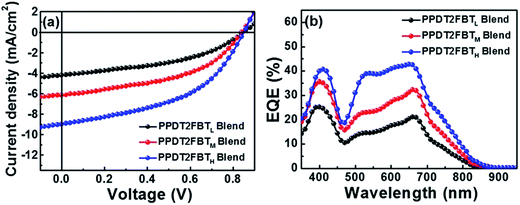 | ||
| Fig. 17 (a) J–V characteristics and (b) EQE spectra of PPDT2FBT/P(NDI2OD-T2) blend solar cells. Adapted with permission from (ref. 71). Copyright 2015, American Chemical Society. | ||
The photovoltaic performance was found to exhibit the following dependence on Mn:
• The PCE was improved from 1.54 to 3.59% with increasing Mn;
• The improvement in the PCE was primarily ascribed to an increase in the JSC, as both FF and VOC were almost identical among the three devices;
• The DPE additive improved the JSC and FF and, thus, the PCE values for all PPDT2FBT/P(NDI2OD-T2) blends in a similar manner, independent of their Mn.
The crystalline ordering and blend morphologies of the blends with different Mn were examined using grazing incident X-ray scattering, resonant soft X-ray scattering, and AFM measurements. The results suggest that high-Mn PPDT2FBTH promotes a preferential face-on crystalline orientation of PPDT2FBT in the blend film, and facilitates intermixing between PPDT2FBT and P(NDI2OD-T2) with a smaller domain size. The PPDT2FBTH/P(NDI2OD-T2) blend morphology contributes to an improvement in both the charge generation efficiency and charge transport, thereby increasing the JSC and PCE values. The incorporation of DPE induces an increase in the μe values for all PPDT2FBT/P(NDI2OD-T2) blends. As a result, the μe becomes more balanced with the μh, further improving the JSC, FF, and PCE values.
4.4 Donor/acceptor blend ratio
The D![[thin space (1/6-em)]](https://www.rsc.org/images/entities/char_2009.gif) :
:![[thin space (1/6-em)]](https://www.rsc.org/images/entities/char_2009.gif) A blend ratio is an important parameter with regard to the fabrication of polymer/polymer blend solar cells. Ito et al. have investigated the effect of the D
A blend ratio is an important parameter with regard to the fabrication of polymer/polymer blend solar cells. Ito et al. have investigated the effect of the D![[thin space (1/6-em)]](https://www.rsc.org/images/entities/char_2009.gif) :
:![[thin space (1/6-em)]](https://www.rsc.org/images/entities/char_2009.gif) A ratio on the photovoltaic performance of polymer/polymer blend solar cells based on an amorphous donor PTQ1 and a semicrystalline acceptor P(NDI2OD-T2).51Fig. 18 shows the photovoltaic performance of PTQ1/P(NDI2OD-T2) blend solar cells with various D
A ratio on the photovoltaic performance of polymer/polymer blend solar cells based on an amorphous donor PTQ1 and a semicrystalline acceptor P(NDI2OD-T2).51Fig. 18 shows the photovoltaic performance of PTQ1/P(NDI2OD-T2) blend solar cells with various D![[thin space (1/6-em)]](https://www.rsc.org/images/entities/char_2009.gif) :
:![[thin space (1/6-em)]](https://www.rsc.org/images/entities/char_2009.gif) A ratios. The photovoltaic parameters depend strongly on the D
A ratios. The photovoltaic parameters depend strongly on the D![[thin space (1/6-em)]](https://www.rsc.org/images/entities/char_2009.gif) :
:![[thin space (1/6-em)]](https://www.rsc.org/images/entities/char_2009.gif) A ratio. In particular, both JSC and FF increase remarkably with increases in the PTQ1 content, and the highest PCE of 4.1% is realized for the device with D
A ratio. In particular, both JSC and FF increase remarkably with increases in the PTQ1 content, and the highest PCE of 4.1% is realized for the device with D![[thin space (1/6-em)]](https://www.rsc.org/images/entities/char_2009.gif) :
:![[thin space (1/6-em)]](https://www.rsc.org/images/entities/char_2009.gif) A = 70
A = 70![[thin space (1/6-em)]](https://www.rsc.org/images/entities/char_2009.gif) :
:![[thin space (1/6-em)]](https://www.rsc.org/images/entities/char_2009.gif) 30. This marked PCE dependence demonstrates the importance of controlling the D
30. This marked PCE dependence demonstrates the importance of controlling the D![[thin space (1/6-em)]](https://www.rsc.org/images/entities/char_2009.gif) :
:![[thin space (1/6-em)]](https://www.rsc.org/images/entities/char_2009.gif) A blend ratio for the improvement of the overall device performance. In their study, Ito et al. investigated the charge generation and transport efficiency of blended films with different D
A blend ratio for the improvement of the overall device performance. In their study, Ito et al. investigated the charge generation and transport efficiency of blended films with different D![[thin space (1/6-em)]](https://www.rsc.org/images/entities/char_2009.gif) :
:![[thin space (1/6-em)]](https://www.rsc.org/images/entities/char_2009.gif) A ratios.
A ratios.
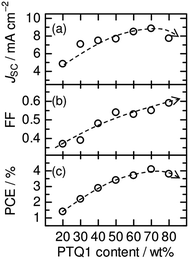 | ||
Fig. 18 Photovoltaic parameters (JSC, FF, PCE) of PTQ1/N2200 blend solar cells with various D![[thin space (1/6-em)]](https://www.rsc.org/images/entities/char_2009.gif) : :![[thin space (1/6-em)]](https://www.rsc.org/images/entities/char_2009.gif) A ratios. The broken lines are guides for the eye. Reproduced with permission from (ref. 51). Copyright 2013, Wiley-VCH Verlag GmbH & Co. KGaA, Weinheim. A ratios. The broken lines are guides for the eye. Reproduced with permission from (ref. 51). Copyright 2013, Wiley-VCH Verlag GmbH & Co. KGaA, Weinheim. | ||
Fig. 19a shows the Φq values of P(NDI2OD-T2) and PTQ1 for blend films, which represent the efficiency of charge generation from P(NDI2OD-T2) and PTQ1 excitons, respectively. The Φq value of P(NDI2OD-T2) decreased markedly with increasing P(NDI2OD-T2) content. On the other hand, that of PTQ1 was greater than 96% for all of the blend films, regardless of the D![[thin space (1/6-em)]](https://www.rsc.org/images/entities/char_2009.gif) :
:![[thin space (1/6-em)]](https://www.rsc.org/images/entities/char_2009.gif) A ratio. Consequently, the overall charge generation efficiency in the blend film increased with increasing PTQ1 content, which is key to obtaining large JSC. In the corresponding report, Ito et al. considered the long-range resonant (Förster-type) energy transfer in order to explain the large Φq value of PTQ1 for all D
A ratio. Consequently, the overall charge generation efficiency in the blend film increased with increasing PTQ1 content, which is key to obtaining large JSC. In the corresponding report, Ito et al. considered the long-range resonant (Förster-type) energy transfer in order to explain the large Φq value of PTQ1 for all D![[thin space (1/6-em)]](https://www.rsc.org/images/entities/char_2009.gif) :
:![[thin space (1/6-em)]](https://www.rsc.org/images/entities/char_2009.gif) A compositions.92,93Fig. 19b shows the dependence of μh and μe on the D
A compositions.92,93Fig. 19b shows the dependence of μh and μe on the D![[thin space (1/6-em)]](https://www.rsc.org/images/entities/char_2009.gif) :
:![[thin space (1/6-em)]](https://www.rsc.org/images/entities/char_2009.gif) A ratio. The value of μh increased with increasing PTQ1 content. In contrast, μe remained significantly higher than μh for all the blended compositions. As a result, μh became more balanced with the large μe as the PTQ1 content increased. This result reveals that control of the D
A ratio. The value of μh increased with increasing PTQ1 content. In contrast, μe remained significantly higher than μh for all the blended compositions. As a result, μh became more balanced with the large μe as the PTQ1 content increased. This result reveals that control of the D![[thin space (1/6-em)]](https://www.rsc.org/images/entities/char_2009.gif) :
:![[thin space (1/6-em)]](https://www.rsc.org/images/entities/char_2009.gif) A ratio is essential to achieving a balance between μh and μe, which is key to obtaining high FFs.
A ratio is essential to achieving a balance between μh and μe, which is key to obtaining high FFs.
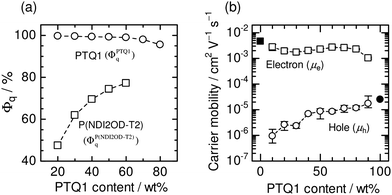 | ||
| Fig. 19 (a) PL quenching efficiencies (Φq) of PTQ1 (circles) and P(NDI2OD-T2) (squares) in PTQ1/P(NDI2OD-T2) blend films as functions of PTQ1 weight percentage. (b) Hole (open circles) and electron (open squares) mobilities in PTQ1/N2200 blend films as functions of PTQ1 weight percentage. The solid circle and square indicate the hole and electron mobilities in the PTQ1 and P(NDI2OD-T2) neat films, respectively. Reproduced with permission from (ref. 51). Copyright 2013, Wiley-VCH Verlag GmbH & Co. KGaA, Weinheim. | ||
The D![[thin space (1/6-em)]](https://www.rsc.org/images/entities/char_2009.gif) :
:![[thin space (1/6-em)]](https://www.rsc.org/images/entities/char_2009.gif) A ratio that yields the optimal FF differs between the PTQ1/P(NDI2OD-T2) and conventional polymer/PCBM blend solar cells. For polymer/PCBM blends, the PCBM concentration should be sufficiently high to ensure the presence of sufficient electron transport networks throughout the film. For example, in blends with amorphous donor polymers, such as MDMO-PPV,94 fluorene copolymers,95 and PCDTBT,96 80 wt% PCBM is required in order to provide an optimal FF. In contrast, as an acceptor, P(NDI2OD-T2) can provide sufficient pathways for electron transport through the chain networks, even when the concentration is as low as 10 wt% (see Fig. 19b). The preferable formation of interpenetrating networks by both the polymer donor and acceptor allows for adjustment of the D
A ratio that yields the optimal FF differs between the PTQ1/P(NDI2OD-T2) and conventional polymer/PCBM blend solar cells. For polymer/PCBM blends, the PCBM concentration should be sufficiently high to ensure the presence of sufficient electron transport networks throughout the film. For example, in blends with amorphous donor polymers, such as MDMO-PPV,94 fluorene copolymers,95 and PCDTBT,96 80 wt% PCBM is required in order to provide an optimal FF. In contrast, as an acceptor, P(NDI2OD-T2) can provide sufficient pathways for electron transport through the chain networks, even when the concentration is as low as 10 wt% (see Fig. 19b). The preferable formation of interpenetrating networks by both the polymer donor and acceptor allows for adjustment of the D![[thin space (1/6-em)]](https://www.rsc.org/images/entities/char_2009.gif) :
:![[thin space (1/6-em)]](https://www.rsc.org/images/entities/char_2009.gif) A blend ratio in a wide range, without loss of charge transport pathways. As shown in Table 1 (see the D
A blend ratio in a wide range, without loss of charge transport pathways. As shown in Table 1 (see the D![[thin space (1/6-em)]](https://www.rsc.org/images/entities/char_2009.gif) :
:![[thin space (1/6-em)]](https://www.rsc.org/images/entities/char_2009.gif) A blend ratio column), the device performance can be maximized with acceptor fractions lower than 33 wt% for other combinations of donor and acceptor polymers,34,42,45,50,51,62,64,67,70,77 which are typical for devices based on polymer acceptors.
A blend ratio column), the device performance can be maximized with acceptor fractions lower than 33 wt% for other combinations of donor and acceptor polymers,34,42,45,50,51,62,64,67,70,77 which are typical for devices based on polymer acceptors.
4.5 Use of self-assembled polymer nanowires
Self-assembled nanostructures of semiconducting polymers have been recognized as active building components for photovoltaic applications. Polymer nanowires, which can be grown in solution through the aggregation and crystallization of semiconducting polymer chains in a quasi-one-dimensional fashion, are of particular interest, because of their structural features (widths comparable to LD and lengths of several micrometers).97–100 Regioregular poly(3-alkylthiophene) (P3AT) nanowires have been widely examined for blends with fullerenes.97,98 The potential advantages of applying polymer nanowires in BHJ solar cells are as follows: (1) polymer nanowires offer large donor/acceptor interfacial areas for efficient exciton dissociation, while also providing electrically interconnected pathways for efficient charge transport; (2) the high crystallinity of the nanowires yields high carrier mobilities and high absorption coefficients; (3) it is not necessary to improve the crystallinity of a constituent polymer via thermal and solvent annealing, which often causes domain coarsening and decreases the JSC.Recently, polymer nanowires have been applied as a means of controlling the nanomorphology in polymer/polymer blend solar cells.53,101 This approach was employed for the first time in 2010, when Lam et al. used P3HT nanowires to control the polymer/polymer blend morphology.101 These researchers prepared P3HT nanowires through gradual cooling of P3HT solution in a marginal p-xylene solvent. Subsequently, the P3HT-nanowire suspension was mixed with poly(9,9-dioctylfluorene-alt-benzothiadiazole) (F8BT) at a 1![[thin space (1/6-em)]](https://www.rsc.org/images/entities/char_2009.gif) :
:![[thin space (1/6-em)]](https://www.rsc.org/images/entities/char_2009.gif) 1 weight ratio, followed by spin-coating of the solution without filtration. The P3HT-nanowire/F8BT blend solar cells increased the JSC by a factor of 10 (from 0.029 to 0.291 mA cm−2) compared to an as-cast device based on a P3HT/F8BT blend spin-coated from a DCB solution. Further, in 2014, Li et al. applied crystalline P3HT nanowires to a blend with F8TBT.53 These researchers prepared a P3HT-nanowire suspension in a good DCB solvent by slowly and gradually adding a poor n-hexane solvent to the DCB solution with P3HT. Subsequently, F8TBT was added to the P3HT-nanowire suspension to yield a P3HT-nanowire
1 weight ratio, followed by spin-coating of the solution without filtration. The P3HT-nanowire/F8BT blend solar cells increased the JSC by a factor of 10 (from 0.029 to 0.291 mA cm−2) compared to an as-cast device based on a P3HT/F8BT blend spin-coated from a DCB solution. Further, in 2014, Li et al. applied crystalline P3HT nanowires to a blend with F8TBT.53 These researchers prepared a P3HT-nanowire suspension in a good DCB solvent by slowly and gradually adding a poor n-hexane solvent to the DCB solution with P3HT. Subsequently, F8TBT was added to the P3HT-nanowire suspension to yield a P3HT-nanowire![[thin space (1/6-em)]](https://www.rsc.org/images/entities/char_2009.gif) :
:![[thin space (1/6-em)]](https://www.rsc.org/images/entities/char_2009.gif) F8TBT (1
F8TBT (1![[thin space (1/6-em)]](https://www.rsc.org/images/entities/char_2009.gif) :
:![[thin space (1/6-em)]](https://www.rsc.org/images/entities/char_2009.gif) 1 weight ratio) mixture. The solution was then spin-coated without filtration. Transmission electron microscopy revealed that the P3HT-nanowire/F8TBT blend films contained homogeneously distributed P3HT nanowires with widths of ∼20 nm and lengths of ∼5 μm (Fig. 20). The P3HT-nanowire/F8TBT blend solar cells exhibited a JSC of 3.29 mA cm−2, an VOC of 1.35 eV, and a FF of 0.42; consequently, a PCE of 1.87% was achieved after thermal annealing. The JSC and FF values of the P3HT-nanowire/F8TBT blend were significantly enhanced compared to those of the as-cast and thermally annealed devices based on a P3HT/F8TBT blend spin-coated from a DCB solution (Fig. 21). These studies demonstrate the potential of polymer nanowire application for both rational control of film morphology and for efficiency enhancement of polymer/polymer blend solar cells.
1 weight ratio) mixture. The solution was then spin-coated without filtration. Transmission electron microscopy revealed that the P3HT-nanowire/F8TBT blend films contained homogeneously distributed P3HT nanowires with widths of ∼20 nm and lengths of ∼5 μm (Fig. 20). The P3HT-nanowire/F8TBT blend solar cells exhibited a JSC of 3.29 mA cm−2, an VOC of 1.35 eV, and a FF of 0.42; consequently, a PCE of 1.87% was achieved after thermal annealing. The JSC and FF values of the P3HT-nanowire/F8TBT blend were significantly enhanced compared to those of the as-cast and thermally annealed devices based on a P3HT/F8TBT blend spin-coated from a DCB solution (Fig. 21). These studies demonstrate the potential of polymer nanowire application for both rational control of film morphology and for efficiency enhancement of polymer/polymer blend solar cells.
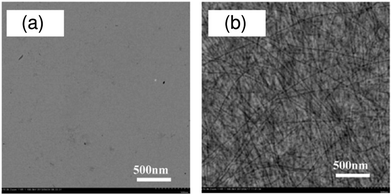 | ||
| Fig. 20 Transmission electron microscopy images of the (a) P3HT/F8TBT blend film prepared from DCB and (b) P3HT-nanowire/F8TBT blend film prepared from a mixed solution of DCB and n-hexane. The scale bar corresponds to a length of 500 nm. All the blend films have a thickness of ∼80 nm. Reproduced with permission from (ref. 53). Copyright 2014, American Chemical Society. | ||
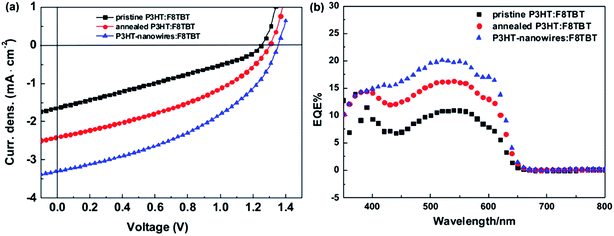 | ||
| Fig. 21 (a) J–V characteristics and (b) EQE spectra of the as-cast P3HT/F8TBT (black squares), annealed P3HT/F8TBT (red circles), and P3HT-nanowire/F8TBT (blue triangles) blend solar cells under simulated AM1.5G solar light illumination with an intensity of 100 mW cm−2. Both the annealed P3HT/F8TBT and P3HT-nanowire/F8TBT blends were annealed at 140 °C for 15 min before electrode deposition. Reproduced with permission from (ref. 53). Copyright 2014, American Chemical Society. | ||
We further note that the self-assembly nanowire techniques are applicable not only to polymer donors,102–104 but also to polymer acceptors.105,106 Polymer solar cells made from blends of polymer nanowires as both donor and acceptor components will enhance the feasibility of designing a nanoscale morphology consisting of a highly crystalline and pure charge-transport network. These all-polymer-nanowire systems could introduce a new avenue for accelerated enhancement of polymer photovoltaic efficiency; however, such systems have not yet been explored or demonstrated.
4.6 Use of fully conjugated donor–acceptor block copolymers
Donor–acceptor diblock copolymers are a fascinating and academically challenging subject with regard to photovoltaic applications, because diblock copolymers self-assemble into well-ordered and thermodynamically stable nanostructures with domain sizes commensurate to LD through control of the individual block lengths.107–109 In 2000, Hadziioannou et al. reported an attempt to enhance the photovoltaic efficiency of donor–acceptor block polymers.110In the early development stages, the majority of donor–acceptor block copolymers were composed of a conjugated donor polymer and a non-conjugated backbone attached to acceptor units in the side chain. Such copolymers have poor photovoltaic properties, because the non-conjugated backbone is neither optically nor electronically active. To overcome this disadvantage, recently, fully conjugated donor–acceptor block copolymers have been developed for photovoltaic applications (Fig. 22).111–114 In 2010, Hashimoto et al. synthesized P3HT-based diblock copolymers (P3HT-b-P3HTPCBM) consisting of a P3HT block and a P3AT block with a fullerene in a part of the side chain.115 The block copolymer film exhibited microphase separation patterns of ∼20 nm in size. These researchers applied the P3HT-b-P3HTPCBM to single-component solar cells and obtained a PCE of 1.70% with a JSC of 6.15 mA cm−2, an VOC of 0.54 V, and a FF of 0.51. The relatively high FF suggests that efficient charge transport networks were constructed in the diblock copolymer films.
Subsequently, in 2011, Mulherin et al. synthesized a fully conjugated donor–acceptor diblock copolymer poly(3-hexylthiophene)-block-poly{[9,9-bis-(2-octyldodecyl)fluorene-2,7-diyl]-alt-[4,7-di(thiophene-2-yl)-2,1,3-benzothiadiazole]-5′,5′′-diyl} (P3HT-b-PFTBTT).116 By adding P3HT-b-PFTBTT to the P3HT/PFTBTT homopolymer blend as a compatibilizer, phase separation of the active layers was restricted to a length scale of 25 nm in the lateral direction, even following thermal annealing above the melting temperature of P3HT. The JSC and PCE of the ternary blend device increased continually with the annealing temperature and remained stable up to 220 °C. However, the JSC of the homopolymer blend device began to decrease at temperatures above 130 °C, because the morphology became too coarse for efficient charge generation.
In 2012, Hawker et al. reported the preparation of a donor–acceptor diblock copolymer, P3HT-b-DPP, comprising a poly(diketopyrrolopyrrole-terthiophene) (DPP)-based narrow bandgap block attached to a P3HT block.117 A P3HT-b-DPP thin film annealed above the melting temperatures of both the P3HT and DPP crystallites self-assembled to form distinct lamellar structures with a domain spacing d of ∼30 nm. Moreover, for the P3HT-b-DPP thin film, the crystallinity of each domain could be controlled by varying the annealing temperature. On the other hand, for the P3HT/DPP homopolymer blend film, gross macrophase separation was observed with no significant ordering. In the same year, Nakabayashi et al. reported a donor–acceptor–donor triblock copolymer, P3HT–PNBI–P3HT, composed of a poly(naphthalene diimide) (PNBI) mid-block and P3HT end blocks.118 Devices were fabricated using a blend of the triblock copolymer with an added P3HT homopolymer (1![[thin space (1/6-em)]](https://www.rsc.org/images/entities/char_2009.gif) :
:![[thin space (1/6-em)]](https://www.rsc.org/images/entities/char_2009.gif) 1 by weight). Annealing the blend film at 200 °C improved the magnitude of JSC nearly three-fold, resulting in a PCE of 1.3%.
1 by weight). Annealing the blend film at 200 °C improved the magnitude of JSC nearly three-fold, resulting in a PCE of 1.3%.
Independently, Higashihara et al. synthesized a donor–acceptor–donor triblock copolymer, P3HT–PNDITh–P3HT, composed of a poly(naphthalene diimide-co-thiophene) (PNDITh) mid-block and P3HT end blocks.119 The triblock copolymer thin films were revealed to form a well-defined lamellar structure and crystalline domains for the respective blocks, where the P3HT layer was 10–20 nm thick and was aligned in an edge-on rich structure. In 2013, Verduzco et al. reported polymer solar cells based on donor–acceptor diblock copolymers consisting of poly(3-hexylthiophene)-block-poly[(9,9-dioctylfluorene)-2,7-diyl-alt-[4,7-bis(thiophene-5-yl)-2,1,3-benzothiadiazole]-2′,2′′-diyl] (P3HT-b-PFTBT).120 These block copolymers self-assembled to form in-plane lamellar structures with a d of ∼18 nm, which is comparable to the typical exciton diffusion length (Fig. 23a). As a result, the optimally performing device based on the diblock polymer exhibited a PCE of 3.1%, which is higher than the PCE of 1.1% obtained for P3HT/F8TBT homopolymer blend solar cells (Fig. 23b). Although there is still significant room for improvement, steady progress has been made with regard to the synthesis and utilization of fully conjugated donor–acceptor block copolymers for all-polymer photovoltaics.
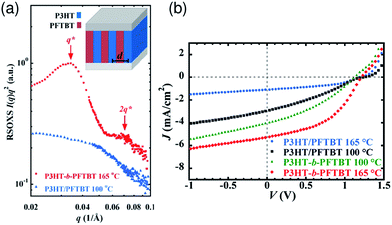 | ||
Fig. 23 (a) Resonant soft X-ray scattering intensities versus scattering vector of diblock copolymer P3HT-b-PFTBT and polymer blend P3HT/PFTBT (1![[thin space (1/6-em)]](https://www.rsc.org/images/entities/char_2009.gif) : :![[thin space (1/6-em)]](https://www.rsc.org/images/entities/char_2009.gif) 2 by mass) films in the transmission geometry. The P3HT-b-PFTBT and P3HT/PFTBT films were annealed at 165 °C and 100 °C, respectively. The q* and 2q* peaks of the block copolymer are indicative of lamellae. Inset: schematic illustration of P3HT-b-PFTBT films consisting of vertically oriented lamellae with average domain spacing labeled d. (b) J–V characteristics of diblock copolymer P3HT-b-PFTBT and polymer blend P3HT/PFTBT (1 2 by mass) films in the transmission geometry. The P3HT-b-PFTBT and P3HT/PFTBT films were annealed at 165 °C and 100 °C, respectively. The q* and 2q* peaks of the block copolymer are indicative of lamellae. Inset: schematic illustration of P3HT-b-PFTBT films consisting of vertically oriented lamellae with average domain spacing labeled d. (b) J–V characteristics of diblock copolymer P3HT-b-PFTBT and polymer blend P3HT/PFTBT (1![[thin space (1/6-em)]](https://www.rsc.org/images/entities/char_2009.gif) : :![[thin space (1/6-em)]](https://www.rsc.org/images/entities/char_2009.gif) 2 by mass) solar cells annealed at different temperatures. The PCE of the block copolymer device is near 3%, whereas that of the blend device is 1%. Reproduced with permission from (ref. 120). Copyright 2013, American Chemical Society. 2 by mass) solar cells annealed at different temperatures. The PCE of the block copolymer device is near 3%, whereas that of the blend device is 1%. Reproduced with permission from (ref. 120). Copyright 2013, American Chemical Society. | ||
5. Morphology-limited free-carrier generation
Fig. 24 summarizes the maximum EQE values (EQEmax) reported for the polymer/polymer blend solar cells listed in Table 1. Apart from the various devices developed utilizing NDI-based polymers, the EQEmax values of the majority of the polymer/polymer blend solar cells are lower than 50%, irrespective of the donor/acceptor pair type. These EQE values are far below those that can be obtained for polymer/fullerene blend solar cells (70–90%).3,4,6–8 The origin of such relatively low EQEs of polymer/polymer blends reported so far is generally attributed to the poor free charge-carrier generation capacity,121–128 which seems to be inherent to the electronic structure of a donor/acceptor interface based on non-fullerene acceptors.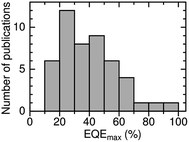 | ||
| Fig. 24 Overall distribution of maximum EQE values reported for polymer/polymer blend solar cells listed in Table 1. | ||
Ito et al. have investigated the efficiency for free charge-carrier generation in polymer/polymer blend solar cells based on P3HT and PF12TBT using TA measurements.91 Note that the EQEmax of P3HT/PF12TBT blend solar cells has been limited to 30% to date,91 while that of P3HT/PCBM blends has exceeded 80%.4,5Fig. 25 shows the charge generation and recombination dynamics for P3HT/PF12TBT blend films spin-coated from a CF solution and annealed at various temperatures for 10 min. As shown in this figure, the charge generation dynamics are characterized by immediate charge generation on a time scale determined by the pulse width of the excitation laser (∼100 fs) and, also, subsequent delayed charge generation, which ends within a period of tens to hundreds of picoseconds, depending on the annealing temperature. The observation of immediate charge generation for all the blend films demonstrates that charge transfer (exciton dissociation) between P3HT and PF12TBT occurs so quickly that it does not limit the overall charge generation rate, as has been reported for polymer/PCBM blend films.129–132 On the other hand, the delayed charge generation can be attributed to a diffusion controlled process; the rise time represents the time required for the polymer singlet exciton to reach the distributed donor/acceptor interface in the blends. In the as-spun (unannealed) blend film, polymer excitons were efficiently converted into charges with a rise time of 11 ps; however, the majority of the charges recombined geminately. Consequently, the generation efficiency of the long-lived free charge carriers (ηFree), which is defined as the ratio of the amount of the long-lived charge carriers to that of the overall generated charges, was as small as 36%. In the blend film annealed at 160 °C, on the other hand, the fraction of geminate recombination loss was reduced and, hence, ηFree increased up to 74%. For both blend films, the free charge carriers began to decay bimolecularly after a period of tens of nanoseconds. As illustrated in Fig. 26, the substantial charge loss due to geminate recombination in the as-spun blend film can be assigned to charges generated on isolated polymer chains in the matrix of the other polymer, and those generated at the finely mixed domain interface with disordered P3HT; these undesired blend morphologies hinder spatial separation of the electron–hole pairs into free charges. Thermal annealing promotes demixing of the polymers, leading to the formation of relatively pure domains, ordering of the P3HT chains, and consequently, suppression of the geminate charge recombination. The results of TA measurements indicate that efficient generation of free charge carriers is not inherent to the polymer/fullerene interface, but it is possible for a polymer/polymer interface. In addition, the efficient free charge-carrier generation observed for P3HT/PF12TBT blend films indicates that crystalline polymer acceptors are not necessarily required for free carrier generation. Rather, the relatively low EQEs of polymer/polymer blend solar cells are due to the non-optimized blend morphology. This conclusion regarding efficient free charge-carrier generation at a polymer/polymer interface is reinforced by the EQEmax values, which approach 70–90% for current, state-of-the-art polymer/polymer blend solar cells.
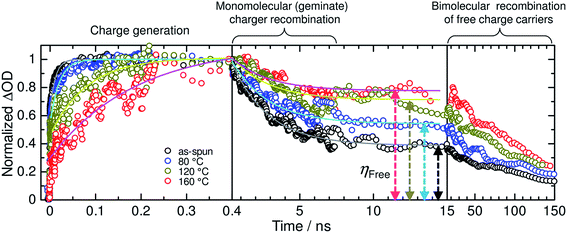 | ||
Fig. 25 Charge generation and recombination dynamics for the as-spun (black circles) and annealed P3HT/PF12TBT blend films at 80, 120, and 160 °C (blue, gold, and red circles, respectively) for 10 min. The TA signals for the charge-induced absorption (ΔOD) were normalized, with the maximum peak intensities set to 1. The solid lines represent the best fitting curves obtained using ΔOD(t) = A[1 − exp(−t/τR)] + B for the charge generation dynamics and ΔOD(t) = G![[thin space (1/6-em)]](https://www.rsc.org/images/entities/char_2009.gif) exp(−t/τD) + C for the charge recombination dynamics. ηFree, which is defined as C/(G + C), was increased via thermal annealing from 36% (as-spun film) to 51% (80 °C-annealed film), 67% (120 °C-annealed film), and 74% (160 °C-annealed film). Reproduced with permission from (ref. 91). Copyright 2015, Wiley-VCH Verlag GmbH & Co. KGaA, Weinheim. exp(−t/τD) + C for the charge recombination dynamics. ηFree, which is defined as C/(G + C), was increased via thermal annealing from 36% (as-spun film) to 51% (80 °C-annealed film), 67% (120 °C-annealed film), and 74% (160 °C-annealed film). Reproduced with permission from (ref. 91). Copyright 2015, Wiley-VCH Verlag GmbH & Co. KGaA, Weinheim. | ||
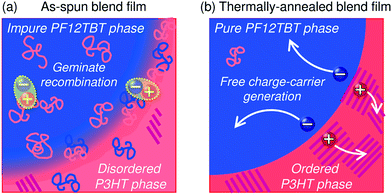 | ||
| Fig. 26 Illustration of the nanoscale morphology of polymer phase separation; (a) the as-spun and (b) thermally annealed P3HT/PF12TBT blend films. | ||
6. Outlook and challenges towards 10%
As a result of considerable research efforts expended on synthesizing various polymer acceptors and optimizing the blend morphology, the PCEs of polymer/polymer blend solar cells have improved significantly in recent years. However, the highest PCE remains below the PCE values of state-of-the-art polymer/fullerene blend solar cells, which have exceeded 10%. To further improve the PCEs of polymer/polymer blends, several challenges must be faced, including the developments of a pair of donor and acceptor polymers with high FF (even in the case of thick blend films), and a new photoactive layer design beyond the limit of simple donor/acceptor binary blends.6.1 Ternary blends
The polymer/polymer blend solar cells with the highest level of PCEs reported in the recent literature have been fabricated by blending a pair of low-bandgap donor and acceptor polymers that exhibit efficient light-absorption capabilities at near-IR wavelengths. This is important in order to obtain large JSC values, even when the thin films optimal for charge-carrier collection are employed. On the other hand, the combination of such low-bandgap polymers inevitably results in weak light absorptivity in the visible region, owing to the intrinsic narrow absorption bandwidths of organic semiconductors (see Fig. 13b). Therefore, further improvement in the PCE requires new design strategies that can complement the weak absorption in the visible range. Ternary blend solar cells, which are fabricated by blending a third material (polymer donor, fullerene acceptor, or dye molecule) into a binary blend of a polymer donor and a PCBM acceptor, are emerging as a fascinating approach to broadening the absorption bandwidth of the photoactive layer.133–139In 2015, Jenekhe et al. fabricated ternary blend all-polymer solar cells composed of one polymer donor PBDTTT-C-T, and two polymer acceptors, naphthalene diimide–selenophene (PNDIS-HD) copolymer and perylene diimide–selenophene (PPDIS) copolymer.140 A PDTTT-CT/PNDIS-HD/PPDIS (1![[thin space (1/6-em)]](https://www.rsc.org/images/entities/char_2009.gif) :
:![[thin space (1/6-em)]](https://www.rsc.org/images/entities/char_2009.gif) 0.25
0.25![[thin space (1/6-em)]](https://www.rsc.org/images/entities/char_2009.gif) :
:![[thin space (1/6-em)]](https://www.rsc.org/images/entities/char_2009.gif) 0.75 by weight) ternary blend exhibited a PCE of 3.2%, which is enhanced compared with those of the corresponding PDTTT-CT/PNDIS-HD (PCE of 1.3%) and PDTTT-CT/PPDIS (PCE of 2.1%) binary blend solar cells. As shown in Fig. 27, the JSC as well as the EQE spectrum of the optimal ternary blend are almost equal to the sum of those of the two binary blends. From analysis of the composition dependence of the photovoltaic parameters, Jenekhe et al. proposed a parallel-like BHJ as a working mechanism for the ternary blend systems.
0.75 by weight) ternary blend exhibited a PCE of 3.2%, which is enhanced compared with those of the corresponding PDTTT-CT/PNDIS-HD (PCE of 1.3%) and PDTTT-CT/PPDIS (PCE of 2.1%) binary blend solar cells. As shown in Fig. 27, the JSC as well as the EQE spectrum of the optimal ternary blend are almost equal to the sum of those of the two binary blends. From analysis of the composition dependence of the photovoltaic parameters, Jenekhe et al. proposed a parallel-like BHJ as a working mechanism for the ternary blend systems.
 | ||
| Fig. 27 (a) Composition of the ternary [PBDTTT-C-T]1[PNDIS-HD]1−x[PPDIS]x blend illustrated on a ternary diagram. (b) J–V characteristics and (c) EQE spectra as functions of [PPDIS]x composition, where x is the PPDIS weight fraction in the binary acceptor components (x = 0.10, 0.30, 0.50, 0.75). Reproduced with permission from (ref. 140). Copyright 2015, Materials Research Society. | ||
Also in 2015, Ito et al. designed ternary blend all-polymer solar cells in which a wide-bandgap polymer, PCDTBT, was introduced into the low-bandgap PTB7-Th/P(NDI2OD-T2) blend as a second donor (Fig. 28).141 For a ternary blend all-polymer solar cell containing 10-wt% PCDTBT, the relatively low EQEs at visible wavelengths of the PTB7-Th/P(NDI2OD-T2) binary blend were increased from 50% to ca. 70%, while retaining the excellent EQEs of ∼60% at near-IR wavelengths (Fig. 28c). Consequently, a PCE of 6.65% with a JSC of 14.4 mA cm−2 was achieved, which is significantly higher than the value of 5.70% with a JSC of 12.4 mA cm−2 obtained for an individually optimized PTB7-Th/P(NDI2OD-T2) binary blend. The compositional dependence strongly suggests that PCDTBT contributed to the photocurrent generation as a visible sensitizer through efficient energy transfer for both PTB7-Th and P(NDI2OD-T2). In that case, the PCDTBT absorbed visible light, but relied on both PBDTTT-EF-T and N2200 host polymers to generate and transport free charge carriers. Thus, an improvement in the PCE can be achieved by taking full advantage of the excellent photovoltaic conversion characteristics of the PTB7-Th/P(NDI2OD-T2) binary blend.61 Ito et al.'s results suggest that the use of ternary blends composed of a wide-bandgap polymer as a third material, along with an efficient low-bandgap donor/acceptor polymer blend, is an effective strategy for achieving higher-efficiency all-polymer blend solar cells. We note that, as predicted by the broken line in Fig. 3a, a PCE of close to 10% can be achieved if JSC is improved to more than 22 mA cm−2. Such a target JSC value will be achievable by applying the concept of ternary blends to the state-of-the-art low-bandgap PTB7-Th/PNDIS-HD blends that suffer from weak light absorptivity in the visible range (see Fig. 13b).
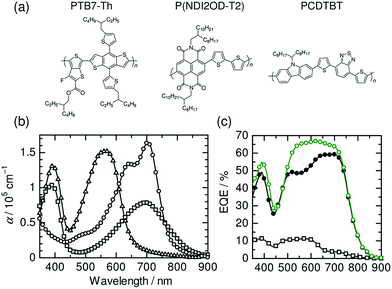 | ||
| Fig. 28 (a) Chemical structures of polymers used for ternary blend solar cells. (b) Absorption coefficients α of PTB7-Th (circles), P(NDI2OD-T2) (squares), and PCDTBT (triangles) measured in neat films. (c) EQE spectra of PTB7-Th/P(NDI2OD-T2)/PCDTBT ternary (open circles), PTB7-Th/P(NDI2OD-T2) binary (solid circles), and P(NDI2OD-T2)/N2200 binary (open squares) BHJ solar cells measured under AM1.5G illumination from a calibrated solar simulator with 100 mW cm−2 intensity. The loading amount of PCDTBT in the ternary blend was 10 wt%. Reproduced with permission from (ref. 141). Copyright 2015, The Royal Society of Chemistry. | ||
6.2 Suppression of bimolecular charge recombination for high FF
The superior performance of polymer/fullerene blend solar cells has been attributed not only to the large JSC approaching 18 mA cm−2, but also to the high FFs of larger than 0.7, which are obtained at the same time.6–9 However, the majority of polymer/polymer blend solar cells reported to date exhibit FFs of less than 0.6 (Fig. 3c). Even the current, state-of-the-art devices with the highest level of PCEs are affected by the same problem, which suggests that the FF is the primary factor limiting the PCEs of the present polymer/polymer blend solar cells. For example, PBDTTT-C-T/30PDI blend solar cells have exhibited a PCE of 6.29% with a FF of 0.45,74 and PTB7-Th/PNDIS-HD blends have yielded a PCE of 7.73% with a FF of 0.51.76 If the FF of these blend systems could be improved to 0.70, PCEs of 10% could be obtained.It is widely believed that, in order to achieve high FF in polymer/fullerene blend solar cells, the μh and μe should be balanced and greater than 10−4 cm2 V−1 s−1. With regard to this point, the FF values of polymer/polymer blend solar cells based on rylene diimide-based polymer acceptors in Table 1 have been plotted against the μh and μe in such blends in Fig. 29a and b. In addition, the mobility ratio of two carriers for each device, which is defined as the ratio of the slower carrier mobility to the faster carrier mobility, has been calculated and plotted against the corresponding FF (Fig. 29c). These plots illustrate that the FFs are limited to approximately 0.6, even for devices with high mobility values (>10−4 cm2 V−1 s−1) and balanced mobility ratios (>0.1). In other words, establishing such relatively high and balanced mobilities alone is not sufficient to obtain an excellent FF approaching 0.7. Recent studies by Neher et al.,54 Koster et al.,142 and McGehee et al.143 suggest that this is because the FF does not depend on the charge extraction rate only; rather, it can be determined by the ratio of the extraction and recombination rates of the charge carriers. To achieve high FFs in polymer/polymer blend systems, it is important to reduce the bimolecular recombination of charge carriers, in addition to improving the charge transport ability of constituent polymers by establishing high and balanced mobilities.
Among the polymer/polymer blend solar cells reported to date, only a few sets of semicrystalline polymer/polymer blends, J51/P(NDI2OD-T2), P3HT/P(NDI2OD-T2) and P3HT/P(NDI-TCPDTT), can function with excellent FF values of 0.65–0.70. Interestingly, as shown by the stars in Fig. 29d, P3HT/P(NDI2OD-T2) and P3HT/P(NDI-TCPDTT) blends maintain excellent FFs even for thick active layers of more than 300 nm.44,54 Neher et al. have ascribed the high FF of the P3HT/P(NDI2OD-T2) blend to the strongly suppressed bimolecular recombination coefficient γBMR, which is as small as 5 × 10⁻¹² cm3 s−1. This γBMR is a factor of 1000 lower than the Langevin-type recombination coefficient γL of 3 × 10⁻⁹ cm3 s−1, as obtained from eqn (2) using the carrier mobilities measured for the blend:54
 | (2) |
7. Conclusion
The ongoing developments of NDI-based polymer acceptors and the continuous efforts towards controlling the blend morphology have increased the PCEs of polymer/polymer blend solar cells above the 8% level. In particular, state-of-the-art low-bandgap donor/acceptor blends have exhibited maximum EQEs exceeding 80%, indicating that both the generation and collection efficiencies of the free charge carriers are higher than 80% under short-circuit conditions. These results confirm that the capacity for efficient free charge-carrier generation is not inherent to the polymer/fullerene domain interface, but it is possible for a polymer/polymer domain interface. On the other hand, further improvement of these devices towards the achievement of 10% PCE requires sufficient light absorption at visible wavelengths and a high FF close to 0.7. Broadening the absorption bandwidth through a ternary blend of conjugated polymers and reducing the bimolecular charge recombination by optimizing the blend morphology will pave the way towards the realization of 10% PCE for these devices.Acknowledgements
This work was supported by the Japan Society for the Promotion of Science (JSPS) through the “Funding Program for World-Leading Innovative R&D on Science and Technology (FIRST Program),” initiated by the Council for Science and Technology Policy (CSTP), the CREST program from the Japan Science and Technology Agency, and the JSPS KAKENHI Grant Number 26288060.References
- R. Søndergaard, M. Hösel, D. Angmo, T. T. Larsen-Olsen and F. C. Krebs, Mater. Today, 2012, 15, 36 CrossRef.
- S. B. Darling and F. You, RSC Adv., 2013, 3, 17633 RSC.
- L. Bian, E. Zhu, J. Tang, W. Tang and F. Zhang, Prog. Polym. Sci., 2012, 37, 1292 CrossRef CAS.
- C. J. Brabec, S. Gowrisanker, J. J. M. Halls, D. Laird, S. Jia and S. P. Williams, Adv. Mater., 2010, 22, 3839 CrossRef CAS PubMed.
- G. Dennler, M. C. Scharber and C. J. Brabec, Adv. Mater., 2009, 21, 1323 CrossRef CAS.
- V. Vohra, K. Kawashima, T. Kakara, T. Koganezawa, I. Osaka, K. Takimiya and H. Murata, Nat. Photonics, 2015, 9, 403 CrossRef CAS.
- Z. He, B. Xiao, F. Liu, H. Wu, Y. Yang, S. Xiao, C. Wang, T. P. Russell and Y. Cao, Nat. Photonics, 2015, 9, 174 CrossRef CAS.
- Y. Liu, J. Zhao, Z. Li, C. Mu, W. Ma, H. Hu, K. Jiang, H. Lin, H. Ade and H. Yan, Nat. Commun., 2014, 5, 5293 CrossRef CAS PubMed.
- M. A. Green, K. Emery, Y. Hishikawa, W. Warta and E. D. Dunlop, Prog. Photovolt. Res. Appl., 2016, 24, 3 CrossRef.
- S. C. Veenstra, J. Loos and J. M. Kroon, Prog. Photovolt. Res. Appl., 2007, 15, 727 CrossRef CAS.
- C. R. McNeill and N. C. Greenham, Adv. Mater., 2009, 21, 3840 CrossRef CAS.
- C. R. McNeill, Energy Environ. Sci., 2012, 5, 5653 CAS.
- A. Facchetti, Mater. Today, 2013, 16, 123 CrossRef CAS.
- T. Kim, J. H. Kim, T. E. Kang, C. Lee, H. Kang, M. Shin, C. Wang, B. Ma, U. Jeong, T. S. Kim and B. J. Kim, Nat. Commun., 2015, 6, 8547 CrossRef CAS PubMed.
- P. J. Flory, Principles of Polymer Chemistry, Cornell University Press, 1953, pp. 495–540 Search PubMed.
- G. Strobl, The Physics of Polymers—Concepts for Understanding Their Structures and Behavior, Springer-Verlag, Berlin Heidelberg, 3rd rev. and expanded edn, 2007, pp. 106–122 Search PubMed.
- O. V. Mikhnenko, H. Azimi, M. Scharber, M. Morana, P. W. M. Blom and M. A. Loi, Energy Environ. Sci., 2012, 5, 6960 CAS.
- O. V. Mikhnenko, P. W. M. Blom and T.-Q. Nguyen, Energy Environ. Sci., 2015, 8, 1867 Search PubMed.
- Y. Wang, H. Benten, S. Ohara, D. Kawamura, H. Ohkita and S. Ito, ACS Appl. Mater. Interfaces, 2014, 6, 14108 CAS.
- Y. Tamai, Y. Matsuura, H. Ohkita, H. Benten and S. Ito, J. Phys. Chem. Lett., 2014, 5, 399 CrossRef CAS PubMed.
- Y. Tamai, H. Ohkita, H. Benten and S. Ito, J. Phys. Chem. Lett., 2015, 6, 3417 CrossRef CAS PubMed.
- T. M. Clarke and J. R. Durrant, Chem. Rev., 2010, 110, 6736 CrossRef CAS PubMed.
- H. Ohkita and S. Ito, Polymer, 2011, 52, 4397 CrossRef CAS.
- H. Ohkita and S. Ito, Organic Solar Cells—Materials and Device Physics—, ed. W. C. H. Choy, Springer-Verlag, London, 2013, pp. 103–137 Search PubMed.
- H. Ohkita, Y. Tamai, H. Benten and S. Ito, IEEE J. Sel. Top. Quantum Electron., 2016, 22, 4100612 CrossRef.
- J. J. M. Halls, C. A. Walsh, N. C. Greenham, E. A. Marseglia, R. H. Friend, S. C. Moratti and A. B. Holmes, Nature, 1995, 376, 498 CrossRef CAS.
- G. Yu and A. J. Heeger, J. Appl. Phys., 1995, 78, 4510 CrossRef CAS.
- M. Granström, K. Petritsch, A. C. Arias, A. Lux, M. R. Andersson and R. H. Friend, Nature, 1998, 395, 257 CrossRef.
- A. J. Breeze, Z. Schlesinger, S. A. Carter, H. Tillmann and H.-H. Hörhold, Sol. Energy Mater. Sol. Cells, 2004, 83, 263 CrossRef CAS.
- T. Kietzke, H.-H. Hӧrhold and D. Neher, Chem. Mater., 2005, 17, 6532 CrossRef CAS.
- M. M. Koetse, J. Sweelssen, K. T. Hoekerd, H. F. M. Schoo, S. C. Veenstra, J. M. Kroon, X. Yang and J. Loos, Appl. Phys. Lett., 2006, 88, 083504 CrossRef.
- X. Zhan, Z. Tan, B. Domercq, Z. An, X. Zhang, S. Barlow, Y. Li, D. Zhu, B. Kippelen and S. R. Marder, J. Am. Chem. Soc., 2007, 129, 7246 CrossRef CAS PubMed.
- C. R. McNeill, A. Abrusci, J. Zaumseil, R. Wilson, M. J. McKieman, J. H. Burroughes, J. J. M. Halls, N. C. Greenham and R. H. Friend, Appl. Phys. Lett., 2007, 90, 193506 CrossRef.
- Z. Tan, E. Zhou, X. Zhan, X. Wang, Y. Li, S. Barlow and S. R. Marder, Appl. Phys. Lett., 2008, 93, 073309 CrossRef.
- G. Sang, Y. Zou, Y. Huang, G. Zhao, Y. Yang and Y. Li, Appl. Phys. Lett., 2009, 94, 193302 CrossRef.
- T. W. Holcombe, C. H. Woo, D. F. J. Kavulak, B. C. Thompson and J. M. J. Fréchet, J. Am. Chem. Soc., 2009, 131, 14160 CrossRef CAS PubMed.
- J. A. Mikroyannidis, M. M. Stylianakis, G. D. Sharma, P. Balraju and M. S. Roy, J. Phys. Chem. C, 2009, 113, 7904 CAS.
- X. He, F. Gao, G. Tu, D. Hasko, S. Hüttner, U. Steiner, N. C. Greenham, R. H. Friend and W. T. S. Huck, Nano Lett., 2010, 10, 1302 CrossRef CAS PubMed.
- S. Fabiano, Z. Chen, S. Vahedi, A. Facchetti, B. Pignataro and M. A. Loi, J. Mater. Chem., 2011, 21, 5891 RSC.
- T. W. Holcombe, J. E. Norton, J. Rivnay, C. H. Woo, L. Goris, C. Piliego, G. Griffini, A. Sellinger, J.-L. Brédas, A. Salleo and J. M. J. Fréchet, J. Am. Chem. Soc., 2011, 133, 12106 CrossRef CAS PubMed.
- D. Mori, H. Benten, J. Kosaka, H. Ohkita, S. Ito and K. Miyake, ACS Appl. Mater. Interfaces, 2011, 3, 2924 CAS.
- E. Zhou, J. Cong, Q. Wei, K. Tajima, C. Yang and K. Hashimoto, Angew. Chem., Int. Ed., 2011, 50, 2799 CrossRef CAS PubMed.
- Y.-J. Hwang, G. Ren, N. M. Murari and S. A. Jenekhe, Macromolecules, 2012, 45, 9056 CrossRef CAS.
- M. Schubert, D. Dolfen, J. Frisch, S. Roland, R. Steyrleuthner, B. Stiller, Z. Chen, U. Scherf, N. Koch, A. Facchetti and D. Neher, Adv. Energy Mater., 2012, 2, 369 CrossRef CAS.
- E. Zhou, J. Cong, M. Zhao, L. Zhang, K. Hashimoto and K. Tajima, Chem. Commun., 2012, 48, 5283 RSC.
- D. Mori, H. Benten, H. Ohkita, S. Ito and K. Miyake, ACS Appl. Mater. Interfaces, 2012, 4, 3325 CAS.
- Y. Tang and C. R. McNeill, J. Polym. Sci., Part B: Polym. Phys., 2013, 51, 403 CrossRef CAS.
- Y. Zhou, Q. Yan, Y.-Q. Zheng, J.-Y. Wang, D. Zhao and J. Pei, J. Mater. Chem. A, 2013, 1, 6609 CAS.
- T. Earmme, Y. J. Hwang, N. M. Murari, S. Subramaniyan and S. A. Jenekhe, J. Am. Chem. Soc., 2013, 135, 14960 CrossRef CAS PubMed.
- E. Zhou, J. Cong, K. Hashimoto and K. Tajima, Adv. Mater., 2013, 25, 6991 CrossRef CAS PubMed.
- D. Mori, H. Benten, I. Okada, H. Ohkita and S. Ito, Adv. Energy Mater., 2014, 4, 1301006 Search PubMed.
- Q. Yang, H. Song, B. Gao, Y. Wang, Y. Fu, J. Yang, Z. Xie and L. Wang, RSC Adv., 2014, 4, 12579 RSC.
- W. Yu, D. Yang, X. Zhu, X. Wang, G. Tu, D. Fan, J. Zhang and C. Li, ACS Appl. Mater. Interfaces, 2014, 6, 2350 CAS.
- S. Roland, M. Schubert, B. A. Collins, J. Kurpiers, Z. Chen, A. Facchetti, H. Ade and D. Neher, J. Phys. Chem. Lett., 2014, 5, 2815 CrossRef CAS PubMed.
- N. Zhou, H. Lin, S. J. Lou, X. Yu, P. Guo, E. F. Manley, S. Loser, P. Hartnett, H. Huang, M. R. Wasielewski, L. X. Chen, R. P. H. Chang, A. Facchetti and T. J. Marks, Adv. Energy Mater., 2014, 4, 1300785 Search PubMed.
- P. Cheng, L. Ye, X. Zhao, J. Hou, Y. Li and X. Zhan, Energy Environ. Sci., 2014, 7, 1351 CAS.
- Y. Zhou, T. Kurosawa, W. Ma, Y. Guo, L. Fang, K. Vandewal, Y. Diao, C. Wang, Q. Yan, J. Reinspach, J. Mei, A. L. Appleton, G. I. Koleilat, Y. Gao, S. C. B. Mannsfeld, A. Salleo, H. Ade, D. Zhao and Z. Bao, Adv. Mater., 2014, 26, 3767 CrossRef CAS PubMed.
- H. Kang, K.-H. Kim, J. Choi, C. Lee and B. J. Kim, ACS Macro Lett., 2014, 3, 1009 CrossRef CAS.
- T. Earmme, Y.-J. Hwang, S. Subramaniyan and S. A. Jenekhe, Adv. Mater., 2014, 26, 6080 CrossRef CAS PubMed.
- C. Mu, P. Liu, W. Ma, K. Jiang, J. Zhao, K. Zhang, Z. Chen, Z. Wei, Y. Yi, J. Wang, S. Yang, F. Huang, A. Facchetti, H. Ade and H. Yan, Adv. Mater., 2014, 26, 7224 CrossRef CAS PubMed.
- D. Mori, H. Benten, I. Okada, H. Ohkita and S. Ito, Energy Environ. Sci., 2014, 7, 2939 CAS.
- G. Shi, J. Yuan, X. Huang, Y. Lu, Z. Liu, J. Peng, G. Ding, S. Shi, J. Sun, K. Lu, H.-Q. Wang and W. Ma, J. Phys. Chem. C, 2015, 119, 25298 CAS.
- B. Xiao, G. Ding, Z. Tan and E. Zhou, Polym. Chem., 2015, 6, 7594 RSC.
- S. Dai, P. Cheng, Y. Lin, Y. Wang, L. Ma, Q. Ling and X. Zhan, Polym. Chem., 2015, 6, 5254 RSC.
- F. Liu, H. Li, C. Gu and H. Fu, RSC Adv., 2015, 5, 10072 RSC.
- L. Ye, X. Jiao, H. Zhang, S. Li, H. Yao, H. Ade and J. Hou, Macromolecules, 2015, 48, 7156 CrossRef CAS.
- W. Li, Y. An, M. M. Wienk and R. A. J. Janssen, J. Mater. Chem. A, 2015, 3, 6756 CAS.
- I. H. Jung, D. Zhao, J. Jang, W. Chen, E. S. Landry, L. Lu, D. V. Talapin and L. Yu, Chem. Mater., 2015, 27, 5941 CrossRef CAS.
- F. Liu, H. Li, Y. Wu, C. Gu and H. Fu, RSC Adv., 2015, 5, 92151 RSC.
- J. Yuan and W. Ma, J. Mater. Chem. A, 2015, 3, 7077 CAS.
- H. Kang, M. A. Uddin, C. Lee, K.-H. Kim, T. L. Nguyen, W. Lee, Y. Li, C. Wang, H. Y. Woo and B. J. Kim, J. Am. Chem. Soc., 2015, 137, 2359 CrossRef CAS PubMed.
- L. Ye, X. Jiao, M. Zhou, S. Zhang, H. Yao, W. Zhao, A. Xia, H. Ade and J. Hou, Adv. Mater., 2015, 27, 6046 CrossRef CAS PubMed.
- C. Lee, H. Kang, W. Lee, T. Kim, K. H. Kim, H. Y. Woo, C. Wang and B. J. Kim, Adv. Mater., 2015, 27, 2466 CrossRef CAS PubMed.
- Y. J. Hwang, T. Earmme, B. A. E. Courtright, F. N. Eberle and S. A. Jenekhe, J. Am. Chem. Soc., 2015, 137, 4424 CrossRef CAS PubMed.
- J. W. Jung, J. W. Jo, C. C. Chueh, F. Liu, W. H. Jo, T. P. Russell and A. K.-Y. Jen, Adv. Mater., 2015, 27, 3310 CrossRef CAS PubMed.
- Y. J. Hwang, B. A. E. Courtright, A. S. Ferreira, S. H. Tolbert and S. A. Jenekhe, Adv. Mater., 2015, 27, 4578 CrossRef CAS PubMed.
- L. Gao, Z.-G. Zhang, L. Xue, J. Min, J. Zhang, Z. Wei and Y. Li, Adv. Mater., 2016, 28, 1884 CrossRef CAS PubMed.
- H. Yan, Z. Chen, Y. Zheng, C. Newman, J. R. Quinn, F. Dötz, M. Kastler and A. Facchetti, Nature, 2009, 457, 679 CrossRef CAS PubMed.
- J. R. Moore, S. Albert-Seifried, A. Rao, S. Massip, B. Watts, D. J. Morgan, R. H. Friend, C. R. McNeill and H. Sirringhaus, Adv. Energy Mater., 2011, 1, 230 CrossRef CAS.
- H. Yan, B. A. Collins, E. Gann, C. Wang, H. Ade and C. R. McNeill, ACS Nano, 2012, 6, 677 CrossRef CAS PubMed.
- R. Steyrleuthner, M. Schubert, I. Howard, B. Klaumünzer, K. Schilling, Z. Chen, P. Saalfrank, F. Laquai, A. Facchetti and D. Neher, J. Am. Chem. Soc., 2012, 134, 18303 CrossRef CAS PubMed.
- http://faculty.wcas.northwestern.edu/%7Eafa912/ .
- A. C. Arias, J. D. MacKenzie, R. Stevenson, J. J. H. Halls, M. Inbasekaran, E. P. Woo, D. Richards and R. H. Friend, Macromolecules, 2001, 34, 6005 CrossRef CAS.
- H. J. Snaith, A. C. Arias, A. C. Morteani, C. Silva and R. H. Friend, Nano Lett., 2002, 2, 1353 CrossRef CAS.
- R. Shikler, M. Chiesa and R. H. Friend, Macromolecules, 2006, 39, 5393 CrossRef CAS.
- S. Swaraj, C. Wang, H. Yan, B. Watts, J. Lüning, C. R. McNeill and H. Ade, Nano Lett., 2010, 10, 2863 CrossRef CAS PubMed.
- C. R. McNeill, A. Abrusci, I. Hwang, M. A. Ruderer, R. M. Buschbaum and N. C. Greenham, Adv. Funct. Mater., 2009, 19, 3103 CrossRef CAS.
- H. C. Liao, C. C. Ho, C. Y. Chang, M. H. Jao, S. B. Darling and W. F. Su, Mater. Today, 2013, 16, 326 CrossRef CAS.
- X. Liu, S. Huettner, Z. Rong, M. Sommer and R. H. Friend, Adv. Mater., 2012, 24, 669 CrossRef CAS PubMed.
- S. Ito, T. Hirata, D. Mori, H. Benten, L. T. Lee and H. Ohkita, J. Photopolym. Sci. Technol., 2013, 26, 175 CrossRef CAS.
- D. Mori, H. Benten, H. Ohkita and S. Ito, Adv. Energy Mater., 2015, 5, 1500304 Search PubMed.
- S. R. Scully, P. B. Armstrong, C. Edder, J. M. J. Fréchet and M. D. McGehee, Adv. Mater., 2007, 19, 2961 CrossRef CAS.
- Y. Wang, H. Ohkita, H. Benten and S. Ito, ChemPhysChem, 2015, 16, 1263 CrossRef CAS PubMed.
- J. K. J. van Duren, X. Yang, J. Loos, C. W. T. Bulle-Lieuwma, A. B. Sieval, J. C. Hummelen and R. A. J. Janssen, Adv. Funct. Mater., 2004, 14, 425 CrossRef CAS.
- L. M. Andersson, F. Zhang and O. Inganäs, Appl. Phys. Lett., 2007, 91, 071108 CrossRef.
- S. Wakim, S. Beaupré, N. Blouin, B. Aich, S. Rodman, R. Gaudiana, Y. Tao and M. Leclerc, J. Mater. Chem., 2009, 19, 5351 RSC.
- S. Berson, R. D. Bettignies, S. Bailly and S. Guillerez, Adv. Funct. Mater., 2007, 17, 1377 CrossRef CAS.
- H. Xin, G. Ren, F. S. Kim and S. A. Jenekhe, Chem. Mater., 2008, 20, 6199 CrossRef CAS.
- Z. Yin and Q. Zheng, Adv. Energy Mater., 2012, 2, 179 CrossRef CAS.
- S. B. Jo, W. H. Lee, L. Qiu and K. Cho, J. Mater. Chem., 2012, 22, 4244 RSC.
- T. Salim, S. Sun, L. H. Wong, L. Xi, Y. L. Foo and Y. M. Lam, J. Phys. Chem. C, 2010, 114, 9459 CAS.
- S. Samitsu, T. Shimomura and K. Ito, Thin Solid Films, 2008, 516, 2478 CrossRef CAS.
- C. R. G. Grenier, W. Pisula, T. J. Joncheray, K. Müllen and J. R. Reynolds, Angew. Chem., Int. Ed., 2007, 46, 714 CrossRef CAS PubMed.
- H.-W. Wang, E. Pentzer, T. Emrick and T. P. Russell, ACS Macro Lett., 2014, 3, 30 CrossRef CAS.
- A. L. Briseno, S. C. B. Mannsfeld, P. J. Shamberger, F. S. Ohuchi, Z. Bao, S. A. Jenekhe and Y. Xia, Chem. Mater., 2008, 20, 4712 CrossRef CAS.
- E. V. Canesi, A. Luzio, B. Saglio, A. Bianco, M. Caironi and C. Bertarelli, ACS Macro Lett., 2012, 1, 366 CrossRef CAS.
- F. S. Bates and G. H. Fredrickson, Annu. Rev. Phys. Chem., 1990, 41, 525 CrossRef CAS PubMed.
- F. S. Bates, Science, 1991, 251, 898 CrossRef CAS PubMed.
- P. F. van Hutten and G. Hadziioannou, Monatsh. Chem., 2001, 132, 129 CrossRef CAS.
- U. Stalmach, B. de Boer, C. Videlot, P. F. van Hutten and G. Hadziioannou, J. Am. Chem. Soc., 2000, 122, 5464 CrossRef CAS.
- M. J. Robb, S.-Y. Ku and C. J. Hawker, Adv. Mater., 2013, 25, 5686 CrossRef CAS PubMed.
- J. Wang and T. Higashihara, Polym. Chem., 2013, 4, 5518 RSC.
- K. Nakabayashi and H. Mori, Materials, 2014, 7, 3274 CrossRef CAS.
- Y. Lee and E. D. Gomez, Macromolecules, 2015, 48, 7385 CrossRef CAS.
- S. Miyanishi, Y. Zhang, K. Tajima and K. Hashimoto, Chem. Commun., 2010, 46, 6723 RSC.
- R. C. Mulherin, S. Jung, S. Huettner, K. Johnson, P. Kohn, M. Sommer, S. Allard, U. Scherf and N. C. Greenham, Nano Lett., 2011, 11, 4846 CrossRef CAS PubMed.
- S.-Y. Ku, M. A. Brady, N. D. Treat, J. E. Cochran, M. J. Robb, E. J. Kramer, M. L. Chabinyc and C. J. Hawker, J. Am. Chem. Soc., 2012, 134, 16040 CrossRef CAS PubMed.
- K. Nakabayashi and H. Mori, Macromolecules, 2012, 45, 9618 CrossRef CAS.
- J. Wang, M. Ueda and T. Higashihara, ACS Macro Lett., 2013, 2, 506 CrossRef CAS.
- C. Guo, Y.-H. Lin, M. D. Witman, K. A. Smith, C. Wang, A. Hexemer, J. Strzalka, E. D. Gomez and R. Verduzco, Nano Lett., 2013, 13, 2957 CrossRef CAS PubMed.
- C. Yin, T. Kietzke, M. Kumke, D. Neher and H.-H. Hörhold, Sol. Energy Mater. Sol. Cells, 2007, 91, 411 CrossRef CAS.
- C. Yin, M. Schubert, S. Bange, B. Stiller, M. Castellani, D. Neher, M. Kumke and H.-H. Hörhold, J. Phys. Chem. C, 2008, 112, 14607 CAS.
- M. M. Mandoc, W. Veurman, L. J. A. Koster, B. Boer and P. W. M. Blom, Adv. Funct. Mater., 2007, 17, 2167 CrossRef CAS.
- A. G. Rabade, A. C. Morteani and R. H. Friend, Adv. Mater., 2009, 21, 3924 CrossRef.
- J. M. Hodgkiss, A. R. Campbell, R. A. Marsh, A. Rao, S. A. Seifried and R. H. Friend, Phys. Rev. Lett., 2010, 104, 177701 CrossRef PubMed.
- C. R. McNeill, S. Westenhoff, C. Groves, R. H. Friend and N. C. Greenham, J. Phys. Chem. C, 2007, 111, 19153 CAS.
- Y.-S. Huang, S. Westenhoff, I. Avilov, P. Sreearunothai, J. M. Hodgkiss, C. Deleener, R. H. Friend and D. Beljonne, Nat. Mater., 2008, 7, 483 CrossRef CAS PubMed.
- C. Groves, R. A. Marsh and N. C. Greenham, J. Chem. Phys., 2008, 129, 114903 CrossRef CAS PubMed.
- J. Guo, H. Ohkita, H. Benten and S. Ito, J. Am. Chem. Soc., 2010, 132, 6154 CrossRef CAS PubMed.
- I. A. Howard, R. Mauer, M. Meister and F. Laquai, J. Am. Chem. Soc., 2010, 132, 14866 CrossRef CAS PubMed.
- C. J. Brabec, G. Zerza, G. Cerullo, S. D. Silvestri, S. Luzzati, J. C. Hummelen and S. Sariciftci, Chem. Phys. Lett., 2001, 340, 232 CrossRef CAS.
- S. Yamamoto, H. Ohkita, H. Benten, S. Ito, S. Yamamoto, D. Kitazawa and J. Tsukamoto, J. Phys. Chem. C, 2013, 117, 11514 CAS.
- Q. An, F. Zhang, J. Zhang, W. Tang, Z. Deng and B. Hu, Energy Environ. Sci., 2016, 9, 281 Search PubMed.
- L. Lu, M. A. Kelly, W. You and L. Yu, Nat. Photonics, 2015, 9, 491 CrossRef CAS.
- B. M. Savoie, S. Dunaisky, T. J. Marks and M. A. Ratner, Adv. Energy Mater., 2014, 5, 1400891 Search PubMed.
- T. Ameri, P. Khoram, J. Min and C. J. Brabec, Adv. Mater., 2013, 25, 4245 CrossRef CAS PubMed.
- L. Yang, L. Yan and W. You, J. Phys. Chem. Lett., 2013, 4, 1802 CrossRef CAS PubMed.
- Y. C. Chen, C. Y. Hsu, R. Y. Y. Lin, K. C. Ho and J. T. Lin, ChemSusChem, 2013, 6, 20 CrossRef CAS PubMed.
- P. P. Khlyabich, B. Burkhart, A. E. Rudenko and B. C. Thompson, Polymer, 2013, 54, 5267 CrossRef CAS.
- Y. J. Hwang, B. A. E. Courtright and S. A. Jenekhe, MRS Commun., 2015, 5, 229 CrossRef CAS.
- H. Benten, T. Nishida, D. Mori, H. Xu, H. Ohkita and S. Ito, Energy Environ. Sci., 2016, 9, 135 CAS.
- D. Bartesaghi, I. d. C. Pérez, J. Kniepert, S. Roland, M. Turbiez, D. Neher and L. J. A. Koster, Nat. Commun., 2015, 6, 7083 CrossRef CAS PubMed.
- J. A. Bartelt, D. Lam, T. M. Burke, S. M. Sweetnam and M. D. McGehee, Adv. Energy Mater., 2015, 5, 1500577 Search PubMed.
| This journal is © The Royal Society of Chemistry 2016 |


