 Open Access Article
Creative Commons Attribution 3.0 Unported Licence
Whipped oil stabilised by surfactant crystals†
Bernard P.
Binks
*a,
Emma J.
Garvey
a and
Josélio
Vieira
b
aDepartment of Chemistry, University of Hull, Hull, HU6 7RX, UK. E-mail: b.p.binks@hull.ac.uk
bNestlé Product Technology Centre, PO Box 204, Haxby Road, York, YO91 1XY, UK
First published on 3rd March 2016
Abstract
We describe a protocol for preparing very stable air-in-oil foams starting with a one-phase oil solution of a fatty acid (myristic acid) in high oleic sunflower oil at high temperature. Upon cooling below the solubility limit, a two-phase mixture consisting of fatty acid crystals (length around 50 μm) dispersed in an oil solution at its solubility is formed which, after whipping, coat air bubbles in the foam. Foams which do not drain, coalesce or coarsen may be produced either by increasing the fatty acid concentration at fixed temperature or aerating the mixtures at different temperatures at constant concentration. We prove that molecular fatty acid is not surface-active as no foam is possible in the one-phase region. Once the two-phase region is reached, fatty acid crystals are shown to be surface-active enabling foam formation, and excess crystals serve to gel the continuous oil phase enhancing foam stability. A combination of rheology, X-ray diffraction and pulsed nuclear magnetic resonance is used to characterise the crystals and oil gels formed before aeration. The crystal-stabilised foams are temperature-sensitive, being rendered completely unstable on heating around the melting temperature of the crystals. The findings are extended to a range of vegetable oil foams stabilised by a combination of adsorbed crystals and gelling of the oil phase, which destabilise at different temperatures depending on the composition and type of fatty acid chains in the triglyceride molecules.
Introduction
There is scant literature on the foaming of oils, i.e. gas-in-oil, in sharp contrast to that of aqueous-based foams. This is despite their occurrence in a number of industries, including the food and oilfield chemical ones. For example, bubbles are included in chocolate (fat-based) not to add any nutritional value but to change the texture and mouth-feel characteristics of importance to the consumer.1 Such foams are lighter than the oil alone and of current interest in foods due to the reduced oil/fat content. The unwanted foaming of petroleum or crude oil is a major problem during gas–oil separation and appropriate antifoams need to be designed which involve specific considerations not encountered in aqueous systems.2–4 Since the surface tension of most hydrocarbon-containing oils is low (<35 mN m−1) compared with that for water (72 mN m−1 at 25 °C), the driving force for adsorption of many hydrocarbon-based surfactants to their surface is significantly reduced.5Nonetheless, foam stabilisation of oils has been achieved using a number of strategies. Early work by Ross and co-workers with lubricating oils demonstrated the importance of nearness of the system to the solubility phase boundary of the added foaming agent in the oil.6,7 Foamability and foam stability increased dramatically close to the condition where the foaming agent became insoluble and probably more surface-active. This was supported by the data of Friberg et al.8 for xylene foams stabilised by triethanolammonium oleate surfactant; no foam was produced when the surfactant formed an isotropic liquid phase but relatively stable foams occurred in the two-phase region containing a lamellar liquid crystalline phase. It was suggested that this aggregated phase adhered to air bubble surfaces. More recent work with poly(decene) oil and a range of low molar mass and polymeric surfactants has provided further evidence of foaming being enhanced around the solubility limit of a particular ingredient.9 Additionally, in that work, the increased viscosity of the oil phase at higher surfactant concentrations stabilised the foams to gravity-induced drainage of oil. A comprehensive series of papers by Shrestha and co-workers demonstrated that very stable foams of either liquid paraffin, squalane, squalene, a branched C8 triglyceride and olive oil with various long chain fatty acid esters as stabilisers could be produced depending on the location of the mixture within the phase diagram.10–13 Liquid petroleum gas was first dissolved in oil and foam was generated upon releasing the pressure in the vessel. The authors consistent conclusion was that the most stable foams to coalescence occurred when solid particles of surfactant (Lβ phase) were present compared with aggregates of the lamellar liquid crystalline phase (Lα phase), and that these coated air bubbles resisted coalescence. Since the surface energy of fluorocarbons is lower than that of hydrocarbons, another strategy discussed by Bergeron et al.14 was to use fluorocarbon surfactants capable of lowering the dodecane-air tension by up to 5 mN m−1. Foams and foam films (air-oil-air) were stabilised via surfactant adsorption, with a repulsive disjoining pressure created by the overlap of surfactant layers on neighbouring bubble surfaces leading to stability.
An alternative to using molecular stabilisers for oil foams is to design suitably surface-active solid particles of low surface energy. Since particles of a suitable size range are effectively irreversibly adsorbed, ultra-stable foams should result. The idea was shown by Murakami and Bismarck15 for oligotetrafluoroethylene particles and by ourselves for a range of commercial polytetrafluoroethylene particles.16 In subsequent work, we identified the conditions required for successful foaming of a range of oils in terms of the extent of fluorination of the particles and the oil surface tension. This was exemplified for fluorinated fumed silica,17 fluorinated sericite clay18 and a range of other fluorinated particles.19
We report here on the whipping of vegetable oils, mainly high oleic sunflower oil (HOSO), in the presence of crystals of pure myristic acid surfactant (C13H27COOH, MA) formed in situ following cooling of an oil solution. The foams produced are primarily stabilised by the adsorption of the crystals around the air bubbles. We exploit the ability of non-adsorbed crystals present in the oil phase to cause its gelling, thus reducing the possibility of oil drainage and subsequent foam breakdown. An otherwise stable foam prepared at room temperature is shown to be temperature-sensitive and can be destabilised upon heating causing surfactant crystals to melt and bubbles to coalesce. Our initial findings were reported in ref. 20 and a full account including the behaviour of other model systems appeared later.21 Stabilisation of rapeseed oil foams by crystals of a commercial surfactant containing a mixture of mono- and diglycerides was reported recently.22 The study however focused on the rheology of the oil phase before foaming and that of the subsequent foam with little mention of the shape, size or structure of the crystals. As alluded to earlier, the viscosity of oils can be increased above a certain concentration of additive and air bubbles may be suspended in the rigid network so produced preventing their upward creaming thus contributing to enhanced foam stabilisation. In the case of fat crystals, fat crystal networks develop,23 otherwise so-called organogels24,25 are formed in which small crystals interact through van der Waals forces and intermolecular hydrogen bonds to immobilise the liquid oil. Traditionally, the common way to provide texture to the oil phase of food products has been to include a triglyceride capable of crystallising. However, these hardstocks contain saturated fatty acids which are considered unhealthy. Pernetti et al.26 review the possible alternatives investigated so far for the structuring of edible oil. A variety of surfactants has been studied including long chain alcohols and acids,27–29 12-hydroxystearic acid,30 12-hydroxyoleic acid,31 monoglycerides,32–34 diglycerides35 and triglycerides36 in oils like soybean, sunflower, canola, olive, palm and cod liver. The gels have been characterised using rheology, diffraction, calorimetry and microscopy. In most cases, less than 4 wt% of structurant is required to form a stiff gel. The crystal shape varies from plates to needles to ribbons.
Results and discussion
We first present the characterisation of solutions and gels of myristic acid in HOSO with emphasis on the prevailing temperature. This is followed by a discussion of the whipping of these mixtures and the influence of temperature on destabilising an otherwise stable foam. The effects of both MA concentration at fixed temperature and aeration temperature at fixed MA concentration are evaluated. Finally, the generic nature of our findings is probed by investigating the aeration of eight other vegetable oils also stabilised by MA crystals.Crystal and gel formation of MA in HOSO
 | (1) |
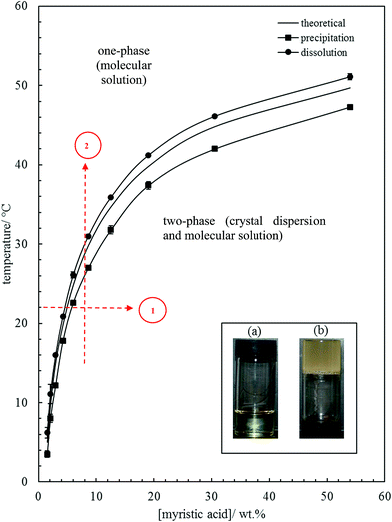 | ||
| Fig. 1 Variation of MA solubility in HOSO with temperature, with points obtained from cooling at 0.1 °C min−1 (squares) and heating at 0.1 °C min−1 (circles). The full line without points is that calculated using eqn (1). Inset: photographs of (a) oil solution, upright at 40 °C, and (b) oil gel, inverted at 22 °C, for 10 wt% MA. Routes 1 and 2 are those followed during aeration (later). | ||
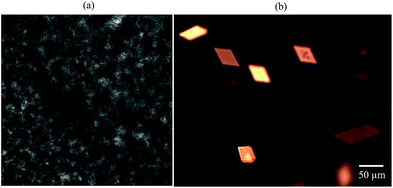
The inset in Fig. 1 contains a photograph of a 10 wt% MA in HOSO mixture at 40 °C (a) and at 22 °C (b). In (a), the mixture is in the one-phase region and in (b) it is in the two-phase region, where at this relatively high concentration, a gel is formed which does not flow upon inverting the vessel. Optical micrographs with crossed polarisers of an oil gel prepared at 8 wt% MA are given in Fig. 2. The undiluted gel in (a) reveals a dense concentration of plate-like crystals whose side lengths are around 50 μm. By dilution with HOSO, individual plate-like crystals with prismatic shape39 and an acute angle of ca. 54° are revealed in (b) of average length around 50 μm and thickness of several microns. The two dashed arrows in Fig. 1 represent the paths followed upon aerating these mixtures as a function of MA concentration at 22 °C (path 1) and as a function of aeration temperature at 8 wt% MA (path 2) to be discussed below.
| 2θ/° (expected) | d-Spacing (expected)/Å | I/Imax/% | 2θ/° (observed) | Miller index |
|---|---|---|---|---|
| 2.806 | 31.46 | 100.00 | 2.84 | (100) |
| 5.613 | 15.73 | 2.93 | 5.66 | (200) |
| 8.424 | 10.49 | 7.38 | 8.43 | (300) |
| 2θ/° (expected) | d-Spacing (expected)/Å | I/Imax/% | d-Spacing (observed)/Å | Miller index |
|---|---|---|---|---|
| 3.876 | 10.49 | 10.21 | 10.61 | (300) |
| 9.918 | 4.10 | 100.00 | 4.12 | (![[3 with combining macron]](https://www.rsc.org/images/entities/char_0033_0304.gif) 11) 11) |
| 11.176 | 3.64 | 31.03 | 3.65 | (![[6 with combining macron]](https://www.rsc.org/images/entities/char_0036_0304.gif) 02) 02) |
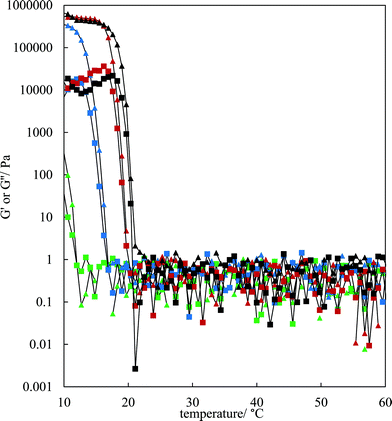
The rheological properties of the MA–HOSO solutions and gels were investigated using a parallel plate geometry. Initial tests were carried out to identify the viscoelastic region of 8 and 12 wt% MA in HOSO gels at 10 °C by increasing the strain from 0.001 to 1% at a fixed frequency of 1 Hz (not shown). The linear viscoelastic region was around 0.01% strain as both the elastic modulus G′ and the viscous modulus G′′ were independent of strain. At a strain of 0.01%, the effect of oscillation frequency on the magnitude of G′ can be seen in Fig. S4(a)† for three concentrations of MA. The value of G′ remains constant within this frequency range, characteristic of gelled networks,41 but depends on the concentration of MA. For the study of the rheology of solutions/gels at different temperatures, we selected a frequency of 1 Hz. Here, solutions at 80 °C were cooled to 10 °C at a rate of 1 °C min−1 for MA concentrations between 4 and 12 wt%. The variation in both G′ and G′′ with temperature for the lower concentrations is shown in Fig. 3; the corresponding plots for higher concentrations are given in Fig. S4(b).† For any concentration, values of G′ and G′′ are low around 0.05–1 Pa at relatively high temperatures (above 30 °C) and G′′ > G′ corresponding to viscous, liquid-like solutions (no crystals). At a certain temperature dependent on MA concentration, the two moduli exhibit an abrupt increase to values approaching 106 Pa for 7 wt% MA at 10 °C. This corresponds to the onset and further development of crystallisation yielding oil gels where G′ > G′′, consistent with elastic, solid-like dispersions. More elastic gels are formed as the concentration of MA increases. We have extracted both the temperature midway between that giving the lowest and that giving the highest values of G′, and the temperature at which G′ reaches a maximum, from the curves in Fig. 3 and these are plotted against MA concentration in Fig. S5.† Both temperatures increase progressively with concentration, and mirror the behaviour seen earlier from visual determinations of the appearance of crystals on cooling, albeit for a different cooling rate. In any case, it is expected that the transitions with respect to temperature will be different in the two sets of experiments as a certain weight fraction of crystals is required before a gel network is formed.
| solid content = 100(S1 − S2)F/[(S1 − S2)F + S2] | (2) |
Aeration of crystal dispersions
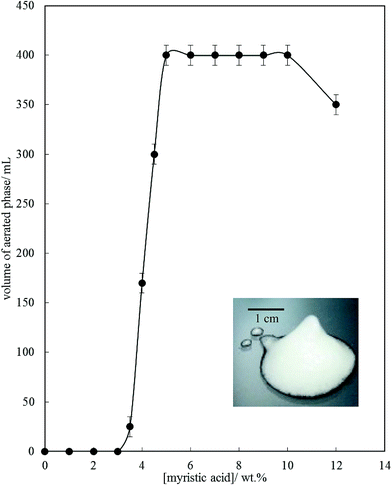
Fig. 6 is a plot of the volume of the aerated phase as a function of MA concentration. In cases at lower concentration where not all the oil becomes incorporated into the aerated phase, we account for this in this parameter. In all other cases, the aerated phase contains all the oil and the incorporated volume of air. Once crystals are formed in the oil, foam can be stabilised and, as seen in Fig. 4, increasing the MA concentration at fixed temperature leads to an increase in the concentration of crystals (with little change in their size distribution) and a progressive increase in the foamability. The volume fraction of air in the oil foam increases from 0.22 ± 0.04 at 4 wt% MA to 0.52 ± 0.04 at 5 wt% MA and above, a value close to that reported in ref. 22 and close to the random close packing fraction of monodisperse spheres of 0.64. A photograph of a sample of foam prepared from 8 wt% MA is given in the inset to Fig. 6. It is thus likely that foams are stabilised by adsorption of MA crystals to the air–oil surfaces of bubbles and by the network of excess crystals in the oil phase creating a gel and impeding buoyancy-driven creaming of air bubbles within the foams. Whipping MA–HOSO mixtures in both the one-phase and two-phase regions has enabled us to determine whether molecular MA or particulate MA is responsible for foaming. We conclude that MA molecules are not surface-active enough at the air–HOSO interface to enable foaming and that MA crystals are surface-active at this interface. In order to cover as much of the air–oil interface as possible, it is likely that plate-like crystals of MA will orient with their faces parallel to the bubble surface. The driving force for their adsorption is to reduce the surface energy of the air–oil surface. In the case of alkane waxes in oil solvent, crystals consist of flat plates of alkane with large, slow growing flat faces exposing terminal methyl groups and small, fast growing edge faces which expose mainly methylene groups.44,45 The difference in surface energy between the low energy methyl-exposing surface and the higher energy methylene-exposing surface is approx. 8 mN m−1.46 For MA crystals, faces expose methyl groups and edges expose mainly methylene and carboxylic acid groups; we hypothesise that the faces are thus likely to be in contact with air (and oil) and the edges interact with each other through the carboxylic acid groups within the air–oil surface.
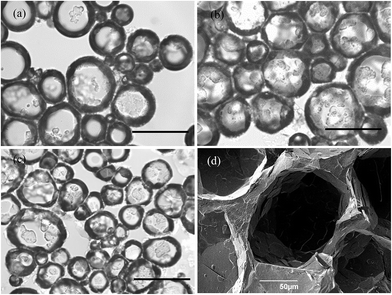
Optical microscope images of the oil foams are given in Fig. 7(a–c) for three selected MA concentrations where crystals are formed. Most bubbles are non-spherical and possess a textured surface. This is indirect evidence that solid crystals are present at air bubble surfaces since, as witnessed in particle-stabilised aqueous foams,47,48 particles are compressed laterally within the surface and jamming occurs such that relaxation of bubble shape to spherical after foam formation becomes impossible. As a result of the high shear during foam formation, a polydisperse population of bubbles arises whose diameters vary between 50 and 200 μm. We cannot rule out the possibility that some crystals present in oil before whipping are broken to smaller ones and that these may adsorb preferentially to the smaller bubbles. The average bubble diameter is more or less the same for MA concentrations above 5 wt%, for which the volume fraction of air within foams reaches its maximum. Taken together, this implies that the fraction of non-adsorbed crystals, which increases with MA concentration, serve to strengthen the gel network in the continuous oil phase. Fig. 7(d) is a cryo-SEM image of the HOSO foam prepared at 10 wt% MA. Plate-like crystals of MA are clearly visible on the surface of the central air bubble viewed from within.
The stability of the oil foams at rest was monitored at 22 °C for up to 18 months. Their appearance immediately after formation and 6 months later can be seen in the photographs of Fig. S6† for smaller volume samples (30 mL HOSO). At the lower end of the MA concentration scale (≤6 wt%), approximately 30% of the initial oil volume drains below the foam, but all of this occurs within the first 24 h. At MA concentrations ≥8 wt% no oil drainage occurs since it is immobilised in the highly elastic oil gel. In addition, all of the foams showed no signs of bubble coalescence or disproportionation as evidenced by the very similar bubble size distributions compared with those determined initially, despite the increase in the dispersed phase volume fraction with time for the lower MA concentrations. The resistance of these two notorious instability mechanisms imparted by adsorbed MA crystals is remarkable. Such ultra-stable oil foams are in sharp contrast to those studied previously9–13 which only remained stable for up to a month or so.
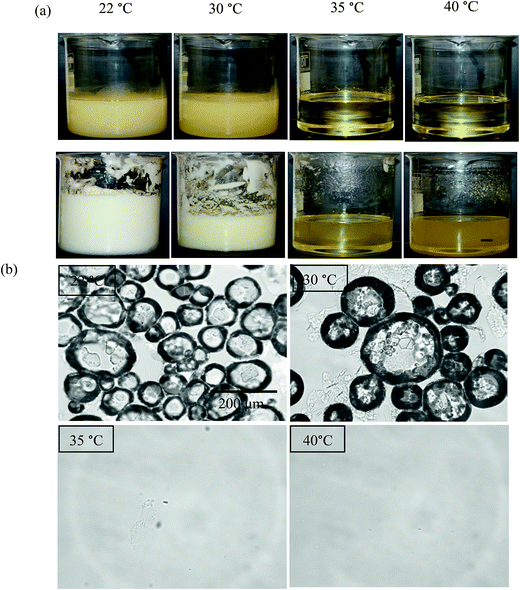
The time course of foam collapse with increasing temperature is shown in Fig. S7† for two concentrations of MA, where both the foam volume and the volume of drained oil are plotted. Oil drainage and foam reduction occur simultaneously and are initiated once the temperature reaches 27 °C. The temperature at which oil foams collapse completely increases with MA concentration, from 37.0 °C at 4 wt% to 41.4 °C at 12 wt%. This is in line with the increase in the dissolution temperature of oil dispersions with MA concentration seen in Fig. 1. We note however that foam collapse is complete at higher temperatures than the dissolution temperatures. It is anticipated that these temperatures will be dependent on both the foam preparation temperature and the rate of subsequent temperature increase.
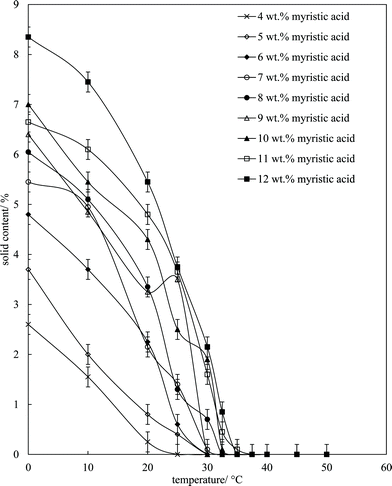
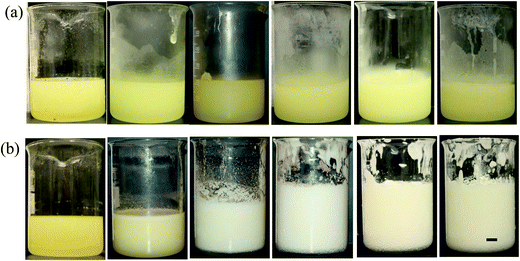
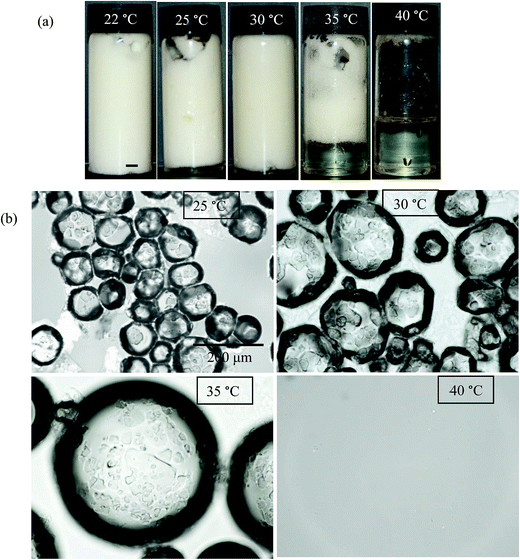
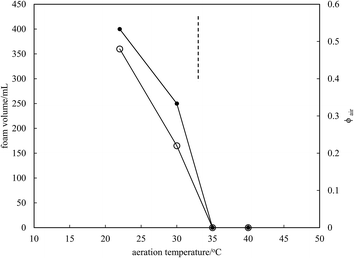
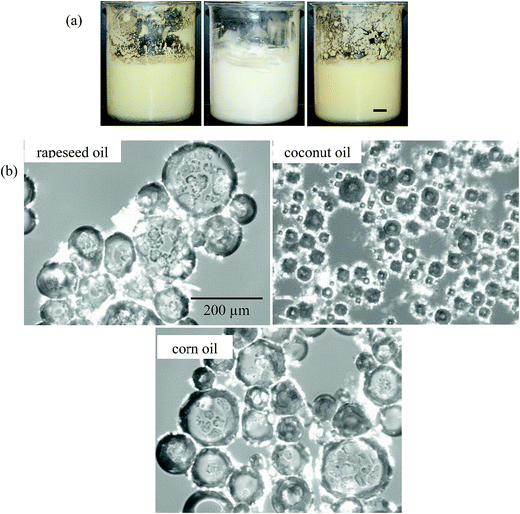
Microscopy images of the mixtures after whipping are seen in Fig. 9(b). A high density of bubbles appears at 22 °C with a lower density at 30 °C. Bubbles are non-spherical and have textured surfaces however at both temperatures due to the presence of adsorbed MA crystals. By contrast, no bubbles are observed in the mixtures whipped at 35 and 40 °C. The dramatic influence of the aeration temperature on the foam volume and the volume fraction of air incorporated into the foam is plotted in Fig. 10. It provides further proof that MA crystals are essential for foam stabilisation since, as discussed in Fig. 4, the solid content is zero for 8 wt% MA at temperatures >32 °C but increases to around 0.8% and 2.5% (interpolated) on lowering the temperature to 30 °C and 22 °C respectively. A relatively narrow temperature window of a few °C thus exists below which oil foams can be stabilised and above which they cannot.
| Oil | ϕ air | Whipping time for maximum foam/min | Appearance after 24 h | Temperature for complete foam collapse/±0.1 °C |
|---|---|---|---|---|
| HOSO | 0.54 | 15 | Foam (75%) + drained oil (25%) | 37.0 |
| Rapeseed | 0.43 | 5 | Foam (43%) + drained oil (57%) | 41.8 |
| Coconut | 0.34 | 15 | Foam only (100%) | 32.3 |
| Soybean | 0.33 | 15 | Foam (57%) + drained oil (43%) | 39.4 |
| Corn | 0.32 | 10 | Foam (67%) + drained oil (33%) | 43.4 |
| Olive | 0.26 | 5 | Foam (40%) + drained oil (60%) | 43.7 |
| Peanut | 0.22 | 5 | Total foam collapse | 42.4 |
| Cottonseed | 0.21 | 10 | Total foam collapse | 41.3 |
| Sesame | 0.17 | 5 | Foam (20%) + drained oil (80%) | 42.4 |
Conclusions
We describe a method for preparing air-in-vegetable oil foams stabilised by crystals of fatty acid. The crystals are formed in situ on cooling a molecular solution at high temperature to form a crystal dispersion at low temperature. Foaming is only possible once crystals are formed. The foams are very stable to drainage, coalescence and coarsening due to a combination of solid crystals at air bubble surfaces and gelling of the continuous oil phase with excess interacting crystals. The foams are temperature-sensitive and destabilise completely on warming to around the melting point of the crystals; stable foams can be prepared again by subsequent cooling and aeration demonstrating the reversibility of the process. The method is relatively simple and can be extended to a wide range of oil-soluble surfactants of different structure which are cheap and readily available.Experimental
Materials
The main triglyceride oil was high oleic sunflower oil or HOSO, batch 002/12 purchased from Eulip (Italy). Its fatty acid composition is 84% oleic (C18, one C![[double bond, length as m-dash]](https://www.rsc.org/images/entities/char_e001.gif) C bond), 12% palmitic and stearic mixture (C16/C18, saturated) and 4% linoleic (C18, two C
C bond), 12% palmitic and stearic mixture (C16/C18, saturated) and 4% linoleic (C18, two C![[double bond, length as m-dash]](https://www.rsc.org/images/entities/char_e001.gif) C bonds). It was passed twice through a basic alumina column to remove polar impurities before use. It exhibits excellent chemical stability without hydrogenation. HOSO is a clear, slightly amber-coloured liquid of density 0.92 g cm−3 and surface tension equal to 33.4 mN m−1, both at 25 °C. Myristic acid, MA, is a saturated C14 carboxylic acid and was 99% pure from Acros Organics. Air was that within the laboratory (78% N2, 21% O2, 1% rare gases/CO2). The other vegetable oils from Acros Organics were commercial grade and included rapeseed (BCBJ4393V), coconut (A0338345), sesame (A0338971), soybean (MKBN8800V), cottonseed (A0338268), corn (A0341121) and olive (A0335272). Peanut oil was also from Eulip (50784).
C bonds). It was passed twice through a basic alumina column to remove polar impurities before use. It exhibits excellent chemical stability without hydrogenation. HOSO is a clear, slightly amber-coloured liquid of density 0.92 g cm−3 and surface tension equal to 33.4 mN m−1, both at 25 °C. Myristic acid, MA, is a saturated C14 carboxylic acid and was 99% pure from Acros Organics. Air was that within the laboratory (78% N2, 21% O2, 1% rare gases/CO2). The other vegetable oils from Acros Organics were commercial grade and included rapeseed (BCBJ4393V), coconut (A0338345), sesame (A0338971), soybean (MKBN8800V), cottonseed (A0338268), corn (A0341121) and olive (A0335272). Peanut oil was also from Eulip (50784).
Methods
Acknowledgements
We thank the BBSRC and Nestlé (York) for a CASE Award to EJG and Dr T. J. Prior, University of Hull for assistance with XRD experiments and analysis.References
- J. Haedelt, S. T. Beckett and K. Niranjan, J. Food Sci., 2007, 72, E138–142 CrossRef CAS PubMed.
- I. C. Callaghan, C. M. Gould, R. J. Hamilton and E. L. Neustadter, Colloids Surf., 1983, 8, 17–28 CrossRef CAS.
- M. K. Poindexter, N. N. Zaki, P. K. Kilpatrick, S. C. Marsh and D. H. Emmons, Energy Fuels, 2002, 16, 700–710 CrossRef CAS.
- C. Blázquez, E. Emond, S. Schneider, C. Dalmazzone and V. Bergeron, Oil & Gas Science and Technology-Rev, IFP Energies nouvelles, 2014, vol. 69, pp. 467–479 Search PubMed.
- S. E. Friberg, Curr. Opin. Colloid Interface Sci., 2010, 15, 359–364 CrossRef CAS.
- S. Ross and G. Nishioka, Colloid Polym. Sci., 1977, 255, 560–569 CAS.
- S. Ross, Chem. Ind., 1981, 47–52 CAS.
- S. E. Friberg, C. S. Wohn, B. Greene and R. van Gilder, J. Colloid Interface Sci., 1984, 101, 593–595 CrossRef CAS.
- B. P. Binks, C. A. Davies, P. D. I. Fletcher and E. L. Sharp, Colloids Surf., A, 2010, 360, 198–204 CrossRef CAS.
- L. K. Shrestha, K. Aramaki, H. Kato, Y. Takase and H. Kunieda, Langmuir, 2006, 22, 8337–8345 CrossRef CAS PubMed.
- H. Kunieda, L. K. Shrestha, D. P. Acharya, H. Kato, Y. Takase and J. M. Gutiérrez, J. Dispersion Sci. Technol., 2007, 28, 133–142 CrossRef CAS.
- L. K. Shrestha, R. G. Shrestha, S. C. Sharma and K. Aramaki, J. Colloid Interface Sci., 2008, 328, 172–179 CrossRef CAS PubMed.
- R. G. Shrestha, L. K. Shrestha, C. Solans, C. Gonzalez and K. Aramaki, Colloids Surf., A, 2010, 353, 157–165 CrossRef CAS.
- V. Bergeron, J. E. Hanssen and F. N. Shoghl, Colloids Surf., A, 1997, 123–124, 609–622 CrossRef CAS.
- R. Murakami and A. Bismarck, Adv. Funct. Mater., 2010, 20, 732–737 CrossRef CAS.
- (a) B. P. Binks and A. Rocher, Phys. Chem. Chem. Phys., 2010, 12, 9169–9171 RSC; (b) B. P. Binks, A. Rocher and M. Kirkland, Soft Matter, 2011, 7, 1800–1808 RSC.
- B. P. Binks and A. T. Tyowua, Soft Matter, 2013, 9, 834–845 RSC.
- B. P. Binks, T. Sekine and A. T. Tyowua, Soft Matter, 2014, 10, 578–589 RSC.
- B. P. Binks, S. K. Johnston, T. Sekine and A. T. Tyowua, ACS Appl. Mater. Interfaces, 2015, 7, 14328–14337 CAS.
- B. P. Binks, E. J. Garvey and J. Vieira, talk entitled Whipping of oils, Ph.D. Student Symposium, Nestlé Product Technology Centre, York (UK), Sept. 2013 Search PubMed.
- E. J. Garvey, Ph.D. thesis, University of Hull, UK, 2014.
- M. Brun, M. Delample, E. Harte, S. Lecomte and F. Leal-Calderon, Food Res. Int., 2015, 67, 366–375 CrossRef CAS.
- S. S. Narine and A. G. Marangoni, Adv. Food Nutr. Res., 2002, 44, 33–145 CAS.
- P. Terech and R. G. Weiss, Chem. Rev., 1997, 97, 3133–3159 CrossRef CAS PubMed.
- Edible Oleogels, ed. A. G. Marangoni and N. Garti, AOCS Press, Urbana, 2011 Search PubMed.
- M. Pernetti, K. F. van Malssen, E. Flöter and A. Bot, Curr. Opin. Colloid Interface Sci., 2007, 12, 221–231 CrossRef CAS.
- J. Daniel and R. Rajasekharan, J. Am. Oil Chem. Soc., 2003, 80, 417–421 CrossRef CAS.
- F. G. Gandolfo, A. Bot and E. Floter, J. Am. Oil Chem. Soc., 2004, 81, 1–6 CrossRef CAS.
- H. M. Schaink, K. F. van Malssen, S. Morgado-Alves, D. Kalnin and E. van der Linden, Food Res. Int., 2007, 40, 1185–1193 CrossRef CAS.
- M. A. Rogers, A. J. Wright and A. G. Marangoni, Food Res. Int., 2008, 41, 1026–1034 CrossRef CAS.
- A. J. Wright and A. G. Marangoni, J. Am. Oil Chem. Soc., 2007, 84, 3–9 CrossRef CAS.
- N. K. O. Ojijo, E. Kesselman, V. Shuster, S. Eichler, S. Eger, I. Neeman and E. Shimoni, Food Res. Int., 2004, 37, 385–393 CrossRef CAS.
- S. Da Pieve, S. Calligaris, A. Panozzo, G. Arrighetti and M. C. Nicoli, Food Res. Int., 2011, 44, 2978–2983 CrossRef CAS.
- F. R. Lupi, D. Gabriele, D. Facciolo, N. Baldino, L. Seta and B. de Cindio, Food Res. Int., 2012, 46, 177–184 CrossRef.
- A. H. Saberi, T. Chin-Ping and L. Oi-Ming, J. Am. Oil Chem. Soc., 2011, 88, 1857–1865 CrossRef CAS.
- K. Higaki, Y. Sasakura, T. Koyano, I. Hachiya and K. Sato, J. Am. Oil Chem. Soc., 2003, 80, 263–270 CrossRef CAS.
- H. Le Chatelier, C. R. Acad. Sci. (Paris), 1894, 118, 638–641 Search PubMed.
- J. A. Wilson and J. S. Chickos, J. Chem. Eng. Data, 2013, 58, 322–333 CrossRef CAS.
- E. Moreno, R. Cordobilla, T. Calvet, M. A. Cuevas-Diarte, G. Gbabode, P. Negrier, D. Mondieig and H. A. J. Oonk, New J. Chem., 2007, 31, 947–957 RSC.
- A. D. Bond, New J. Chem., 2004, 28, 104–114 RSC.
- J. W. Goodwin and R. W. Hughes, Rheology for Chemists-An Introduction, Royal Society of Chemistry, Cambridge, 2000 Search PubMed.
- K. P. A. M. van Putte and J. van den Enden, J. Phys. E: Sci. Instrum., 1973, 6, 910–912 CrossRef.
- D. J. McClements and M. J. W. Povey, Int. J. Food Sci. Technol., 2007, 23, 159–170 CrossRef.
- B. D. Chen and J. Garside, J. Cryst. Growth, 1996, 166, 1094–1098 CrossRef CAS.
- M. Plomp, W. J. P. van Enckevort, P. J. C. M. van Hoof and C. J. van de Streek, J. Cryst. Growth, 2003, 249, 600–613 CrossRef CAS.
- M. K. Chaudhury, Mater. Sci. Eng., R, 1996, 16, 97–159 CrossRef.
- B. P. Binks and T. S. Horozov, Angew. Chem., Int. Ed., 2005, 44, 3722–3725 CrossRef CAS PubMed.
- A. B. Subramaniam, M. Abkarian, L. Mahadevan and H. A. Stone, Nature, 2005, 438, 930 CrossRef PubMed.
- B. P. Binks and A. Rocher, J. Colloid Interface Sci., 2009, 335, 94–104 CrossRef CAS PubMed.
- A. Stocco, W. Drenckhan, E. Rio, D. Langevin and B. P. Binks, Soft Matter, 2009, 5, 2215–2222 RSC.
- E. J. L. de Medeiros, R. de Cassia Ramos do Egypto Queiroga, A. G. de Souza, A. M. T. de M. Cordeiro, A. N. de Medeiros, D. L. de Souza and M. S. Madruga, J. Therm. Anal. Calorim., 2013, 112, 1515–1521 CrossRef.
Footnote |
| † Electronic supplementary information (ESI) available. See DOI: 10.1039/c6sc00046k |
| This journal is © The Royal Society of Chemistry 2016 |

