 Open Access Article
Creative Commons Attribution 3.0 Unported Licence
Gene silencing of the pro-inflammatory cytokine TNF-α with siRNA delivered by calcium phosphate nanoparticles, quantified by different methods
Bernhard
Neuhaus
a,
Annika
Frede
b,
Astrid Maria
Westendorf
*b and
Matthias
Epple
*a
aInorganic Chemistry and Center for Nanointegration Duisburg-Essen (CeNIDE), University of Duisburg-Essen, Universitaetsstr. 5-7, 45117 Essen, Germany. E-mail: matthias.epple@uni-due.de; Fax: +49 201 1832621; Tel: +49 201 1832402
bInstitute of Medical Microbiology, University Hospital Essen, University of Duisburg-Essen, Hufelandstr. 55, 45122 Essen, Germany. E-mail: astrid.westendorf@uk-essen.de; Fax: +49 201 7235602; Tel: +49 201 7231826
First published on 19th August 2015
Abstract
The pro-inflammatory cytokine TNF-α was silenced by treating MODE-K cells with triple-shell calcium phosphate nanoparticles. These consisted of a core of calcium phosphate, followed by a shell of siRNA, then a shell of calcium phosphate to protect the siRNA from nucleases and finally a shell of poly(ethyleneimine) for colloidal stabilization and to give the particles a positive charge. First, the gene silencing efficiency was demonstrated with HeLa–eGFP cells and determined by manually counting the green fluorescent cells, by quantitative FACS analysis of the green fluorescence per cell, and by qPCR at the RNA level. Cell counting gave the highest degrees of eGFP expression, but FACS and qPCR gave more accurate data as they are not probing the cell colour (green or not green) only as yes/no property. This was transposed to the inflammatory relevant mouse cell line MODE-K that was previously stimulated with LPS to induce the expression of TNF-α. By application of the nanoparticles, the TNF-α expression was reduced almost to the original level, as shown by qPCR. Thus, calcium phosphate nanoparticles are well suited to reduce inflammatory reactions by silencing the corresponding cytokines, e.g. TNF-α.
Introduction
The regulation of tumour necrosis factor α (TNF-α) plays an important role in inflammation. It is overexpressed during inflammation caused by chronic inflammatory diseases as well as after infection or injury.1 Regulation of the cytokine is discussed in treatment strategies for several diseases including Crohn's disease (CD), ulcerative colitis (UC),2–4 multiple sclerosis,5 rheumatoid arthritis6 and psoriasis.7 It is also a major cytokine in periodontitis.8,9TNF-α is a pleiotropic cytokine that can activate signalling either in its membrane-bound form or in its soluble form. Both forms can bind to two receptors, TNFR1 and TNFR2, with different affinities.10 Downstream signalling can range from tissue repair and resolution of infection (as long as TNF-α is expressed in a controlled manner) to strong (pro-inflammatory) immune responses and the induction of autoimmune diseases, when overexpressed.1 The downregulation of TNF-α as a therapy has been successfully applied in the aforementioned diseases, but the expression of the cytokine needs to be carefully adjusted. In most cases, antibody-based medications are applied which quickly lose their efficiency and exhibit side effects to the immune system. Another strategy to influence the role of TNF-α is to prevent its overexpression by gene silencing.2,3
The expression of specific genes can be inhibited by the introduction of small interfering RNA (siRNA), usually a small double-stranded RNA, into the cytosol of a cell.11,12 Upon processing of the siRNA and formation of the RISC complex, the mRNA of the targeted protein is degraded.13
The transport of siRNA into the cytosol is challenging. Due to its small size and negative charge it has only poor access into the cell. Additionally, the nucleotides must be stabilized against their quick degradation by nucleases.11,13,14
Among other delivery strategies, calcium phosphate nanoparticles have proven to be efficient in biomedicine,15–19e.g. as carriers of small molecules across the cell membrane.20,21 Calcium phosphate nanoparticles have a high affinity to nucleic acids, and the crystal growth of calcium phosphate can be inhibited on the nanometre scale by stabilization and simultaneous functionalization with nucleic acids.22,23 After endocytosis, the nanoparticles are dissolved at the low pH inside the lysosome.24 The rise in osmotic pressure supports the escape of the nucleic acids into the cytosol.25–27 It has been shown that a combination of calcium phosphate nanoparticles with the cationic polymer PEI improves their transfection efficiency, probably due to enhanced uptake and endosomal escape induced by the positive charge and the proton sponge effect of PEI.28,29
Furthermore, as mineral in human hard tissue (bone and teeth), calcium phosphate is a biocompatible and biodegradable compound.17,18 Silencing of model proteins like eGFP and Luciferase has been shown with calcium phosphate nanoparticles in vitro30 and in vivo.31 The targeting of a tumour in an in vivo mouse model was achieved by the addition of a silica shell used for the covalent attachment of an RGD-peptide to guide the particles to the tumour.32 Additionally, functionalized calcium phosphate nanoparticles permit a long-term storage when freeze-dried in the presence of the cryoprotectant trehalose.33 Based on these promising results, we have prepared calcium phosphate nanoparticles which are loaded with siRNA against TNF-α to reduce its expression in stimulated MODE-K cells. To better understand the fundamental underlying processes, we have carried out control experiments with anti-eGFP–siRNA and knocked down the expression of eGFP in HeLa–eGFP cells. The efficiency of the knock-down was analysed by three different methods which probe different levels of protein expression: counting the percentage of green cells, FACS analysis and qPCR. While qPCR determines the protein expression on the mRNA level, FACS analysis and cell counting show the knock-down on the protein level.
Experimental
Materials
Poly(ethyleneimine) (PEI, Mw = 25![[thin space (1/6-em)]](https://www.rsc.org/images/entities/char_2009.gif) 000 g mol−1) was obtained from Sigma-Aldrich. For gene silencing experiments with anti-eGFP–siRNA, desalted, double-stranded siRNA from life technologies, Ambion® (Carlsbad, USA), sense, 5′-GCAAGCUGACCCUGAAGUUCAU-3′ and antisense, 5′-AUGAACUUCAGGGUCAGCUUGC-3′ was used. The anti eGFP siRNA had a molecular weight of M(siRNA) = 14
000 g mol−1) was obtained from Sigma-Aldrich. For gene silencing experiments with anti-eGFP–siRNA, desalted, double-stranded siRNA from life technologies, Ambion® (Carlsbad, USA), sense, 5′-GCAAGCUGACCCUGAAGUUCAU-3′ and antisense, 5′-AUGAACUUCAGGGUCAGCUUGC-3′ was used. The anti eGFP siRNA had a molecular weight of M(siRNA) = 14![[thin space (1/6-em)]](https://www.rsc.org/images/entities/char_2009.gif) 019.8 g mol−1. For gene silencing of TNF-α, ON-TARGETplus Mouse Tnf (21926) siRNA – Individual, GE Dharmacon (Lafayette, USA), was used, sense, 5′-GCCGAUGGGUUGUACCUUG-3′. The molecular weight of this siRNA was M(TNF) = 13
019.8 g mol−1. For gene silencing of TNF-α, ON-TARGETplus Mouse Tnf (21926) siRNA – Individual, GE Dharmacon (Lafayette, USA), was used, sense, 5′-GCCGAUGGGUUGUACCUUG-3′. The molecular weight of this siRNA was M(TNF) = 13![[thin space (1/6-em)]](https://www.rsc.org/images/entities/char_2009.gif) 459.9 g mol−1.
459.9 g mol−1.
A fluorescently labelled (AlexaFluor® 647) oligonucleotide was obtained from life technologies (Invitrogen, Carlsbad, USA) with the biologically inactive sequence Alexa 647-5′-TTAGCCATGGGTGCACTTGAGCTGC-3′. The molecular weight of the fluorescent oligonucleotide was M(oligo) = 8703.2 g mol−1.
All other chemicals were of analytical grade and used without further purification.
All syntheses were carried out with double-distilled water, treated for 2 h with 0.1% (v/v) DEPC at 37 °C and autoclaved to inactivate nucleases, especially RNAses.
Instruments
Scanning electron microscopy was performed with an ESEM Quanta 400 instrument with gold/palladium-sputtered samples. Dynamic light scattering and zeta potential determinations were performed with a Zetasizer nanoseries instrument (Malvern Nano-ZS, laser: λ = 633 nm) using the Smoluchowski approximation and taking the data from the Malvern software without further correction. The particle size data refer to scattering intensity distributions (z-average). Centrifugation was performed at 4 °C with a Heraeus Fresco 21 instrument. Gene silencing efficiencies were determined by transmission light and fluorescence microscopy with a Keyence Biorevo BZ-9000 instrument (Osaka, Japan). The microscope was equipped with Keyence GFP-B (excitation: 470/40) and Keyence TRITC (excitation: 540/25) filters. Images were recorded with the BZ-II Viewer Software and processed with the BZ-II Analyser software. Fluorescence-assisted cell sorting (FACS) was performed with a LSRII (BD Biosciences, Franklin Lakes, USA) instrument. Data were recorded and evaluated with the FACS Diva 7.0 Software. Real-time quantitative PCR (qPCR) was carried out with a 7500 Fast Real-Time System (Applied Biosystems, Life Technologies, Carlsbad, USA). Data were recorded and analysed with the 7500 Fast Real-Time System software. The viability of the cells was analysed by the MTT-test by spectrophotometric analysis with a Multiscan FC instrument (ThermoFisher scientific, Vantaa, Finland) at λ = 570 nm.Statistical analysis was carried out by Student's t-test. The given error bars correspond to the standard error of the mean (SEM).
Synthesis of siRNA-loaded calcium phosphate nanoparticles
Calcium phosphate nanoparticles were synthesized in analogy to earlier reported procedures.28,30 Equal volumes of solutions of calcium-L-lactate (6.25 mM, pH 9; 217 μL) and diammonium hydrogen phosphate (3.74 mM, pH 9; 217 μL) were pumped into a solution of siRNA (1 mg mL−1 in DEPC-treated water; 87 μL) to give a final siRNA concentration of 167 μg mL−1. Calcium and phosphate solutions were pumped through a Y-connector with a syringe pump, resulting in a nucleation time of 0.25 s for calcium phosphate formation. The primary nanoparticles were stabilized by coating with siRNA. Excess siRNA was removed by centrifugation at 14![[thin space (1/6-em)]](https://www.rsc.org/images/entities/char_2009.gif) 800 rpm for 15 min. The precipitated nanoparticles were then redispersed in the same volume of DEPC-treated water (520 μL) by ultrasonication for 10 s (UP50H, Hielscher, Ultrasound Technology; sonotrode 2, cycle 0.8, amplitude 70%). After this procedure, single-shell calcium phosphate nanoparticles with a shell of siRNA were obtained.
800 rpm for 15 min. The precipitated nanoparticles were then redispersed in the same volume of DEPC-treated water (520 μL) by ultrasonication for 10 s (UP50H, Hielscher, Ultrasound Technology; sonotrode 2, cycle 0.8, amplitude 70%). After this procedure, single-shell calcium phosphate nanoparticles with a shell of siRNA were obtained.
The second shell of calcium phosphate and the third shell of polyethyleneimine were added as follows. Equal volumes of calcium-L-lactate (217 μL) and diammonium hydrogen phosphate (217 μL) solutions were subsequently added to the colloidal dispersion, followed by the addition of PEI (2 mg mL−1 in water; 45 μL) to give a final concentration of 87 μg mL−1 of PEI (final total volume: 1000 μL). Excess PEI was removed by ultracentrifugation and redispersion in the original volume of water.
The concentration of siRNA in the nanoparticles was determined by measuring the absorbance of siRNA at 260 nm in the supernatant after the first centrifugation step. After purification of the nanoparticle dispersion from free nucleic acids, excess ions and free PEI, about 23 μg mL−1 of siRNA was present in the nanoparticles in the colloidal dispersion, corresponding to about 27% of siRNA applied during the synthesis. The amount of calcium in the colloidal dispersion was determined by AAS (atom absorption spectroscopy). This was converted into the amount of calcium phosphate by assuming the stoichiometry of hydroxyapatite, Ca5(PO4)3OH. Before the AAS measurement, the particles were dissolved in hydrochloric acid.
Cell culture experiments
HeLa–eGFP cells (genetically modified human transformed cervix epithelial cells expressing enhanced green fluorescent protein, eGFP) were cultured in Dulbecco's modified Eagle's medium (DMEM), supplemented with 10% fetal calf serum (FCS), 100 U mL−1 streptomycin, 100 U mL−1 penicillin and G418-sulfate (geneticin; final concentration in the medium 50 μg mL−1) at 37 °C under 5% CO2 atmosphere. All reagents and media were supplied by life technologies (Carlsbad, USA). Cells were seeded on 24-well plates one day prior to transfection with 25![[thin space (1/6-em)]](https://www.rsc.org/images/entities/char_2009.gif) 000 cells per well. The nanoparticle dispersions were mixed with supplemented medium to yield equal concentrations of siRNA. From the well, the cell culture medium was removed and replaced by 300 to 500 μL of the nanoparticle-siRNA dispersion. The absolute amount of siRNA per well was between 1 μg and 4 μg per well.
000 cells per well. The nanoparticle dispersions were mixed with supplemented medium to yield equal concentrations of siRNA. From the well, the cell culture medium was removed and replaced by 300 to 500 μL of the nanoparticle-siRNA dispersion. The absolute amount of siRNA per well was between 1 μg and 4 μg per well.
The transfection with the commercial lipid-based agent Lipofectamine (Life Technologies) was carried out according to the manufacturer's recommendations: 50 μL of DMEM (without FCS) per well were mixed with 1 μL of Lipofectamine reagent. In another vial, 20 pmol of siRNA were mixed with 50 μL of DMEM (without FCS). Both solutions were mixed and incubated for 15 min. DMEM was added to a total volume of 500 μL before application to the cell culture. 0.28 μg of siRNA per well was applied.
The siRNA was removed from cell culture after 6 to 12 h by medium exchange. The gene silencing efficiency was then assessed 48 to 72 h after transfection, for HeLa–eGFP cells by counting green cells from optical microscopy images and fluorescence microscopy images, by measuring the average fluorescence intensity in FACS and by qPCR.
MODE-K cells (epithelial cells from the jejunum of female C3H/He mice)34 were cultured in Dulbecco's modified Eagle's medium (DMEM) supplemented with 10% fetal calf serum (FCS), 100 U mL−1 streptomycin, 100 U mL−1 penicillin and 2 mM L-glutamate at 37 °C in 5% CO2 atmosphere. The cells were seeded one day prior to transfection at a density of 5 × 10⁴ cells per well in a 24-well plate. For gene silencing, the nanoparticles diluted in cell culture medium were added to the cells and incubated for 6 h. Afterwards, the cells were stimulated with 1 μg mL−1 LPS (500 μL per well) for 4 h before the cells were collected and deep-frozen until qPCR analysis.
For MODE-K cells, the gene silencing efficiency was only measured by qPCR due to the absence of eGFP fluorescence.
Gene silencing efficiency
At the start of the experiment, almost all HeLa cells expressed eGFP and were green in fluorescence microscopy. If the production of eGFP is successfully silenced, the green fluorescence will vanish. The gene silencing efficiency was measured by three different methods.First, fluorescence microscopy was applied and the colour of the cells was assessed visually. Each cell was assigned a colour, i.e. “green” or “not green”. This unavoidably led to ambiguity in the case of “weakly green” cells, therefore this evaluation was carried out as objectively as possible (same operator, same illumination conditions, same magnification). The efficiency of the gene silencing experiments was then calculated as reported earlier:30
 | (1) |
The average level of green fluorescence was determined by FACS analysis. Note that it was not possible to separate eGFP-producing and eGFP-silenced cells by FACS because of a background level of green fluorescence, depending on the amount of eGFP present in each cell. Instead, the mean fluorescence intensity (MFI) of living cells was recorded for the whole cell population. For FACS-analysis, the cells were collected by trypsinisation and centrifugation before redispersion in FACS-buffer (400 mL PBS, 8 mL FCS, 1.5 mL 0.5 M EDTA). Before FACS analysis, the cells were stained with 7-AAD viability staining solution (eBiosciences, San Diego, USA). About 100![[thin space (1/6-em)]](https://www.rsc.org/images/entities/char_2009.gif) 000 cells were analysed for each experiment. The gene silencing efficiency was computed as
000 cells were analysed for each experiment. The gene silencing efficiency was computed as
| GE% = 100·(1-MFI(silenced cells)/MFI(control cells)) | (2) |
RPS9:
5′CTGGACGAGGGCAAGATGAAGC
3′TGACGTTGGCGGATGAGCACA
eGFP:
5′CTACGGCGTGCAGTGCTTCAG
3′CTCGGCGCGGGTCTTGTAG
TNF-α:
5′CAATGCACAGCCTTCCTCACAG
3′CCCGGCCTTCCAAATAAATACAT
Cell viability
The cell viability was analysed by the MTT-assay35 48 to 72 h after the transfection. MTT (3-(4,5-dimethylthiazol-2-yl)-2,5-diphenyltetrazolium bromide; Molecular probes, Life Technologies, Carlsbad, USA) was dissolved in PBS (5 mg mL−1) and then added to the required amount of cell culture medium to give a final MTT concentration of 1 mg mL−1. The cell culture medium of the transfected cells was replaced by the MTT medium (300 μL) and incubated for 90 min at 37 °C under 5% CO2 in humidified atmosphere. Then the MTT medium was removed and the blue precipitate was dissolved in DMSO (300 μL, each well) and incubated for 30 min. Finally, 100 μL of each well were taken for photometric analysis at λ = 570 nm. The absorption of the supernatant of cells treated with nanoparticles was normalized to that of the control.In all cases, cells cultivated under the same conditions but without any treatment were used as control.
Cell uptake studies
The uptake of nanoparticles was measured by loading the nanoparticles with a biologically inactive, fluorescently labelled oligonucleotide. MODE-K cells were seeded at 5 × 10⁴ cells per well in a 24 well-plate one day before the experiment. The nanoparticle dispersion was diluted in cell culture medium to give a concentration of the oligonucleotide of 1 μg mL−1. The cells were incubated with 0.5 mL nanoparticle-containing cell culture medium. Before analysis, the cells were washed with PBS.The uptake was visually analysed by fluorescence microscopy with a Keyence Biorevo BZ-9000 microscope equipped with a Keyence TRITC filter. Images were taken at 40× magnification in brightfield and fluorescence mode. Quantification of the uptake was performed by FACS analysis. Cells were trypsinized and redispersed in FACS buffer. Before analysis, cells were stained with 7-AAD viability staining solutions (eBiosciences, San Diego, USA). The percentage of AlexaFluor-647 positive cells was recorded after 10, 30, min, 240 and 360 min.
Results and discussion
The properties of the siRNA-loaded calcium phosphate nanoparticles are given in Table 1. Triple-shell calcium phosphate nanoparticles (CaP–siRNA–CaP–PEI) with an outer shell of PEI were prepared. The particles were loaded with siRNA to knock-down the expression of TNF-α. Scanning electron microscopy showed almost spherical particles with a diameter between 40 and 100 nm (Fig. 1). DLS gives a larger average particle size, indicating a moderate degree of agglomeration.36,37 This size range enables their uptake by macropinocytosis38 as shown earlier for positively charged calcium phosphate nanoparticles and HeLa cells.21 The PDI of 0.2 to 0.3 indicates a reasonable degree of monodispersity.| [siRNA] in the colloidal dispersion/μg mL−1 | Diameter SEM/nm | Diameter DLS/nm | PDI (DLS) | Zetapotential/mV | Number of particles/mL−1 | Number of siRNA molecules per particle |
|---|---|---|---|---|---|---|
| 23 ± 4 | 40 to 100 | 316 ± 51 | 0.2–0.3 | +16.5 ± 1.4 | ∼2.14 × 10¹¹ | ∼4700 |
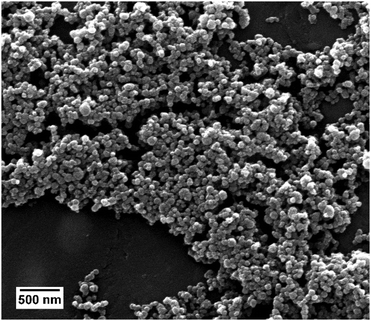 | ||
| Fig. 1 Scanning electron micrograph of siRNA-loaded calcium phosphate nanoparticles, showing the spherical morphology of the nanoparticles. | ||
According to AAS measurements the concentration of calcium [Ca2+] in the colloidal dispersion was 48 μg mL−1. Assuming the formation of hydroxyapatite (Ca5(PO4)3OH) with a density of ρ(HAP) = 3.14 g cm−3 and spherical particles, the number N(particles) of particles per mL of colloidal dispersion can be estimated according to eqn (3):
 | (3) |
The concentration of siRNA in the colloidal dispersion was determined by UV/Vis spectroscopy. We found that about 27% of the initial amount of siRNA remained in the colloidal dispersion, i.e. was attached to the nanoparticles. This amount is comparable to earlier reports for calcium phosphate nanoparticles functionalized with CpG.39 The ratio of the concentration of siRNA to the number of particles per mL multiplied with Avogadro's constant (NA) served as an estimation of the number of siRNA molecules per particle (N(siRNA/particle)), according to eqn (4):
 | (4) |
However, the results obtained from these calculations must be taken with care because they are based on a number of assumptions (e.g. the formation of hydroxyapatite and of monodisperse spherical particles). The diameter of the particles has a large impact on both number of particles per mL of dispersion and number of siRNA molecules per particle because it is present to the third power in eqn (3). The exact determination of the particle diameter poses an analytical problem. Even for well-defined particle systems different techniques yield different particle sizes, due to their fundamental physical principles.40 Still, the calculation is helpful in estimating the dose-dependent effect of the particles.
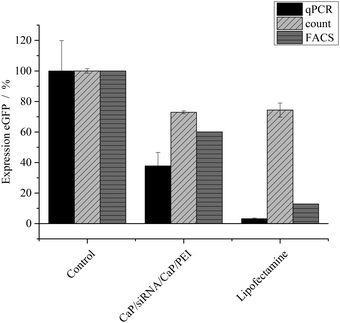
The nanoparticles were loaded with different kinds of siRNA to assess their ability in silencing specific genes in different cell lines. The gene silencing efficiency was determined on HeLa–eGFP cells by three different methods: cell counting, FACS analysis and qPCR (Fig. 2). In the case of eGFP, gene silencing was investigated on the RNA level as well as on the protein level. The protein level was assessed by analysing the green fluorescence of eGFP. Thus, the protein level refers to the bioactivity level of eGFP. All results were normalized to the number of cells to minimize the contribution of varying cell numbers to the gene silencing results. We found that manual cell counting had an inherent error because “slightly green cells” carry the same statistical weight as “bright green cells”. Fig. 4 illustrates that after knockdown of eGFP, many cells are still “slightly green”. FACS analysis and qPCR as integral techniques permit a more accurate assessment of the overall gene silencing efficiency. In FACS measurements, the mean fluorescence intensity of HeLa–eGFP cells before and after treatment was compared.
After application of eGFP-siRNA-loaded nanoparticles, the mean fluorescence intensity decreased to 60%, indicating a considerable knock-down of eGFP. Analysis with quantitative PCR showed that only 37 ± 13% of mRNA coding for eGFP was present in cells after incubation with nanoparticles. Both techniques were normalized to the number of cells but analyse protein expression at different stages, which can explain the differences. The analysis of fluorescence to assess the protein expression is applicable only for fluorescent model proteins like eGFP. In contrast, qPCR can be applied independently from a protein's fluorescence. Notably, considerable differences were found between the nanoparticles and Lipofectamine, depending on the method.
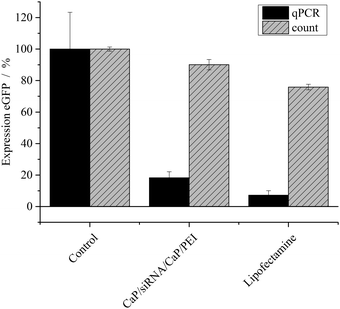
To improve the efficiency of the calcium phosphate nanoparticles, the amount of siRNA per well was increased to 4 μg. For this, the number of nanoparticles per well had to be increased because the amount of siRNA per particle was determined by the synthesis. qPCR showed enhanced effects at the higher concentration (Fig. 3). The amount of eGFP mRNA in cells treated with 4 μg siRNA per well decreased to 18 ± 4% of the amount present in control cells, which is close to 7 ± 3% achieved with Lipofectamine (Fig. 3). In contrast, quantification of eGFP expression by counting fluorescent cells did not show an increased gene silencing efficiency. Independent of the amount of siRNA applied via particles (Fig. 2 and 3) cell counting gave similar results for nanoparticles and Lipofectamine, whereas other techniques showed greater differences (Fig. 2). These results show that fluorescence microscopy can be used as a qualitative model for gene silencing but for quantitative results more accurate techniques have to be employed. In Fig. 4, an illustrative image of gene silencing in HeLa cells is shown. The cell density appears lower in the brightfield microscopic images after treatment compared to the control. However, this does not indicate cytotoxicity, because the cell density varies at sections of one well. This is taken into account by normalizing the number of green cells to the total number of cells. The morphology of the cells is typical for healthy HeLa cells in both cases.
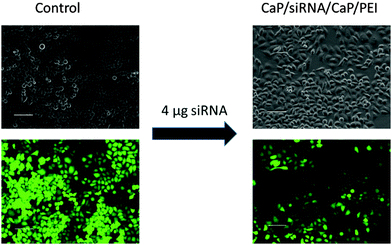 | ||
| Fig. 4 Gene silencing of HeLa–eGFP cells. Comparison of brightfield images and fluorescence images of untreated cells and cells treated with nanoparticles (scale bars 100 μm). | ||
The cytotoxicity of the particles was measured by the MTT-test and compared to Lipofectamine (Fig. 5). While at the lower particle concentration, no cytotoxicity was observed, at the higher particle concentration, a moderate cytotoxicity was observed. Nevertheless, the viability of the cells still remained above 70%, even at the higher particle concentration. This cytotoxicity was comparable to effects caused by Lipofectamine.
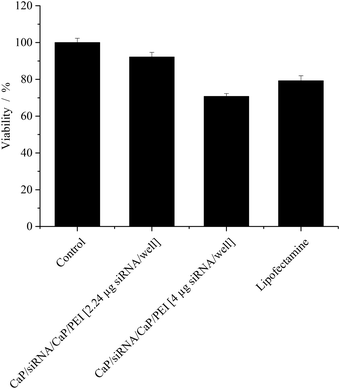 | ||
| Fig. 5 Viability (±SEM; N = 3–6) of HeLa–eGFP cells after gene silencing quantified with MTT-Tests. In the case of Lipofectamine, 0.28 μg siRNA per well was applied. | ||
Colloidal calcium phosphate nanoparticles have been shown to be toxic at high concentrations to human monocyte macrophages.41 This toxicity was explained by elevated levels of the intracellular Ca2+ concentrations even after exposure to low amounts of calcium phosphate nanoparticles. In contrast, studies on H460 cells,25 human monocyte macrophages,41 and T24 cells42 revealed no toxicity after exposure to calcium phosphate nanoparticles at amounts comparable to the ones used in this study. Besides high intracellular concentrations of Ca2+, the moderate toxicity of the particles at high doses may result from functionalization with PEI, which is known to be toxic in a structure- and concentration-dependent way.43
Following the promising results obtained for the model protein eGFP in HeLa cells, the pro-inflammatory cytokine TNF-α was silenced in MODE-K cells. MODE-K cells are a murine epithelial cell line from the intestine, and serve as a model for intestinal epithelial cell function.34
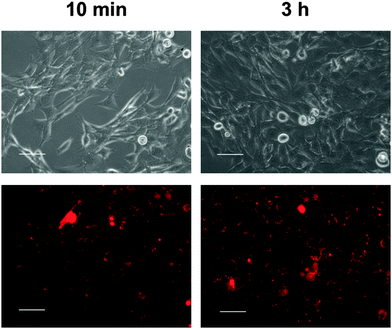
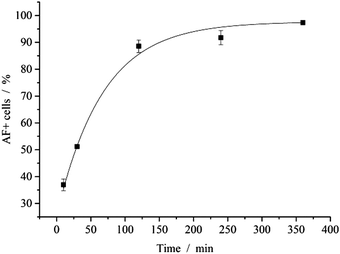
First, the uptake of nanoparticles into the cells was studied by fluorescence microscopy (Fig. 6) and quantified by FACS analysis (Fig. 7). The particles for this study were prepared in the same way as non-fluorescing particles. For the uptake study, siRNA was exchanged for a fluorescence-labelled, non-functional oligonucleotide.
Incubation of the cells with the particles led to rapid association of particles and cells. Already after 10 min of incubation, interactions of cells and nanoparticles were seen with the fluorescence microscope (Fig. 6). Almost all particles were located near the cell wall. After 3 h, the cells had taken up many nanoparticles.
The interaction of nanoparticles and cells was quantified by FACS analysis. After 2 h of incubation with fluorescent nanoparticles, almost all cells (89%) showed a fluorescence signal (Fig. 7). Note that the cells were washed with PBS prior to analysis to remove free or adhering nanoparticles. In earlier studies, the uptake of calcium phosphate nanoparticles by HeLa cells was followed by confocal laser scanning microscopy and shown to occur within 3 to 5 h.44
As mentioned before TNF-α is upregulated in inflamed tissue. In order to simulate the cellular response of inflamed tissue, i.e. to induce the upregulation of TNF-α, the cells were stimulated with LPS after the nanoparticles were applied.
The cells treated with LPS only exhibited a strong expression of TNF-α as shown in Fig. 8. The expression level of TNF-α mRNA by these cells was set to 100%. The cells of the control were not treated with LPS at all. These cells still expressed about 23 ± 3% TNF-α mRNA, compared to cells treated only with LPS.
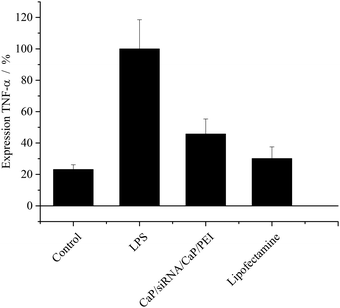 | ||
| Fig. 8 Expression of TNF-α (±SEM; N = 5–8) after treatment of MODE-K cells. Results are normalized to cells treated with LPS only. [siRNA] = 0.1 μg per well; N(particles) ∼ 9.3 × 10⁸ per well. | ||
The efficiency of TNF-α knockdown with calcium phosphate nanoparticles was comparable to Lipofectamine. The expression of this cytokine after treatment was about 45 ± 10% and 30 ± 8%, respectively. Thus, it is possible to reduce the production of TNF-α almost back to the level of unstimulated cells.
Silencing of TNF-α has been shown by other groups in different stimulated cell lines and in vivo models.2,3,45–48 The comparison with Lipofectamine gave similar efficiencies for a cyclodextrin-based delivery system in RAW 264.7 macrophages, which also showed an effect in an in vivo mouse model.2 Silencing of TNF-α was achieved in differentiated THP-1 cells and differentiated primary monocytes with a PLGA microparticle-based system.48 Whereas in THP-1 cells this system was more efficient than Lipofectamine, in primary monocytes both systems had comparable gene silencing efficiencies.
Although different cell lines were used, our results compare well with other systems as far as cell culture experiments are concerned. The calcium phosphate nanoparticles were comparable to Lipofectamine in silencing TNF-α.
Cytotoxic effects of the calcium phosphate nanoparticles to MODE-K cells were assessed by an MTT-Test. The toxicity was measured 48 h after incubation of cells with the particles. After treatment, 80 ± 5% of the cells were still viable (data not shown) indicating only moderate cytotoxicity. No toxicity was observed after treatment with Lipofectamine.
Conclusions
Calcium phosphate nanoparticles can be easily synthesized and functionalized with nucleic acids. The particles can be functionalized with different siRNAs and silence specific genes in several cell lines. The model protein eGFP was silenced in HeLa–eGFP cells and protein expression was analysed with three different methods on the mRNA level and protein level. The silencing efficiency by fluorescence microscopy was difficult to interpret. More accurate results were obtained by FACS analysis and quantitative real-time PCR (qPCR). While FACS analysis is not applicable for all proteins, qPCR is a more universal technique for the analysis of gene expression.The results obtained from the model system were transferred to silence the relevant proinflammatory cytokine TNF-α in LPS-stimulated MODE-K cells. By introducing anti-TNF-α siRNA into the cells, the expression of the cytokine was strongly downregulated, i.e. back to the level of unstimulated cells. Gene silencing efficiencies close to results with the commercial agent Lipofectamine were achieved. In contrast to Lipofectamine, calcium phosphate nanoparticles can be freeze-dried for long term storage and still keep their biological function when redispersed,33 and they can also be labelled with cell-targeting moieties like antibodies,49 proteins,50 or peptides,32 opening the possibility for a cell-specific downregulation of inflammatory markers in vivo.
Acknowledgements
This work was supported by the Deutsche Forschungsgemeinschaft (DFG) to M.E. and A.M.W.References
- F. Van Hauwermeiren, R. E. Vandenbroucke and C. Libert, Cytokine Growth Factor Rev., 2011, 22, 311–319 CrossRef CAS PubMed.
- J. McCarthy, M. J. O'Neill, L. Bourre, D. Walsh, A. Quinlan, G. Hurley, J. Ogier, F. Shanahan, S. Melgar, R. Darcy and C. M. O'Driscoll, J. Controlled Release, 2013, 168, 28–34 CrossRef CAS PubMed.
- C. Kriegel and M. Amiji, J. Controlled Release, 2011, 150, 77–86 CrossRef CAS PubMed.
- M. J. Hamilton, S. B. Snapper and R. S. Blumberg, J. Gastroenterol., 2012, 47, 1–8 CrossRef CAS PubMed.
- S. K. Williams, O. Maier, R. Fischer, R. Fairless, S. Hochmeister, A. Stojic, L. Pick, D. Haar, S. Musiol, M. K. Storch, K. Pfizenmaier and R. Diem, PLoS One, 2014, 9, e90117 Search PubMed.
- K. J. Aaltonen, L. M. Virkki, A. Malmivaara, Y. T. Konttinen, D. C. Nordstrom and M. Blom, PLoS One, 2012, 7, e30275 CAS.
- R. E. Kontermann, P. Scheurich and K. Pfizenmaier, Expert Opin. Drug Discovery, 2009, 4, 279–292 CrossRef CAS PubMed.
- K. Redlich and J. S. Smolen, Nat. Rev. Drug Discovery, 2012, 11, 234–250 CrossRef CAS PubMed.
- S. A. Hienz, S. Paliwal and S. Ivanovski, J. Immunol. Res., 2015, 2015, 615486 Search PubMed.
- R. S. Al-Lamki and T. N. Mayadas, Kidney Int., 2014, 87, 281–296 CrossRef PubMed.
- J. Kurreck, Angew. Chem., Int. Ed., 2009, 48, 1378–1398 CrossRef CAS PubMed.
- A. Z. Fire, Angew. Chem., Int. Ed., 2007, 46, 6966–6984 CrossRef CAS PubMed.
- M. Sioud, Expert Opin. Drug Discovery, 2005, 2, 639–651 CrossRef CAS PubMed.
- J. Guo, K. A. Fisher, R. Darcy, J. F. Cryan and C. O'Driscoll, Mol. BioSyst., 2010, 6, 1143–1161 CAS.
- J. Gomez-Morales, M. Iafisco, J. M. Delgado-Lopez, S. Sarda and C. Drouet, Prog. Cryst. Growth Charact. Mater., 2013, 59, 1–46 CrossRef CAS PubMed.
- D. Arcos and M. Vallet-Regí, Acta Mater., 2013, 61, 890–911 CrossRef CAS PubMed.
- V. Uskokovic and D. P. Uskokovic, J. Biomed. Mater. Res., Part B, 2011, 96, 152–191 CrossRef PubMed.
- M. Epple, K. Ganesan, R. Heumann, J. Klesing, A. Kovtun, S. Neumann and V. Sokolova, J. Mater. Chem., 2010, 20, 18–23 RSC.
- Y. Cai and R. Tang, J. Mater. Chem., 2008, 18, 3775–3787 RSC.
- V. Sokolova and M. Epple, Angew. Chem., Int. Ed., 2008, 47, 1382–1395 CrossRef CAS PubMed.
- T. Knuschke, V. Sokolova, O. Rotan, M. Wadwa, M. Tenbusch, W. Hansen, P. Staeheli, M. Epple, J. Buer and A. M. Westendorf, J. Immunol., 2013, 190, 6221–6229 CrossRef CAS PubMed.
- T. Welzel, I. Radtke, W. Meyer-Zaika, R. Heumann and M. Epple, J. Mater. Chem., 2004, 14, 2213–2217 RSC.
- I. Roy, S. Mitra, A. Maitra and S. Mozumdar, Int. J. Pharm., 2003, 250, 25–33 CrossRef CAS.
- V. Sokolova, D. Kozlova, T. Knuschke, J. Buer, A. M. Westendorf and M. Epple, Acta Biomater., 2013, 9, 7527–7535 CrossRef CAS PubMed.
- Y. C. Tseng, A. Yang and L. Huang, Mol. Pharmaceutics, 2013, 10, 4391–4395 CrossRef CAS PubMed.
- N. Link, T. J. Brunner, I. A. Dreesen, W. J. Stark and M. Fussenegger, Biotechnol. Bioeng., 2007, 98, 1083–1093 CrossRef CAS PubMed.
- V. V. Sokolova, I. Radtke, R. Heumann and M. Epple, Biomaterials, 2006, 27, 3147–3153 CrossRef CAS PubMed.
- V. Sokolova, S. Neumann, A. Kovtun, S. Chernousova, R. Heumann and M. Epple, J. Mater. Sci., 2010, 45, 4952–4957 CrossRef CAS.
- R. Deng, Y. Yue, F. Jin, Y. Chen, H. F. Kung, M. C. Lin and C. Wu, J. Controlled Release, 2009, 140, 40–46 CrossRef CAS PubMed.
- V. Sokolova, A. Kovtun, O. Prymak, W. Meyer-Zaika, E. A. Kubareva, E. A. Romanova, T. S. Oretskaya, R. Heumann and M. Epple, J. Mater. Chem., 2007, 17, 721–727 RSC.
- T. Devarasu, R. Saad, A. Ouadi, B. Frisch, E. Robinet, P. Laquerrière, J. C. Voegel, T. Baumert, J. Ogier and F. Meyer, J. Mater. Chem. B, 2013, 1, 4692–4700 RSC.
- K. Haedicke, D. Kozlova, S. Gräfe, U. Teichgräber, M. Epple and I. Hilger, Acta Biomater., 2015, 14, 197–207 CrossRef CAS PubMed.
- J. Klesing, S. Chernousova and M. Epple, J. Mater. Chem., 2012, 22, 199–204 RSC.
- K. Vidal, I. Grosjean, J. P. Revillard, C. Gespach and D. Kaiserlian, J. Immunol. Methods, 1993, 166, 63–73 CrossRef CAS.
- T. Mosmann, J. Immunol. Methods, 1983, 65, 55–63 CrossRef CAS.
- M. Hassellov, J. W. Readman, J. F. Ranville and K. Tiede, Ecotoxicology, 2008, 17, 344–361 CrossRef PubMed.
- O. A. Sadik, N. Du, V. Kariuki, V. Okello and V. Bushlyar, ACS Sustainable Chem. Eng., 2014, 2, 1707–1716 CrossRef CAS.
- I. Canton and G. Battaglia, Chem. Soc. Rev., 2012, 41, 2718–2739 RSC.
- V. Sokolova, T. Knuschke, J. Buer, A. M. Westendorf and M. Epple, Acta Biomater., 2011, 7, 4029–4036 CrossRef CAS PubMed.
- D. Mahl, J. Diendorf, W. Meyer-Zaika and M. Epple, Colloids Surf., A, 2011, 377, 386–392 CrossRef CAS PubMed.
- M. Motskin, D. M. Wright, K. Muller, N. Kyle, T. G. Gard, A. E. Porter and J. N. Skepper, Biomaterials, 2009, 30, 3307–3317 CrossRef CAS PubMed.
- S. Neumann, A. Kovtun, I. D. Dietzel, M. Epple and R. Heumann, Biomaterials, 2009, 30, 6794–6802 CrossRef CAS PubMed.
- A. Paul, C. J. Eun and J. M. Song, Polymer, 2014, 55, 5178–5188 CrossRef CAS PubMed.
- V. Sokolova, O. Rotan, J. Klesing, P. Nalbant, J. Buer, T. Knuschke, A. M. Westendorf and M. Epple, J. Nanopart. Res., 2012, 14, 910 CrossRef.
- S. J. Lee, A. Lee, S. R. Hwang, J. S. Park, J. Jang, M. S. Huh, D. G. Jo, S. Y. Yoon, Y. Byun, S. H. Kim, I. C. Kwon, I. Youn and K. Kim, Mol. Ther., 2014, 22, 397–408 CrossRef CAS PubMed.
- H. Laroui, A. L. Theiss, Y. Yan, G. Dalmasso, H. T. T. Nguyen, S. V. Sitaraman and D. Merlin, Biomaterials, 2011, 32, 1218–1228 CrossRef CAS PubMed.
- B. Xiao, H. Laroui, S. Ayyadurai, E. Viennois, M. A. Charania, Y. Zhang and D. Merlin, Biomaterials, 2013, 34, 7471–7482 CrossRef CAS PubMed.
- C. Kelly, A. B. Yadav, C. Lawlor, K. Nolan, J. O'Dwyer, C. M. Greene, N. G. McElvaney, N. Sivadas, J. M. Ramsey and S. A. Cryan, Mol. Pharmaceutics, 2014, 11, 4270–4279 CrossRef CAS PubMed.
- D. Kozlova, S. Chernousova, T. Knuschke, J. Buer, A. M. Westendorf and M. Epple, J. Mater. Chem., 2012, 22, 396–404 RSC.
- V. Temchura, D. Kozlova, V. Sokolova, K. Überla and M. Epple, Biomaterials, 2014, 35, 6098–6105 CrossRef CAS PubMed.
| This journal is © The Royal Society of Chemistry 2015 |

