Effect of porous zinc–biochar nanocomposites on Cr(VI) adsorption from aqueous solution
Chao Ganab,
Yunguo Liu*ab,
Xiaofei Tanab,
Shufan Wangab,
Guangming Zengab,
Bohong Zhengc,
Tingting Liab,
Zhengjiang Jiangab and
Wei Liuab
aCollege of Environmental Science and Engineering, Hunan University, Changsha 410082, P. R. China. E-mail: Liuyunguohnu@163.com; Fax: +86 731 88822829; Tel: +86 731 88649208
bKey Laboratory of Environmental Biology and Pollution Control (Hunan University), Ministry of Education, Changsha 410082, P. R. China
cSchool of Architecture and Art Central South University, Central South University, Changsha 410082, P. R. China
First published on 10th April 2015
Abstract
A new synthesis method was developed to produce zinc–biochar nanocomposites from sugarcane bagasse. The modified biochar maintained 1.2 to 2.0 times higher removal efficiency than that of pristine biochar. FTIR, XPS, BET and SEM were used to analyse the physical and chemical properties of the composite adsorbent. Batch sorption experiments were carried out to investigate the adsorption behavior of Cr(VI) by zinc–biochar. Experimental data were better fitted by a pseudo-second-order kinetics equation and the Freundlich isotherm model. Thermodynamic analysis indicated that the adsorption process was spontaneous and endothermic. The maximum adsorption of the modified biochar was observed at pH 2.0 with the sorption capacity of 102.66 mg g−1. The adsorbed zinc–biochar could be effectively regenerated by 0.5 mol L−1 NaOH solution and the adsorption ability decreased from 84.16 to 59.75 mg g−1 in the sixth cycle. In conclusion, the porous zinc–biochar showed great potential advantages in the removal of Cr(VI) from wastewater.
1. Introduction
Heavy metal ions in water systems prove to be a potential threat to the environment and human beings due to their bioaccumulation and decomposition difficulty in food chains.1,2 Chromium, one of the widespread heavy metals in the environment, has been considered as a priority pollutant by the US EAP. Cr exists mainly as Cr(III) and Cr(VI) in the natural environment, while Cr(VI) is much more poisonous, soluble and mobile than Cr(III). Moreover, Cr(VI) can be absorbed by hydrophytes and leached into groundwater, causing poisonous and harmful effects on humans. Therefore, the treatment of Cr(VI) in wastewater has become an exigent environmental issue.Numerous methods and techniques have been employed to removal Cr(VI) from the aqueous phase, such as adsorption, ecological remediation, chemical reduction, redox, and micellar-enhanced ultrafiltration.3–8 Among them, adsorption has been regarded as an effective and straightforward technology for Cr(VI) removal. Activated carbon, zeolite, iron oxide, fullerene, graphene, and chitosan are the common materials used for Cr(VI) removal.9–13 However, these adsorbents may have some disadvantages including limited ability, oxidability and aggregation.14 In addition, the high cost of the commercial materials also hinders its practical and widespread application. Thus, it is urgent and necessary to find cost-effective adsorbents to remove chromium from wastewater.
In recent years, biomass derived biochar has been taken as a promising adsorbent due to its low cost, wide availability, favorable surface characteristics for heavy metals and other water contaminants removal.15–21 Biochar contains a range of polar functional groups, such as hydroxyl, carboxylic and amino-groups. The major mechanism of heavy metals adsorption is electrostatic interaction or ion exchange, and it is greatly influenced by the surface charge of the adsorbent material. Consequently, the modification of biochar, which can increase the surface charge and enhance the adsorption ability, has attracted deep attention in recent years. For example, nitration modified biochar exhibited obviously higher Cu2+ adsorption effect than the unmodified biochar, the adsorption capacity of the modified sorbent are five holds of the pristine one due to the introduction of amino group.16 The magnetic iron nanoparticles modified biochar showed highly removal of Cr(VI) with a high surface area of 679.4 m2 g−1 and 4.42 wt% of the magnetic nanoparticles inside.22
Over the past few years, zinc nanometer microstructures have aroused great interest in the field of adsorbing material preparation for the use of wastewater treatment due to their unique properties, low cost and mild reaction condition. Recently, many researches have synthesized zinc nanostructures on functional materials including graphene, activated carbon, and biochar. For instance, Kikuchi, et al. found that activated carbon combined with zinc oxide can efficiently adsorb Pb ions from aqueous solution.23 Ko, et al. found that zinc oxide branched carbon fibers are potentially useful for the removal of heavy metal.24 They reported that the modification process can introduce Zn compound to form colloidal or nanosized zinc particles on or in the carbon surface after pyrolysis. Their findings provided the possibilities of producing Zn/biochar adsorbents to remove contaminants from wastewater effectively.
In this study, a porous zinc–biochar nanocomposites was produced from sugarcane bagasse for the first time. Batch experiments were carried out to study the adsorption behavior of Cr(VI) using zinc–biochar. The effects of pH and background ionic strength on the adsorption ability were also investigated. Furthermore, the desorption/regeneration properties of zinc–biochar nanocomposites were investigated to determine the reusability of adsorbent and evaluate the economic feasibility.
2. Materials and methods
2.1. Materials
All chemicals including HCL, NaOH, H2SO4, HNO3, H3PO4, Zn(NO3)2·6H2O, C3H6O, C13H14N4O, K2Cr2O7 employed in the experiments were purchased at analytical reagent grade and without any further purification. Zinc nitration hexahydrate was obtained from Guangdong Xilong Chemical Co., Ltd. All the solutions were prepared with high-purity water (18.25 MΩ cm−1) from a Millipore Milli-Q water purification system.2.2. Synthesis of adsorbent
The zinc–biochar nanocomposites was synthesized according to the process described in the previous literature.25 First, the feedstock was pretreated using zinc nitrate solution (the mass ratio was 1![[thin space (1/6-em)]](https://www.rsc.org/images/entities/char_2009.gif) :
:![[thin space (1/6-em)]](https://www.rsc.org/images/entities/char_2009.gif) 1). 20 g of the bagasse powder was added into the Zn(NO3)2 solution (20%), and then the mixture was shaken at 130 rpm, 30 °C for 24 h. After that, the sample was dried in a vacuum drying oven under the temperature of 60 °C. Then the Zn(NO3)2-pretreted biomass were pyrolyzed to obtain the compound Zn/biochar as follow: a dry mixture of zinc oxide and biomass was heated (at a heating rate of 7 °C min−1) in a tube furnace up to 450 °C and keep the temperature for 1 h under a N2 flow rate of 50 mL min−1, then cooled to room temperature. The obtained biochar was washed with Di water for several times, air dried and sealed in a desiccator for further experiment tests.
1). 20 g of the bagasse powder was added into the Zn(NO3)2 solution (20%), and then the mixture was shaken at 130 rpm, 30 °C for 24 h. After that, the sample was dried in a vacuum drying oven under the temperature of 60 °C. Then the Zn(NO3)2-pretreted biomass were pyrolyzed to obtain the compound Zn/biochar as follow: a dry mixture of zinc oxide and biomass was heated (at a heating rate of 7 °C min−1) in a tube furnace up to 450 °C and keep the temperature for 1 h under a N2 flow rate of 50 mL min−1, then cooled to room temperature. The obtained biochar was washed with Di water for several times, air dried and sealed in a desiccator for further experiment tests.
2.3. Material characterization
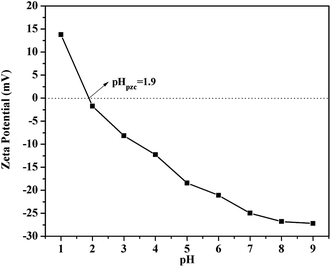
Function groups of adsorbents involved in the metal removal were examined by Fourier transform infrared spectrophotometer (FTIR) (Nicolet 5700 Spectrometer, USA). The elements of the samples were performed by an ESCALAB 250Xi X-ray Photoelectron Spectrometer (XPS) (Thermo Fisher, USA). The specific surface area and aperture were determined by the Brunauer, Emmett, and Teller (BET) (Tri-star 3020, USA) equation using a gas sorption analyzer and the total pore volume was measured based on the N2 adsorption–desorption isotherms. The microscopic features of adsorbents were characterized with a scanning electron microscopy (SEM) (JSM-7001F, Japan). The zero point charge of zinc–biochar was determined using Electroacoustic Spectrometer (ZEN3600 Zetasizer UK) varying solution pH from 1.0 to 9.0.2.4. Adsorption experiments
Cr stock solution (1000 mg L−1) was prepared by dissolving analytical grade 2.829 g K2Cr2O7 powder into 1000 mL deionized water. The solutions of different concentrations used in this study were obtained by diluting the stock solution. All the adsorption experiments were performed as follows: 0.1 g zinc–biochar was added to 50 mL Cr(VI) solution in flasks. Initial solution pH was adjusted by HCl or NaOH solution (0.1– 1 mol L−1). Flasks were shaken at 120 rpm at the needed temperature.The impact of pH on sorption was conducted by adjusting the initial Cr(VI) solution (100 mg L−1) ranging from 2.0 to 9.0. Flasks were shaken at 30 °C for 24 h. Kinetic experiments were carried out at pH 2.0, 30 °C with 100 mg L−1 Cr(VI) solution. The residual Cr(VI) concentration was calculated after designated time periods (15, 30, 60, 120, 180, 360, 480, 600, 720, 1080, 1440, 2160, 2880 min). Adsorption isotherms and thermodynamic data were obtained at the temperature of 30, 40 and 50 °C, with varied initial concentrations (25, 50, 75, 100, 200, 250, 400, 500 mg L−1). For the effect of background ionic strength, the experiments were studied at pH 2.0, 30 °C and initial Cr(VI) solution (50 mg L−1) was adjust by different concentrations of NaCl (0, 0.001, 0.005, 0.01, 0.05, 0.1, 0.5 mol L−1). All the experiments were carried out in triplicate parallel groups and the averages dates were recorded.
2.5. Desorption experiment
The feasibility of regenerating zinc–biochar for repeated use was investigated by using sodium hydroxide as stripping agent. Desorption experiment was conducted as follows: the adsorbent which has been used to remove Cr(VI) (500 mg L−1) was added into 50 mL of 0.5 mol L−1 NaOH solution, shaken at 120 rpm under 30 °C for 12 h. Then the adsorbent was washed to neutral by deionized water and collected to reuse.2.6. Chromium analysis
The Cr(VI) concentration was analyzed using the 1.5-diphenylcarbazide method with a UV-vis spectrophotometer (Pgeneral T6 China) at the wavelength of 540 nm. Adsorption efficiency (qe) and removal percentage (R) were calculated by the following equations:
 | (1) |
 | (2) |
3. Results and discussion
3.1. Characteristics of adsorbents
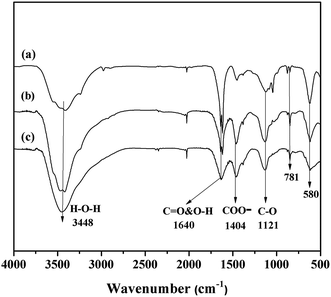
![[double bond, length as m-dash]](https://www.rsc.org/images/entities/char_e001.gif) O stretching vibrations of ester.26 The peak at 1404 cm−1 was related to COO– groups and the band at wave number of 580 cm−1 due to the C–H bending vibration.27,28 The absorbance band near 1121 cm−1 was the C–O bending vibration and the weak peak at about 781 cm−1 was related to the aromatic compounds.18,29
O stretching vibrations of ester.26 The peak at 1404 cm−1 was related to COO– groups and the band at wave number of 580 cm−1 due to the C–H bending vibration.27,28 The absorbance band near 1121 cm−1 was the C–O bending vibration and the weak peak at about 781 cm−1 was related to the aromatic compounds.18,29
In short, the groups of H–O–H, OH–, COO–, and C–O changed a bit after modification and the change could be attributed to the introduction of zinc.30–32 The bending vibration of OH– and COO– shifted marginally to the lower wave numbers after Cr(VI) adsorption. These changes indicated that the hydroxyl and carboxyl groups could be the main functional groups for Cr(VI) sorption. The results were in good agreement with the previous investigations.18,33,34
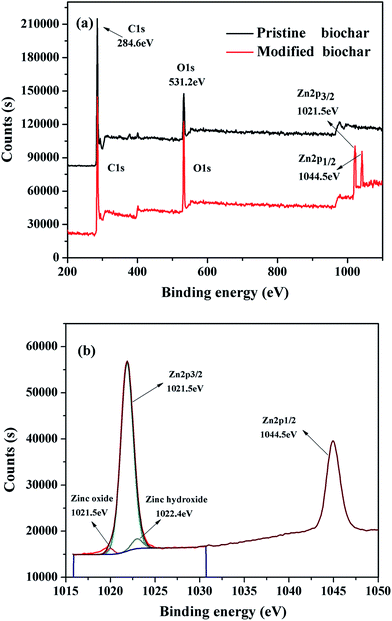
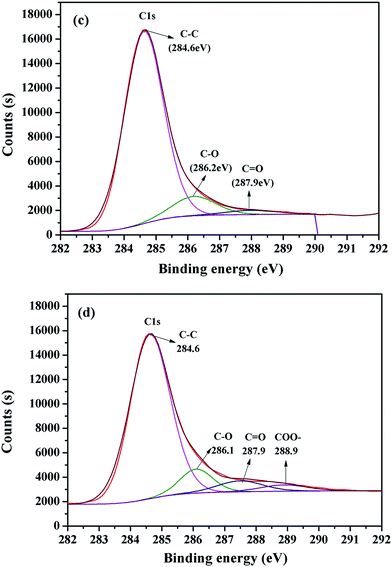
Fig. 3 shows the spectra of the C 1s regions for the pristine and modified biochar. The C 1s XPS spectrum for the modified biochar can be well fitted into four peak components (while the peak for the pristine biochar was three), which were attributed to different forms of carbon atoms. The peak observed at bending energy of about 284.6, 286.1 and 287.9 for the two carbon materials correspond to C–C (aromatic), C–O (alcoholic hydroxyl and ether) and C![[double bond, length as m-dash]](https://www.rsc.org/images/entities/char_e001.gif) O (carbonyl), respectively. The appearance of new peak at the bending energy of 288.9 after modification could be assigned to COO– (carboxyl and ester).36 The results suggested that the modified biochar was functionalized well with COO– groups, which was in agreement with FTIR results.
O (carbonyl), respectively. The appearance of new peak at the bending energy of 288.9 after modification could be assigned to COO– (carboxyl and ester).36 The results suggested that the modified biochar was functionalized well with COO– groups, which was in agreement with FTIR results.
| Specific surface area (m2 g−1) | Pore volume (m3 g−1) | Average pore (nm) | |
|---|---|---|---|
| Pristine biochar | 1.98 | 0.0037 | 6.124 |
| Zinc–biochar | 21.28 | 0.0325 | 7.459 |
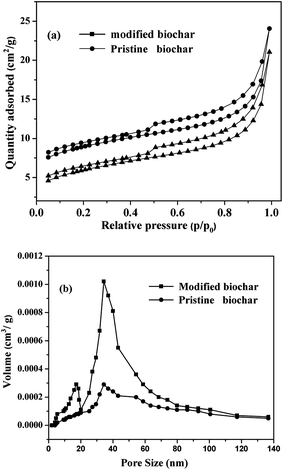
The isotherm curve (Fig. 4a) showed hysteresis loops in the relative pressure (p/p0) range from 0.5 to 0.9, demonstrating that their structures were uniform mesopores. The corresponding pore size distribution (Fig. 4b) clearly indicated that two carbon materials possessed a same pore size distribution around the centered of 35 nm. However, a new pore size distribution centered near 15 nm occurred for zinc–biochar. The occurrence of new peak might be attributed to the introduction of zinc.
3.2. Comparison experiments
The comparison of removal efficiency by Zn/biochar and pristine biochar was performed by varying the Cr(VI) concentrations from 20 to 200 mg L−1. As shown in Fig. 7a, the Cr(VI) removal efficiency of the modified biochar ranged from 95.4% to 55.7% while the pristine biochar changed from 80.2% and 20.7%, respectively. Based on the data of Fig. 7a and b indicated that the removal efficiency of the modified biochar was 1.2 to 2 times higher than that of the pristine biochar.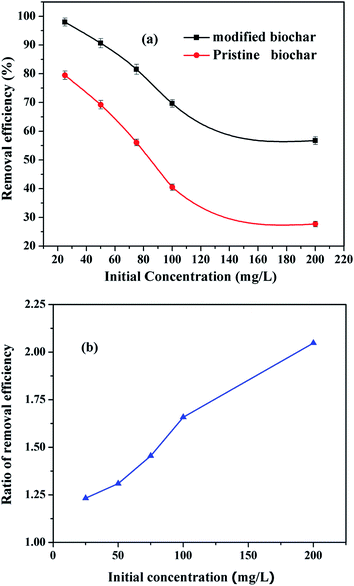 | ||
| Fig. 7 The comparison (a) and the ratio (b) of Cr(VI) removal efficiency between the modified and pristine biochar. | ||
The modified zinc–biochar exhibited much higher adsorption capacity and removal efficiency than the pristine biochar. It is mainly because that the high-temperature pyrolysis progress could introduce zinc to form zinc particles on the biochar surfaces, which can greatly increase the surface area and pore volume of the adsorbent.
3.3. Effect of solution pH
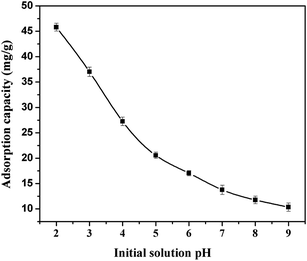
The solution pH is one of the most important parameters that significantly influence the adsorption process. It affects both the adsorbent surface charge and the speciation of the adsorbate. As observed in Fig. 8, the adsorption capacity increased as the equilibrium solution pH ranged from 9.0 to 2.0, and reached the maximum adsorption amount of 45.79 mg g−1 at the pH of 2.0.The speciation of hexavalent chromium was depended on the solution pH. It exists primarily as salts of H2CrO4 (at pHs less than about 1.0), HCrO4− (at pHs between 1.0 and 6.0) and CrO42− (at pHs above 6.0).37 The higher adsorption at low pH may be attributed to the formation of more polymerized chromium oxide species and the stronger interaction between the positively charged functional groups of the adsorbent and the negatively charged chromate ions.37,38 Furthermore, the decreasing tendency of Cr(VI) removal as pH increased was likely caused by the increase of competition between hydroxide complexes and Cr(VI) species for the sorption sites on the biochar.18 Therefore, the initial solution pH 2.0 was used as the optimum pH for the further experiments.
3.4. Adsorption kinetics
In order to explain the mechanism of adsorption processes, pseudo-first-order and pseudo-second-order models were applied to simulate the experimental kinetic data. The equations are generally expressed as follows:
ln(qe − qt) = ln![[thin space (1/6-em)]](https://www.rsc.org/images/entities/char_2009.gif) qe − k1t qe − k1t
| (3) |
 | (4) |
| Pseudo-first-order | Pseudo-second-order | ||||
|---|---|---|---|---|---|
| qe,1 (mg g−1) | k1 (min−1) | R2 | qe,2 (g mg−1 min−1) | k2 (min−1) | R2 |
| 35.481 | 14.921 | 0.976 | 46.339 | 0.021 | 0.993 |
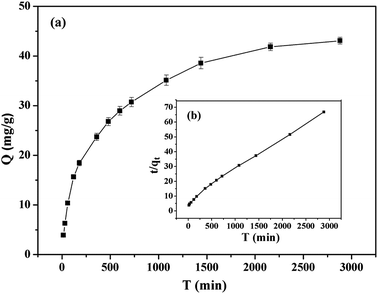
The effect of contact time on Cr(VI) adsorption by the modified biochar was represented in Fig. 8a. As can be seen, over 80% of the total Cr(VI) adsorption was rapidly happened within the beginning 10 h, then the subsequent process (10–48 h) last a long time until the sorption equilibrium was reached. Results of Cr(VI) sorption kinetics were presented in Fig. 9b. The correlation coefficient (R2) suggested that the experimental data fitted better to pseudo-second-order model (R2 = 0.993) than pseudo-first-order model (R2 = 0.976). Furthermore, the value of the adsorption amounts of Cr(VI) adsorbed qe,2 (46.34 mg g−1) calculated from pseudo-second-order model was more agreeable to the experimental qe (44.93 mg g−1) value. The adsorption process was better represented by the pseudo-second order model, indicating that the chemisorption of Cr(VI) on zinc–biochar was the rate-limiting mechanism.39 Therefore, it was inferred that Cr(VI) ions were adsorbed onto the surface of zinc–biochar by chemical interaction, such as ion exchange and chelating reaction.15
3.5. Adsorption isotherms
The equilibrium adsorption isotherms are essential data to explain the mechanism of the adsorption. Freundlich and Langmuir adsorption models were compared to simulate the adsorption isotherms data.The Langmuir model:
 | (5) |
The Freundlich model:
 | (6) |
The Cr(VI) sorption isotherms on the zinc–biochar at three different temperatures are shown in Fig. 10. The relative parameters obtained from the two models are listed in Table 3. It could be obviously observed that the correlation coefficient (R2) values of Freundlich model (0.98, 0.99, 0.98) at all temperatures were much better than those of Langmuir model (0.84, 0.91, 0.85). Therefore, the Freundlich model was more suitable for the adsorption process, indicating that the heterogeneity adsorption of the heavy metal ions to the bending sites which could be attributed to the surface functional groups of zinc–biochar.40 Moreover, the Freundlich model constant n at three temperatures were 3.03, 3.23 and 4.01, respectively. The large value of n explained the stronger interaction between the zinc–biochar and the Cr(VI) ions. Table 4 presented the comparison of the maximum Cr(VI) adsorption capacity of various adsorbents in the previous study. As seen, the prepared zinc–biochar nanocomposites maintained much higher Cr(VI) removal performance than many other adsorbent materials reported in the literature.41–44
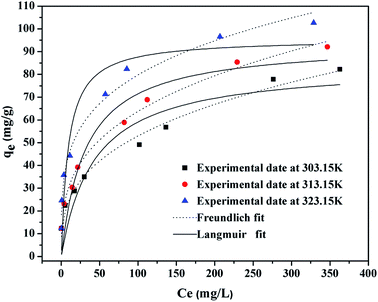 | ||
| Fig. 10 Freundlich and Langmuir isotherms of Cr(VI) adsorption on zinc–biochar (Cr(VI) solution volume: 50 mL; adsorbent dose: 0.1 g; contact time: 24 h; pH: 2.0). | ||
| T (K) | Langmuir model | Freundlich model | ||||
|---|---|---|---|---|---|---|
| qm (mg g−1) | KL (L mg−1) | R2 | KF (L mg−1) | n | R2 | |
| 303.15 | 84.87 | 0.02 | 0.84 | 11.28 | 3.03 | 0.98 |
| 313.15 | 94.38 | 0.03 | 0.91 | 14.79 | 3.23 | 0.99 |
| 323.15 | 96.18 | 0.10 | 0.85 | 25.35 | 4.01 | 0.98 |
3.6. Adsorption thermodynamic studies
The thermodynamic data were simulated by the following equations:
 | (7) |
ΔG0 = −RT![[thin space (1/6-em)]](https://www.rsc.org/images/entities/char_2009.gif) ln ln![[thin space (1/6-em)]](https://www.rsc.org/images/entities/char_2009.gif) ke ke
| (8) |
![[thin space (1/6-em)]](https://www.rsc.org/images/entities/char_2009.gif) K (K = qe/Ce) versus Ce and extrapolating Ce to zero, R (8.314 mol−1 K−1) is the universal gas constant.
K (K = qe/Ce) versus Ce and extrapolating Ce to zero, R (8.314 mol−1 K−1) is the universal gas constant.
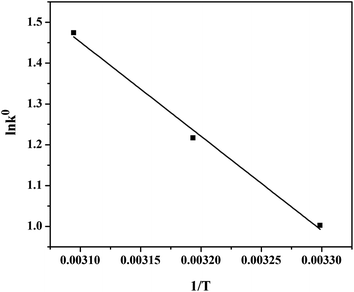
Fig. 11 was the estimation of thermodynamic parameters for the adsorption of Cr(VI) on zinc–biochar. The values of ΔS0 and ΔH0 were obtained by calculating the intercept and slope of the plot between ln![[thin space (1/6-em)]](https://www.rsc.org/images/entities/char_2009.gif) ke versus 1/T, respectively. The maximum adsorption amount of Cr(VI) was obtained at 323.15 K, and the maximum adsorption capacity ranged from 82 mg g−1 to 102 mg g−1 as the temperature ranged from 303.15 to 325.15 K. The rise in sorption capacity was caused by the more frequently collide and contact between the sorbent and the adsorbent under higher temperature. The values of thermodynamic parameters are given in Table 5. The negative values of ΔG0 at different temperatures proved that the adsorption process was feasibility and spontaneous. Furthermore, the decrease in the ΔG0 values with the increase temperature indicated that the sorption process was favored by the higher temperature. The changes in standard enthalpy and entropy of the adsorption process were 71.567 kJ mol−1 and 277.614 J mol−1 K−1, respectively, and the correlation coefficient (R2) was 0.99. The positive value of ΔH0 proved that it is an endothermic adsorption process and the positive value of ΔS0 indicated an increasing randomness at the solution interface during the adsorption.
ke versus 1/T, respectively. The maximum adsorption amount of Cr(VI) was obtained at 323.15 K, and the maximum adsorption capacity ranged from 82 mg g−1 to 102 mg g−1 as the temperature ranged from 303.15 to 325.15 K. The rise in sorption capacity was caused by the more frequently collide and contact between the sorbent and the adsorbent under higher temperature. The values of thermodynamic parameters are given in Table 5. The negative values of ΔG0 at different temperatures proved that the adsorption process was feasibility and spontaneous. Furthermore, the decrease in the ΔG0 values with the increase temperature indicated that the sorption process was favored by the higher temperature. The changes in standard enthalpy and entropy of the adsorption process were 71.567 kJ mol−1 and 277.614 J mol−1 K−1, respectively, and the correlation coefficient (R2) was 0.99. The positive value of ΔH0 proved that it is an endothermic adsorption process and the positive value of ΔS0 indicated an increasing randomness at the solution interface during the adsorption.
ln![[thin space (1/6-em)]](https://www.rsc.org/images/entities/char_2009.gif) k0 k0 |
ΔG0/(kJ mol−1) | ΔH0 (kJ mol−1) | ΔS0 (kJ mol−1 K−1) | R2 | ||||
|---|---|---|---|---|---|---|---|---|
| 303.15 K | 313.15 K | 323.15 K | 303.15 K | 313.15 K | 323.15 K | |||
| 1.003 | 1.217 | 1.474 | −2.527 | −3.168 | −3.961 | 277.614 | 71.567 | 0.99 |
3.7. Effect of background ionic strength studies
In this investigation, the common salt, NaCl, was chosen to study the effect of background ionic strength on Cr(VI) removal. The ionic strengths were adjusted by 0, 0.001, 0.005, 0.01, 0.05, 0.1 and 0.5 mol L−1 NaCl solutions at 30 °C. As shown in Fig. 12, the presence of NaCl scarcely influenced Cr(VI) removal at low concentrations (0.001 and 0.005 mol L−1). However, it obviously reduced the removal capacity of Cr(VI) from 92% to 71% and 53% at higher concentrations (0.1 and 0.5 mol L−1). This phenomenon could be attributed to the following reasons: (1) Cl− and Na+ were monovalent anions, they could not or only slightly compete for the adsorption site of zinc–biochar at low concentration.22 (2) While at high concentrations, the presence of Cl− and Na+ could hinder the electrostatic between the charges on zinc–biochar surface and Cr(VI) ions in solution and also compete with the Cr(VI) ions for surface adsorption sites of the adsorbent. (3) High concentration of NaCl could improve the ionic strength of the solution, thus influencing the activity coefficient of Cr(VI) and resulting in great decrease of the collide and contact between the sorbent.45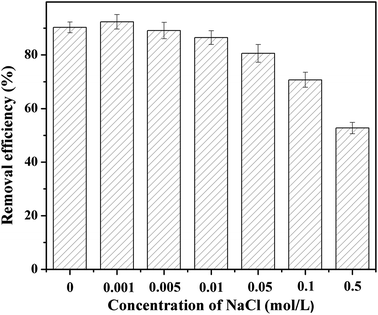 | ||
| Fig. 12 Effect of different concentrations of NaCl on Cr(VI) removal by zinc–biochar (volume: 50 mL; adsorbent dose: 0.1 g; initial Cr(VI) concentration: 50 mg L−1; pH: 2.0; contact time: 24 h). | ||
3.8. Regeneration and desorption analysis
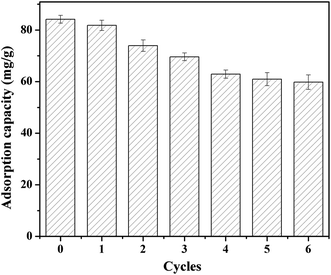
Desorption is another important process reflecting adsorption due to its economical and enhancement value. In this study, the regeneration of the zinc–biochar was surveyed by using 0.5 mol L−1 sodium hydroxide desorption. The results indicated that the adsorption ability decreased gradually with the increasing of cycles, but no less than 59.95 mg g−1 in the sixth cycle (Fig. 13), showing that zinc–biochar can be regenerated effectively using sodium hydroxide. The decreasing adsorption capacity trend could be assigned to the waste of the adsorbent does during the process and the negative changes of the materials' physical and chemical properties, such as the reduction of specific surface area and pore volume and the weakness of functional groups.4. Conclusions
In this study, the nano-zinc particles loading biochar was successfully synthesized as a low-cost and efficiency-effective adsorbent to remove Cr(VI) from the wastewater. The adsorption performance was obvious enhanced for batch experiments and the highest adsorption capacity was 102.66 mg g−1. The adsorption efficiency was slight influenced by the solution pH and the maximum adsorption amount was found to be 45.79 mg g−1 at the pH of 2.0. The experimental data was better fitted by the pseudo-second-order and Freundlich models. The adsorption capacity was significantly influenced by the background ionic strength (high concentrations of NaCl solutions). Besides, the adsorbent could be regenerated and reused by sodium hydroxide. XPS analysis indicated that the zinc particles had been successfully loaded on or into the modified biochar. In conclusion, this method of synthesizing nano-zinc particles in a biochar mixture offered new opportunities in finding effective and economic treatment to removal Cr(VI) and other heavy metals contaminant from wastewater.Acknowledgements
The study was financially supported by the National Science Foundation of China (Grant no. 41271332 and 51478470) and the Fundamental Research Funds for the Central University, Hunan University.References
- N. X. Wang, X. Y. Zhang, J. Wu, L. Xiao, Y. Yin, A. J. Miao, R. Ji and L. Y. Yang, Water Res., 2012, 46, 369–377 CrossRef PubMed.
- L. Khezami and R. Capart, J. Hazard. Mater., 2005, 123, 223–231 CrossRef PubMed.
- D. Park, Y. S. Yun, J. H. Jo and J. M. Park, Water Res., 2005, 39, 533–540 CrossRef PubMed.
- Y. Pang, G. M. Zeng, L. Tang, Y. Zhang, Y. Y. Liu, X. X. Lei, M. S. Wu, Z. Li and C. Liu, Bioresour. Technol., 2011, 102, 10733–10736 CrossRef PubMed.
- K. Baek and J. W. Yang, J. Hazard. Mater., 2004, 108, 119–123 CrossRef PubMed.
- V. K. Mishra and B. D. Tripathi, J. Hazard. Mater., 2009, 164, 1059–1063 CrossRef PubMed.
- H.-j. Hong, H. Kim, K. Baek and J.-W. Yang, Desalination, 2008, 223, 221–228 CrossRef PubMed.
- H. D. Choi, W. S. Jung, J. M. Cho, B. G. Ryu, J. S. Yang and K. Baek, J. Hazard. Mater., 2009, 166, 642–646 CrossRef PubMed.
- A. M. Yusof and N. A. N. N. Malek, J. Hazard. Mater., 2009, 162, 1019–1024 CrossRef CAS PubMed.
- V. K. Gupta, S. Agarwal and T. A. Saleh, Water Res., 2011, 45, 2207–2212 CrossRef PubMed.
- C.-X. Yang, Y.-J. Chen, H.-F. Wang and X.-P. Yan, Chem.–Eur. J., 2011, 17, 11734–11737 CrossRef CAS PubMed.
- X. Liu, L. Pan, Q. Zhao, T. Lv, G. Zhu, T. Chen, T. Lu, Z. Sun and C. Sun, Chem. Eng. J., 2012, 183, 238–243 CrossRef PubMed.
- S. Babel and T. A. Kurniawan, Chemosphere, 2004, 54, 951–967 CrossRef CAS PubMed.
- X.-q. Li, J. Cao and W.-x. Zhang, Ind. Eng. Chem. Res., 2008, 47, 2131–2139 CrossRef.
- M. Li, Q. Liu, L. Guo, Y. Zhang, Z. Lou, Y. Wang and G. Qian, Bioresour. Technol., 2013, 141, 83–88 CrossRef PubMed.
- G. X. Yang and H. Jiang, Water Res., 2014, 48, 396–405 CrossRef CAS PubMed.
- M. Ahmad, A. U. Rajapaksha, J. E. Lim, M. Zhang, N. Bolan, D. Mohan, M. Vithanage, S. S. Lee and Y. S. Ok, Chemosphere, 2014, 99, 19–33 CrossRef CAS PubMed.
- X. Dong, L. Q. Ma and Y. Li, J. Hazard. Mater., 2011, 190, 909–915 CrossRef CAS PubMed.
- X. Tan, Y. Liu, G. Zeng, X. Wang, X. Hu, Y. Gu and Z. Yang, Chemosphere, 2015, 125, 70–85 CrossRef CAS PubMed.
- S. Wang, B. Gao, A. R. Zimmerman, Y. Li, L. Ma, W. G. Harris and K. W. Migliaccio, Bioresour. Technol., 2015, 175, 391–395 CrossRef CAS PubMed.
- M. Essandoh, B. Kunwar, C. U. Pittman Jr, D. Mohan and T. Mlsna, Chem. Eng. J., 2015, 265, 219–227 CrossRef CAS PubMed.
- L. Tang, G.-D. Yang, G.-M. Zeng, Y. Cai, S.-S. Li, Y.-Y. Zhou, Y. Pang, Y.-Y. Liu, Y. Zhang and B. Luna, Chem. Eng. J., 2014, 239, 114–122 CrossRef CAS PubMed.
- Y. Kikuchi, Q. Qian, M. Machida and H. Tatsumoto, Carbon, 2006, 44, 195–202 CrossRef CAS PubMed.
- Y. Ko, D. Ramana and J. Yu, Nanoscale Res. Lett., 2013, 8, 1–7 CrossRef PubMed.
- M. Zhang, B. Gao, Y. Yao, Y. Xue and M. Inyang, Chem. Eng. J., 2012, 210, 26–32 CrossRef CAS PubMed.
- D. D. Das, M. I. Schnitzer, C. M. Monreal and P. Mayer, Bioresour. Technol., 2009, 100, 6524–6532 CrossRef CAS PubMed.
- T. Siva, K. Kamaraj, V. Karpakam and S. Sathiyanarayanan, Prog. Org. Coat., 2013, 76, 581–588 CrossRef CAS PubMed.
- R. K. Xu, S. C. Xiao, J. H. Yuan and A. Z. Zhao, Bioresour. Technol., 2011, 102, 10293–10298 CrossRef CAS PubMed.
- K. Lammers, G. Arbuckle-Keil and J. Dighton, Soil Biol. Biochem., 2009, 41, 340–347 CrossRef PubMed.
- J. B. L. Martins, E. Longo, J. G. R. Tostes, C. A. Taft and J. Andres, J. Mol. Struct., 1994, 303, 19–24 CrossRef.
- J. Choina, A. Bagabas, C. Fischer, G. U. Flechsig, H. Kosslick, A. Alshammari and A. Schulz, Catal. Today, 2015, 241, 47–54 CrossRef CAS PubMed.
- X. Wang, Z. Wu, Y. Wang, W. Wang, X. Wang, Y. Bu and J. Zhao, J. Hazard. Mater., 2013, 262, 16–24 CrossRef CAS PubMed.
- A. Z. Badruddoza, Z. B. Shawon, W. J. Tay, K. Hidajat and M. S. Uddin, Carbohydr. Polym., 2013, 91, 322–332 CrossRef CAS PubMed.
- X. S. Wang, L. F. Chen, F. Y. Li, K. L. Chen, W. Y. Wan and Y. J. Tang, J. Hazard. Mater., 2010, 175, 816–822 CrossRef CAS PubMed.
- J. Światowska-Mrowiecka, S. Zanna, K. Ogle and P. Marcus, Appl. Surf. Sci., 2008, 254, 5530–5539 CrossRef PubMed.
- S. Stankovich, D. A. Dikin, R. D. Piner, K. A. Kohlhaas, A. Kleinhammes, Y. Jia, Y. Wu, S. T. Nguyen and R. S. Ruoff, Carbon, 2007, 45, 1558–1565 CrossRef CAS PubMed.
- D. Mohan and C. U. Pittman Jr, J. Hazard. Mater., 2006, 137, 762–811 CrossRef CAS PubMed.
- M. QuiIntana, G. Curutchet and E. Donati, Biochem. Eng. J., 2001, 9, 11–15 CrossRef CAS.
- H. Lu, W. Zhang, Y. Yang, X. Huang, S. Wang and R. Qiu, Water Res., 2012, 46, 854–862 CrossRef CAS PubMed.
- H. Wang, Y.-g. Liu, X.-j. Hu, T.-t. Li, T. Liao and M. Lu, J. Cent. South Univ., 2014, 21, 2810–2818 CrossRef CAS.
- G. Kyzas and M. Kostoglou, Materials, 2014, 7, 333–364 CrossRef CAS PubMed.
- Z. Li, T. Katsumi, T. Inui and S. Imaizumi, Adsorpt. Sci. Technol., 2010, 28, 419–435 CrossRef CAS PubMed.
- A. Rao, A. Bankar, A. R. Kumar, S. Gosavi and S. Zinjarde, J. Contam. Hydrol., 2013, 146, 63–73 CrossRef CAS PubMed.
- S. Nethaji, A. Sivasamy and A. B. Mandal, Bioresour. Technol., 2013, 134, 94–100 CrossRef CAS PubMed.
- Z.-b. Zhang, X.-h. Cao, P. Liang and Y.-h. Liu, J. Radioanal. Nucl. Chem., 2012, 295, 1201–1208 CrossRef.
| This journal is © The Royal Society of Chemistry 2015 |

