DOI:
10.1039/C4RA11103F
(Paper)
RSC Adv., 2014,
4, 64559-64564
Spectroscopic and molecular modeling studies of human serum albumin interaction with propyl gallate
Received
24th September 2014
, Accepted 19th November 2014
First published on 19th November 2014
Abstract
Propyl gallate (PG) has been used as an antioxidant in the food industry. Because of its widespread use in the food industry, the toxicology of PG should be well addressed. In this study, for the first time, we report on the interaction of PG with human serum albumin (HSA) using fluorescence and circular dichroism (CD) spectroscopy. The fluorescence spectroscopy analysis showed a significant decrease in the fluorescence intensity of HSA upon increasing the concentration of PG. Further, the fluorescence quenching was found to be resultant from the formation of the PG–HSA complex, hence the quenching mechanism was rather a dynamic procedure. The positive values of enthalpy (ΔH), and entropy (ΔS) and the negative value of the Gibb's free energy (ΔG) indicated that hydrophobic interactions play a major role in the complexation of PG with HSA. To show the impact(s) of PG on the secondary structure of HSA, we capitalized on a CD technique, which showed a significant change in the secondary structure of HSA upon complexation with PG leading to a profound reduction of the α-helices content of HSA. Molecular modeling analysis confirmed that the hydrophobic interaction was the major intermolecular force that stabilizes the PG–HSA complex. Based on these findings, it can be concluded that PG molecules are dynamically bound to HSA and effectively distributed within the body.
Introduction
Propyl gallate (Fig. 1) has been regarded as a safe food-additive by the US Food and Drug Administration (FDA). As a food-grade antioxidant, it is particularly effective in preserving polyunsaturated fats and cosmetic products from rancidity and spoilage.1,2 Propyl gallate (PG) is usually used as a synergistic antioxidant with other additives such as butylated hydroxyanisole and butylated hydroxytoluene.1,3 The antioxidant activity of PG is maintained when the fat is blended with other ingredients in a final food stuff.1
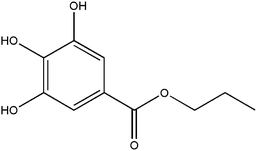 |
| | Fig. 1 Chemical structure of propyl gallate. | |
Due to the widespread use of PG, the potential toxicity of PG has widely been studied in vivo and in vitro towards mutagenicity and cytogenetic effects.3–7 Despite presumed low toxicity of PG, it imposes some inadvertent reactions on the normal functions of target tissues and/or cells.8 For example, the cytotoxicity of PG in the isolated rat hepatocytes was shown to occur via mitochondrial impairing, resulting in marked depletion of ATP at cellular level.9 PG was also reported to inhibit the growth of microorganisms by preventing nucleic acid synthesis and respiration.10 Antioxidative and cytoprotective properties of PG may be altered to pro-oxidative, cytotoxic and genotoxic impacts in a time- and concentration-dependent manner.3,11 Thus, to identify the discrepancy between such paradoxical effects of PG, further investigations need to be performed for revalidation of its function and safety. Although pharmacokinetics (PK) and pharmacodynamics (PD) of PG are partially studied, its interaction with main blood-circulating endogenous proteins (e.g., albumin) has yet to be investigated.
As the main macromolecule of plasma, human serum albumin (HSA) is one of the most widely studied proteins, in part due to its availability, low cost, stability and unusual ligand binding properties.12–14 Besides, albumin is the main multifunctional blood-circulating protein that has an important role in the transportation and deposition of numerous endogenous and exogenous substances in blood.15 The interaction of various chemicals as well as drugs with this protein leads to the formation of a stable complex, which can markedly affect the distribution and the metabolism of the blood-borne chemicals. Therefore, drug–albumin interaction may provide pivotal information in terms of PK and PD of exogenous compounds, resulting in a much better understanding of their biological impacts.16,17
To the best of our knowledge, the interaction of PG with HSA has not been studied. Given the widespread application of PG in food industries, therefore its interaction with the main protein of plasma, albumin, needs to be addressed. To this end, in the current study, we investigated the binding properties of PG with HSA using fluorescence quenching method followed by circular dichroism (CD) spectroscopy. Moreover, the molecular modeling was exploited for further clarification of the interaction of PG with HSA.
Materials and methods
Materials
HSA (Fatty acid free <0.05%), Tris–HCl buffer and PG were purchased from Sigma Aldrich Co., (Poole, UK). All other chemicals used were in the highest quality available.
Preparation of stock solutions
The stock solution of the HSA was prepared by dissolving the appropriate amount of HSA in aqueous solution containing Tris buffer (10 mM, pH 7.4) and was kept in the dark at 4 °C. The protein concentration was determined by UV-Vis spectrophotometry using the molar absorption coefficient (ε = 35![[thin space (1/6-em)]](https://www.rsc.org/images/entities/char_2009.gif) 700 M−1 cm−1) at 287 nm.
700 M−1 cm−1) at 287 nm.
PG stock solution was prepared by dissolving a proper amount of PG in double distilled water.
Apparatus
Fluorescence spectra. All fluorescence spectra were recorded with a spectrofluorimeter, Jasco FP-750 (Kyoto, Japan) equipped with a 150 W Xenon lamp, using 1.0 cm quarts cell with a thermostat bath. The maximal fluorescence emission of HSA at λex = 290 nm was located at 350 nm. Fluorescence spectra were recorded from 280 to 450 nm with the excitation wavelength at 290 nm. The fluorescence intensity of HSA was measured in the absence or presence of the PG by keeping the concentration of HSA constant (i.e., 3.0 × 10⁻⁵ M) while varying the PG concentration from 0 to 1.0 × 10⁻³ M. Experiments were measured at four temperatures (283, 293, 303 and 310 K).
Circular dichroism studies. CD measurements were recorded on a JASCO (J-810) spectropolarimeter (i.e., between 200 and 250 nm and cell length path was 1.0 cm) by keeping the concentration of HSA constant (3.0 × 10⁻⁶ M) while varying the PG concentration from 0 to 8.0 × 10⁻⁵ M.
UV-Vis spectrophotometry. UV-Vis spectroscopic study was performed by means of a UV-Vis spectrophotometer, T 60, PG Instrument (Leicestershire, UK).
Molecular docking analysis. Molecular docking analysis was carried out to acquire the binding energy of the protein–probe complex, and the binding sites in HSA. The crystal structure of HSA was retrieved from the Protein Data Bank (code: 1N5U). All the ligands and water molecules were removed before the analysis. The docking experiments were performed by means of the docking software Auto Dock 4.2.6 along with the Auto Dock Tools (ADT). For the identification of the binding sites in HSA, docking was performed with setting grid size to 110, 110, and 110 respectively for x, y, and z axes with a grid spacing of 0.375 Å after assigning the protein and probe. For each docking cases, the lowest energy docked conformation, according to the Auto Dock scoring function, was selected as the binding mode.
Results and discussion
Analysis of fluorescence quenching of HSA by PG
Fluorescence spectroscopy has usually been used to investigate the molecular interaction(s) between ligands and biomacromolecules due to its high sensitivity.18–20 The fluorescence spectra of HSA with varying concentrations of PG are shown in Fig. 2. The fluorescence of HSA regularly decreased upon increasing concentration of PG, which is a clear indication of PG interaction with HSA and hence quenching of its intrinsic fluorescence.
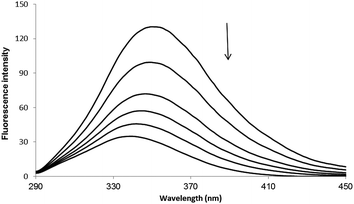 |
| | Fig. 2 Fluorescence spectra of HSA in the absence or the presence of PG, [HSA] = 3 × 10⁻⁵ M and [PG] = 0, 2, 4, 6, 8, 10 × 10−4 M. | |
In general, the fluorescence of HSA originates from L-tryptophan, L-tyrosine and L-phenylalanine entities. The inherent fluorescence of HSA (around 350 nm) is due to the presence of L-tryptophan alone because the fluorescence of L-tyrosine is thoroughly quenched if it is ionized or situated near to an amino group.14,21 It should be highlighted that the ground complex formation, the energy transfer and the dynamic quenching processes are able to result in fluorescence quenching under the conditions of fixed pH, temperature and ionic strength.14 In fact, two quenching processes are known as (a) dynamic (the so-called collisional quenching) and (b) static quenching. The first refers to a process that the excited fluorophore and the quencher come into contact and the rate of quenching is diffusion-controlled depending on the temperature and the viscosity of the solution. The second refers to fluorophore–quencher stable complex formation in ground state. One way to discriminate the static quenching from the dynamic quenching is to examine their differing dependence on temperature. In short, the higher the temperature, the larger the diffusion coefficient in the dynamic quenching will occur. Consequently, the bimolecular quenching constants are estimated to increase with the temperature rising, but a reverse effect would be observed for the static quenching.14,22
The fluorescence quenching data were analyzed using the Stern–Volmer equation (eqn (1)):
| |
 | (1) |
where,
F0 and
F are the fluorescence intensities of HSA in the absence or the presence of quencher (PG), respectively.
KSV is Stern–Volmer quenching constant which is a measure of the efficiency of fluorescence quenching by PG and [Q] is the concentration of the quencher.
18,22 Hence,
eqn (1) was applied to determine
KSV by a linear regression of
F0/
F versus [Q]. The calculated
KSV values were presented in
Table 1, which indicate that the probable fluorescence-quenching of PG on HSA is a dynamic quenching phenomenon because the
KSV constants increase with the rising temperature.
23
Table 1 Stern–Volmer quenching constants (KSV) and binding constants (KB) of PG–HSA complex at different temperatures
| T (K) |
KSV (M−1) |
KB (M−1) |
N |
| 283 |
3.41 × 10³ |
4.27 × 10⁴ |
1.39 |
| 293 |
3.65 × 10³ |
1.01 × 10⁵ |
1.51 |
| 303 |
4.26 × 10³ |
3.79 × 10⁵ |
1.68 |
| 310 |
5.53 × 10³ |
1.33 × 10⁶ |
1.87 |
Binding constant and number of binding sites
When small molecules interact independently to a set of equivalent sites on a macromolecule such as proteins, the binding constant (Kb) and the binding stoichiometry (n) can be determined by the eqn (2):23–25| |
 | (2) |
where, Kb is the binding constant for the PG–HSA interaction and n is the number of binding sites per albumin molecule, which can be determined by the slope and the intercept of the double logarithm regression curve of log((F0 − F)/F) versus log[PG] based on the eqn (2). The calculated Kb and n values were presented in Table 1, which indicate that that there is one independent class of binding site on HSA for PG and Kb increases with the rising temperature.
Binding mode and thermodynamic analyses
To have a better understanding on thermodynamics of the complexation, the contributions of enthalpy and entropy should be determined for the interaction of HSA with PG. As shown in Fig. 3, the plot of ln![[thin space (1/6-em)]](https://www.rsc.org/images/entities/char_2009.gif) Kb versus 1/T at four different temperatures (283, 293, 303, and 310 K) allows determination of thermodynamic parameters of PG–HSA formation via Van't Hoff eqn (3):26
Kb versus 1/T at four different temperatures (283, 293, 303, and 310 K) allows determination of thermodynamic parameters of PG–HSA formation via Van't Hoff eqn (3):26| |
 | (3) |
knowing these two values (i.e., ΔH, ΔS), changes in Gibs free energy (ΔG) were calculated from the following standard eqn (4):26the ΔH, ΔS and the corresponding values of ΔG at four temperatures were calculated (Table 2). As shown in Table 2, the binding process was always spontaneous as demonstrated by the negative values of ΔG and the formation of the complex is an exothermic reaction accompanied by positive values of ΔH and ΔS. The interaction between chemicals and biomolecule may occur by hydrophobic forces, electrostatic interactions, van der Waals interactions and hydrogen bonds. Based upon the data of ΔH and ΔS, the model of interaction between the various chemicals and biomolecule can be estimated. Concerning positive ΔH and ΔS values are normally taken as proof for the hydrophobic interaction. The negative value of ΔH and the positive value of ΔS are indicative of the electrostatic interaction(s) between ionic species in aqueous solution, while the negative ΔH and ΔS values are due to the van der Waals and hydrogen bonding formation. Therefore, the main interaction between PG and HSA seems to be due to the hydrophobic interaction.15,27
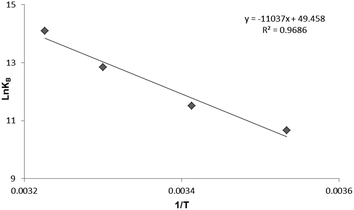 |
| | Fig. 3 The Van't Hoff plot for the interaction of HSA and PG, [HSA] = 3 × 10⁻⁵ M; [PG] = 0, 2, 4, 6, 8, 10 × 10−4 M. | |
Table 2 Thermodynamic parameters of the binding of PG to HSA
| T (K) |
ln![[thin space (1/6-em)]](https://www.rsc.org/images/entities/char_2009.gif) KB KB |
ΔG° (kJ mol−1) |
ΔH° (kJ mol−1) |
ΔS° (J mol−1 K−1) |
| 283 |
10.662 |
−24.610 |
91.777 |
411.265 |
| 293 |
11.519 |
−28.723 |
91.777 |
411.265 |
| 303 |
12.846 |
−32.835 |
91.777 |
411.265 |
| 310 |
14.102 |
−35.714 |
91.777 |
411.265 |
Circular dichroism spectroscopy
CD, as a sensitive technique, was used for the monitoring of conformational changes of HSA upon interaction with PG. It is highly sensitive towards any changes in the secondary structure (α-helical and β-sheet structures) of proteins.14,28 HSA has a high percentage of α-helical structure, which indicates characteristic strong double minimum signals at 208 and 222 nm. Alterations in the peak intensity of these wavelengths in the presence of small molecules may be applied to evaluate shifts in the α-helical content of the protein. The logical clarification is that the negative peaks between 208–209 and 222–223 nm are both rationalized to n–π* transfer for the peptide bond of α-helical. The CD results were expressed in terms of mean residue ellipticity (MRE) in deg cm2 dmol−1 according to the eqn (5):23| |
 | (5) |
where, Cp is the molar concentration of the protein, n is the number of amino acid residues of the protein (585) and l is the path length (1.0 cm). The α-helical contents of free and combined HSA were calculated from MRE values at 208 nm using the eqn (6):23| |
 | (6) |
MRE208 represents the observed MRE value at 208 nm, and the values 4000 and 33![[thin space (1/6-em)]](https://www.rsc.org/images/entities/char_2009.gif) 000 are respectively the β-form and the random coil conformation cross in total and a pure α-helix. In comparison with the free HSA, the content of α-helix was found to be decreased from 75.87% to 46.65% at a molar ratio of 2.6
000 are respectively the β-form and the random coil conformation cross in total and a pure α-helix. In comparison with the free HSA, the content of α-helix was found to be decreased from 75.87% to 46.65% at a molar ratio of 2.6![[thin space (1/6-em)]](https://www.rsc.org/images/entities/char_2009.gif) :
:![[thin space (1/6-em)]](https://www.rsc.org/images/entities/char_2009.gif) 1 of PG to HSA.
1 of PG to HSA.
Fig. 4 shows the CD spectra of HSA in the absence or the presence of different concentrations of PG. The intensities of two double minimum reveal the amount of helicity of HSA and further these indicate that HSA contains more than 50% of α-helical structure. The extent of α-helicity of the protein reduced in the presence of different PG concentrations, and hence the intensity of double minimum was decreased. This is indicative of the change in helicity when PG is entirely bound to HSA. Since the binding of PG to HSA leads to modification in the secondary structure of HSA, therefore, the toxicity of PG can be in part due to the structural change in protein.
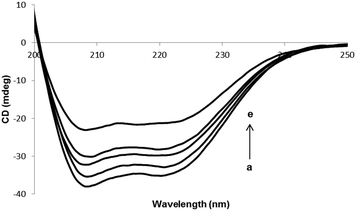 |
| | Fig. 4 CD spectra of HSA in the presence of various concentrations of PG. [HSA] = 3 × 10⁻⁶ M. (ri = ([PG]/[HSA]) = 0.0, 0.33, 1.0, 1.66 and 2.66). | |
Molecular modeling analysis
Computational molecular docking has been used to understand the interaction of PG with HSA. The possible conformations of the PG–HSA complex were calculated using Autodock program. As a heart-shaped protein, HSA consists of a single polypeptide chain of 585 amino acid residues. Each of the homologous α-helix domains [I (residues 1–195) II (196–383) and III (384–585)] has two subdomains (A and B), with six α-helix in subdomain A and four α-helix in subdomain B. HSA is able to interact with various ligands in several binding sites.27,29 Fig. 5 shows that the most possible interaction mode between PG and HSA. PG has capability to interact with all subdomains of HSA, but the most favorable site is IB, IIB and IIIA. Among them, the lowest free energy change of binding (ΔG) quantity belonged to IB. The calculated HSA–PG binding ΔG for IB, IIB and IIIA sites were −6.63, −5.84 and −5.63 (kcal mol−1), respectively. Fig. 6 shows the most possible interaction modes between PG and HSA. The acting forces between these complexes can be due to possible hydrophobic and/or hydrophilic interactions as well as hydrogen bond, in which the hydrophobic interaction appeared to be the dominant binding force. As demonstrated in Fig. 6, the maximum hydrophobic interactions occur in the IB subdomain due to the presence of more hydrophobic amino acids such as L-tryptophan and L-tyrosine residues of HSA.27,30 Therefore, this finding suggests a good structural basis to clarify the fluorescence quenching of HSA emission in the presence of PG.
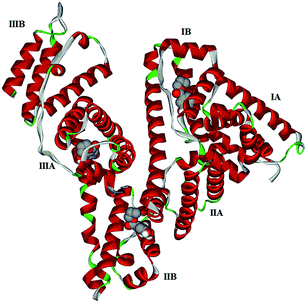 |
| | Fig. 5 Docking interaction of PG and HSA. PG molecules are shown as CPK and protein is represented as solid ribbon. | |
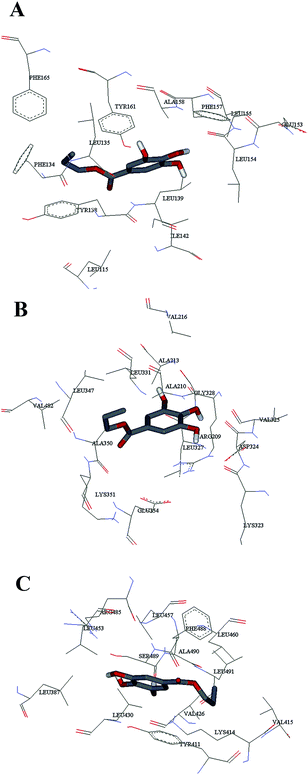 |
| | Fig. 6 The computational interaction model of (A) HSA – subdomains IB; (B) HSA – subdomains IIB; (C) HSA – subdomains IIIA. The amino acid residues of HSA are represented using lines and PG structure is represented as stick model. | |
Conclusions
In the current study, the interaction of PG with HSA was investigated by employing spectroscopic methods under physiological conditions. The attained results demonstrate that PG can dynamically bind to HSA with high affinity, by which the interstice fluorescence of HSA is effectively quenched. The increasing values of KSV upon temperature rising indicated the occurrence of a dynamic quenching mechanism. The positive values of both ΔH and ΔS and the negative value of ΔG highlighted that the hydrophobic interaction play a major role in stabilizing the PG–HSA complex. The CD spectra of HSA in the presence of PG showed that the binding of food additive can elicit the secondary structural change in protein. The computational modeling analysis confirmed that PG interacts with HSA mostly via the hydrophobic force through L-tryptophan and/or L-tyrosine residues of HSA. In addition to its importance in PK, the binding of this food additive to proteins is greatly important in food chemistry and industry. Therefore, it is worthwhile to make a thorough analysis on the extensive use of PG in food industry.
Acknowledgements
The authors are grateful for the financial support granted by the Student Research Committee and the Research Center for Pharmaceutical Nanotechnology at, Tabriz University of Medical Sciences.
References
- J. E. N. Dolatabadi and S. Kashanian, Food Res. Int., 2010, 43, 1223–1230 CrossRef CAS PubMed.
- B. R. You and W. H. Park, Mol. Biol. Rep., 2011, 38, 2349–2358 CrossRef CAS PubMed.
- H. Hamishehkar, S. Khani, S. Kashanian, J. Ezzati Nazhad Dolatabadi and M. Eskandani, Drug Chem. Toxicol., 2014, 37, 241–246 CrossRef CAS PubMed.
- Y. H. Han, H. J. Moon, B. R. You and W. H. Park, Toxicol. In Vitro, 2010, 24, 1183–1189 CrossRef CAS PubMed.
- C. H. Chen, W. C. Lin, C. N. Kuo and F. J. Lu, Food Chem. Toxicol., 2011, 49, 494–501 CrossRef CAS PubMed.
- X. H. Che, W. Y. Jiang, D. R. Parajuli, Y. Z. Zhao, S. H. Lee and D. H. Sohn, Arch. Pharmacal Res., 2012, 35, 2205–2210 CrossRef CAS PubMed.
- T. W. Wu, K. P. Fung, L. H. Zeng, J. Wu and H. Nakamura, Biochem. Pharmacol., 1994, 48, 419–422 CrossRef CAS.
- Y. H. Han and W. H. Park, Food Chem. Toxicol., 2009, 47, 2531–2538 CrossRef CAS PubMed.
- Y. Nakagawa, K. Nakajima, S. Tayama and P. Moldeus, Mol. Pharmacol., 1995, 47, 1021–1027 CAS.
- I. Boyd and E. G. Beveridge, J. Pharm. Pharmacol., 1979,(suppl. 31), 34P CrossRef CAS PubMed.
- H. Jacobi, B. Eicke and I. Witte, Free Radical Biol. Med., 1998, 24, 972–978 CrossRef CAS.
- T. Peters Jr, Adv. Protein Chem., 1985, 37, 161–245 CrossRef CAS.
- N. Shahabadi and S. M. Fili, Spectrochim. Acta, Part A, 2014, 118, 422–429 CrossRef CAS PubMed.
- N. Shahabadi and S. Hadidi, Spectrochim. Acta, Part A, 2014, 122, 100–106 CrossRef CAS PubMed.
- N. Shahabadi and M. Maghsudi, J. Mol. Struct., 2009, 929, 193–199 CrossRef CAS PubMed.
- N. Zhou, Y.-Z. Liang and P. Wang, J. Photochem. Photobiol., A, 2007, 185, 271–276 CrossRef CAS PubMed.
- L. Shang, X. Jiang and S. Dong, J. Photochem. Photobiol., A, 2006, 184, 93–97 CrossRef CAS PubMed.
- S. Kashanian and J. Ezzati Nazhad Dolatabadi, Eur. Food Res. Technol., 2010, 230, 821–825 CrossRef CAS PubMed.
- S. M. Ahmadi, G. Dehghan, M. A. Hosseinpourfeizi, J. E. Dolatabadi and S. Kashanian, DNA Cell Biol., 2011, 30, 517–523 CrossRef CAS PubMed.
- G. Dehghan, J. E. Dolatabadi, A. Jouyban, K. A. Zeynali, S. M. Ahmadi and S. Kashanian, DNA Cell Biol., 2011, 30, 195–201 CrossRef CAS PubMed.
- N. Shahabadi, A. Khorshidi and N. H. Moghadam, Spectrochim. Acta, Part A, 2013, 114, 627–632 CrossRef CAS PubMed.
- S. Kashanian and J. E. N. Dolatabadi, Food Chem., 2009, 116, 743–747 CrossRef CAS PubMed.
- N. Shahabadi, A. Khorshidi and M. Mohammadpour, Spectrochim. Acta, Part A, 2014, 122, 48–54 CrossRef CAS PubMed.
- J. Ezzati Nazhad Dolatabadi, H. Hamishehkar, M. de la Guardia and H. Valizadeh, BioImpacts, 2014, 4, 39–42 Search PubMed.
- S. Kashanian and J. Ezzati Nazhad Dolatabadi, DNA Cell Biol., 2009, 28, 535–540 CrossRef CAS PubMed.
- S. Roy, R. Banerjee and M. Sarkar, J. Inorg. Biochem., 2006, 100, 1320–1331 CrossRef CAS PubMed.
- S. Tabassum, W. M. Al-Asbahy, M. Afzal and F. Arjmand, J. Photochem. Photobiol., B, 2012, 114, 132–139 CrossRef CAS PubMed.
- J. E. N. Dolatabadi, Int. J. Biol. Macromol., 2011, 48, 227–233 CrossRef CAS PubMed.
- F. Janati Fard, Z. Mashhadi Khoshkhoo, H. Mirtabatabaei, M. R. Housaindokht, R. Jalal, H. Eshtiagh Hosseini, M. R. Bozorgmehr, A. A. Esmaeili and M. Javan Khoshkholgh, Spectrochim. Acta, Part A, 2012, 97, 74–82 CrossRef CAS PubMed.
- Z. Sattar, H. Iranfar, A. Asoodeh, M. R. Saberi, M. Mazhari and J. Chamani, Spectrochim. Acta, Part A, 2012, 97, 1089–1100 CrossRef CAS PubMed.
|
| This journal is © The Royal Society of Chemistry 2014 |
Click here to see how this site uses Cookies. View our privacy policy here. ![[thin space (1/6-em)]](https://www.rsc.org/images/entities/char_2009.gif) 700 M−1 cm−1) at 287 nm.
700 M−1 cm−1) at 287 nm.


![[thin space (1/6-em)]](https://www.rsc.org/images/entities/char_2009.gif) Kb versus 1/T at four different temperatures (283, 293, 303, and 310 K) allows determination of thermodynamic parameters of PG–HSA formation via Van't Hoff eqn (3):26
Kb versus 1/T at four different temperatures (283, 293, 303, and 310 K) allows determination of thermodynamic parameters of PG–HSA formation via Van't Hoff eqn (3):26

![[thin space (1/6-em)]](https://www.rsc.org/images/entities/char_2009.gif) KB
KB

![[thin space (1/6-em)]](https://www.rsc.org/images/entities/char_2009.gif) 000 are respectively the β-form and the random coil conformation cross in total and a pure α-helix. In comparison with the free HSA, the content of α-helix was found to be decreased from 75.87% to 46.65% at a molar ratio of 2.6
000 are respectively the β-form and the random coil conformation cross in total and a pure α-helix. In comparison with the free HSA, the content of α-helix was found to be decreased from 75.87% to 46.65% at a molar ratio of 2.6![[thin space (1/6-em)]](https://www.rsc.org/images/entities/char_2009.gif) :
:![[thin space (1/6-em)]](https://www.rsc.org/images/entities/char_2009.gif) 1 of PG to HSA.
1 of PG to HSA.


