Room-temperature ABX3-typed molecular ferroelectric: [C5H9–NH3][CdCl3]†
Yi
Zhang
,
Heng-Yun
Ye
,
Wen
Zhang
and
Ren-Gen
Xiong
*
Ordered Matter Science Research Center, Southeast University, Nanjing, 211189, P. R. China. E-mail: xiongrg@seu.edu.cn; Tel: +86-25-52090626
First published on 6th January 2014
Abstract
Reaction of CdCl2 with cyclopentylamine in the presence of aqueous HCl affords an ABX3-typed perovskite structure compound [C5H9–NH3][CdCl3] (1). Above 300 K, it is in a paraelectric phase with a centrosymmetric space group Cmcm, while below 300 K it has a noncentrosymmetric space group Cc, corresponding to a ferroelectric phase. The temperature-dependent dielectric constant shows a peak at about 300 K with a 12-fold enhancement which is confirmed by differential scanning calorimetry. The normalized pyroelectric and second-harmonic generation effect as functions of temperature are almost overlapped, probably indicating that the trends with temperature basically satisfy the Landau phenomenological theory, revealing a symmetry-breaking occurrence. The ferroelectricity, a spontaneous saturation polarization approximately reaching 1.7 μC cm−2, is further confirmed by piezoresponse force microscopy.
Introduction
From both a theoretical and an application point of view, perovskite-like materials have rich properties that have found a lot of practical and high-technological applications such as high magnetoresistance, ferroelectricity (especially multiferroics), superconductivity, charge ordering, spin dependent transport, high thermo power and the interplay of structural, magnetic and transport properties. Also, these compounds can be utilized as sensors and catalyst electrodes in certain types of fuel cells and are candidates for memory devices and spintronics applications. Furthermore, many famous superconducting ceramic compounds with high phase transition temperatures (Tc) have perovskite-like structures, e.g. yttrium barium copper oxide. In addition, synthetic perovskites have been identified as possible cheap base materials for high-efficiency commercial photovoltaics because they can achieve 15% efficiencies, higher than the 10% usually achieved for typical commercial silicon solar cells, and can be manufactured using the same thin-film manufacturing techniques used for existing commercial silicon solar cells. At the same time, chemical engineers have also found that a cobalt-based perovskite material may replace platinum in catalytic converters in diesel vehicles to substantially reduce device expense.Generally, any materials with the same type of crystal structure as CaTiO3 can be called perovskite-type compounds with a general chemical formula ABX3 where A and B are two different cations of very different sizes, i.e. A atoms are larger than B atoms, and X is an anion that binds to both of the cations. In the ideal cubic-symmetry perovskite structure, the B cation has a 6-fold octahedral coordination, surrounded by six anions, and the A cation displays a 12-fold cuboctahedral coordination.1–3
Recently, molecule-based ABX3 ferroelectrics mimicking ABO3-type perovskite structure ceramic ferroelectrics have received much attention, including metal–organic framework [R2NH2][M(HCOO)]3 where R is H or methyl and M is divalent Zn, Mn, Cu, Co, Ni, etc. Their spontaneous polarizations (Ps) range from about 1 to 3 μC cm−2 and phase transition temperatures are all below 0 °C. It is worth noting that in their structure the formate only coordinates to M. This feature makes the molecular perovskite ferroelectrics tunable by chemical modifications. Low-symmetric feature make this type of compounds unique directional ferroelectrics with an Aizu expression of 622F6.4–6
Another family of ABX3-type perovskite compounds is the one where X is a halogen ion (Cl, Br or I). Typical examples are one-dimensional [NMe4][CdBr3] (Tc = 156 K, P63/m to P63, Aizu expression 6/mF6) and three-dimensional [MeNH3][SnCl3] (Tc = 350 K, Pm3m to R3m, Aizu expression m3mF3m). Similarly, in these compounds, the halogen ions only bound to the B cations (Cd or Sn). Investigations on their ferroelectric properties reveal that only [NMe4][CdBr3] displays a weak ferroelectric spontaneous polarization (0.12 μC cm−2) with a relatively bad P–E hysteresis loop.7,8
Encouraged by the structural tunability of ABX3-typed perovskite compounds, we discovered that the reaction of CdCl2 with cyclopentylamine in the presence of aqueous HCl afforded an ABX3-typed perovskite compound [C5H9–NH3][CdCl3] (1). Above room-temperature, it is in a paraelectric phase with a centrosymmetric space group Cmcm while below this temperature, it has a noncentrosymmetric space group Cc, corresponding to a ferroelectric phase. Thus it is a typical ferroelectric with an Aizu expression of mmmFm.9 Temperature-dependent dielectric, pyroelectric, and second-harmonic generation (SHG) behaviors as well as polarization switching property were performed.
Experimental
Synthetic procedures
Concentrated hydrochloric acid (1.00 g, 0.01 mol) was added dropwise to cyclopentylamine (0.85 g, 0.01 mol) in water (20 mL). The solution was then added to an aqueous solution of cadmium chloride (2.28 g, 0.01 mol). Colorless block crystals of 1 were obtained on slow evaporation after a few weeks with a yield of about 40% based on CdCl2. Phase purity of 1 is confirmed by infrared spectra (IR) and powder X-ray diffraction (PXRD) matching (Fig. S1 and S2†).Measurement methods
IR spectra were recorded on a Shimadzu IRPrestige-21. PXRD was measured on a Rigaku D/MAX 2000 PC X-ray diffraction instrument. Differential scanning calorimetry (DSC) measurements were performed on a PerkinElmer Diamond DSC under nitrogen atmosphere in aluminum crucibles with a heating or cooling rate of 10 K min−1. For second harmonic generation (SHG) experiments, an unexpanded laser beam with low divergence (pulsed Nd:YAG at a wavelength of 1064 nm, 5 ns pulse duration, 1.6 MW peak power, 10 Hz repetition rate) was used. The instrument model is Ins 1210058, INSTEC Instruments and the temperature system is 90–473 K while the laser is Vibrant 355 II, OPOTEK. The numerical values of the nonlinear optical coefficients for SHG have been determined by comparison with a KDP reference. For dielectric, ferroelectric and pyroelectric measurements, the samples were made with single-crystals cut into the form of thin plate perpendicular to the crystal axis. Silver conduction paste deposited on the plate surfaces was used as the electrodes. Complex dielectric permittivities were measured with a TH2828A impedance analyzer over the frequency range from 500 Hz to 1 MHz with an applied electric field of 0.5 V. Dielectric hysteresis loops were recorded on a Radiant Precision Premier II. Pyroelectric property was measured with an electrometer/high resistance meter (keithley 6517B). Piezoresponse force microscopy (PFM) measurements are conducted using an Atomic Force Microscope (AFM, Brucker multimode 8) with open loop controller, a conductive AFM tip (MESP-RC, Co/Cr coating, 35 nm tip radius) and contract mode.Results and discussion
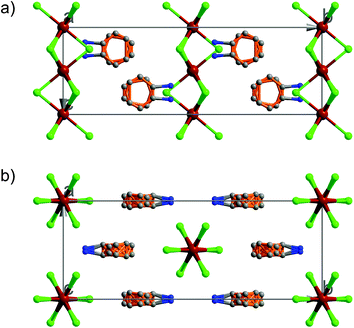
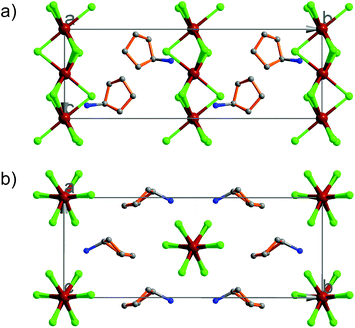
At 333 K, designated as the high temperature phase (HTP), 1 crystallizes in the centrosymmetric orthorhombic space group Cmcm.10 The crystal structure consists of infinite linear anionic chains [CdCl3]∞ and cyclopentylammonium (CPA) cations. Each Cd ion is located on a special position with 2/mc21 symmetry, and coordinated by six bridging Cl ions to give a quasi-regular octahedron geometry. The CPA cation is located on the special position with 2 mm symmetry, inconsistent with the intermolecular symmetry. To satisfy the crystal symmetry requirements, we have modeled the structure with 4-fold orientational disorders of the CPA cation. Each orientation just deviates a little from the crystallographic symmetry mirror. The ammonium heads of the CPA cations occupy the cavities between the octahedral anionic chains and form equal N–H⋯Cl hydrogen bonds with Cl ions from two neighboring chains.At 233 K, or the low temperature phase (LTP), the crystal adopts the polar space group Cc.10 The unit cell constants approximate those at 333 K, except for a deviation of the β angle (93.469°) from 90°. The structure is refined with a racemic twinning model with a Flack value of 0.36,11 indicative of the existence of two opposite ferroelectric domains in the LTP. The obvious structural change is the ordering of the CPA cations, giving rise to a single orientation. As shown in Fig. 1–3, the dipolar C–N bonds align along the c and a directions, leading to the long-range ordering with the electric polarization; while in the HTP, the dipolar moments cancel out because the arrangement for each pair of CPA ammonium cations related by inversion centers are opposite in direction. As regards the ferroelectric origin, we can make a conclusion that in the paraelectric phase the values for the macroscopic dipolar moment can cancel each other out to result in the formation of a centrosymmetric structure because of high thermal motion, while in the ferroelectric phase the macroscopic dipolar moment develops to result in the formation of a noncentrosymmetric structure because of the thermal motion slowing down. Since the dipolar moments in each domain are reversible if a strong enough external electric field is applied, 1 is a real order–disorder ferroelectric.
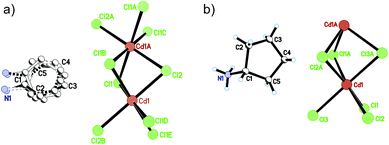 | ||
| Fig. 1 Asymmetric unit of 1 in the (a) HTP and (b) LTP. Atoms with suffix A–E are generated by symmetry operator. | ||
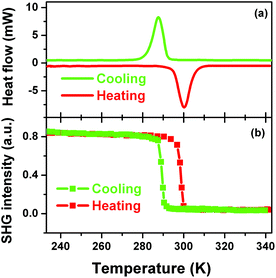
Definite evidence for the occurrence of the phase transition of 1 could be provided by investigating whether there are reversible peaks in DSC curve or not. Fig. 4a clearly shows that there is a heat anomaly observed at ca. 285 K upon cooling and ca. 300 K upon warming. The relatively large heat hysteresis of 15 K and sharp peaks indicate a reversible phase transition occurrence with a probable first-order feature, in good agreement with the variable-temperature crystal structure determination.12
SHG is a very sensitive probe to detect phase transitions between noncentrosymmetric and centrosymmetric structures, because it persists only in acentric materials, unless a magnetic dipole or an electric quadrupole contributes to it.13–15 Therefore, temperature dependence of second-order nonlinear optical susceptibility can be an indicator of the occurrence of a centrosymmetric-to-acentric phase transition and is useful for screening inorganic–organic hybrid ferroelectrics. According to the variable-temperature crystal structure determination of 1, it is seen that the SHG should be active in the LTP and non-active in the HTP. Fig. 4b clearly shows that above the Tc the SHG effect is zero, consistent with the centrosymmetric structure in the HTP; while below the Tc, the SHG is active with a nonzero value, consistent with the acentric structure in the LTP. Interestingly, step-like enhancement feature of the SHG effect suggests that this kind of phase transition may be of first order, in good agreement with that of DSC.
More important and interesting is the bistability of SHG effect, suggesting that 1 can find a potential application in the field of information data because of its well-defined bistability of the nonlinear optical property. The bistability window is from 285 to 300 K and is in the vicinity of room temperature, which is important for potential applications. The bistability observed in 1 is a result of a structural phase transition.
Scheme 1 shows the symmetry breaking occurrence during the HTP-to-LTP transformation, involving a decrease from 8 symmetry elements (E, 3C2, i, 3σ) to 2 (E, σ). The Aizu expression can be written as mmmFm.9 The fact that symmetry breaking involves the loss of six symmetry elements does not obey the feature of a second-order phase transition, which probably suggests that this phase transition should be of first order according to the Landau phenomenological theory. Curie symmetry principle analysis indicates that the space group (Cc, no. 9) in ferroelectric phase should be a subgroup of the space group (Cmcm, no. 63) in paraelectric phase because in Cmcm there are a set of maximal non-isomorphic subgroups (C2cm, Cm2m, Cmc21, C2221, C2/c, C2/m and C21/m) while in Cc there are a set of minimal non-isomorphic subgroups (C2/c, Cmc2, Ccc2, Ama21, Aea2, Fdd2, Iba2, Ima2, P3c1, P31c and R3c). So, C2/c is the parent group of Cc while Cmcm is the parent group of C2/c, Consequently, Cc is the minimal subgroup of Cmcm, meeting with Curie symmetry principle.
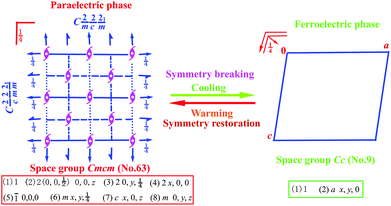 | ||
| Scheme 1 Symmetry breaking change diagram from point group D2h to Cs with a loss of six symmetric elements. | ||
We have performed PFM measurements on crystal samples of 1 in order to investigate ferroelectric behaviors. This method was recently shown to be a very sensitive technique for piezo- and ferroelectric measurements on ferroelectric crystalline materials. Also, it has been used for the detection of biopiezo- and ferroelectricity in peptide nanotubes and amino acid glycine where both domain images and polarization switching behavior could be observed on the scale of a few nanometers.16
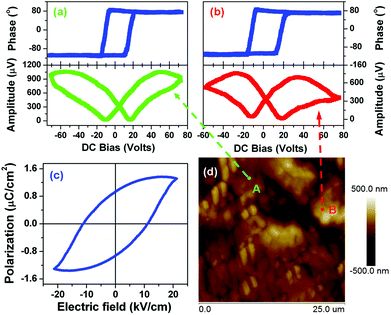
The ferroelectricity loop measurements on a macroscopic scale crystalline 1 are depicted in Fig. 5c. There is a hint of polarization reversal of ferroelectric nature. However, maybe we failed to grow large single crystals to guarantee the measurement exactly along the polar axis. Fortunately, the local polarization switching measurements by PFM clearly showed the ferroelectric nature of 1. As we know, the bad hysteresis loop shape is probably caused by leakage current. Usually, electric displacement or polarization (P) vs. applied electric field (E) measurements using an automated Sawyer–Tower circuit shows a ferroelectric nature though the contribution of leakage current is significant. Leakage current is a common phenomenon in molecular ferroelectrics because of their very small dielectric constants. Real ferroelectric capacitors show a leakage current that is superimposed on the displacement current, resulting in the bad shape of the hysteresis loop.
In spectroscopic PFM measurements, voltage pulses (Vdc, dc = direct current) of variable height (up to 100 V) were applied at two different locations on the 1 crystalline surface, approximately along the c-axis indicated on the PFM response images by arrows (Fig. 5d). The amplitude of the piezoresponse, which is proportional to converse d33 (1 has a direct piezoelectric coefficient of ∼7 pC N−1), and phase, whose sign indicates the polarization direction, were measured immediately after the application of each poling pulse. The dependencies of both d33 and phase with respect to Vdc show a strong hysteretic dependence (Fig. 5a and 5b), typical for polarization switching in ferroelectrics with a typical hysteresis loop and butterfly curve. These results are in good agreement with those found in typical molecular ferroelectrics triglycine sulfate (TGS), potassium sodium tartrate tetrahydrate and diisopropylamine bromide, in which the amplitude and phase as a function of Vdc all display a typical hysteresis loop and butterfly curve. It should be noted that typical butterfly-like shape amplitude is indicative of ferroelectric switching and is consistent with macroscopic measurements such as a typical ferroelectric hysteresis loop of P–E and dielectric nonlinear characteristic in which the diagram of capacitance (or dielectric constant) and bias voltage also displays butterfly-like shape.17,18
Usually, physical properties show sharp changes or anomalies near the phase transition point and the change of magnitude correlates to the characteristics of the phase transitions, e.g. common phase transition, ferroelastic or ferroelectric ones. Fig. S3† preliminarily shows that the phase transition of 1 is ferroelectric because, generally, the dielectric constant changes with an approximately double increase from a low to high temperature process for a powdered sample.
The dielectric constant (ε = ε′ − iε′′ where ε′ is the real part and ε′′ the imaginary part) as a function of temperature along the polar axis measurement of 1 further displays that the permittivity change reaches a large value (over 75 at 1 MHz) with an increase of one order of magnitude, probably suggesting that the phase transition should be ferroelectric. The ε′ in the range of low frequency above the Tc should obey the Curie–Weiss law, i.e. ε = ε0 + C/(T − T0), where T0 is the Curie temperature and is smaller than Tc for a first-order phase transition, ε0 is the vacuum permittivity, and C is the Curie–Weiss constant. Another feature of the temperature-dependent dielectric constant of 1 is that the frequency-dependent behavior is not obvious, probably suggesting that the interaction between the chains and cations is not significantly influenced by the electric field (Fig. 6).
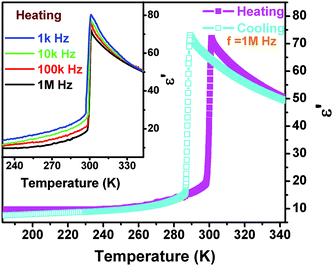 | ||
| Fig. 6 Real part of the complex dielectric constant of 1 as a function of temperature measured along the c-axis at several different frequencies in a cooling and heating cycle. | ||
Fig. S4† fitted by the reciprocal dielectric susceptibility (1/ε′) as a function of temperature shows that near the Tc the curve is almost linear and the Curie–Weiss constant (Cferro) is estimated at 3.2 × 10² K, much smaller than those (Cpara) found in typical molecular ferroelectrics such as TGS (3.2 × 10³ K), NaNO2 (5.0 × 10³ K), KH2PO4 (3.3 × 10³ K), and Rochelle salt (2.2 × 10³ K). On the other hand, above the Tc, the Cpara cannot be estimated because it does not obey the Curie–Weiss law. When measured along the non-polar b-axis, the dielectric constant shows nearly no anomaly (Fig. S3†). The entropy change ΔS equals 3.26 × 10⁻² J g−1 K−1. According to ΔS = R![[thin space (1/6-em)]](https://www.rsc.org/images/entities/char_2009.gif) ln
ln![[thin space (1/6-em)]](https://www.rsc.org/images/entities/char_2009.gif) N, the N value is estimated to be ca. 3.31, showing a strong order–disorder feature.
N, the N value is estimated to be ca. 3.31, showing a strong order–disorder feature.
For a stress-free crystal, an expansion of the Gibbs free energy (G) can be written as follows: G(η) = G0 + (1/2)Aη2 + (1/4)Bη4 + (1/6)Cη6 + ⋯. Near the Tc, the η can be determined by minimizing the truncated Gibbs potential, ∂G/∂η = Aη + Bη3. Under limited conditions, we can obtain Ps = (2ε0ΔSC)1/2, where C is usually Cpara. For 1 at 1 MHz, the Ps is estimated at 1.97 μC cm−2 when C takes the value of 3.2 × 10² K, fairly comparable to the experimental value. According to the relationship between the pyroelectric coefficient p and Ps, i.e. p = Ps × ε/C, p can be estimated at 0.39 μC K−1 cm−2, falling in the range of molecular ferroelectrics.
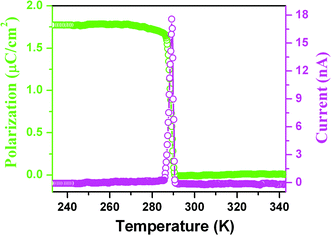
The pyroelectric measurement of 1 shows that there is a current anomaly at 285 K upon cooling, probably indicating that above the TcPs almost equals zero, while below the TcPs increases rapidly with step-like increases to reach 1.75 μC cm−2 as shown in Fig. 7, consistent with the semi-empirical calculation. Furthermore, normalization of the Ps and SHG effect as a function of temperature into one figure shows that they almost overlap (Fig. S5†), suggesting that the change with temperature obeys the Landau phenomenological theory and above the Tc the crystal structure is centrosymmetric, in good agreement with the above-mentioned variable-temperature crystal structural determination (Fig. S4†). On the other hand, at optical frequencies, the nonlinear optical susceptibility χ(2) can be made to equal 6ε0β′Ps by ignoring high-order terms. The equation clearly shows that the behavior of the temperature dependence of the second-order nonlinear coefficient is consistent with that of Ps since β′ is almost independent of the temperature.14
Conclusions
The present case has successfully demonstrated that the design of ABX3 perovskite molecular ferroelectrics will open up a new avenue for exploring new high Tc ferroelectrics as seen by their applications in solar-energy cells as high-efficiency sensitizers which may replace the organic ones.19Acknowledgements
This work is supported by the Natural Science Foundation of China (NSFC) (grants no. 21290172, 21101025 and 91222101). We also sincerely thank Prof. Guo-Liang Yuan for his kind help with PFM measurements.Notes and references
- A. R. Chakhmouradian and R. H. Mitchell, Can. Mineral., 1998, 36, 953 CAS.
- (a) V. V. Lemanov, A. V. Sotnikov, E. P. Smirnova, M. Weihnacht and R. Kunze, Solid State Commun., 1999, 110, 611 CrossRef CAS; (b) Properties and Applications of Perovskite-Type Oxides, ed. L. G. Tejuca and J. L. G. Fierro, Marcel Dekker, New York, 1993 Search PubMed; (c) M. A. Peña and J. L. G. Fierro, Chem. Rev, 2001, 101, 1981 Search PubMed.
- H. D. Megaw, Nature, 1945, 155, 484 CAS.
- (a) P. Jain, V. Ramachandran, R. J. Clark, H. D. Zhou, B. H. Toby, N. S. Dalal, H. W. Kroto and A. K. Cheetham, J. Am. Chem. Soc., 2009, 131, 13625 CrossRef CAS PubMed; (b) P. Jain, N. S. Dalal, B. H. Toby, H. W. Kroto and A. K. Cheetham, J. Am. Chem. Soc., 2008, 130, 10450 CrossRef CAS PubMed.
- (a) G.-C. Xu, X.-M. Ma, L. Zhang, Z.-M. Wang and S. Gao, J. Am. Chem. Soc., 2010, 132, 9588 CrossRef CAS PubMed; (b) G.-C. Xu, W. Zhang, X.-M. Ma, Y.-H. Chen, L. Zhang, H.-L. Cai, Z.-M. Wang, R.-G. Xiong and S. Gao, J. Am. Chem. Soc., 2011, 133, 14948 CrossRef CAS PubMed.
- (a) F. Jona and G. Shirane, Ferroelectric Crystals, Pergamon Press, New York, 1962 Search PubMed; (b) T. Mitsui, I. Tatsuzaki and E. Nakamura, An Introduction to the Physics of Ferroelectrics, Gordon and Breach Science Publishers, New York, 1976 Search PubMed; (c) M. E. Lines and A. M. Glass, Principles and Application of Ferroelectrics and Related Materials, Oxford University Press, Oxford, 2001 Search PubMed.
- (a) K. Gesi, J. Phys. Soc. Jpn., 1990, 59, 432 CrossRef CAS; (b) T. Asahi, K. Hasebe and K. Gesi, Acta Crystallogr., Sect. C: Cryst. Struct. Commun., 1991, 47, 1208 CrossRef.
- I. Swainson, L. Chi, J.-H. Her, L. Cranswick, P. Stephen, B. Winkler, D. J. Wilson and V. Milman, Acta Crystallogr., Sect. B: Struct. Sci., 2010, 66, 422 CAS.
- (a) W. Zhang and R.-G. Xiong, Chem. Rev., 2012, 112, 1163 CrossRef CAS PubMed; (b) T. Hang, W. Zhang, H.-Y. Ye and R.-G. Xiong, Chem. Soc. Rev., 2011, 40, 3577 RSC.
- Crystal data for 1 at 333 K: C5H12CdCl3N, Mr = 304.91, orthorhombic Cmcm, a = 7.537(6) Å, b = 19.877(16) Å, c = 6.662(5) Å, V = 998.1(13) Å3, Z = 4, ρcalcd = 2.029 g cm−1, R1 (I > 2σ(I)) = 0.0242, wR2 (all data) = 0.0594, μ = 2.925 mm−1, S = 1.116. 1 at 233 K: monoclinic Cc, a = 7.533(10) Å, b = 19.40(2) Å, c = 6.753(9) Å, β = 93.469°, V = 985(2) Å3, Z = 4, ρcalcd = 2.056 g cm−1, R1 (I > 2σ(I)) = 0.0294, wR2 (all data) = 0.0294, μ = 2.964 mm−1, S = 1.128.
- H. D. Flack, Acta Crystallogr., Sect. A: Fundam. Crystallogr., 1983, 39, 876 CrossRef.
- D.-W. Fu, W. Zhang, H.-L. Cai, Y. Zhang, J.-Z. Ge, R.-G. Xiong and S. D. Huang, J. Am. Chem. Soc., 2011, 133, 12780 CrossRef CAS PubMed.
- D.-W. Fu, H.-L. Cai, S.-H. Li, Q. Ye, L. Zhou, W. Zhang, Y. Zhang, F. Deng and R.-G. Xiong, Phys. Rev. Lett., 2013, 110, 257601 CrossRef PubMed.
- (a) H.-L. Cai, D.-W. Fu, Y. Zhang, W. Zhang and R.-G. Xiong, Phys. Rev. Lett., 2012, 109, 169601 CrossRef PubMed; (b) Z.-H. Sun, J.-H. Luo, S.-Q. Zhang, C.-M. Ji, L. Zhou, S.-H. Li, F. Deng and M.-C. Hong, Adv. Mater., 2013, 25, 4159 CrossRef CAS PubMed.
- H.-L. Cai, W. Zhang, J.-Z. Ge, Y. Zhang, K. Awaga, T. Nakamura and R.-G. Xiong, Phys. Rev. Lett., 2011, 107, 147601 CrossRef PubMed.
- Y. Liu, Y. Zhang, M. Chow, Q. Chen and Y. Li, Phys. Rev. Lett., 2013, 108, 078103 CrossRef.
- D.-W. Fu, W. Zhang, H.-L. Cai, J.-Z. Ge, Y. Zhang and R.-G. Xiong, Adv. Mater., 2011, 23, 5658 CrossRef CAS PubMed.
- D.-W. Fu, H.-L. Cai, Y. M. Liu, Q. Ye, W. Zhang, Y. Zhang, X.-Y. Chen, G. Giovannetti, M. Capone, J. Y. Li and R.-G. Xiong, Science, 2013, 339, 425 CrossRef CAS PubMed.
- (a) S. D. Stranks, G. E. Eperon, G. Grancini, C. Menelaou, M. J. P. Alcocer, T. Leijtens, L. M. Herz, A. Petrozza and H. J. Snaith, Science, 2013, 342, 341 CrossRef CAS PubMed; (b) G. C. Xing, N. Mathews, S. Y. Sun, S. S. Lim, Y. M. Lam, M. Grätzel, S. Mhaisalkar and T. C. Sum, Science, 2013, 342, 344 CrossRef CAS PubMed; (c) J. Burschka, N. Pellet, S.-J. Moon, R. Humphry-Baker, P. Gao, M. K. Nazeeruddin and M. Grätzel, Nature, 2013, 499, 316 CrossRef CAS PubMed.
Footnote |
| † Electronic supplementary information (ESI) available: PXRD and IR patterns of the polycrystalline powder samples, the temperature-dependent dielectric constants measured along the b- and c-axis as well as powdered mode, the reciprocal dielectric susceptibility as a function of temperature, the normalization of the temperature-dependent Ps and SHG effect. CCDC 963685 and 963686. For ESI and crystallographic data in CIF or other electronic format see DOI: 10.1039/c3qi00058c |
| This journal is © the Partner Organisations 2014 |

