 Open Access Article
Turing patterns on rotating spiral growing domains†
Leonardo
Silva-Dias
ab,
Irving R.
Epstein
 *a and
Milos
Dolnik
 a
a
aDepartment of Chemistry, MS 015, Brandeis University, Waltham, MA 02454, USA. E-mail: epstein@brandeis.edu
bDepartment of Chemistry, Federal University of São Carlos, São Carlos, São Paulo 13.565-905, Brazil
First published on 15th July 2024
Abstract
We investigate the emergence of Turing patterns in a system growing as a rotating spiral in two dimensions, utilizing the photosensitivity of the chlorine dioxide–iodine–malonic acid (CDIMA) reaction to control the growth process. We observe the formation of single and multiple (double and triple) stationary spiral patterns as well as transitional patterns. From numerical simulations of the Lengyel–Epstein model with an additional term to account for the effects of illumination on the reaction, we analyze the relationship between the final morphologies and the radial and angular growth velocities, identify conditions conducive to the formation of transitional structures, examine the importance of the size of the initial nucleation site in determining the spiral's multiplicity, and evaluate the stability and robustness of these Turing patterns. Our results indicate how inclusion of rotational degrees of freedom in the growth process may lead to the formation of a diverse new class of patterns in chemical and biological systems.
1 Introduction
Since the publication of Alan Turing's article, “The Chemical Basis of Morphogenesis”, in 1952, reaction-diffusion (RD) systems have been extensively used to study the generation of self-organized patterns.1,2 In that paper, Turing showed that RD systems could reach a spatially uniform steady state that is simultaneously stable and unstable to homogeneous and nonhomogeneous perturbations, respectively. Such a state may be accessible when (1) the reaction is composed of an activator and an inhibitor, and (2) the inhibitor diffuses significantly faster than the activator, satisfying the so-called short-range activation, long-range inhibition (SRALRI) condition.3–5 Under these conditions, the system may support the spontaneous formation of temporally stationary, spatially periodic patterns, known as Turing patterns.4 There are a number of examples in nature in which patterning is thought to arise from a Turing-type mechanism;6,7 however, it is often difficult to apply Turing's model directly for making predictions in such systems due to the complexity of biological processes.8,9 To overcome this issue, chemical systems with well-known mechanisms are commonly utilized as models for understanding pattern formation processes that occur in nature.3The chlorine dioxide–iodine–malonic acid (CDIMA) reaction is widely employed to construct RD systems for studying Turing-related phenomena.10 The kernel of this reaction is the autocatalytic production/self-inhibitory behavior of iodide ions, which act as the activator, and the removal of these ions by chlorite ions, which act as the inhibitor.11 In aqueous solution, the activator and inhibitor species have similar diffusion coefficients; however, the presence of polyvinyl alcohol (PVA) induces the formation of a triiodide complex, significantly reducing the diffusion of iodide ions.3–5,12 In this experimental setting, the CDIMA reaction fulfills the SRALRI requirement for the emergence of Turing patterns. A useful property of this reaction is its photosensitivity, which can be used to control and modulate the behavior of Turing patterns under external perturbation.6,13–21
Recently, the photosensitivity of the CDIMA reaction has been utilized to study Turing pattern formation on growing domains.6,19,21 Growth is inherent to almost every living organism, and it can directly affect pattern formation. Both experimental and theoretical studies establish that growth plays a central role in the final morphology of the patterns formed via the Turing mechanism.6,21–27 Moreover, it may also alter the stability conditions required for the formation of Turing patterns.28–31 From an experimental point of view, growth effects can be studied using visible illumination of the CDIMA reaction-diffusion system to define the area where patterns may form. In this setting, the size and shape of the growing pattern-forming domain can be controlled by light.6,21 Studies in a one-dimensional axial growing system showed a strong dependence between the growth rate and the resulting pattern. More specifically, faster speeds generate parallel (striped) patterns, and slower speeds produce perpendicular patterns.21 This technique was extended to radially expanding two-dimensional (2D) disks, and three different Turing pattern growth modes were identified: outer ring addition, perpendicular pattern growth, and inner ring growth.6
Noting the significant impact of growth on pattern formation reported in other works, our main goal here is to extend previous studies and introduce an additional degree of freedom, i.e., angular velocity, to experimentally and theoretically investigate the effects of rotating spiral growth on the emergence of Turing patterns in the CDIMA reaction. To accomplish this task, we present details about the material, experimental procedures, and numerical simulations in Section 2. In Section 3, we demonstrate a broad class of stationary spiral patterns formed as a result of growth modes and provide explanations for the final morphologies based on the choice of angular and radial growth velocities. Using numerical simulations, we also present parametric diagrams to analyze the stability and robustness of these patterns across different pattern regions. We identify unstable regions and discuss the effects of the initial size of the nucleation site on the resulting morphologies. Finally, in Section 4, we conclude and suggest that examining the physical–chemical mechanisms for the formation of these spirals may provide new insights into how patterns form in natural systems, such as patterns found on snail shells.
2 Methods
2.1 Experimental procedure
A schematic representation of the experimental setup and the reactor is presented in Fig. 1A and B. The experiments were performed using the CDIMA reaction in a thermostatted, continuously fed unstirred reactor (CFUR) at 4.0 ± 0.5 °C. The CFUR was composed of a 2% agarose gel (Sigma-Aldrich) with a thickness of 0.45 mm and a diameter of 25 mm. The top side of the CFUR was placed against an impermeable optical glass window, where the illumination was applied, and the bottom was in contact with a continuously stirred tank reactor (CSTR), which fed the CFUR gel with well-mixed reagents. The CSTR had a volume of 2.0 mL, was stirred by three small round magnetic stir bars at 600 rpm, and was continuously fed with three solutions using peristaltic pumps (Gilson). It was separated from the CFUR by a cellulose membrane (Whatman) of pore size 0.45 μm and an Anopore membrane (Whatman) of pore size 0.2 μm, both impregnated with 2% agarose gel.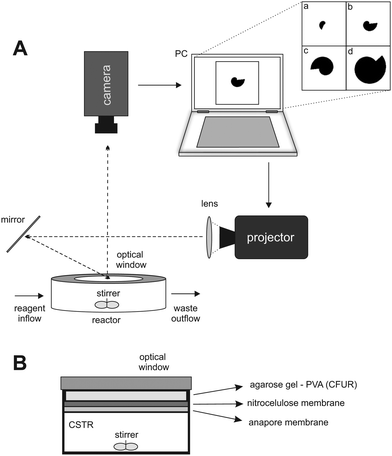 | ||
| Fig. 1 (A) Schematic representation of the experimental setup. (B) Lateral view of the CSTR/CFUR reactor. | ||
The experiments were initiated by allowing Turing patterns to grow over the entire domain under ambient light (0.4 mW cm−2), which took approximately three hours. Then a mask, with a growing dark area (0.4 mW cm−2) on a bright light background (10.1 mW cm−2), was projected from a DLP projector (Dell 1510X) onto the CFUR, see Fig. 1A. Under such conditions, the patterns were suppressed in the illuminated area of the CFUR but allowed to form in the dark area. Images of the patterns were collected every minute throughout the experiment by a Monochrome Imaging Camera (PixeLINK, PL-B953U). The collected images were processed with Corel Photo-Paint 5 to enhance and improve contrast.
2.2 Materials
Solutions of (i) iodine, I2, (Aldrich) and acetic acid (Fisher) 10% by volume, (ii) ClO2, prepared as described in ref. 32 and (iii) malonic acid (Aldrich) and poly-(vinyl alcohol) (PVA, Aldrich) with average molecular weight 9![[thin space (1/6-em)]](https://www.rsc.org/images/entities/char_2009.gif) 000–10
000–10![[thin space (1/6-em)]](https://www.rsc.org/images/entities/char_2009.gif) 000 and 80% hydrolyzed were fed into the CSTR. Each of the input solutions contained 10 mM H2SO4. The initial concentrations of the reagents after well-mixing in the feeding chamber were the same in all experiments: [I2] = 0.4 mM, [MA] = 1.5 mM, [ClO2] = 0.084 mM, and [PVA] = 10 g L−1.
000 and 80% hydrolyzed were fed into the CSTR. Each of the input solutions contained 10 mM H2SO4. The initial concentrations of the reagents after well-mixing in the feeding chamber were the same in all experiments: [I2] = 0.4 mM, [MA] = 1.5 mM, [ClO2] = 0.084 mM, and [PVA] = 10 g L−1.
2.3 Numerical simulations
The spatiotemporal dynamics of the CDIMA reaction can be described by the Lengyel–Epstein model, which is given by the following set of partial differential equations:33 | (1) |
 | (2) |
In eqn (1) and (2), u and v are the dimensionless concentrations of the activator, I−, and the inhibitor, ClO2−, respectively; a, b, and σ are dimensionless parameters related to the initial concentrations (chlorine dioxide, iodine, and malonic acid) and rate constants, w describes the effect of illumination, and d = Dv/Du is the ratio between the diffusion coefficients of the key species.3,6
As mentioned earlier, the illumination controls the growth mode. Therefore, for the rotating spiral growing domain, the term w is designed as a stepwise, time-dependent function of the x and y coordinates:
| r(t) = r0 + ṙt | (3) |
θ(t) = θ0 + ![[small theta, Greek, dot above]](https://www.rsc.org/images/entities/i_char_e0a7.gif) t t | (4) |
With,  , R = (x, y),
  , r0 = (α, 0) with
  , and θ0 = 0. For non-illuminated areas w0 = 0, and for illuminated areas wmax = 1.5.
The Lengyel–Epstein model was numerically solved using explicit finite differences for the spatial terms, the fourth-order Runge–Kutta method for the kinetic terms, and zero-flux boundary conditions for the static boundaries of the system. The time step employed in the simulations was Δt = 1.0 × 10⁻³, and the spatial steps were Δx = Δy = 0.5. The parameters used were a = 12, b = 0.3, σ = 50, and d = 1.0. In all cases, the simulations were performed until the final radius (rF),  space units (su), where L is the length of the system in the x(y)-direction.
2.4 Rotating spiral growth rate and pattern wavelength
The experiments and numerical simulations were performed with several selected pairs (ṙ,![[small theta, Greek, dot above]](https://www.rsc.org/images/entities/i_char_e0a7.gif) ), resulting in a variety of different patterns. To analyze these patterns we introduce a new parameter “n” that represents the number of natural Turing pattern wavelengths the system radius grows after one 360° rotation:
), resulting in a variety of different patterns. To analyze these patterns we introduce a new parameter “n” that represents the number of natural Turing pattern wavelengths the system radius grows after one 360° rotation: | (5) |
 , and λ is the natural Turing pattern wavelength. We further assume r0 = (0,0). The time taken to complete a 360° rotation is from eqn (4)t = 360°/
![[small theta, Greek, dot above]](https://www.rsc.org/images/entities/i_char_e0a7.gif) . Using this time in eqn (3), we can verify that β = 360°|ṙ|/
. Using this time in eqn (3), we can verify that β = 360°|ṙ|/![[small theta, Greek, dot above]](https://www.rsc.org/images/entities/i_char_e0a7.gif) . From this last expression, we may explicitly write eqn (5) as:
. From this last expression, we may explicitly write eqn (5) as: | (6) |
The parameter n includes information about both radial and angular velocities, and we utilize it in the analysis of our results.
To obtain n in the experiments, we use the natural experimental Turing pattern wavelength, λE = 0.45 mm. In simulations, we use the natural theoretical Turing pattern wavelength λT = 7.25 su.
3 Results and discussion
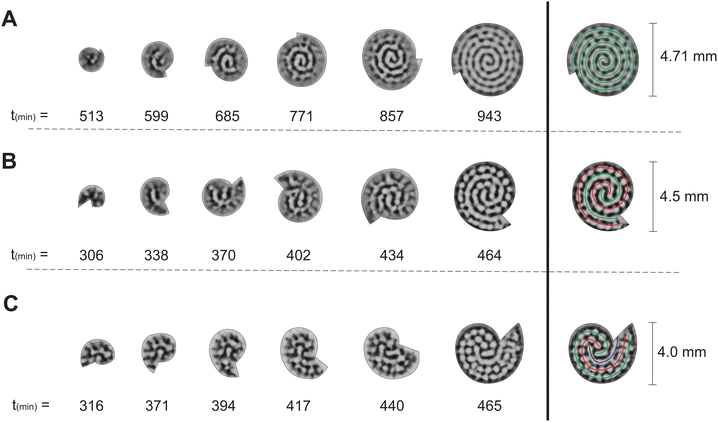
From the experiments with two-dimensional rotating spiral growing domains, we have obtained a set of Turing patterns in the shape of single, double, and triple spirals. The classification of these structures is based on the number of central tips they have. For example, for n = 0.88 (ṙE = 0.2 mm h−1,![[small theta, Greek, dot above]](https://www.rsc.org/images/entities/i_char_e0a7.gif) E = 3.0° min−1) we observe a single spiral shown in Fig. 2A, for n = 2.22 (ṙE = 0.5 mm h−1,
E = 3.0° min−1) we observe a single spiral shown in Fig. 2A, for n = 2.22 (ṙE = 0.5 mm h−1, ![[small theta, Greek, dot above]](https://www.rsc.org/images/entities/i_char_e0a7.gif) E = 3.0° min−1) we find a double spiral shown in Fig. 2B, and for n = 3.55 (ṙE = 0.4 mm h−1,
E = 3.0° min−1) we find a double spiral shown in Fig. 2B, and for n = 3.55 (ṙE = 0.4 mm h−1, ![[small theta, Greek, dot above]](https://www.rsc.org/images/entities/i_char_e0a7.gif) E = 1.5° min−1) a triple spiral, Fig. 2C. The time evolution plot in Fig. 2 enables us to identify the number of tips that emerge in the initial patterning process, facilitating the classification of the final morphologies. The spots present in Fig. 2B and C are formed as a consequence of experimental irregularities such as small shifts of the concentrations inside the reactor and possible inhomogeneities in the CFUR gel. Despite the appearance of spots, the spiral pattern orientation can be clearly seen as the system grows.
E = 1.5° min−1) a triple spiral, Fig. 2C. The time evolution plot in Fig. 2 enables us to identify the number of tips that emerge in the initial patterning process, facilitating the classification of the final morphologies. The spots present in Fig. 2B and C are formed as a consequence of experimental irregularities such as small shifts of the concentrations inside the reactor and possible inhomogeneities in the CFUR gel. Despite the appearance of spots, the spiral pattern orientation can be clearly seen as the system grows.
The numerical simulations support the results presented in Fig. 2. As we show in Fig. 3, the patterns obtained in the simulations are in good qualitative agreement with those observed experimentally. We note that the physical quantities, i.e., the radial and angular velocities, are theoretically defined in terms of space units (su) and time units (tu), and because of that, their magnitudes are different from those in the experiments. We compare the theoretical results with the experimental ones for conditions when the system grows by the same number of natural Turing pattern wavelengths in the radial direction after a complete 360° rotation, i.e. when n is equal in both approaches. Bearing that condition in mind, we observe the formation of a single spiral in Fig. 3A for n = 0.88 (ṙT = 5.37 × 10⁻² su/tu, ![[small theta, Greek, dot above]](https://www.rsc.org/images/entities/i_char_e0a7.gif) T = 3.0°/tu), a double spiral in Fig. 3B for n = 2.22 (ṙT = 0.134 su/tu,
T = 3.0°/tu), a double spiral in Fig. 3B for n = 2.22 (ṙT = 0.134 su/tu, ![[small theta, Greek, dot above]](https://www.rsc.org/images/entities/i_char_e0a7.gif) T = 3.0°/tu), and a triple spiral in Fig. 3C for n = 3.55 (ṙT = 0.107 su/tu,
T = 3.0°/tu), and a triple spiral in Fig. 3C for n = 3.55 (ṙT = 0.107 su/tu, ![[small theta, Greek, dot above]](https://www.rsc.org/images/entities/i_char_e0a7.gif) T = 1.5°/tu).
T = 1.5°/tu).
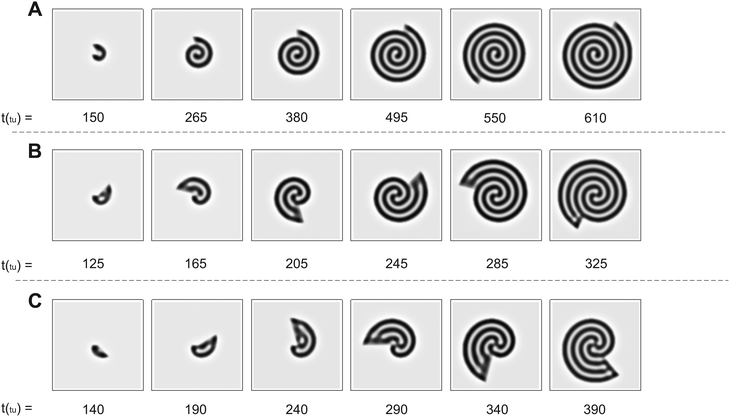 | ||
Fig. 3 Time evolution of Turing patterns on a rotating spiral growing domain for different (ṙT, ![[small theta, Greek, dot above]](https://www.rsc.org/images/entities/i_char_e0a7.gif) T, nT) growth velocities obtained through numerical simulation of the Lengyel–Epstein model on a 80 su × 80 su domain. (A) Single spiral obtained for n = 0.88 (ṙT = 5.37 × 10⁻² su/tu, T, nT) growth velocities obtained through numerical simulation of the Lengyel–Epstein model on a 80 su × 80 su domain. (A) Single spiral obtained for n = 0.88 (ṙT = 5.37 × 10⁻² su/tu, ![[small theta, Greek, dot above]](https://www.rsc.org/images/entities/i_char_e0a7.gif) T = 3.0°/tu), (B) double spiral obtained for n = 2.22 (ṙT = 0.134 su/tu, T = 3.0°/tu), (B) double spiral obtained for n = 2.22 (ṙT = 0.134 su/tu, ![[small theta, Greek, dot above]](https://www.rsc.org/images/entities/i_char_e0a7.gif) T = 3.0°/tu), and (C) triple spiral obtained for n = 3.55 (ṙT = 0.107 su/tu, T = 3.0°/tu), and (C) triple spiral obtained for n = 3.55 (ṙT = 0.107 su/tu, ![[small theta, Greek, dot above]](https://www.rsc.org/images/entities/i_char_e0a7.gif) T = 1.5°/tu). Equivalent conditions to the results shown in Fig. 2. T = 1.5°/tu). Equivalent conditions to the results shown in Fig. 2. | ||
The trend of shapes obtained theoretically and experimentally suggests that the final pattern morphologies are directly related to the choice of the angular and radial velocities, in other words, to the parameter n. As we presented previously, for the single spiral, n = 0.88. In this case, the growth allows a pattern with almost one additional wavelength to form after a full 360° rotation, and the development of a single spiral is favored (Fig. 2A and 3A). The same explanation can be extended to the two other cases. When n = 2.22 a double spiral is favored (Fig. 2B and 3B), and for n = 3.55 we typically find a triple spiral (Fig. 2C and 3C). In fact, we can see the addition of one, two, and three wavelengths at t = 685 min in Fig. 2A and at t = 265 tu in Fig. 3A, t = 370 min in Fig. 2B and at t = 245 tu in Fig. 3B, and t = 417 min in Fig. 2C and at t = 390 tu in Fig. 3C, respectively. Therefore, the number of Turing pattern wavelengths the system grows after a 360° rotation, n, specifies the most probable multiplicity of the final spiral. It is reasonable to expect that a spiral with multiplicity equal to m, where m = nint(n), the nearest integer number of n, is strongly favored when n is close to an integer. We can extend this reasoning to situations in which n is a half-integer and expect to observe irregular patterns, i.e., with a multiplicity that is not well-defined. Note that even though the results shown in Fig. 3C for n = 3.55 seem to contradict our hypothesis, they do not invalidate it. We will show that the final morphologies depicted in Fig. 2 and 3 are intimately linked to the choice of other control parameters such as the initial size of the nucleation site and the final size of the spiral domain. We may test these hypotheses with the aid of numerical simulations.
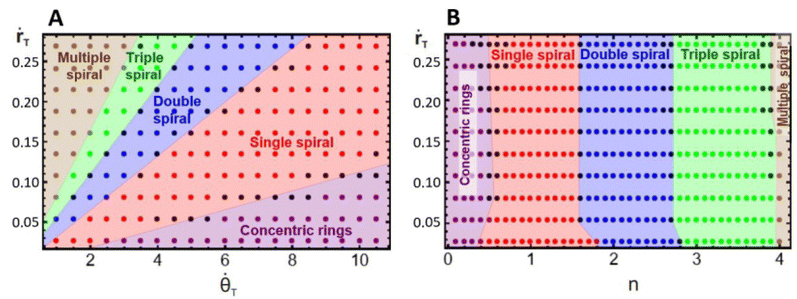
To have a better understanding of the effects of growth on the pattern morphology and to test the above hypotheses, we carried out simulations to construct parametric diagrams of ṙTvs. ![[small theta, Greek, dot above]](https://www.rsc.org/images/entities/i_char_e0a7.gif) T and ṙTvs. n, which are presented in Fig. 4A and B. These plots show regions of concentric rings, and single, double, triple, and multiple, i.e., quadruple and greater, spirals, as well as transition zones between regions with patterns of undefined structure, i.e., structures that can be understood as combinations of spirals with different multiplicities.
T and ṙTvs. n, which are presented in Fig. 4A and B. These plots show regions of concentric rings, and single, double, triple, and multiple, i.e., quadruple and greater, spirals, as well as transition zones between regions with patterns of undefined structure, i.e., structures that can be understood as combinations of spirals with different multiplicities.
We may notice in Fig. 4A that, at very high angular velocities, the formation of concentric rings is favored. The appearance of these patterns for such growth conditions is in accordance with the findings of Konow et al., who reported the emergence of concentric rings for fast growth rates, more specifically ṙE > 0.4 mm h−1 and b = 0.3, in radially growing domains.6 This is expected because the rotating spiral growth process reduces to a two-dimensional radial growth process for large angular velocities, and it must therefore generate the same patterns obtained by Konow et al.
Fig. 4B displays a single spiral region centered around nT = 1, in agreement with our previous assumption, whereas, the regions of double and triple spirals are shifted to the right and not centered around n = 2 and 3, respectively. This unexpected shift in the location of these regions is due to the initial nucleation site used in the simulations and experiments. The construction of the parametric diagrams employed an initial nucleation site with a radius equal to 1 su, which represents the same initial conditions as in the experiments. This condition forces the patterns to form from a single tip, and as the system grows, it reorganizes in the available area, favoring the emergence of spirals with smaller multiplicities, even when n is higher. Fig. 2C and 3C are examples of this behavior. In the ESI† we show simulations with the radius of the nucleation site equal to λT, where the regions of double and triple spirals are now centered around nT = 2 and 3.
Fig. 4A and B demonstrate that the regions in the parametric diagrams for spiral formation are relatively large. This implies that patterns formed in experiments with conditions selected in the middle of single, double, or triple spiral regions should be robust to minor fluctuations in the experimental conditions as the reaction evolves in time.
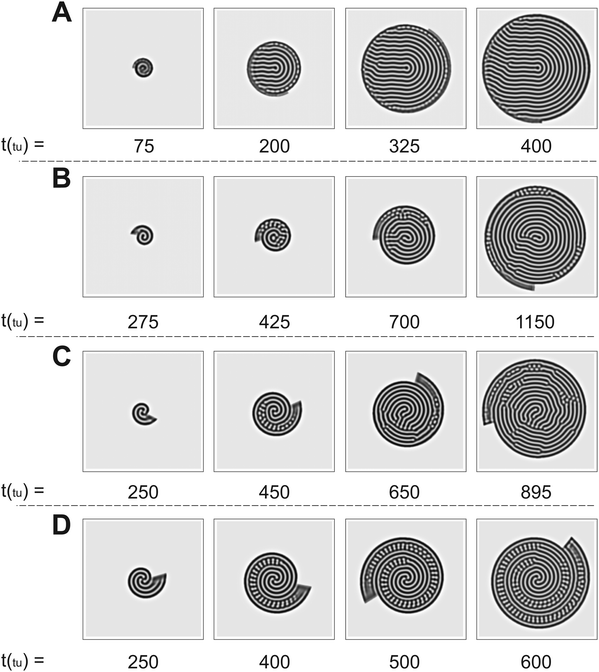
Fig. 4A and B also display transition pattern zones. These are narrow areas located at the boundaries between two spiral regions. The patterns formed in these locations are distorted spiral structures, as shown in Fig. 5. The transitional morphologies are the result of the interaction of two modes, e.g., Fig. 5A is a combination of concentric rings with single spirals, Fig. 5B mixes single and double spirals, Fig. 5C is an interaction between double and triple spirals, and Fig. 5D combines triple and multiple spirals. This outcome supports our initial suggestion that patterns with undefined multiplicity may form when n is close to a half-integer.
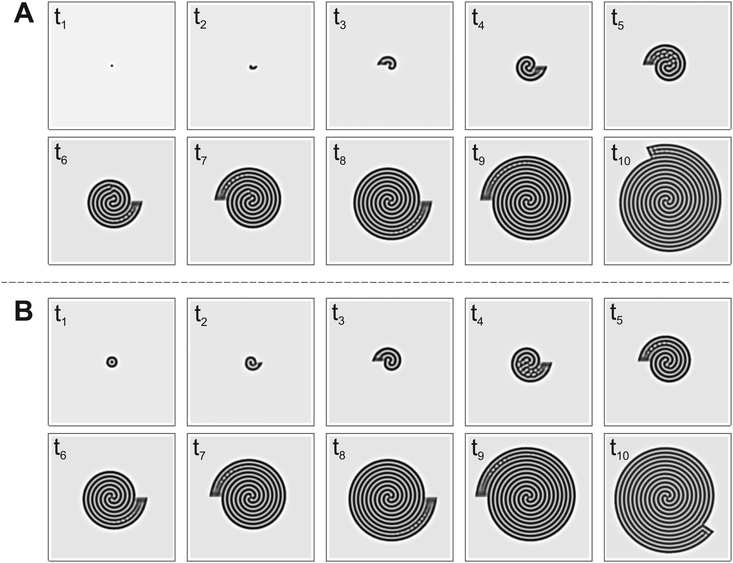
To check the stability and robustness of transitional structures, we performed simulations with parameters selected in the transition zones, varying the size of the nucleation site. Fig. 6A and B show the time evolution of spirals for the same parameters but with different initial conditions. The final patterns have the same spiral multiplicity, i.e., a triple spiral; however, their spatiotemporal dynamics are different. In Fig. 6A the initial system has a small nucleation site, and this induces the formation of a double spiral in the early stages of the pattern formation process. As the system grows, the pattern rearranges itself, changing its spiral multiplicity from two to three. Fig. 6B shows, for a larger nucleation site, the direct formation of a triple spiral in the early stages of the pattern growth. If the growth is terminated at time t6 in Fig. 6A, and the pattern continues to evolve in time in the fixed size system, the double spiral remains stable, maintaining its spiral multiplicity. Thus the initial size of the nucleation site and the size of the domain available to the pattern formation play key roles in determining the final pattern morphology under transitional conditions. These numerical results suggest that it may be challenging to observe specific transitional structures experimentally. In fact, the presence of noise and small irregularities in the experimental conditions may lead the pattern formation process in different directions.
4 Conclusions
In this work, we have experimentally and theoretically investigated the effects of a continuously rotating spiral growing domain on the formation of Turing patterns from the CDIMA reaction. We have demonstrated that introducing an additional degree of freedom, i.e., the angular velocity, in the growth mode enables morphological variability. Specifically, we have obtained a novel class of stationary spiral patterns with different multiplicities depending on the choices of radial and angular velocities. In essence, the formation of single, double, and triple spirals is favored when the pair of radial and angular velocities allows the system to fit well one, two, and three natural wavelengths of Turing patterns, respectively, after a complete rotation, with the radius of the initial nucleation site close to the Turing pattern wavelength. Interestingly, this propensity strongly hinges on the initial size of the nucleation site. When the radius of the initial nucleation sites is smaller than the Turing pattern wavelength, the formation of spirals with lower multiplicities than expected is favored. Futhermore, we have reported parametric space diagrams obtained from numerical simulations of the Lengyel–Epstein model. These diagrams map regions of different multiplicities as a function of the growth parameters. From them, we have identified narrow regions of transitional structures, i.e., patterns that result from the combination of two different multiplicities, and verified that the nucleation site and the domain available for pattern formation significantly influence the final pattern morphology.The spiral growth mode examined in this study occurs in a number of plants and animals as well as in DNA toroidal condensates.34–37 Analyzing the patterning process in biologically relevant scenarios using inorganic chemical reactions may reveal crucial parameters and physical–chemical conditions involved in patterning in living systems, such as snail shells. It is noteworthy that the boundaries created by illumination are unique because (1) illuminated areas act as local sources and sinks of the activator and inhibitor; (2) these boundaries are not physical barriers, allowing chemicals to diffuse between dark and light areas. To increase biological relevance, we can theoretically evaluate the development of Turing patterns in the CDIMA reaction under different boundary conditions, e.g., zero flux boundary conditions, with the presence of internal boundaries, and on 3D spiral growing surfaces. Such studies would offer deeper insights into how patterns emerge under the chosen conditions. We intend to explore these issues in future research.
Data availability
All data files are available from leonardosilvadias@estudante.ufscar.br upon reasonable request.Conflicts of interest
There are no conflicts to declare.Acknowledgements
We thank the National Science Foundation (NSF CHE-1856484) for financial support. L. Silva-Dias thanks the Brazilian funding agencies Fundação de Amparo à Pesquisa do Estado de São Paulo (FAPESP; grants 2022/00257-0 and 2019/23205-3) and Coordenção de Aperfeiçoamento de Pessoal de Nível Superior (CAPES), finance code 001. We extend our best wishes to George Whitesides on the occasion of his 85th birthday.Notes and references
- A. M. Turing, Phylos. Trans. R. Soc. London, 1952, 237, 37–72 Search PubMed.
- A. Gierer and H. Meinhardt, Kybernetik, 1972, 12, 30–39 CAS.
- I. R. Epstein and J. A. Pojman, An introduction to nonlinear chemical dynamics: oscillations, waves, patterns, and chaos, Oxford University Press, 1998 Search PubMed.
- I. R. Epstein and K. Showalter, J. Phys. Chem., 1996, 100, 13132–13147 CrossRef CAS.
- L. Silva-Dias, Qumica Nova, 2021, 44, 646–654 Search PubMed.
- C. Konow, N. H. Somberg, J. Chavez, I. R. Epstein and M. Dolnik, Phys. Chem. Chem. Phys., 2019, 21, 6718–6724 RSC.
- L. Silva-Dias and A. Lopez-Castillo, Phys. Chem. Chem. Phys., 2020, 22, 7507–7515 RSC.
- N. Tompkins, N. Li, C. Girabawe, M. Heymann, G. B. Ermentrout, I. R. Epstein and S. Fraden, Proc. Natl. Acad. Sci. U. S. A., 2014, 111, 4397–4402 CrossRef CAS PubMed.
- L. Silva-Dias and A. Lopez-Castillo, J. Phys. Chem. Lett., 2022, 13, 296–301 CrossRef CAS PubMed.
- V. Castets, E. Dulos, J. Boissonade and P. De Kepper, Phys. Rev. Lett., 1990, 64, 2953 CrossRef CAS PubMed.
- I. Lengyel, G. Rabai and I. R. Epstein, J. Am. Chem. Soc., 1990, 112, 9104–9110 CrossRef CAS.
- I. Lengyel and I. R. Epstein, Proc. Natl. Acad. Sci. U. S. A., 1992, 89, 3977–3979 CrossRef CAS PubMed.
- A. P. Muñuzuri, M. Dolnik, A. M. Zhabotinsky and I. R. Epstein, J. Am. Chem. Soc., 1999, 121, 8065–8069 CrossRef.
- M. Dolnik, I. Berenstein, A. M. Zhabotinsky and I. R. Epstein, Phys. Rev. Lett., 2001, 87, 238301 CrossRef CAS PubMed.
- M. Dolnik, T. Bánsági, S. Ansari, I. Valent and I. R. Epstein, Phys. Chem. Chem. Phys., 2011, 13, 12578–12583 RSC.
- A. K. Horváth, M. Dolnik, A. P. Munuzuri, A. M. Zhabotinsky and I. R. Epstein, Phys. Rev. Lett., 1999, 83, 2950 CrossRef.
- M. Dolnik, A. M. Zhabotinsky and I. R. Epstein, Phys. Rev. E: Stat., Nonlinear, Soft Matter Phys., 2001, 63, 026101 CrossRef CAS PubMed.
- I. Berenstein, L. Yang, M. Dolnik, A. M. Zhabotinsky and I. R. Epstein, Phys. Rev. Lett., 2003, 91, 058302 CrossRef PubMed.
- M. Kærn, R. Satnoianu, A. P. Muñuzuri and M. Menzinger, Phys. Chem. Chem. Phys., 2002, 4, 1315–1319 RSC.
- A. Preska Steinberg, I. R. Epstein and M. Dolnik, J. Phys. Chem. A, 2014, 118, 2393–2400 CrossRef CAS PubMed.
- D. G. Mguez, M. Dolnik, A. P. Munuzuri and L. Kramer, Phys. Rev. Lett., 2006, 96, 048304 CrossRef PubMed.
- S. Kondo and R. Asai, Nature, 1995, 376, 765–768 CrossRef CAS PubMed.
- M. Watanabe and S. Kondo, Trends Genet., 2015, 31, 88–96 CrossRef CAS PubMed.
- C. Nüsslein-Volhard and A. P. Singh, BioEssays, 2017, 39, 1600231 CrossRef PubMed.
- C. Varea, J. Aragón and R. Barrio, Phys. Rev. E: Stat. Phys., Plasmas, Fluids, Relat. Interdiscip. Top., 1997, 56, 1250 CrossRef CAS.
- D. M. Holloway and L. G. Harrison, Ann. Bot., 2008, 101, 361–374 CrossRef PubMed.
- M. Dolnik, C. Konow, N. H. Somberg and I. R. Epstein, Chaos: Interdiscip. J. Nonlinear Sci., 2022, 32, 073127 CrossRef PubMed.
- A. Madzvamuse, E. A. Gaffney and P. K. Maini, J. Math. Biol., 2010, 61, 133–164 CrossRef PubMed.
- V. Klika and E. A. Gaffney, Proc. R. Soc. A, 2017, 473, 20160744 CrossRef PubMed.
- R. A. Van Gorder, V. Klika and A. L. Krause, J. Math. Biol., 2021, 82, 1–61 CrossRef PubMed.
- G. Hetzer, A. Madzvamuse and W. Shen, Discrete Contin. Dyn. Syst., 2012, 32, 3975–4000 Search PubMed.
- Handbook of Preparative Inorganic Chemistry, ed. G. Braur and P. G. Stecher, Academic Press Inc., New York, NY, 2nd edn, 1965 Search PubMed.
- I. Lengyel and I. R. Epstein, Science, 1991, 251, 650–652 CrossRef CAS PubMed.
- N. V. Hud and I. D. Vilfan, Annu. Rev. Biophys. Biomol. Struct., 2005, 34, 295–318 CrossRef CAS PubMed.
- A. Leforestier and F. Livolant, Proc. Natl. Acad. Sci. U. S. A., 2009, 106, 9157–9162 CrossRef CAS PubMed.
- A. Cherstvy, J. Phys.: Condens. Matter, 2005, 17, 1363 CrossRef CAS.
- D. R. Smyth, Development, 2016, 143, 3272–3282 CrossRef CAS PubMed.
Footnote |
| † Electronic supplementary information (ESI) available. See DOI: https://doi.org/10.1039/d4cp01777c |
| This journal is © the Owner Societies 2024 |


