
 Open Access Article
 This Open Access Article is licensed under a Creative Commons Attribution-Non Commercial 3.0 Unported Licence
Divide and correlate: mapping electronic correlations in proteins via local cut-wise reconstruction
Mostafa Javaheri
Moghadam
*a,
Rebecca
Mulder
a and
Stijn
De Baerdemacker
 *ab
*ab
aUniversity of New Brunswick, Department of Chemistry, 30 Dineen Dr, Fredericton, Canada. E-mail: m.javaheri@unb.ca; stijn.debaerdemacker@unb.ca
bUniversity of New Brunswick, Department of Mathematics and Statistics, 30 Dineen Dr, Fredericton, Canada
First published on 20th January 2026
Abstract
We introduce a scalable method to quantify electronic correlations in insulin using mutual information (MI), characterizing interatomic and inter-residue interactions. A cut-wise strategy, based on the locality and decay of electronic correlations, combines localized density functional theory (DFT) calculations on 51 overlapping spherical cuts to reconstruct global MI matrices. The approach accurately reproduces key biochemical features and aligns with full-protein DFT results, enabling efficient quantum correlation analysis for large biomolecules. This framework supports future applications in protein–ligand modeling, pharmacophore design, and quantum-enhanced drug discovery.
Understanding electronic interactions in biomolecular systems is essential for explaining protein folding and enzymatic activity.1 These interactions determine structural stability and functional specificity, influencing numerous cellular processes.2,3 However, the quantum mechanical nature of electron correlation poses challenges for computational modeling, particularly for large systems like proteins.4
Classical force fields and semi-empirical methods offer scalable modeling solutions but often neglect critical quantum effects, limiting their accuracy in describing subtle intra- and intermolecular interactions.5 This limitation is especially relevant in drug design and protein modeling, where precise interaction profiles can determine the success of lead optimization.6–8Ab initio quantum chemistry methods, in contrast, provide high-accuracy, first-principles solutions, but their exponential scaling restricts applications to small molecules or fragments.9,10
Quantum information theory has emerged as a tool to quantify electronic correlations between orbitals and molecular fragments.11 It has been applied in molecular orbital theory and tensor network approaches like the density matrix renormalization group (DMRG), revealing entanglement patterns that govern reactivity and bonding.12–14 Building on this, atomic mutual information (AMI) quantifies shared electronic information between atoms without assuming specific chemical interactions, offering high-resolution insight into connectivity and interaction strength.15 A key observation in these previous studies is that mutual information is primarily local, opening up opportunities to quantify electron correlation in extensive systems within localized fragments, rather than necessitating ab initio computations at the full molecular level.
In this study, we apply AMI to insulin, a 51-residue peptide hormone critical for blood glucose regulation.17,18 Its size and structural complexity make it an ideal benchmark for testing a divide-and-conquer approach, where overlapping fragments are analyzed using Density Functional Theory (DFT) and assembled to reconstruct a global AMI-based correlation map,19,20 which can still be benchmarked with a full-molecular DFT computation.
Our work demonstrates the feasibility of applying AMI to realistic protein systems and highlights its potential as a quantum-informed tool for analyzing protein structure, interaction networks, and chemical environments. These insights provide a foundation for future applications in protein–ligand analysis and rational drug design, bridging the gap between high-accuracy quantum modeling and scalable computational approaches.
Our method extends prior work on quantum entanglement and electronic correlations in small biomolecules to the full insulin protein. Starting from von Neumann entanglement entropy measures, we estimate the atomic mutual information (AMI) IAB between two atoms A and B from the quantum mutual information of the respective orbitals i and j on both atoms
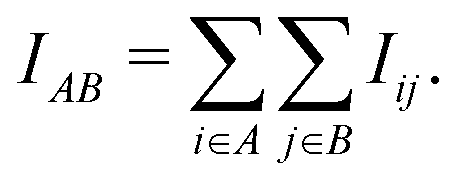 | (1) |
For computational economics, the orbital-wise quantum information indices Iij are typically computed at the Hartree–Fock mean-field or Kohn–Sham DFT level. It is conceptually straightforward to extend the concept AMI towards full fragment mutual information (FMI) between two molecular fragments X and Y following a similar coarse-graining approach
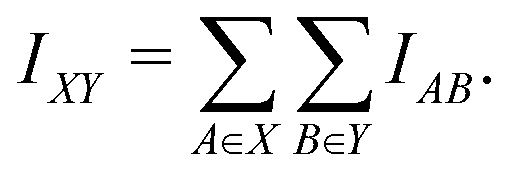 | (2) |
The AMI and FMI provide course-grained estimates of the classical and quantum correlations between atoms or fragments at biologically relevant scales, providing insights into electronic interactions from covalent bonds to long-range protein interactions. We refer to the Supplemental Information for more details on the mathematical framework.
The three-dimensional structure of insulin, along with the defined structural cuts, provides the foundation for the cut-wise quantum mechanical analysis of electron correlation. Fig. 1 shows a ribbon representation of the insulin structure, highlighting its two-chain (A and B) and overall tertiary fold. The figure illustrates how the protein was segmented into 51 overlapping spherical fragments centered on α-carbon atoms, with two representative cuts marked. Each cut encapsulates a chemically meaningful region while maintaining sufficient overlap to reconstruct global electronic correlations. As each individual sphere is defined by a radial cutoff from its central α-carbon, individual fragments may include residues that are not directly connected through peptide bonds in that individual cut. For instance, AlaB30 is not directly bonded to the Chain A residues in Cut 1 in Fig. 1. Although counterintuitive, including spatially proximal but non-covalently connected residues helps stabilize the overlapping contributions. The corresponding sequence in Fig. 1(b) maps Chain A (21 residues) and Chain B (30 residues), providing a direct reference for fragment positioning.
 | ||
| Fig. 1 (a) Ribbon representation of insulin. Two structural fragments (cuts) with radius 5.0 Å are highlighted as blue and red spheres. The magnified inset depicts Cut 1, centered on the α-carbon of the first residue in Chain A (glycine) with neighboring residues. The structure was visualized using ChimeraX.16 (b) Primary amino acid sequences of Chain A (top, 21 residues) and Chain B (bottom, 30 residues). | ||
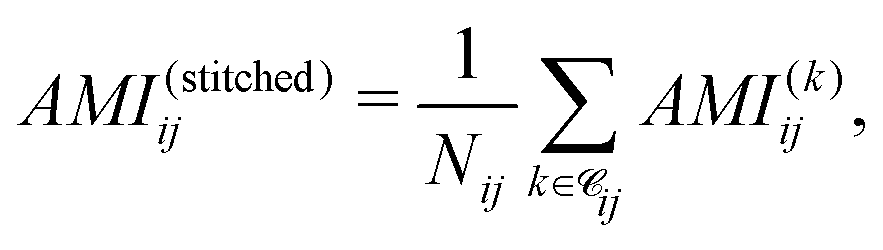
To quantify electronic correlations in insulin, we first computed the AMI of the full insulin and the cuts at the ωB97M-V/6-31G(d) level of theory (see SI). Subsequently, we reconstructed a full AMI matrix for the full protein by stitching together the results from all overlapping spherical cuts, which consisted of averaging the AMI values over all contributing cuts for each atom pair, computed as
 | (3) |
![[capital script C]](https://www.rsc.org/images/entities/char_e522.gif) ij denotes the set of fragments containing both atoms i and j, and Nij = |ij|. The AMI values from the stitched matrix of radius 5.0 Å were compared to full-protein DFT results in (Fig. 4). Each scatter point represents a pairwise atomic AMI, with data clustering near the identity line, showing that the stitched matrix accurately reproduces full-system correlations. Gray points indicate interactions missing from the stitched matrix, all below 0.1 nat, suggesting only insignificant correlations are omitted. These clusters confirm that the divide-and-correlate approach preserves both absolute AMI values and their chemical hierarchy into non-bonded interactions<single-bond to H. A visual representation of the AMI of insulin for both the reconstructed and full DFT can be found in the SPatial Atom Wise Network (SPAWN) plots,15 presented in the SI.
ij denotes the set of fragments containing both atoms i and j, and Nij = |ij|. The AMI values from the stitched matrix of radius 5.0 Å were compared to full-protein DFT results in (Fig. 4). Each scatter point represents a pairwise atomic AMI, with data clustering near the identity line, showing that the stitched matrix accurately reproduces full-system correlations. Gray points indicate interactions missing from the stitched matrix, all below 0.1 nat, suggesting only insignificant correlations are omitted. These clusters confirm that the divide-and-correlate approach preserves both absolute AMI values and their chemical hierarchy into non-bonded interactions<single-bond to H. A visual representation of the AMI of insulin for both the reconstructed and full DFT can be found in the SPatial Atom Wise Network (SPAWN) plots,15 presented in the SI.
To extend the atomic-level insights to a more interpretable analysis of interactions between amino acid residues, we used a coarse-grained view of electronic correlations in insulin using FMI. Fig. 2 compares SPAWN plots generated from the stitched AMI matrix obtained through fragment-wise DFT calculations (5.0 Å fragment radius) with the one derived from the full-protein DFT calculation (a complementary projection is given in Supplemental Information). These plots reveal strong correlations between cysteine pairs forming disulfide bonds (Cys6–Cys11, Cys7A–Cys7B, Cys20A–Cys19B). While the cut-wise plot captures key local interactions, the reference shows additional long-range correlations absent due to fragment overlap limits, as the same fragments never co-occur in a single cut. This illustrates the inherent trade-off between locality and completeness in fragment-based reconstructions.
 | ||
| Fig. 2 FMI visualization in insulin FMI. (a) Insulin protein structure with highlighted disulfide bonds. (b) and (c) SPAWN plots reconstructed from (b) 51 overlapping structural fragments using 5.0 Å cut-off, and (c) fullsystem DFT calculation. Edge thickness represents FMI strength. | ||
To evaluate the accuracy and completeness of the fragment-based FMI reconstruction, we compared heat maps derived from stitched and full-protein DFT calculations (Fig. 3). Panel (a)–(c) show FMI matrices reconstructed from overlapping spherical fragments using radii of 4.0, 5.0, and 6.0 Å, respectively, while panel (d) displays the reference matrix computed from a full-system wavefunction. Along the first off-diagonal, both matrices display strong FMI values corresponding to peptide bonds within the primary sequence. More off-diagonal elements encode tertiary structure contacts. Among these, disulfide bridges between cysteine residues emerge as distinct violet patches, validating FMI's capacity to detect chemically significant covalent interactions.
 | ||
| Fig. 3 Heat maps of FMI across the insulin protein for different fragment radii. Panels (a), (b), and (c) show stitched FMI matrices reconstructed from spherical fragments of radius 4.0, 5.0, and 6.0 Å, respectively, while panel (d) presents the full-protein DFT reference. Blue and green frames delineate Chains A and B, respectively, and purple frames indicate α-helical regions. The presence or absence of the Glu17(A)–Arg22(B) salt bridge is highlighted with a cyan circle. | ||
 | ||
| Fig. 4 Atom-pairwize AMI values from the 5.0 Å stitched matrix cut-off versus full-protein results for insulin. Gray points are missing interactions from the stitched matrix, purple non-bonded, blue single bonds to H, green single bonds between heavy atoms, and red double bonds. | ||
The heat maps also resolve secondary structure segments. α-Helical regions are evident from periodic off-diagonal bands, reflecting canonical i → i + 4 hydrogen bonding of α-helices. These features, highlighted with purple frames, appear as regularly spaced darkening patterns along the diagonal. Their locations correspond closely with the hydrogen bonds listed in Table S1 in SI, which were identified using ChimeraX.16 While classical tools like ChimeraX reliably detect standard hydrogen bonds, the FMI framework captures a broader range of electronic interactions—including subtle, non-classical, or transient correlations—that may not meet geometric criteria alone. As a result, the heat maps reveal additional interaction patterns not present in the table, underscoring the enhanced sensitivity and resolution of MI-based analysis. These patterns agree with Table S1 (SI), which lists 31 hydrogen bonds with donor–acceptor distances of 2.7–3.3 Å.
Despite the overall similarity between stitched and full DFT matrices, the recovery of certain long-range interactions depends on fragment size. To assess this sensitivity, we repeated the cut-wise procedure using cutoff radii of 4.0 and 6.0 Å in addition to the 5.0 Å case. The 4.0 Å fragments fail to capture the Glu17(A)–Arg22(B) salt bridge, whereas both the 5.0 Å and 6.0 Å fragment sets recover this interaction (circle in Fig. 3), producing stitched FMI matrices that closely match the full-protein DFT reference. This behavior reflects the increased probability that these residues are simultaneously included within a single cut. Minor variations in the color gradients between the matrices arise from the energy minimization applied during fragment preparation, further details are provided in the SI. Expanding the fragment radius from 5.0 Å to 6.0 Å increases the average fragment size and computational cost, highlighting the expected trade-off between computational efficiency and the completeness of long-range correlation recovery.
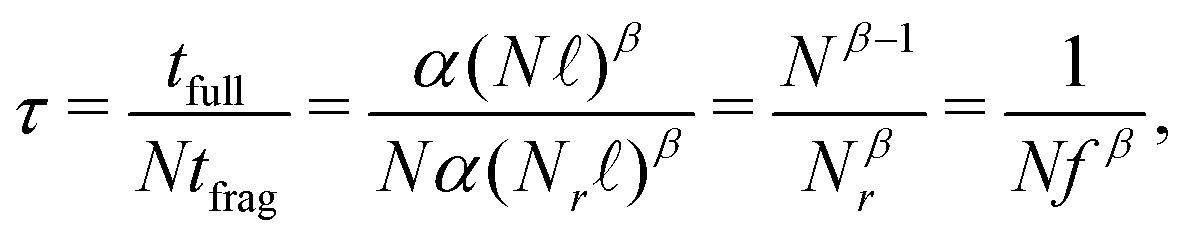
Regarding computational gains, DFT scales polynomially in the number of basis orbitals t = αLβ, with t the computational wall time to complete a DFT computation, L the total number of atomic orbitals in the computation, and α and β method-dependent constants. The relevant variable in each computation is the number of residues N, as the total number of orbitals L in each fragment is proportional to the number of residues L = Nℓ with ℓ the average number of orbitals per residue. With these parameters in place, we can define a speedup factor as
 | (4) |
| 4.0 Å | 5.0 Å | 6.0 Å | Full protein | |
|---|---|---|---|---|
| (Average) N | 5.3 | 8.1 | 10.1 | 51 |
| (Average) fr | 10% | 16% | 19% | 100% |
| (Average) L | 712 | 1068 | 1335 | 6424 |
| (Average) t [s] | 977 | 2091 | 3011 | 41![[thin space (1/6-em)]](https://www.rsc.org/images/entities/char_2009.gif) 794 794 |
| Full t [s] | 49830 |
106632 |
153556 |
41794 |
The parameter β reflects the polynomial scaling of DFT, ranging from the theoretical β = 4, to β = 321 or even lower22 towards β → 1. We will observe speedups whenever β > 1 and the radius of the spheres is sufficiently small. In the SI, we report details on the r = 4.0–6.0 Å computations at the ωB97M-V/6-31G(d) level of theory using ORCA,23 leading to a quasi quadratic β = 1.9. As can be inferred from Table 1, our benchmark insulin protein is too small to observe a speedup, mostly due to the effective low β and relatively large residue fraction fr. Extrapolating from this analysis, it can be anticipated that the locality of quantum correlations will become useful for proteins in the ∼100 kDa range, where a speedup of ×10–20 can be expected depending on the radius of the fragment. Furthermore, whenever only a small and finite number ν ≪ N of spheres need to be computed, the speedup increases to Nτ = 1/(νfβ).
We have shown that AMI and FMI provide an effective framework for quantifying electronic correlations in proteins at multiple spatial scales. Using a divide-and-conquer approach grounded in quantum locality, we mapped interatomic and inter-residue correlations in insulin with accuracy comparable to full-system DFT. FMI captures covalent bonds, disulfide bridges, hydrogen bonds, and secondary structure elements like α-helices, revealing both classical and subtle non-classical correlations. The agreement between FMI and fragment overlap maps highlights the nearsightedness of electronic interactions in proteins and supports the role of spatial locality in governing correlation strength. Extending AMI to realistic biomolecules enables quantum-informed exploration of protein–ligand interactions, pharmacophore modeling, and drug discovery.
Mostafa Javaheri Moghadam: data curation (lead); formal analysis (lead); investigation (lead); methodology (lead); software (equal); supervision (supporting); validation (equal); visualization (lead); writing – original draft (lead); writing – review and editing (equal). Rebecca Mulder: data curation (supporting); investigation (supporting); software (equal). Stijn De Baerdemacker: conceptualization (lead); formal analysis (supporting); funding acquisition (lead); methodology (supporting); supervision (lead); validation (equal); writing – review and editing (equal).
Conflicts of interest
There are no conflicts to declare.Data availability
All generated datafiles are available on the Dataverse server at the University of New Brunswick,24 and the codes can be found at https://github.com/QuNB-Repo/Insulin.Supplementary information (SI) is available. See DOI: https://doi.org/10.1039/d5cc04161a.
Acknowledgements
S. D. B. acknowledges the NSERC Canada Research Chair and Discovery Grant program for financial support.References
- A. Warshel and M. Levitt, J. Mol. Biol., 1976, 103, 227–249 Search PubMed.
- A. J. Mulholland, Drug Discovery Today, 2005, 10, 1393–1402 Search PubMed.
- D. Baker and A. Sali, Science, 2001, 294, 93–96 CrossRef CAS PubMed.
- H. M. Senn and W. Thiel, Angew. Chem., Int. Ed., 2009, 48, 1198–1229 CrossRef CAS PubMed.
- M. Karplus and J. A. McCammon, Nat. Struct. Biol., 2002, 9, 646–652 CrossRef CAS PubMed.
- U. Ryde, Methods Enzymol., 2016, 577, 119–158 Search PubMed.
- K. Raha, M. B. Peters, B. Wang, N. Yu, A. M. Wollacott, L. M. Westerhoff and K. M. Merz Jr, Drug Discovery Today, 2007, 12, 725–731 CrossRef CAS PubMed.
- M. C. Ahmed, E. Papaleo and K. Lindorff-Larsen, PeerJ, 2018, 6, e4967 Search PubMed.
- F. Jensen, Introduction to computational chemistry, John wiley & sons, 2017 Search PubMed.
- I. Shavitt and R. J. Bartlett, Many-body methods in chemistry and physics: MBPT and coupled-cluster theory, Cambridge university press, 2009 Search PubMed.
- J. Rissler, R. M. Noack and S. R. White, Chem. Phys., 2006, 323, 519–531 Search PubMed.
- S. R. White, Phys. Rev. Lett., 1992, 69, 2863–2866 Search PubMed.
- O. Legeza, R. M. Noack, J. Sólyom and L. Tincani, Computational Many-Particle Physics, Springer, Berlin/Heidelerg, 2008, vol. 739 of Lect. Notes Phys., pp. 653–664 Search PubMed.
- G. K.-L. Chan and S. Sharma, Annu. Rev. Phys. Chem., 2011, 62, 465–481 Search PubMed.
- M. J. Moghadam, K. Boguslawski, R. Doucet, Ö. Legeza, P. Tecmer and S. De Baerdemacker, chemrxiv, 2024, preprint Search PubMed.
- E. C. Meng, T. D. Goddard, E. F. Pettersen, G. S. Couch, Z. J. Pearson, J. H. Morris and T. E. Ferrin, Protein Sci., 2023, 32, e4792 Search PubMed.
- V. Timofeev, R. Chuprov-Netochin, V. Samigina, V. Bezuglov, K. Miroshnikov and I. Kuranova, Struct. Biol. Crystallogr. Commun., 2010, 66, 259–263 Search PubMed.
- R. A. DeFronzo and E. Ferrannini, Diabetes Care, 1991, 14, 173–194 Search PubMed.
- T. Inaba, S. Tahara, N. Nisikawa, H. Kashiwagi and F. Sato, J. Comput. Chem., 2005, 26, 987–993 Search PubMed.
- B. Tah, P. Pal, S. Roy, D. Dutta, S. Mishra, M. Ghosh and G. Talapatra, Spectrochim. Acta, Part A, 2014, 129, 345–351 CrossRef CAS PubMed.
- M. Bursch, J.-M. Mewes, A. Hansen and S. Grimme, Angew. Chem., Int. Ed., 2022, 61, e202205735 Search PubMed.
- C. Fonseca Guerra, J. G. Snijders, G. te Velde and E. J. Baerends, Theor. Chem. Acc., 1998, 99, 391 Search PubMed.
- F. Neese, WIREs Comput. Mol. Sci., 2012, 2, 73–78 Search PubMed.
- M. J. Moghadam, R. Mulder and S. D. Baerdemacker, Divide and Correlate: Mapping Electronic Correlations in Proteins via Local Cut-Wise Reconstruction, 2025 DOI:10.25545/OZX7DP.
| This journal is © The Royal Society of Chemistry 2026 |