
 Open Access Article
 This Open Access Article is licensed under a
 Creative Commons Attribution 3.0 Unported Licence
G4-Hemin-loaded 2D nanosheets for combined and targeted chemo-photodynamic cancer therapy†
Gowtham
Raj
a,
Tamraparni
Ghosh
a,
Vasudev
D. S.
a,
Harsha
P.
a,
Devu B.
Kumar
b,
Justin
Prasad
a,
Athul
V. B.
b,
Abhimanyu
S. M.
b and
Reji
Varghese
 *a
*a
aSchool of Chemistry, Indian Institute of Science Education and Research (IISER) Thiruvananthapuram, Trivandrum-695551, Kerala, India. E-mail: reji@iisertvm.ac.in
bSchool of Biology, Indian Institute of Science Education and Research (IISER) Thiruvananthapuram, Trivandrum-695551, Kerala, India
First published on 29th July 2024
Abstract
Synergetic combination therapy is emerging as one of the most promising approaches for cancer treatment. Among the various therapeutic approaches, PDT has received particular attention due to its non-invasive nature. However, the therapeutic performance of PDT is severely affected by tumour hypoxia. Herein, we report a supramolecular strategy for the fabrication of a PDT-active 2D nanosheet loaded with a POD mimicking DNAzyme for the synergetic combination of PDT and CDT for targeted cancer therapy. Assembly of biotin-functionalized BODIPY (1) and cationic β-cyclodextrin (β-CD+) leads to the formation of a 1/β-CD+ nanosheet with positively charged β-CD+ on the surface of the sheet. The cationic face of the 1/β-CD+ sheet was then loaded with a POD-mimicking Hem-loaded G-quadruplex aptamer (Hem/DNA1) via electrostatic interactions (1/β-CD+/Hem/DNA1). Cellular internalization of the 1/β-CD+/Hem/DNA1 nanosheet occurs via a receptor-mediated endocytic pathway, which then undergoes lysosomal escape. Subsequently, Hem/DNA1 on the surface of 1/β-CD+/Hem/DNA1 reacts with endogenous H2O2via the Fenton pathway to produce ˙OH and O2. Moreover, under cellular conditions, Hem inside the 1/β-CD+/Hem/DNA1 nanosheet produces Fe2+, which then undergoes another Fenton reaction to produce ˙OH and O2. The Fe3+ generated after the Fenton reaction is then reduced in situ to Fe2+ by glutathione for the next Fenton cycle. At the same time, photoirradiation of the 1/β-CD+ nanosheet using a 635 nm laser produces 1O2via the PDT pathway by using endogenous O2. The most remarkable feature of the present nanoformulation is the cooperativity in its therapeutic action, wherein O2 produced during the CDT pathway was used by the 1/β-CD+ sheet for improving its PDT efficacy in the hypoxic tumor microenvironment. This work represents a unique combination of CDT and PDT for targeted cancer therapy, wherein the CDT action of the nanoagent enhances the PDT efficacy and we strongly believe that this approach would encourage researchers to design similar combination therapy for advancements in the treatment of cancer.
Introduction
Photodynamic therapy (PDT) is a promising treatment modality for cancer mainly due to its non-invasive nature and spatiotemporal controllability.1,2 It involves the photoexcitation of a photosensitizer, preferably in the near-infrared (NIR) region, which then undergoes intersystem crossing from the singlet excited state to the triplet excited state. The triplet state of the sensitizer then acts as an energy donor to the ground state of molecular oxygen (3O2) and other molecules present in the tissue, producing highly cytotoxic reactive oxygen species (ROS) including singlet oxygen (1O2). These reactions lead to cell death in the photoirradiated region.3–9 Although considerable advancement has been made in PDT-based cancer treatment, the condition of hypoxia (reduced oxygen concentration) in solid tumours significantly reduces the efficiency of PDT for cancer treatment.10,11 Different strategies have been developed in recent years to overcome the condition of tumour hypoxia such as transporting additional O2 to the tumor microenvironment12,13 and catalysing endogenous H2O2 to O2.14,15 Though these strategies showed an enhanced supply of O2 to the hypoxic tumours to some extent, the continuous consumption of O2 by the mitochondria for the synthesis of ATP significantly hinders the efficacy of these approaches. Therefore, development of new strategies to boost O2 concentration in hypoxic tumours is extremely important for PDT-based cancer therapy.16–18Chemodynamic therapy (CDT) is another potential therapeutic approach for cancer treatment and has shown significant growth in recent years.19,20 This involves the metal-catalysed conversion of endogenous H2O2 into highly reactive hydroxyl radicals (˙OH) via a Fenton or Fenton-like reaction.21,22 It is important to note that one of the by-products of the Fenton reaction is O2. This clearly suggests that the integration of a CDT agent into the PDT system would be a promising approach for the improvement of PDT action by boosting the concentration of O2. More importantly, CDT and PDT can work in a synergetic fashion wherein O2 generated using the Fenton reaction can enhance the PDT action and at the same time ˙OH generated via the Fenton reaction is toxic to the cancer cells. Hence, this strategy offer the design of a synergetic combination of PDT and CDT for the treatment of cancer.23–28
We have recently reported a fluorinated boron-dipyrromethene (BODIPY)-based nanosheet as a nanoformulation for combined antisense DNA delivery and PDT.29 The nanosheet exhibited a high extinction coefficient in the NIR region, excellent 1O2 generation upon photoirradiation and efficient delivery of antisense DNA.30,31 Because the surface of the nanosheet is cationic in nature, it permits the integration of any functional DNA onto its surface via electrostatic interactions. In view of this, we envisioned that the incorporation of a peroxidase (POD)-mimicking DNAzyme32–35 onto PDT-active nanosheets would be a promising nanoformulation to achieve the design of a synergetic combination of CDT and PDT.36–38 For example, G-rich DNA is known to fold G-quadruplexes that show high binding affinity to hemin (Hem) to form a Hem-bound G-quadruplex, which is known to exhibit POD activity to produce ˙OH and O2.39 In addition, the G-quadruplex can function as an aptamer for specific cancer cells and hence offer targeted delivery of therapeutic agents into cancerous cells.40,41
Herein, we report a supramolecular strategy for the fabrication of a PDT-active 2D nanosheet loaded with a POD-mimicking DNAzyme for synergetic combination of PDT and CDT for cancer therapy. As reported previously, the host–guest interaction between biotin-functionalized BODIPY (1) and cationic β-cyclodextrin (β-CD+) in aqueous medium resulted in the formation of a 1/β-CD+ nanosheet with positively charged β-CD+ exposed onto the surface of the sheet.29 The cationic faces of 1/β-CD+ were then loaded with a POD-mimicking Hem-loaded G-quadruplex aptamer (Hem/DNA1) via electrostatic interactions to form a 1/β-CD+/Hem/DNA1 nanosheet. Importantly, DNA1 (DNAzyme) on the surface of the nanosheet can act as a targeting ligand for the overexpressed nucleolin protein on the surface of cancer cells (e.g.: MDA-MB-231) for the selective delivery of PDT and CDT agents.42–44 After selective cellular internalization of the 1/β-CD+/Hem/DNA1 nanosheet via the receptor-mediated endocytic pathway, it undergoes lysosomal escape due to the cationic charge on the surface of the nanosheet, which potentially prevents its degradation in the lysosome. Subsequently, Hem/DNA1 on the surface of 1/β-CD+/Hem/DNA1 reacts with endogenous H2O2via the Fenton pathway to produce ˙OH and O2. Moreover, under cellular conditions, over time, Hem inside the 1/β-CD+/Hem/DNA1 nanosheet produces Fe2+ by the enzymatic action of intracellular heme oxygenase.45 The in situ generated Fe2+ then undergoes another Fenton reaction to produce ˙OH and O2. The Fe3+ generated after the Fenton reaction is then reduced in situ to Fe2+ by glutathione (GSH) for the next Fenton cycle. At the same time, photoirradiation of the 1/β-CD+ nanosheet using a 635 nm laser produces 1O2via PDT by using endogenous O2. The most remarkable feature of the nanoformulation is the cooperativity in its therapeutic action, wherein O2 produced during the CDT pathway was used by the 1/β-CD+ sheet for improving its PDT efficacy in the hypoxic tumor microenvironment (Scheme 1).
 | ||
| Scheme 1 Scheme showing the non-covalent synthesis of the 1/β-CD+ complex and its spontaneous self-assembly for the formation of a 1/β-CD+ nanosheet. Integration of Hem/DNA1 onto the surface of the 1/β-CD+ nanosheet via electrostatic interactions is also shown. Cellular internalization of 1/β-CD+/Hem/DNA1 into MDA-MB-231 cells through receptor mediated endocytosis and the mechanism of combined PDT and CDT are also demonstrated. | ||
Results and discussion
Initially, PDT (1/β-CD+) and CDT (Hem/DNA1) agents were synthesized independently. Syntheses of β-CD+ and 1 were achieved as per previously reported procedures.46–48 Non-covalent synthesis of the 1/β-CD+ supramolecular amphiphile was achieved by annealing β-CD+ (20 μM in water) and 1 (20 μM in DMSO) at 90 °C for 5 minutes, followed by slow cooling to room temperature, as reported earlier.29 Unassembled β-CD+ and 1 present in the solution were removed by repeated centrifugation (3 times at 3000 rpm for 5 minutes), and the supernatant obtained was used for further experiments. It was earlier reported by us that the 1/β-CD+ amphiphile spontaneously self-assembled into a 2D nanosheet with lateral dimensions in the range of several hundred nm to μm with the thickness of the sheet in the range of 6–10 nm (Fig. S1†).29 Similarly, a Hem/DNA1 DNAzyme was synthesized by annealing DNA1 (5′-GGTGGTGGTGGTTGGGTGGTGGTGGAAAAAAAAA-3′) (1 μM) and Hem (1 μM) in Tris EDTA KCI buffer (pH 7) at 60 °C, followed by slow cooling to room temperature. The solution was then subjected to centrifugal cut-off filtration to remove any unbound Hem. In the presence of K+, the G-rich oligonucleotide undergoes intramolecular folding to form a G-quadruplex, which facilitates the end stacking of Hem to form a Hem/DNA1 DNAzyme.39 The circular dichroism (CD) spectrum of Hem/DNA1 revealed the characteristic spectral features of the antiparallel G-quadruplex (Fig. 1a).49 Furthermore, no change in the CD spectrum was observed even after the end stacking of Hem on the G-quadruplex, implying its structural stability. The loading of Hem onto DNA1 was confirmed by absorption spectral studies. A broad absorption spectrum was observed for Hem (1 μM) in water due to its very poor water solubility and hence Hem exists as an aggregated species in water, whereas intense and sharp absorption bands were observed for Hem in DMSO, implying that Hem exists as monomeric species in DMSO. Interestingly, monomer-like absorption spectral features with intense and sharp absorption bands were observed for Hem in water in the case of Hem/DNA1 (1/1 μM, Fig. 1b). This must be due to the end stacking of Hem on the DNA1 G-quadruplex, which prevents its aggregation in water.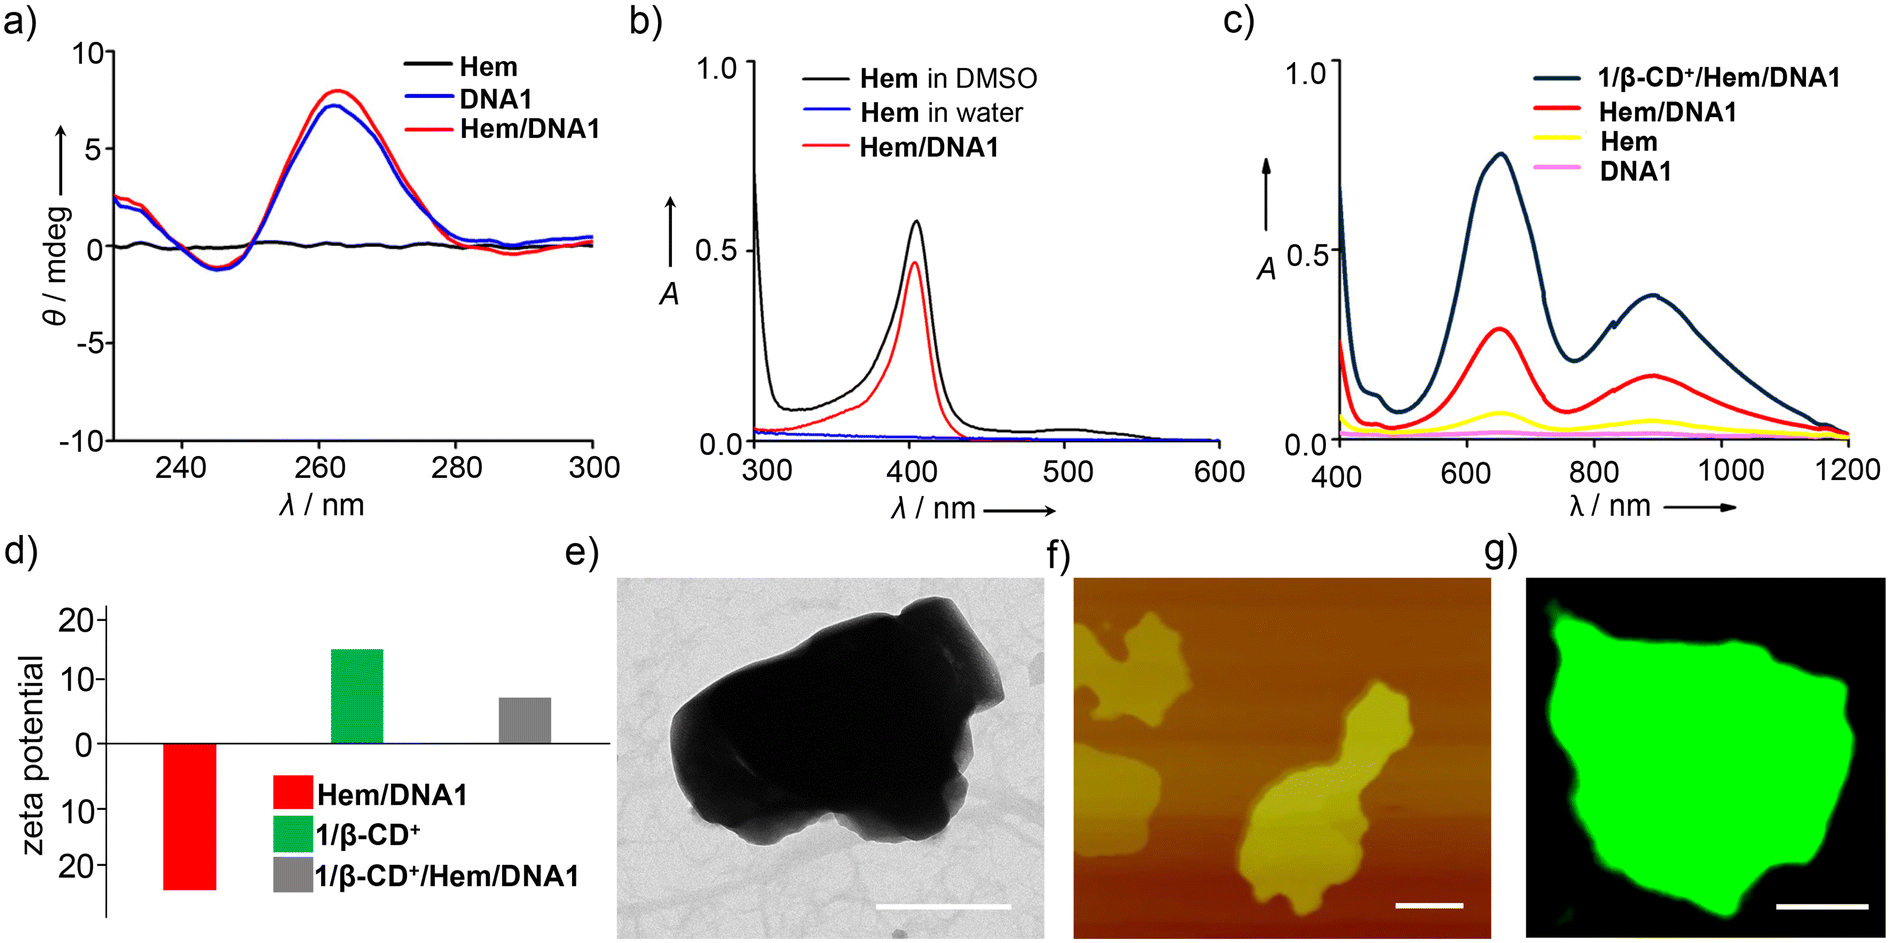 | ||
| Fig. 1 (a) Comparison of the CD spectra of DNA1, Hem, and Hem/DNA1. (b) Comparison of the absorption spectra of Hem (in H2O and DMSO) and Hem/DNA1. (c) Comparison of the absorption spectra of TMB-treated solutions of DNA1, Hem, Hem/DNA1 and 1/β-CD+/Hem/DNA1. (d) Comparison of the zeta potentials of Hem/DNA1, 1/β-CD+ and 1/β-CD+/Hem/DNA1. (e) TEM and (f) AFM images of 1/β-CD+/Hem/DNA1 (scale bars represent 500 nm). (g) CLSM image of 1/β-CD+/Hem/DNA2 (DNA2 is FAM-labelled DNA1) (scale bar represents 5 μm). | ||
We then evaluated the POD-mimicking activity of Hem/DNA1 by using the tetramethylbenzidine (TMB) oxidation assay (Fig. 1c). For this, Hem/DNA1 (1/1 μM) was treated with TMB (200 μM) in the presence of H2O2 (200 μM) and the emergence of the peak corresponding to oxidized TMB at 650 nm was monitored. As expected, a strong peak at 650 nm was observed for the Hem/DNA1-treated sample demonstrating its excellent catalytic activity. On the other hand, only negligible activity was observed for free Hem. Subsequently, Hem/DNA1 was loaded onto the surface of the 1/β-CD+ sheet by annealing Hem/DNA1 (1/1 μM) and 1/β-CD+ (20/20 μM) at 40 °C for 10 minutes, followed by slow cooling to room temperature to yield 1/β-CD+/Hem/DNA1. The loading efficiency of Hem/DNA1 onto the surface of the 1/β-CD+ nanosheet was found to be ∼100%. Details of the calculation of the loading efficiency are provided in the ESI (Fig. S2†). Zeta potential analyses of Hem/DNA1 and 1/β-CD+ showed values of −24.2 and +15.27 mV, respectively (Fig. 1d), whereas 1/β-CD+/Hem/DNA1 showed a zeta potential value of +7.9 mV. This significant reduction in the zeta potential value for 1/β-CD+/Hem/DNA1 (+7.9 mV) compared to that of the 1/β-CD+ sheet (+15.27 mV) can be attributed to the successful loading of negatively charged Hem/DNA1 onto the cationic surface of the 1/β-CD+ sheet via electrostatic interactions. Interestingly, the sheet morphology of 1/β-CD+ was found to remain intact even after the loading of Hem/DNA1 as evident from the transmission electron microscopy (TEM) (Fig. 1e) and atomic force microscopy (AFM) (Fig. 1f) analyses. The nanosheet morphology of 1/β-CD+/Hem/DNA1 was further confirmed by confocal laser scanning microscopy (CLSM) analyses using DNA1 labelled with FAM (DNA2), which showed the formation of green fluorescent 2D nanosheets (Fig. 1g). Furthermore, the 1/β-CD+/Hem/DNA1 nanosheet was found to be structurally stable in PBS buffer and 10% serum at pH 7.0. This was evident from the time-dependent absorption spectral changes of the 1/β-CD+/Hem/DNA1 nanosheet, which revealed no change in the characteristic absorption of the nanosheet with respect to time, at least for up to 6 h (Fig. S3†). We also evaluated whether the POD-mimicking activity of Hem/DNA1 is maintained after loading onto the nanosheet. As expected, a strong absorption peak at 650 nm was observed for 1/β-CD+/Hem/DNA1-treated samples, validating its catalytic activity even after loading onto the nanosheet (Fig. 1c).
One of the by-products of the CDT action of Hem/DNA1 is O2 and hence the in situ generated O2 can be utilized by the photosensitizer (1/β-CD+) for the enhanced generation of 1O2 under hypoxic conditions of the tumour microenvironment. The CDT-assisted enhanced PDT of 1/β-CD+/Hem/DNA1 was studied using the 1,3-diphenylisobenzofuran (DPBF) degradation assay. For this, Hem/DNA1 (1/1 μM) and 1/β-CD+/Hem/DNA1 (50/50/1/1 μM) nanosheet solutions in water (pH 6.5) containing H2O2 (200 μM) and DPBF (200 μM) were irradiated with a 635 nm laser (0.75 W cm−2) for 70 s and the decrease in the absorption band of DPBF at 420 nm was monitored with respect to time (Fig. 2). The absorption spectrum of DPBF was considered as the control (100%) and no degradation was observed in this case. A decrease in DPBF absorption of 27% was observed for the Hem/DNA1-treated sample compared to DPBF alone, indicating the degradation of DPBF by the ˙•OH in situ generated by the CDT action of Hem/DNA1. Interestingly, a drastic decrease in DPBF absorption of 73% was observed for the 1/β-CD+/Hem/DNA1-treated sample. This enhanced degradation of DPBF in the case of 1/β-CD+/Hem/DNA1 compared to Hem/DNA1 must be attributed to the synergetic action of CDT and PDT, wherein O2 generated during the CDT action of Hem/DNA1 enhances the PDT action of 1/β-CD+.
 | ||
| Fig. 2 Plot of absorbance changes of DPBF at 420 nm of DPBF-treated solutions of Hem/DNA1, 1/β-CD+ and 1/β-CD+/Hem/DNA1 under photoirradiation with a 635 nm laser for 70 s (0.75 W cm−2). | ||
Having demonstrated the synergetic action of CDT and PDT, the therapeutic performance of the 1/β-CD+/Hem/DNA1 nanosheet for combined CDT and PDT-based cancer therapy was studied using triple-negative human breast cancer cells, MDA-MB-231, as a representative cell line. Initially, the cellular internalization of 1/β-CD+/Hem/DNA2 (20/20/1/1 μM) was investigated using CLSM analyses by monitoring the green fluorescence of DNA2. After 12 h of incubation, CLSM analyses revealed strong green fluorescence for the cells that was mainly distributed through the cytosolic regions of the cells (Fig. 3a and b). This indicates the efficient internalization of 1/β-CD+/Hem/DNA2 into MDA-MB-231 cells. It is important to note that Hem/DNA1 acts not only as a CDT agent, but also as a targeting ligand for MDA-MB-231 cells. Targeting cancer cells is due to the molecular recognition of nucleolin protein overexpressed on the surface of MDA-MB-231 cells by Hem/DNA2. Therefore, Hem/DNA2 preferably permits the selective internalization of the nanoformulation into the cancer cells compared to the normal healthy cell lines. The selective internalization of 1/β-CD+/Hem/DNA2 was evaluated by comparing its cellular internalization between HEK-293T (normal cell line), which has negligible expression of nucleolin on its surface, and MDA-MB-231 cancer cells (Fig. 3a–d). In accordance with our design, CLSM analyses clearly showed strong green fluorescence for 1/β-CD+/Hem/DNA2-treated MDA-MB-231 cells (Fig. 3a and b) when compared to the corresponding HEK-293T cells (Fig. 3c and d). In support of this, fluorescence-activated cell sorting (FACS) analyses revealed a high mean fluorescence intensity (MFI) shift for MDA-MB-231 (11![[thin space (1/6-em)]](https://www.rsc.org/images/entities/char_2009.gif) 490) compared to HEK-293T cells (4440).
490) compared to HEK-293T cells (4440).
 | ||
| Fig. 3 (a) CLSM images of 1/β-CD+/Hem/DNA2-treated MDA-MB-231 cells (scale bar represents 50 μm) and (b) the corresponding FACS analyses. (c) CLSM images of 1/β-CD+/Hem/DNA2-treated HEK-293T cells (scale bar represents 50 μm) and (d) the corresponding FACS analyses. (e) CLSM images of 1/β-CD+/Hem/DNA2-treated MDA-MB-231 cells stained with LysoTracker Red (scale bar represents 25 μm) and (f) the corresponding line analyses. | ||
Typically any foreign materials entering into a cell via the endocytic pathway ultimately reach the lysosome and becomes degraded in the lysosome due to its acidic pH. In order to check whether the nanosheet reaches the lysosome after its cellular internalization, colocalization studies were performed after staining the lysosome of the cells using LysoTracker Red (Fig. 3e). As is evident from the CLSM analyses, only very poor colocalization was observed for the 1/β-CD+/Hem/DNA2 nanosheet with LysoTracker Deep Red. This suggests that the 1/β-CD+/Hem/DNA2 nanosheet undergoes lysosomal escape immediately after receptor-mediated endocytosis and escapes degradation in the lysosome. This was further supported by the corresponding line analyses, which showed a relatively low Pearson coefficient value of 0.048 (Fig. 3f). We believe that the lysosomal escape of the 1/β-CD+/Hem/DNA2 nanosheet is due to the net positive charges present on the surface of the nanosheet, which favours lysosomal membrane destabilization, as reported previously by our own group and others.50 The lysosomal escape of 1/β-CD+/Hem/DNA2 prevents the degradation of the nanosheet at the acidic lysosomes, thereby improving the efficacy of the nanoformulation.
After establishing the escape of the 1/β-CD+/Hem/DNA2 nanosheet from the lysosomes, the ROS generation efficiency of the 1/β-CD+/Hem/DNA1 nanosheet inside MDA-MB-231 cells was investigated using 2′,7′-dichlorofluorescein diacetate (DCFH-DA) as a fluorescent probe for ROSs. For this, MDA-MB-231 cells were treated with Hem/DNA1, 1/β-CD+/Hem/DNA1, 1/β-CD+ + NIR or 1/β-CD+/Hem/DNA1 + NIR (635 nm laser with a power of 0.75 W cm−2 for 10 minutes) and in situ ROS generation inside the cell was monitored using the DCFH-DA assay, which produces fluorescent green 2,7-dichlorofluorescein (DCF) upon ROS detection (Fig. 4a). CLSM analyses clearly revealed that the maximum green fluorescence intensity of DCF was associated with 1/β-CD+/Hem/DNA1 + NIR-treated cells compared to Hem/DNA1, 1/β-CD+/Hem/DNA1, and 1/β-CD+ + NIR-treated cells. These results unequivocally confirm that 1/β-CD+/Hem/DNA1 + NIR-treated cells produce maximum ROSs inside the cells upon laser irradiation and this must be attributed to the synergetic action of CDT and PDT. In accordance with the CLSM analysis, FACS analyses disclosed MFI shift values of 6052, 1240, 463 and 127 for 1/β-CD+/Hem/DNA1 + NIR, 1/β-CD+, Hem/DNA1 and untreated MDA-MB-231 cells, respectively (Fig. S5†). A maximum MFI shift was observed for 1/β-CD+/Hem/DNA + NIR-treated cells. As expected, no significant ROS generation was observed for 1/β-CD+/Hem/DNA-treated cells in the absence of photoirradiation.
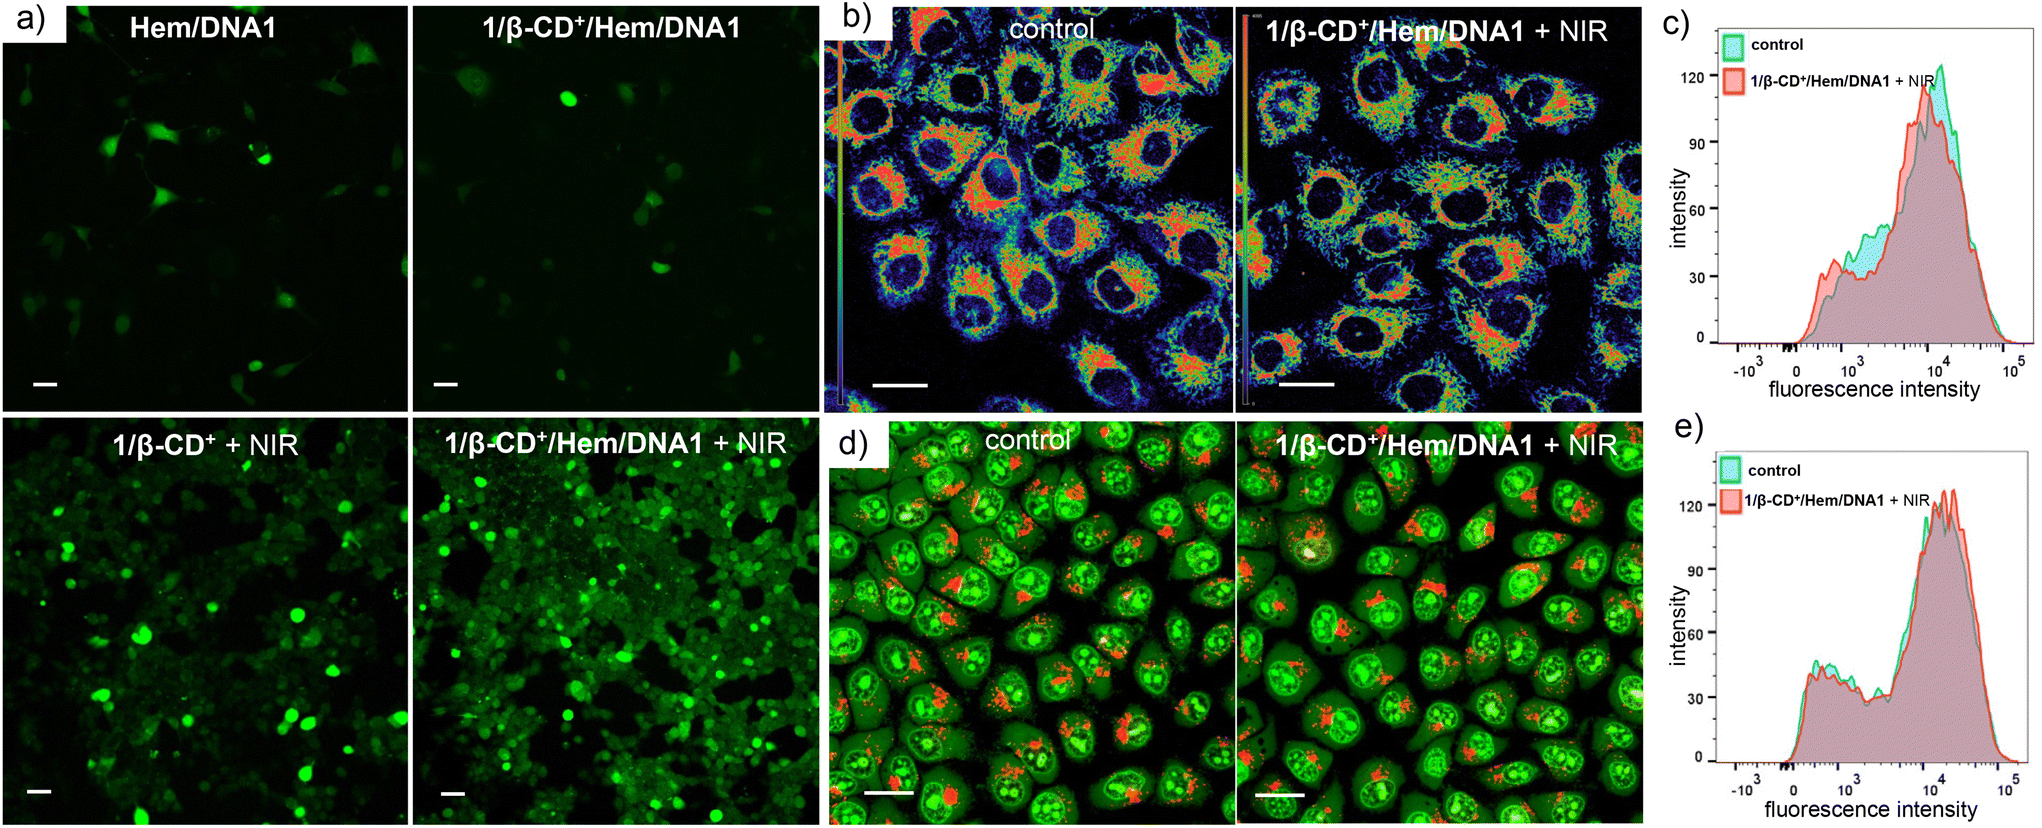 | ||
| Fig. 4 (a) DCFH-DA assay: CLSM images of Hem/DNA1, 1/β-CD+/Hem/DNA1, 1/β-CD+ + NIR and 1/β-CD+/Hem/DNA1 + NIR-treated MDA-MB-231 cells (635 nm laser with a power of 0.75 W cm−2) (scale bar represents 25 μm). (b) TMRM assay: CLSM images of 1/β-CD+/Hem/DNA1-treated MDA-MB-231 cells stained with TMRM under photoirradiation with a 635 nm laser (0.75 W cm−2) (scale bar represents 25 μm) and (c) the corresponding FACS analyses. (d) AO assay: CLSM images of 1/β-CD+/Hem/DNA1-treated MDA-MB-231 cells stained with AO under photoirradiation with a 635 nm laser (0.75 W cm−2) (scale bar represents 25 μm) and (e) the corresponding FACS analyses. | ||
Because ROSs such as 1O2 and ˙OH are highly oxidizing in nature, they can induce damage to organelles like lysosomes and mitochondria, which can potentially lead to apoptosis by various signalling pathways. In view of this, we examined the structural integrity of these organelles in the presence of ROSs generated by the combined CDT and PDT. The mitochondrial damage caused by the ROSs was evaluated using the tetramethylrhodamine methyl ester perchlorate (TMRM) assay (Fig. 4b and c).51 Since mitochondria have typical membrane potentials in the range of −180 mV, they can accumulate high concentrations of cationic dyes like TMRM. If mitochondria are damaged or depolarized, dye accumulation gradually decreases, which leads to a diminishing of its fluorescence intensity. For this, MDA-MB-231 cells were treated with 1/β-CD+/Hem/DNA1 (20/20/1/1 μM) for 2 h, then kept under NIR light illumination (635 nm laser at 0.75 W cm−2) for 10 minutes followed by 3 h of incubation. The cells were then stained with TMRM, and changes in the green fluorescence intensity of TMRM were probed using CLSM analyses. In this case as well, CLSM analyses of 1/β-CD+/Hem/DNA1-treated MDA-MB-231 cells showed no decrease in the fluorescence intensity when compared to the corresponding control cells, indicating the healthy nature of the mitochondria (Fig. 4b). This was further quantified by FACS analyses (Fig. 4c), which disclosed similar MFI shift values for the 1/β-CD+/Hem/DNA1-treated cells (12674) and the corresponding untreated control cells (12660). The lysosomal integrity was further evaluated using an acridine orange (AO) assay (Fig. 4d and e).52,53 Acridine orange emits green fluorescence when bound to dsDNA in the nucleus and red fluorescence inside lysosomes. If the lysosome is damaged, it leads to a decrease in the red fluorescence of AO. For this purpose, MDA-MB-231 cells were treated with 1/β-CD+/Hem/DNA1 (20/20/1/1 μM) for 2 h followed by NIR light illumination for 10 minutes followed by 3 h of incubation. Subsequently, the cells were co-stained with AO and evaluated using CLSM analyses. The CLSM images of 1/β-CD+/Hem/DNA1-treated cells showed no noticeable decrease in the red fluorescence of AO with respect to the control cells, indicating that the lysosomes were not damaged by the ROSs generated by the 1/β-CD+/Hem/DNA1 nanosheet (Fig. 4d). This was further confirmed by FACS analyses, which showed MFI shift values of 16476 and 17527 for the control and 1/β-CD+/Hem/DNA1 nanosheet-treated MDA-MB-231 cells, respectively (Fig. 4e). However, it must be noted that TMRM and AO staining assays revealed significant damage to lysosomes and mitochondria after 24 h of incubation (Fig. S6†). These results indicate that ROSs cause damage to the cell organelles over longer time-scales of incubation, but remain intact during shorter incubation times.
After demonstrating selective internalization and ROS generation inside the cancer cells, the cytotoxicity of 1/β-CD+/Hem/DNA1 towards MDA-MB-231 cells was studied using the MTT assay.54 Initially, toxicities of β-CD+ and 1/β-CD+ nanosheets towards MDA-MB-231 cells in the dark were studied (Fig. 5a and b). For this, β-CD+ (Fig. 5a) and 1/β-CD+ (Fig. 5b) nanosheets of varying concentrations (1–20 μM) in the dark were treated with MDA-MB-231 cells for 24 h. As expected, no cytotoxicity was observed even at the higher concentration of 20 μM. Subsequently, the cytotoxicities of MDA-MB-231 cells treated with Hem/DNA1 (1/1 μM), 1/β-CD+/Hem/DNA1 (20/20/1/1 μM), 1/β-CD+ (20/20 μM) + NIR, and 1/β-CD+/Hem/DNA1 + NIR (20/20/1/1 μM) for 2 h (635 nm laser with a power of 0.75 W cm−2 for 10 minutes) were studied (Fig. 5c). As expected no significant cytotoxicity was observed for Hem/DNA1 and 1/β-CD+/Hem/DNA1 in the absence of NIR light, indicating the poor therapeutic efficacy. On the other hand, significant cytotoxicity was observed for 1/β-CD+ and 1/β-CD+/Hem/DNA1-treated cells under NIR light irradiation. Interestingly, enhanced cytotoxicity was observed for 1/β-CD+/Hem/DNA1-treated cells compared to 1/β-CD+-treated cells. A cell death extent of 65% was observed for 1/β-CD+/Hem/DNA1-treated cells, whereas only 32% cell death was observed for 1/β-CD+-treated cells. These results are in full agreement with the enhanced ROS generation for 1/β-CD+/Hem/DNA1-treated cells and fully support our hypothesis of synergetic CDT and PDT actions.
 | ||
| Fig. 5 (a)–(c) MTT assay: cell viability at varying concentrations of (a) β-CD+ and (b) 1/β-CD+-treated MDA-MB-231 cells in the dark. (c) MTT assay of Hem/DNA1, 1/β-CD+/Hem/DNA1, 1/β-CD+ + NIR and 1/β-CD+/Hem/DNA1 + NIR-treated MDA-MB-231 cells (635 nm laser with a power of 0.75 W cm−2). (d) Calcein-AM/PI live–dead assay: CLSM images of Hem/DNA1, 1/β-CD+/Hem/DNA1, 1/β-CD+ + NIR and 1/β-CD+/Hem/DNA1 + NIR-treated MDA-MB-231 cells (scale bar represents 100 μm). (e) Annexin V-FITC/PI assay: CLSM images of 1/β-CD+/Hem/DNA1-treated MDA-MB-231 cells under photoirradiation using a 635 nm laser (0.75 W cm−2) (scale bar represents 25 μm) and (f) the corresponding FACS analyses. | ||
To further support the cytotoxicity induced by the combined actions of CDT and PDT by the 1/β-CD+/Hem/DNA1 nanosheet towards MDA-MB-231 cells, the calcein-AM/PI co-staining assay was performed (live/dead assay) (Fig. 5d). Calcein-AM interacts with the esterase present inside live cancer cells and produces green fluorescence from the cells due to the cleavage of the acetoxymethyl (AM) ester-protecting group of calcein-AM. On the other hand, no ester cleavage is possible inside the dead cells as the concentration of esterase is very minimal and hence no green fluorescence is expected for the dead cells. Similarly, propidium iodide (PI) cannot pass through the cell membrane of live cells, whereas it can stain the dead cell to give red fluorescence.43 To demonstrate the live/dead assay, the cells were initially treated with Hem/DNA1, 1/β-CD+/Hem/DNA1, 1/β-CD+ + NIR, and 1/β-CD+/Hem/DNA1 + NIR for 2 h (635 nm laser with a power of 0.75 W cm−2 for 10 minutes). As shown in Fig. 5d, 1/β-CD+/Hem/DNA1 + NIR-treated cells exhibited mainly red fluorescence of PI and negligible green fluorescence of calcein-AM compared to Hem/DNA1, 1/β-CD+/Hem/DNA1, and 1/β-CD+ + NIR-treated cells. These results conclude the enhanced cytotoxicity of 1/β-CD+/Hem/DNA1 + NIR compared to 1/β-CD+ + NIR, Hem/DNA1 and 1/β-CD+/Hem/DNA1. The live/dead cell assay also supports our hypothesis of enhanced cytotoxicity for 1/β-CD+/Hem/DNA1 + NIR due to the synergetic combination of CDT and PDT.
In order to understand the cell death mechanism of the present nanoformulation, the Annexin V-FITC(AV)/PI staining assay was carried out on 1/β-CD+/Hem/DNA1-treated MDA-MB-231 cells under NIR light illumination. As shown in Fig. 5e and Fig. S7,†1/β-CD+/Hem/DNA1 (20/20/1/1 μM)-treated cells exhibited the intense green fluorescence of Annexin V-FITC around the cell membrane and the strong red fluorescence of PI from the nuclei, revealing that most of the cell population is in the late stage of the apoptotic pathway. This is further confirmed through the FACS analyses (Fig. 5f). For this purpose, MDA-MB-231 cells were treated with the 1/β-CD+/Hem/DNA1 nanosheet under NIR light illumination and analysed by flow cytometry after staining with Annexin V-FITC (AV)/PI. In accordance with the CLSM, the cell population mainly shifted to the quadrant corresponding to the apoptotic pathway. These results collectively reveal that the 1/β-CD+/Hem/DNA1 nanosheet under NIR light illumination induces cell death via the oxidative stress-induced apoptotic pathway.
After demonstrating the in vitro performance of the 1/β-CD+/Hem/DNA1 nanosheet, we studied the efficiency of the nanoformulation in the multicellular tumor spheroid model using a 3D cell culture (Fig. 6). The 3D-multicellular tumor spheroid mimics the in vivo tumor and undergoes proliferation in all directions similar to malignant tumors. In a 3D cell culture, cells clump together to form a stable 3D spheroid-like structure, wherein the communication and signalling between the cells are maximized, leading to efficient proliferation and invasion over time.55 To this end, 3D tumour spheroids of MDA-MB-231 cells were prepared using the standard hanging drop method.56,57 The invasion potential of the 3D spheroids was studied in the presence of the 1/β-CD+/Hem/DNA1 nanosheet after NIR light irradiation to understand its effect on spheroid invasion. For this, 3D spheroids were incubated with 1/β-CD+/Hem/DNA1 (20/20/1/1 μM) nanosheets for 4 h, kept under irradiation at 635 nm (0.75 W cm−2) for 10 minutes followed by 24 h of incubation. Untreated spheroids were considered as controls that showed the maximum invasion potential (invasion index = 1.1 ± 0.6) as they showed migration in all directions. On the other hand, the 1/β-CD+/Hem/DNA1-treated sample showed a drastic reduction in the invasion potential (invasion index = 0) of the spheroids due to the combined therapeutic actions of CDT and PDT. These observations are in good agreement with the in vitro studies.
 | ||
| Fig. 6 CLSM images of 1/β-CD+/Hem/DNA1-treated MDA-MB-231 3D spheroids after NIR light illumination (0.75 W cm−2 for 10 minutes) (right) and the corresponding untreated control spheroids (left). | ||
Conclusions
In summary, we have reported a supramolecular strategy for the fabrication of a PDT-active 2D nanosheet loaded with a POD-mimicking DNAzyme for the synergetic combination of PDT and CDT for targeted cancer therapy. The most important feature of the present nanoformulation is the synergetic combination of CDT and PDT actions. The CDT action of the nanoformulation results in the formation of highly toxic ROSs along with the generation of O2 as one of the bioproducts, which can boost the concentration of O2 in the tumour microenvironment. This in turn enhances the PDT action of the nanoformulation, which is otherwise found to be less effective due to tissue hypoxia. Excellent therapeutic activity was demonstrated both in vitro and in vivo for targeted cancer therapy. This work represents a unique combination of CDT and PDT for targeted cancer therapy, wherein the CDT action of the nanoagent enhances the PDT efficacy and we strongly believe that this approach will encourage researchers to design similar combination therapies for advancements in the treatment of cancer.Author contributions
The manuscript was written through the contributions of all authors. All authors have given approval to the final version of the manuscript.Data availability
The data supporting this article have been included as part of the ESI.†Conflicts of interest
There are no conflicts to declare.Acknowledgements
Financial support from the SERB (CRG/2022/002612) is gratefully acknowledged. Sarika Mohan. S is acknowledged for help with the FACS analyses.References
- X. Zhao, J. Liu, J. Fan, H. Chao and X. Peng, Chem. Soc. Rev., 2021, 50, 4185–4219 RSC.
- T. C. Pham, V.-N. Nguyen, Y. Choi, S. Lee and J. Yoon, Chem. Rev., 2021, 121, 13454–13619 CrossRef CAS.
- S. S. Lucky, K. C. Soo and Y. Zhang, Chem. Rev., 2015, 115, 1990–2042 CrossRef CAS PubMed.
- K. Jibin, M. Victor, G. Saranya, H. Santhakumar, V. Murali, K. K. Maiti and R. S. Jayasree, ACS Appl. Bio Mater., 2021, 4, 5742–5752 CrossRef CAS PubMed.
- H. He, P.-C. Lo, S.-L. Yeung, W.-P. Fong and D. K. P. Ng, J. Med. Chem., 2011, 54, 3097–3102 CrossRef CAS PubMed.
- D. Perumal, M. Golla, K. S. Pillai, G. Raj, A. Krishna P. K. and R. Varghese, Org. Biomol. Chem., 2021, 19, 2804–2810 RSC.
- Y. Wang, M. Feng, B. Lin, X. Peng, Z. Wang and R. Lv, Nanoscale, 2021, 13, 18125–18133 RSC.
- R. Lv, M. Raab, Y. Wang, J. Tian, J. Lin and P. N. Prasad, Coord. Chem. Rev., 2022, 460, 214486 CrossRef CAS.
- B. Li, D. Xu, Y. Chen, W. Li, H. Liu, A. A. Ansari and R. Lv, ACS Appl. Nano Mater., 2024, 7, 9428–9440 CrossRef CAS.
- L. Feng, L. Cheng, Z. Dong, D. Tao, T. E. Barnhart, W. Cai, M. Chen and Z. Liu, ACS Nano, 2017, 11, 927–937 CrossRef CAS PubMed.
- X. Shi, H. Guo, X. Zhang, X. Zhang, C. Cao, H. Li, S. Chen, L. Han and S. Wang, ACS Mater. Lett., 2023, 5, 2332–2338 CrossRef CAS.
- H. Tian, Z. Luo, L. Liu, M. Zheng, Z. Chen, A. Ma, R. Liang, Z. Han, C. Lu and L. Cai, Adv. Funct. Mater., 2017, 27, 1703197 CrossRef.
- C. McEwan, S. Kamila, J. Owen, H. Nesbitt, B. Callan, M. Borden, N. Nomikou, R. A. Hamoudi, M. A. Taylor, E. Stride, A. P. McHale and J. F. Callan, Biomaterials, 2016, 80, 20–32 CrossRef CAS.
- R. Zhou, T. Y. Ohulchanskyy, H. Xu, R. Ziniuk and J. Qu, Small, 2021, 17, 2103569 CrossRef CAS PubMed.
- H. Wang, Y. Xie, Y. Chen, H. Zhao, X. Lv, Z. Zhang, G. Li, J. Pan, J. Wang and Z. Liu, Adv. Healthcare Mater., 2023, 12, 2300848 CrossRef CAS PubMed.
- S. Wang, S. Tavakoli, R. P. Parvathaneni, G. N. Nawale, O. P. Oommen, J. Hilborn and O. P. Varghese, Biomater. Sci., 2022, 10, 6399–6412 RSC.
- J. Xu, L. Xu, C. Wang, R. Yang, Q. Zhuang, X. Han, Z. Dong, W. Zhu, R. Peng and Z. Liu, ACS Nano, 2017, 11, 4463–4474 CrossRef CAS PubMed.
- M. Overchuk, R. A. Weersink, B. C. Wilson and G. Zheng, ACS Nano, 2023, 17, 7979–8003 CrossRef CAS.
- Z. Tang, Y. Liu, M. He and W. Bu, Angew. Chem., Int. Ed., 2019, 58, 946–956 CrossRef CAS.
- Y. Zhou, S. Fan, L. Feng, X. Huang and X. Chen, Adv. Mater., 2021, 33, 2104223 CrossRef CAS.
- Z. Yu, Y. Hu, Y. Sun and T. Sun, Chem. – Eur. J., 2021, 27, 13953–13960 CrossRef CAS.
- P. Zhao, H. Li and W. Bu, Angew. Chem., Int. Ed., 2023, 62, e202210415 CrossRef CAS PubMed.
- H. Hou, X. Huang, G. Wei, F. Xu, Y. Wang and S. Zhou, ACS Appl. Mater. Interfaces, 2019, 11, 29579–29592 CrossRef CAS.
- J. Qin, B. Bo, T. Yang, Z. Wang, F. Xie and H. Peng, Mater. Lett., 2023, 349, 134678 CrossRef CAS.
- S. Shen, M. Liu, T. Li, S. Lin and R. Mo, Biomater. Sci., 2017, 5, 1367–1381 RSC.
- K. Li, Y. Zhang, A. Hussain, Y. Weng and Y. Huang, ACS Biomater. Sci. Eng., 2021, 7, 4420–4429 CrossRef CAS.
- R. N. Woodring, E. G. Gurysh, E. M. Bachelder and K. M. Ainslie, ACS Appl. Bio Mater., 2023, 6, 934–950 CrossRef CAS PubMed.
- P. Liang, B. Ballou, X. Lv, W. Si, M. P. Bruchez, W. Huang and X. Dong, Adv. Mater., 2021, 33, 2005155 CrossRef CAS.
- G. Raj, Vasudev D. S., J. Prasad, E. Anbu, S. Ram, G. B. Daniel, N. D. Narendradev, S. M. Srinivasula and R. Varghese, Mater. Chem. Front., 2024, 8, 553–561 RSC.
- A. Saminathan, J. Devany, A. T. Veetil, B. Suresh, K. S. Pillai, M. Schwake and Y. Krishnan, Nat. Nanotechnol., 2021, 16, 96–103 CrossRef CAS PubMed.
- K. Dutta, R. Das, J. Medeiros and S. Thayumanavan, Biochemistry, 2021, 60, 966–990 CrossRef CAS PubMed.
- C. Liu, J. Hu, W. Yang, J. Shi, Y. Chen, X. Fan, W. Gao, L. Cheng, Q.-Y. Luo and M. Zhang, Nanoscale, 2024, 16, 4637–4646 RSC.
- P. Borah, D. J. Baruah, P. Mridha, R. Baishya, H. K. Borab and M. R. Das, Chem. Commun., 2024, 60, 2417–2420 RSC.
- S. Liu, et al. , Adv. Mater., 2024, 36, 2304297 CrossRef CAS PubMed.
- X. Xie, Y. Wang, X. Zhou, J. Chen, M. Wang and X. Su, Analyst, 2021, 146, 896–903 RSC.
- Q. Zhang, Q. Jiang, N. Li, L. Dai, Q. Liu, L. Song, J. Wang, Y. Li, J. Tian, B. Ding and Y. Du, ACS Nano, 2014, 8, 6633–6643 CrossRef CAS.
- P. Pitikultham, Z. Wang, Y. Wang, Y. Shang, Q. Jiang and B. Ding, ChemMedChem, 2022, 17, e202100635 CrossRef CAS.
- S. Dey, A. Dorey, L. Abraham, Y. Xing, I. Zhang, F. Zhang, S. Howorka and H. Yan, Nat. Commun., 2022, 13, 2271 CrossRef CAS PubMed.
- Y. Cao, P. Ding, L. Yang, W. Li, Y. Luo, J. Wang and R. Pei, Chem. Sci., 2020, 11, 6896–6906 RSC.
- L. Fabre, C. Rousset, K. Monier, F. Da Cruz-Boisson, P. Bouvet, M.-T. Charreyre, T. Delair, E. Fleury and A. Favier, Biomacromolecules, 2022, 23, 2302–2314 CrossRef CAS PubMed.
- W. Xuan, Y. Xia, T. Li, L. Wang, Y. Liu and W. Tan, J. Am. Chem. Soc., 2020, 142, 937–944 CrossRef CAS PubMed.
- C. Zhang, S. Tang, M. Wang, L. Li, J. Li, D. Wang, X. Mi, Y. Zhang, X. Tan and S. Yue, ACS Nano, 2024, 18, 5470–5482 CAS.
- J. He, T. Peng, Y. Peng, L. Ai, Z. Deng, X.-Q. Wang and W. Tan, J. Am. Chem. Soc., 2020, 142, 2699–2703 CrossRef CAS.
- A. F.-J. Jou, Y.-T. Chou, I. Willner and J. A. Ho, Angew. Chem., Int. Ed., 2021, 60, 21673–21678 CrossRef CAS.
- W. Xuan, Y. Xia, T. Li, L. Wang, Y. Liu and W. Tan, J. Am. Chem. Soc., 2020, 142, 937–944 CrossRef CAS PubMed.
- S. K. Albert, H. V. P. Thelu, M. Golla, N. Krishnan and R. Varghese, Nanoscale, 2017, 9, 5425–5432 RSC.
- W. Tang and S.-C. Ng, Nat. Protoc., 2008, 3, 691–697 CrossRef CAS PubMed.
- A. Tamura, K. Nishida, S. Zhang, T. W. Kang, A. Tonegawa and N. Yui, ACS Biomater. Sci. Eng., 2022, 8, 2463–2476 CrossRef CAS PubMed.
- Y. Guo, J. Zhang, F. Ding, G. Pan, J. Li, J. Feng, X. Zhu and C. Zhang, Adv. Mater., 2019, 31, 1807533 CrossRef.
- G. Raj, D. S. Vasudev, S. Christopher, A. Babulal, P. Harsha, S. Ram, M. Tiwari, M. Sauer and R. Varghese, Nanoscale, 2024, 16, 3755–3763 RSC.
- N. Neelambaran, S. Shamjith, V. P. Murali, K. K. Maiti and J. Joseph, ACS Appl. Bio Mater., 2023, 6, 5776–5788 CrossRef CAS.
- W. Li, S. Yin, Y. Shen, H. Li, L. Yuan and X.-B. Zhang, J. Am. Chem. Soc., 2023, 145, 3736–3747 CrossRef CAS.
- S.-H. Park, S. Park and I. Shin, STAR Protoc., 2021, 2, 100349 CrossRef CAS PubMed.
- W. E. M. Noteborn, S. K. Vittala, M. B. Torredemer, C. Maity, F. Versluis, R. Eelkema and R. E. Kieltyka, Biomacromolecules, 2023, 24, 377–386 CrossRef CAS PubMed.
- A. Rajwar, S. R. Shetty, P. Vaswani, V. Morya, A. Barai, S. Sen, M. Sonawane and D. Bhatia, ACS Nano, 2022, 16, 10496–10508 CrossRef CAS.
- H. A Naveena and D. Bhatia, ChemBioChem, 2023, e202300506 CrossRef PubMed.
- A. Aung, S. K. Davey, J. Theprungsirikul, V. Kumar and S. Varghese, Adv. Healthcare Mater., 2023, 12, 2201842 CrossRef CAS PubMed.
Footnote |
| † Electronic supplementary information (ESI) available. See DOI: https://doi.org/10.1039/d4nr01494d |
| This journal is © The Royal Society of Chemistry 2024 |