 Open Access Article
Theoretical insights into dopamine photochemistry adsorbed on graphene-type nanostructures†
Alex-Adrian
Farcaş
and
Attila
Bende
 *
*
National Institute for Research and Development of Isotopic and Molecular Technologies, Donat Street, No. 67-103, Ro-400293 Cluj-Napoca, Romania. E-mail: attila.bende@itim-cj.ro
First published on 7th May 2024
Abstract
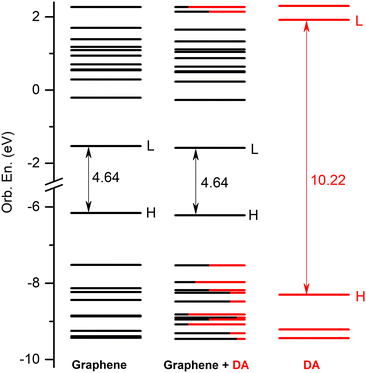
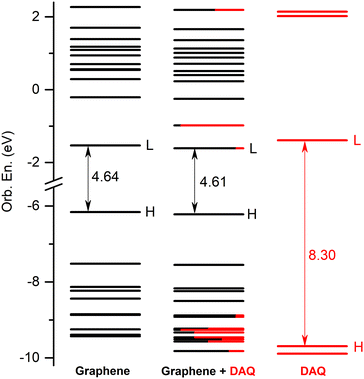
The equilibrium geometry structures and light absorption properties of the dopamine (DA) and dopamine-o-quinone (DAQ) adsorbed on the graphene surface have been investigated using the ground state and linear-response time-dependent density functional theories. Two types of graphene systems were considered, a rectangular form of hexagonal lattice with optimized C–C bond length as the model system for graphene nanoparticles (GrNP) and a similar system but with fixed C–C bond length (1.42 Å) as the model system for graphene 2D sheet (GrS). The analysis of the vertical excitations showed that three types of electronic transitions are possible, namely, localized on graphene, localized on the DA or DAQ, and charge transfer (CT). In the case of the graphene–DA complex, the charge transfer excitations were characterized by the molecule-to-surface (MSCT) character, whereas the graphene–DAQ was characterized by the reverse, i.e. surface-to-molecule (SMCT). The difference between the two cases is given by the presence of an energetically low-lying unoccupied orbital (LUMO+1) that allows charge transfer from the surface to the molecule in the case of DAQ. However, it was also shown that the fingerprints of excited electronic states associated with the adsorbed molecules cannot be seen in the spectrum, as they are mostly suppressed by the characteristic spectral shape of graphene.
1 Introduction
The photochemical behaviour of an organic molecule can change fundamentally when it is adsorbed on a metal or semiconductor surface.1–4 Not only do the photochemical properties of the adsorbed molecule change, but new, more complex photo-processes may also appear, such as, electron or energy transfer to metal surfaces,5,6 substrate–adsorbate photocoupling,7 surface driven photooxidation8,9 or more complex photocatalytic processes.10 Moreover, the wide range of these properties can offer several research and industrial applications, such as, development of high-performance dye-sensitized solar cells,11 building new, functionalized materials for electrode material for fuel cells and batteries,12,13 materials for 3D printing14 or creating micropatterns with desired biofunctional properties.15Inspired by the composition of adhesive proteins in mussels, Lee and co-workers16,17 have shown that dopamine (DA) through the self-polymerization process can form thin, surface-adherent polydopamine films (PDA)18,19 onto a wide range of inorganic and organic materials, including noble metals, oxides, polymers, semiconductors, and ceramics.20–26
On the other hand, carbon-based nanomaterials are one of the most widely discussed, researched and applied synthetic nanomaterials, due to their diverse capabilities, such as excellent electronic, magnetic and optical properties. At the same time, their chemical versatility allows them to be easily manipulated in laboratory and industrial environments, to be biocompatible and to be considered as a chemically robust platform.27–32
Taking into account the properties of the individual systems presented in the previous two paragraphs, further interesting behaviour can be observed in the case of the dopamine–graphene complex. First of all, one should mention the use of graphene as a DA sensor33–37 or that of PDA for the reduction of graphene oxide,38 but their complex was also used for making polymer filters,39 to improve electrochemical performances of supercapacitors40 or Li–S batteries,41 to use as high-performance material for biosensing42,43 or as an efficient electrocatalysts44–46 as well as to apply it in cancer therapy.47 But what makes it particularly more interesting is the photochemical application of the graphene–dopamine complex,48–52 especial as photothermal therapy for cancer.53
Although DA is a relatively small molecule, its photochemical behaviour strongly dependents on its the concentration and tautomer forms as well as on the pH of the solvent environment,54,55 and it is therefore much more difficult to unambiguously identify the fingerprints of different tautomers in the experimental UV-Vis spectrum. Similarly to DA, graphene exhibits complex photochemical behaviour, as the shape of the spectrum is highly dependent on the atomic configuration and size of the graphene structure.56–62
Accurate theoretical reproduction of experimental UV-Vis spectra is a challenge in itself, even for intermediate molecules,63 especially with respect to the accurate description of the electron correlation and the response function. This is particularly true for complex, multi-component supramolecular systems.64–68 At the same time, graphene nanostructures have been successfully applied to the detection of e.g. catechol,69 where also the UV-Vis spectroscopy technique was considered for the structure recognition. In such a case, the question arises whether it is possible to identify the individual components on the basis of the resulting adsorption spectrum, or whether this resulting spectrum has any characteristic feature that suggests that the two components form a well-defined joint complex.
The aim of our study is to give a detailed description for the photochemistry behavior, and in particular, for nature of the electronic transitions induced by an electromagnetic radiation in the cases of graphene – dopamine and graphene – dopamine-o-quinone complexes using the framework of the time-dependent density functional theory, with the aim of investigating whether graphene as a tool helps to facilitate the identification of adsorbed molecules on it surface.
2 Computational details
The equilibrium geometries and normal mode vibrational frequencies of individual molecules, the graphene sheet and different molecule–graphene binary complexes were computed in the framework of density functional theory (DFT) considering the ωB97X-D3BJ exchange–correlation (XC) functional70 by including the Grimme's empirical dispersion correction scheme71,72 and using the def2-TZVPP triple-ζ basis set of the Karlsruhe group73 as implemented in the Orca program suite.74,75 The electronically excited state calculations and equilibrium geometry optimizations were computed using the time-dependent version of the same DFT framework considering the Tamm–Dancoff approximation (TDA) approximation.76 The RIJCOSX approximation77 designed to accelerate Hartree–Fock and hybrid DFT calculations were considered together with the Def2/J78 auxiliary basis set for Coulomb fitting and the def2-TZVPP/C79 auxiliary basis set for correlation fitting in the case of TD-DFT calculations. During the geometry optimization of the molecule–graphene binary complex the graphene part was kept frozen and the Partial Hessian Vibrational Analysis (PHVA) method80 has been used for obtaining the normal mode vibrational frequencies of the unconstrained part of the binary complex. The theoretical prediction of the fluorescence rate was made based on the path integral approach to the dynamics by solving Fermis Golden Rule-like equation including vibronic coupling in forbidden transitions (the so-called Herzberg–Teller effect (HT)) and Duschinsky rotations between modes of different states.81–83 The amount of transferred charge between the complex constituents was obtained based on the analysis of the charge population (Löwdin atomic charges) of a given electronically excited state density computed in the TDDFT framework. The molecular geometries were built, analyzed and further manipulated using Multiwfn84 Gabedit85 and Avogadro86 programs, while the molecular graphics were created using the GaussView87 software.3 Results and discussion
3.1 Geometry structures
As a first step, a two-dimensional (three zig-zag and seven armchair edges) rectangular graphene nano-sheet with fully aromatic hexagonal rings (see Fig. 1) was considered in two geometrical configurations. In the first case its structure has been fully optimized in order to mimic the graphene-type nanoparticle (GrNP), while in the second case all C–C bond lengths were kept as 1.42 Å for reproducing the 2D infinite dimensional graphene sheet (GrS) geometry.88 The geometry optimization leads to an irregular honeycomb lattice, where the C–C bond length varies between 1.38–1.47 Å.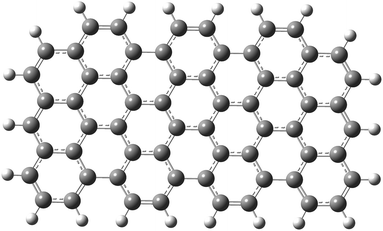 | ||
| Fig. 1 The molecular graphics of the graphene nanoparticle with three zig-zag and seven armchair edges. | ||
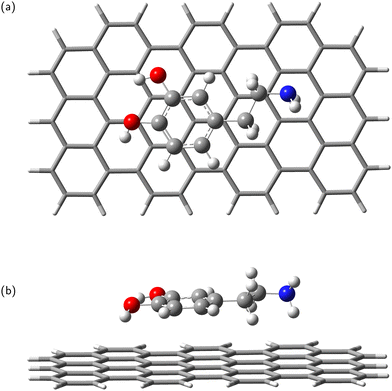
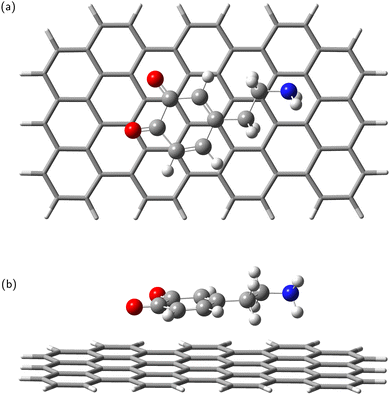
In the next step, the dopamine (DA) and dopamine-o-quinone (DAQ) molecules were deposited on the GrNP-type graphene sheet and the geometry of the molecules as well as their relative position to the graphene sheet were optimized, while the geometry of the graphene sheet was was kept fixed. In the equilibrium geometry configuration, the DA molecule is slightly tilted with respect to the graphene sheet, with the O atoms of the hydroxyl group at 3.2 and 3.26 Å from the graphene plane, respectively, and the N atom of the amine group at 3.51 Å (see Fig. 2). A similar arrangement can be observed for DAQ, where the O atoms of the hydroxyl groups are 3.14 Å and 3.19 Å away, while the N atom of the amine group is 3.52 Å from the graphene plane (see Fig. 3). Adsorption energy of DA on the GrNP surface is −20.24 kcal mol−1, while that of DQ is −20.11 kcal mol−1, of which the deformation energy is only 0.41 kcal mol−1 and 0.13 kcal mol−1, respectively. As for the ground state charge distribution, there is a charge transfer of 0.068 e from the DA to the surface (called as molecule-to-surface charge transfer or MSCT), while for DAQ the charge transfer to the graphene is only 0.031 e.
3.2 Electronic excited states and UV absorption spectra
In order to gain more insight into the nature of the initial (vertical) and relaxed excited states, the first 30 electronic excited states were computed separately for each molecule and graphene sheet, and for different molecule–graphene binary complexes.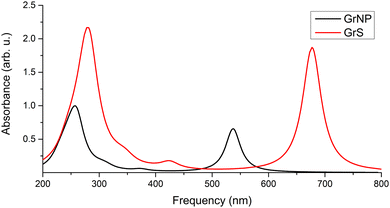 | ||
| Fig. 4 Theoretical UV absorption spectra of the model graphene lattice both in the optimized (GrNP) and fixed (GrS) geometry forms, computed at TDDFT/ωB97X-D3BJ/def2-TZVPP level of theory. | ||
It is important to note that in the case of graphene, only a simplified model has been considered, where the 2D solid state character and the band structure have been discarded. Instead, a finite dimensional hydrocarbon structure has been adopted which results in discrete electronic states. Compared to the experimental UV spectrum of graphene, this simple model is already able reproduce the most important features of the UV spectrum. Of course, in order to accurately follow the changes in the electron structure of graphene induced by the adsorbed molecules, the simplified model described here is no longer suitable, it needs for solid-state model.
| Si | 1 | 2 | 3 | 4 | 5 | 6 | 7 | 8 | 9 | 10 |
|---|---|---|---|---|---|---|---|---|---|---|
| CT = Charge transfer character | ||||||||||
| λ (nm) | 540 | 377 | 374 | 364 | 357 | 342 | 331 | 323 | 321 | 312 |
| Osc. Str. | 1.6763 | 0.0807 | 0.0008 | 0.0006 | 0.0001 | 0.0026 | 0.0068 | 0.0085 | 0.0212 | 0.0725 |
| Charge tr. (e) | 0.001 | 0.026 | 0.003 | 0.004 | 0.014 | 0.117 | 0.397 | 0.006 | 0.317 | 0.043 |
| Type | GrNP | GrNP | GrNP | GrNP | GrNP | CT | CT | GrNP | CT | GrNP + CT |
| Si | 11 | 12 | 13 | 14 | 15 | 16 | 17 | 18 | 19 | 20 |
|---|---|---|---|---|---|---|---|---|---|---|
| λ (nm) | 304 | 303 | 295 | 285 | 283 | 271 | 267 | 267 | 262 | 261 |
| Osc. Str. | 0.0838 | 0.0358 | 0.0348 | 0.0012 | 0.0155 | 0.2183 | 0.1371 | 0.0751 | 0.1166 | 0.7479 |
| Charge tr. (e) | 0.004 | 0.003 | 0.025 | 0.040 | 0.084 | 0.398 | 0.080 | 0.028 | 0.012 | 0.084 |
| Type | GrNP | GrNP | GrNP | GrNP | GrNP + CT | CT | GrNP + CT | GrNP | GrNP | GrNP + CT |
| Si | 21 | 22 | 23 | 24 | 25 | 26 | 27 | 28 | 29 | 30 |
|---|---|---|---|---|---|---|---|---|---|---|
| λ (nm) | 259 | 257 | 255 | 253 | 250 | 248 | 245 | 244 | 240 | 239 |
| Osc. Str. | 0.0067 | 0.0309 | 0.7957 | 0.0243 | 0.0613 | 0.0171 | 0.0153 | 0.3103 | 0.0449 | 0.0053 |
| Charge tr. (e) | 0.027 | 0.031 | 0.114 | 0.032 | 0.102 | 0.798 | 0.106 | 0.130 | 0.149 | 0.041 |
| Type | GrNP | GrNP | GrNP + CT | GrNP | GrNP + CT | CT | GrNP + CT | CT | DA + CT | GrNP |
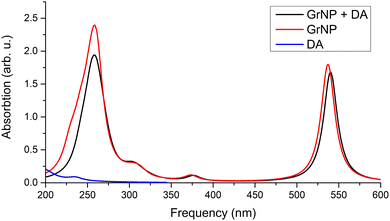 | ||
| Fig. 6 Theoretical UV absorption spectra of the graphene–DA binary complex computed at TDDFT/ωB97X-D3BJ/def2-TZVPP level of theory. | ||
When the GrS type was used as the graphene surface, the first forty excited states were analysed rather than the first thirty. This was necessary because in the first thirty states there wasn’t any excitation that could be associated with the DA. When this interval was increased to forty, it was possible to identify the DA-related excited state as S34, which also has a mixed state coming from the locally excited DA- and MSCT-type transitions, and the amount of transferred charge is 0.272 e. In addition, three, pure CT states were also identified, S9, S17 and S25, with charge transferred from DA to GrS (MSCT) amounts of 0.816 e, 0.456 e and 0.603 e, respectively. Twelve of the thirty-six remaining excited states are pure GrS, while twenty-four are of mixed “GrS + CT” type.
| Si | 1 | 2 | 3 | 4 | 5 | 6 | 7 | 8 | 9 | 10 |
|---|---|---|---|---|---|---|---|---|---|---|
| CT = Charge transfer character. | ||||||||||
| λ (nm) | 547 | 518 | 472 | 376 | 374 | 364 | 357 | 340 | 332 | 326 |
| Osc. Str. | 1.5631 | 0.0010 | 0.1244 | 0.0691 | 0.0054 | 0.0053 | 0.0014 | 0.0044 | 0.0068 | 0.0026 |
| Charge tr. (e) | −0.034 | 0.050 | −0.836 | 0.023 | 0.022 | 0.025 | 0.028 | 0.021 | −0.024 | 0.000 |
| Type | GrNP + CT | DAQ | CT | GrNP | GrNP | GrNP | GrNP | GrNP | DAQ | GrNP |
| Si | 11 | 12 | 13 | 14 | 15 | 16 | 17 | 18 | 19 | 20 |
|---|---|---|---|---|---|---|---|---|---|---|
| λ (nm) | 325 | 323 | 314 | 304 | 304 | 297 | 294 | 288 | 285 | 281 |
| Osc. Str. | 0.0000 | 0.0146 | 0.0980 | 0.0488 | 0.0472 | 0.0202 | 0.0209 | 0.0081 | 0.0159 | 0.0056 |
| Charge tr. (e) | 0.050 | 0.021 | 0.000 | 0.000 | 0.014 | −0.698 | −0.084 | −0.756 | −0.048 | 0.018 |
| Type | DAQ | GrNP | GrNP | GrNP | GrNP | CT | GrNP + CT | CT | GrNP + CT | GrNP |
| Si | 21 | 22 | 23 | 24 | 25 | 26 | 27 | 28 | 29 | 30 |
|---|---|---|---|---|---|---|---|---|---|---|
| λ (nm) | 277 | 268 | 265 | 263 | 263 | 259 | 258 | 256 | 253 | 250 |
| Osc. Str. | 0.0270 | 0.0957 | 0.0026 | 0.7773 | 0.5549 | 0.1103 | 0.0246 | 0.1413 | 0.1526 | 0.0598 |
| Charge tr. (e) | −0.799 | 0.035 | −0.015 | 0.053 | 0.014 | 0.014 | 0.020 | 0.029 | 0.015 | −0.749 |
| Type | CT | GrNP | GrNP + CT | GrNP | GrNP | GrNP | GrNP | GrNP | GrNP | CT |
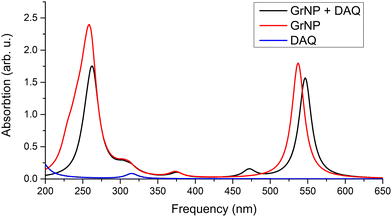 | ||
| Fig. 8 Theoretical UV absorption spectra of the graphene–DAQ binary complex computed at TDDFT/ωB97X-D3BJ/def2-TZVPP level of theory. | ||
When the excitations between the canonical MO orbitals are analyzed for these CT excitations, it can be seen that there is always a transition with a large weight in the individual MO excitation scheme from certain occupied orbital to the same LUMO+1 orbital. Namely, for S3 is H → L+1 (93%), for S16 is H−1 → L+1 (64%), for S18 is H−4 → L+1 (61%), for S21 is H−2 → L+1 (77%) and for S30 is H−5 → L+1 (50%) excitation, respectively. A similar excitation scheme is true for DAQ-like excitations, with the difference that the excitation starts from even lower MO orbitals and goes to L+1. Namely, for S2 is H−9 → L+1 (54%), for S9 is H−8 → L+1 (26%) and for S11 is H−19 → L+1 (63%) excitation, respectively.
The detailed data on the thirty excited states mentioned above, such as the most significant molecular orbital excitations and the NDOs are given in Table S7 in the ESI† file. Concerning the UV-Vis absorption spectrum in particular, it can be observed that the spectrum of the graphene–DAQ complex is very similar to that of graphene. Difference is made by the peak obtained for the S3 CT-type excited state (around 472 nm), which cannot be seen in the graphene spectrum (see Fig. 8). As for the DAQ, some contribution from S9 (332 nm) can be observed in the UV spectrum, however, the absorption intensity associated with this electronic transition is quite small.
No significant change in the nature of the excited states was observed when instead of the GrNP form the GrS-type graphene structure was considered. For example, the nature of the S1, S2 and S3 excited states remains the same, except that the excitation wavelengths are shifted to higher (lower energy) values. That is, instead of 547 nm, 518 nm and 472 nm, values of 686 nm, 530 nm and 516 nm were obtained.
3.3 Excited state relaxation dynamics
The relaxation dynamics of electronic excited states on metal or semiconductor 2D surface looks a very complex phenomena.106–109 Since excited states can be localize on one or the other constituent of the molecule–surface complex, or charges can easily migrate from the molecule to the surface or vice versa, relaxation processes can also occur either on the components separately or even inside the binary system. Accordingly, it was already shown, that non-radiative relaxation can occur either on the graphene surface110 itself or in the binary complex,111–118 but at the same time, excited states in the case of slightly modified GrNP can also decay via fluorescence phenomena.119,120 Given that the relatively moderate size of the chosen graphene model (62 carbon and 22 hydrogen atoms) does not require the use of, e.g., a solid-state based physical model, in the present case the binary molecule–graphene complex will be considered as a macromolecular system with two interacting constituents and treated with the ordinary DFT and TDDFT methods suitable for molecular systems. Second, non-radiative phenomena were also not considered, as they require a very complex theoretical framework and huge computation resources to describe them. Third, as a further approximation, the dynamics of the surface (geometry deformation) has been neglected, because we are more interested in the dynamics of the adsorbed molecule. This was achieved by keeping the atoms of the surface fixed during the normal mode vibration and excited state geometry optimization calculations. In order to follow the relaxation of the higher excited states without considering the internal conversion phenomena between adjacent electronic states, the “root following” condition was imposed during the geometry relaxation.![[double bond, length as m-dash]](https://www.rsc.org/images/entities/char_e001.gif) O bonds, where they change from 1.206 Å and 1.208 Å in the ground state to 1.242 Å and 1.244 Å in the S1 state. These changes also affect the hexagonal ring configuration, in particular the C–C bond to which the carbonyl groups are attached. Namely, from 1.553 Å the bond length is shorten to 1.505 Å. The relative position of DAQ with respect to the plane of graphene also changes, with the O atoms of the carbonyl groups approaching the graphene from 3.14 Å and 3.15 Å to 2.84 Å and 2.85 Å while the distance of NH2 from the plane of graphene remains almost unchanged (3.51 Å). After geometric optimization, the absorption wavelength of S1 also changes significantly to 651 nm. The charge transfer value obtained during vertical excitation also jumps enormously, from −0.034 e to −0.736 e, clearly suggesting that during geometry relaxation the localized excitation character on the GrNP diminishes and the CT-type excitation character increases. Since the geometry deformation for DAQ in the S1 excited state is significant compared to the ground state geometry, the method used for DA to determine the fluorescence rate in the framework of the harmonic oscillator approach is no longer valid. Therefore, in this case, neither the fluorescence rate nor the lifetime was computed; (ii) S2 – S2 is considered mostly locally excited state on DAQ, where an additional slight charge transfer occurs from the DAQ to the graphene surface. Geometry optimization with the root following constrain leads to a slight detachment of carbonyl groups, from 3.14 Å and 3.19 Å to 3.19 Å and 3.26 Å, respectively. The equilibrium geometry will also be S1 as the final state order, but this S1 state is only a local minimum compared to the geometry obtained in the previous S1 state optimization, with a conformational energy difference of 1.404 kcal mol−1. Also, the geometry changes observed in the DAQ are more typical to the S1 equilibrium geometry of the isolated DAQ, i.e. the length of the C–C bond from the six-membered ring, which includes the carbonyl groups, is not shortened but stretched, from 1.553 Å to 1.616 Å. The amount of transferred charge remains unchanged, namely +0.050 e transferred from DAQ to the graphene surface. (iii) S3 – considering the root following condition, the geometry optimization of the S3 state leads to the same equilibrium geometry as found for S1. For geometry relaxation and charge transfer effects, see the results presented for the S1 case; (iv) S16 – for this case, it was found that the carbonyl groups move closer (Δ (O⋯GrNP) = −0.14 Å to the graphene surface relative to their ground state geometry, while the amine group moves away (Δ (N⋯GrNP) = +0.07 Å)), so that the relative position of the DAQ becomes more tilted. The internal geometry of the DAQ also changes slightly, e.g. the C
O bonds, where they change from 1.206 Å and 1.208 Å in the ground state to 1.242 Å and 1.244 Å in the S1 state. These changes also affect the hexagonal ring configuration, in particular the C–C bond to which the carbonyl groups are attached. Namely, from 1.553 Å the bond length is shorten to 1.505 Å. The relative position of DAQ with respect to the plane of graphene also changes, with the O atoms of the carbonyl groups approaching the graphene from 3.14 Å and 3.15 Å to 2.84 Å and 2.85 Å while the distance of NH2 from the plane of graphene remains almost unchanged (3.51 Å). After geometric optimization, the absorption wavelength of S1 also changes significantly to 651 nm. The charge transfer value obtained during vertical excitation also jumps enormously, from −0.034 e to −0.736 e, clearly suggesting that during geometry relaxation the localized excitation character on the GrNP diminishes and the CT-type excitation character increases. Since the geometry deformation for DAQ in the S1 excited state is significant compared to the ground state geometry, the method used for DA to determine the fluorescence rate in the framework of the harmonic oscillator approach is no longer valid. Therefore, in this case, neither the fluorescence rate nor the lifetime was computed; (ii) S2 – S2 is considered mostly locally excited state on DAQ, where an additional slight charge transfer occurs from the DAQ to the graphene surface. Geometry optimization with the root following constrain leads to a slight detachment of carbonyl groups, from 3.14 Å and 3.19 Å to 3.19 Å and 3.26 Å, respectively. The equilibrium geometry will also be S1 as the final state order, but this S1 state is only a local minimum compared to the geometry obtained in the previous S1 state optimization, with a conformational energy difference of 1.404 kcal mol−1. Also, the geometry changes observed in the DAQ are more typical to the S1 equilibrium geometry of the isolated DAQ, i.e. the length of the C–C bond from the six-membered ring, which includes the carbonyl groups, is not shortened but stretched, from 1.553 Å to 1.616 Å. The amount of transferred charge remains unchanged, namely +0.050 e transferred from DAQ to the graphene surface. (iii) S3 – considering the root following condition, the geometry optimization of the S3 state leads to the same equilibrium geometry as found for S1. For geometry relaxation and charge transfer effects, see the results presented for the S1 case; (iv) S16 – for this case, it was found that the carbonyl groups move closer (Δ (O⋯GrNP) = −0.14 Å to the graphene surface relative to their ground state geometry, while the amine group moves away (Δ (N⋯GrNP) = +0.07 Å)), so that the relative position of the DAQ becomes more tilted. The internal geometry of the DAQ also changes slightly, e.g. the C![[double bond, length as m-dash]](https://www.rsc.org/images/entities/char_e001.gif) O bonds slightly increase (≈0.02 Å) and the C–C bond from the hexagonal ring containing these carbonyl groups decreases by the same difference. Furthermore, the amount of transferred charge decreases from −0.698 e to −0.324 e and the final order of the excited state is the 14th; (v) S18 – the equilibrium geometry is identical to that found for S16, the value of the transferred charge is similarly reduced from −0.756 e to −0.315 e, and the final order of the excited state is also the 14th; (vi) S21 – the only change compared to the previous two cases is that, like the carbonyl groups, the amine group is come closer to the surface, but the trend is similar. Namely, the transferred charge decreases from −0.799 e to −0.473 e, and the final order of the state becomes the 18th.
O bonds slightly increase (≈0.02 Å) and the C–C bond from the hexagonal ring containing these carbonyl groups decreases by the same difference. Furthermore, the amount of transferred charge decreases from −0.698 e to −0.324 e and the final order of the excited state is the 14th; (v) S18 – the equilibrium geometry is identical to that found for S16, the value of the transferred charge is similarly reduced from −0.756 e to −0.315 e, and the final order of the excited state is also the 14th; (vi) S21 – the only change compared to the previous two cases is that, like the carbonyl groups, the amine group is come closer to the surface, but the trend is similar. Namely, the transferred charge decreases from −0.799 e to −0.473 e, and the final order of the state becomes the 18th.
4 Conclusions
In the present work, the equilibrium geometry structures and light absorption properties of the dopamine (DA) and dopamine-o-quinone (DAQ) adsorbed on the graphene surface has been investigated using the ground state and linear-response time-dependent density functional theories. Two types of graphene nanostructures were considered, one of them with optimized C–C bond length as the model system for graphene nanoparticles (GrNP), while the second being a similar system but with fixed C–C bond length (1.42 Å) as the model system for graphene 2D sheet (GrS). For both the GrNP and GrS model systems, the theoretical UV-Vis spectra show a more intense peak around 270 nm, which is consistent with the experimental results and is due to higher electronic transitions. It has been shown that the simplified graphene model consists in a finite-dimensional aromatic hydrocarbon system with discrete electronic states, can reproduce the main features of the experimental UV spectrum of graphene and, as a surface model, can act as a proper environment in interaction with the adsorbed molecules. Analyzing the natural difference orbital profiles characteristic for the vertical electronic excitation three types of electronic transitions were observed in the cases of graphene–DA and graphene–DAQ binary complexes. Namely, locally excited on graphene, locally excited on the molecule and charge transfer (CT) states characteristic for the charge migration induced by the excitation. For CT states, two different types of states have been identified, one when the charge is transferred from the molecule to the surface, called molecule-to-surface CT (or MSCT), and the other when the transfer occurs from the surface to the molecule, called surface-to-molecule CT (or SMCT). MSCT is characteristic of DA, while SMCT is characteristic of DAQ, and the difference between the two cases are given by the presence of an energetically low-lying unoccupied orbital (LUMO+1) that allows charge transfer from the surface to the molecule in the case of DAQ. Analyzing the spectral profiles of the UV-Vis absorption spectra, it was found that, the fingerprints of excited electronic states associated with the adsorbed molecules on the graphene surface cannot be seen in the spectrum, as they are mostly suppressed by the characteristically broad spectral shape of graphene, which is given by the lower-lying (typically the first ten) electronically excited states. As far as the relaxation dynamics of the excited states are concerned, two different scenarios were obtained for the two molecules, DA and DAQ. In the case of DA, it is observed that the molecule itself does not suffer any geometric change after the electronic excitation, only its relative position with respect to the surface changes and, of course, the quality of the CT states. The opposite effect is true for DAQ, that is, the ground-state geometry of DAQ changes substantially during the geometry relaxation of locally-DAQ and CT-type excited states. This different behavior is possible because the hydroxyl groups in the dopamine molecule have been replaced by carbonyls.Conflicts of interest
There are no conflicts to declare.Acknowledgements
This research was funded by the UEFISCDI public institution under the Romanian Ministry of Education, project code: PN-III-P4-ID-PCE-2020-0770. We are also grateful for the financial support from Romanian Ministry of Research, Innovation and Digitization through Programme 1 – Development of the National Research and Development System, Subprogram 1.2 – Institutional Performance – Funding Projects for Excellence in RDI, contract no. 37PFE/30.12.2021. The authors thank INCDTIM, Cluj-Napoca Data Center, for providing computer facilities.Notes and references
- J. T. Yates and H. Petek, Chem. Rev., 2006, 106, 4113–4115 CrossRef CAS.
- Y. Matsumoto, Bull. Chem. Soc. Jpn., 2007, 80, 842–855 CrossRef CAS.
- C. Sousa, S. Tosoni and F. Illas, Chem. Rev., 2013, 113, 4456–4495 CrossRef CAS PubMed.
- J. Zhao, M. Feng, D. B. Dougherty, H. Sun and H. Petek, ACS Nano, 2014, 8, 10988–10997 CrossRef CAS PubMed.
- J. L. Gray, The Physics of the Solar Cell, John Wiley & Sons, Ltd, 2010, pp. 82–129 Search PubMed.
- S. M. Brülls, V. Cantatore, Z. Wang, P. L. Tam, P. Malmberg, J. Stubbe, B. Sarkar, I. Panas, J. Mårtensson and S. Eigler, Chem. – Eur. J., 2020, 26, 6694–6702 CrossRef PubMed.
- C. Frischkorn and M. Wolf, Chem. Rev., 2006, 106, 4207–4233 CrossRef CAS PubMed.
- T. L. Thompson and J. T. Yates, Chem. Rev., 2006, 106, 4428–4453 CrossRef CAS PubMed.
- Á. Morales-García, F. Viñes, C. Sousa and F. Illas, J. Phys. Chem. Lett., 2023, 14, 3712–3720 CrossRef PubMed.
- Q. Guo, C. Zhou, Z. Ma, Z. Ren, H. Fan and X. Yang, Ann. Rev. Phys. Chem., 2018, 69, 451–472 CrossRef CAS PubMed.
- K. Sharma, V. Sharma and S. S. Sharma, Nanoscale Res. Lett., 2018, 13, 381 CrossRef PubMed.
- J. Kramer, S. Soukiazian, S. Mahoney and J. Hicks-Garner, J. Power Sources, 2012, 210, 122–128 CrossRef CAS.
- N. N. Sakhadeo and T. U. Patro, Ind. Eng. Chem. Res., 2022, 61, 5366–5387 CrossRef CAS.
- A. Bandyopadhyay, K. D. Traxel and S. Bose, Mater. Sci. Eng., R, 2021, 145, 100609 CrossRef PubMed.
- Y. Wang, G. Zheng, N. Jiang, G. Ying, Y. Li, X. Cai, J. Meng, L. Mai, M. Guo, Y. S. Zhang and X. Zhang, Nat. Rev. Methods Primers, 2023, 3, 68 CrossRef CAS.
- H. Lee, S. M. Dellatore, W. M. Miller and P. B. Messersmith, Science, 2007, 318, 426–430 CrossRef CAS PubMed.
- J. H. Ryu, P. B. Messersmith and H. Lee, ACS Appl. Mater. Interfaces, 2018, 10, 7523–7540 CrossRef CAS PubMed.
- J. Liebscher, R. Mrówczyński, H. A. Scheidt, C. Filip, N. D. Hădade, R. Turcu, A. Bende and S. Beck, Langmuir, 2013, 29, 10539–10548 CrossRef CAS PubMed.
- Q. Lyu, N. Hsueh and C. L. L. Chai, Polym. Chem., 2019, 10, 5771–5777 RSC.
- Y. Ding, L.-T. Weng, M. Yang, Z. Yang, X. Lu, N. Huang and Y. Leng, Langmuir, 2014, 30, 12258–12269 CrossRef CAS PubMed.
- V. Ball, Front. Bioeng. Biotechnol., 2018, 6, 109 CrossRef PubMed.
- H. A. Lee, E. Park and H. Lee, Adv. Mater., 2020, 1907505 CrossRef CAS PubMed.
- K. Lee, M. Park, K. G. Malollari, J. Shin, S. M. Winkler, Y. Zheng, J. H. Park, C. P. Grigoropoulos and P. B. Messersmith, Nat. Commun., 2020, 11, 4848 CrossRef CAS PubMed.
- D. Aguilar-Ferrer, J. Szewczyk and E. Coy, Catal. Today, 2022, 397–399, 316–349 CrossRef CAS.
- Z. Qin, D. Li, Y. Ou, S. Du, Q. Jiao, J. Peng and P. Liu, Crystals, 2023, 13, 976 CrossRef CAS.
- M. L. Alfieri, L. Panzella and A. Napolitano, Eur. J. Org. Chem., 2024, e202301002 CrossRef CAS.
- M. L. Mueller, X. Yan, J. A. McGuire and L. S. Li, Nano Lett., 2010, 10, 2679–2682 CrossRef CAS PubMed.
- S. Kaniyankandy, S. N. Achary, S. Rawalekar and H. N. Ghosh, J. Phys. Chem. C, 2011, 115, 19110–19116 CrossRef CAS.
- F. R. Baptista, S. A. Belhout, S. Giordani and S. J. Quinn, Chem. Soc. Rev., 2015, 44, 4433–4453 RSC.
- V. Strauss, R. A. S. er, F. Hauke, A. Hirsch and D. M. Guldi, J. Am. Chem. Soc., 2015, 137, 13079–13086 CrossRef CAS PubMed.
- S. Zhu, Y. Song, J. Wang, H. Wan, Y. Zhang, Y. Ning and B. Yang, Nano Today, 2017, 13, 10–14 CrossRef CAS.
- X.-M. Huang, L.-Z. Liu, S. Zhou and J.-J. Zhao, Front. Phys., 2020, 15, 33301 CrossRef.
- A. Pandikumar, G. T. S. How, T. P. See, F. S. Omar, S. Jayabal, K. Z. Kamali, N. Yusoff, A. Jamil, R. Ramaraj, S. A. John, H. N. Lim and N. M. Huang, RSC Adv., 2014, 4, 63296–63323 RSC.
- Y. Luo, L. Ma, X. Zhang, A. Liang and Z. Jiang, Nanoscale Res. Lett., 2015, 10, 230 CrossRef PubMed.
- Z. Hsine, R. Mlika, N. Jaffrezic-Renault and H. Korri-Youssoufi, Chemosensors, 2022, 10, 249 CrossRef CAS.
- M. Abrantes, D. Rodrigues, T. Domingues, S. S. Nemala, P. Monteiro, J. Borme, P. Alpuim and L. Jacinto, J. Nanobiotechnol., 2022, 20, 495 CrossRef CAS PubMed.
- M. Chatterjee, P. Nath, S. Kadian, A. Kumar, V. Kumar, P. Roy, G. Manik and S. Satapathi, Sci. Rep., 2022, 12, 9061 CrossRef CAS PubMed.
- C. Silva, F. Simon, P. Friedel, P. Pötschke and C. Zimmerer, Nanomaterials, 2019, 9, 902 CrossRef CAS PubMed.
- P. S. Kasbe, H. Gade, S. Liu, G. G. Chase and W. Xu, ACS Appl. Bio Mater., 2021, 4, 5180–5188 CrossRef CAS PubMed.
- W. Li, W. Yang, M. Wu, M. Zhao and X. Lu, Electrochim. Acta, 2022, 426, 140776 CrossRef CAS.
- L. Zhou, Y. Zong, Z. Liu and A. Yu, Renewable Energy, 2016, 96, 333–340 CrossRef CAS.
- A. Jedrzak, T. Rebiś, M. Nowicki, K. Synoradzki, R. Mrówczyński and T. Jesionowski, Appl. Surf. Sci., 2018, 455, 455–464 CrossRef CAS.
- F. Vulcano, A. Kovtun, C. Bettini, Z. Xia, A. Liscio, F. Terzi, A. Heras, A. Colina, B. Zanfrognini, M. Melucci, V. Palermo and C. Zanardi, 2D Mater., 2020, 7, 024007 CrossRef CAS.
- R. Mrówczyński, A. Bunge and J. Liebscher, Chem. – Eur. J., 2014, 20, 1–8 CrossRef PubMed.
- D.-D. Wang, X. Gao, L. Zhao, J. Zhou, S. Zhuo, Z. Yan and W. Xing, RSC Adv., 2018, 8, 16044–16051 RSC.
- D. Damberga, V. Fedorenko, K. Grundšteins, S. Altundal, A. Šutka, A. Ramanavićius, E. Coy, R. Mrówczyński, I. Iatsunskyi and R. Viter, Nanomaterials, 2020, 10, 2438 CrossRef CAS PubMed.
- R. Mrówczyński, ACS Appl. Mater. Interfaces, 2018, 10, 7541–7561 CrossRef PubMed.
- X. Xie, C. Mao, X. Liu, L. Tan, Z. Cui, X. Yang, S. Zhu, Z. Li, X. Yuan, Y. Zheng, K. W. K. Yeung, P. K. Chu and S. Wu, ACS Cent. Sci., 2018, 4, 724–738 CrossRef CAS PubMed.
- C. Wu, X. Guan, J. Xu, Y. Zhang, Q. Liu, Y. Tian, S. Li, X. Qin, H. Yang and Y. Liu, Biomaterials, 2019, 205, 106–119 CrossRef CAS PubMed.
- S. Mei, X. Xu, R. D. Priestley and Y. Lu, Chem. Sci., 2020, 11, 12269–12281 RSC.
- I. Zmerli, J.-P. Michel and A. Makky, Multifunct. Mater., 2021, 4, 022001 CrossRef CAS.
- R. Chen, B. Lin and R. Luo, Heliyon, 2022, 8, e12105 CrossRef CAS PubMed.
- M. Wang, B. Li, Y. Du, H. Bu, Y. Tang and Q. Huang, RSC Adv., 2021, 11, 8420–8429 RSC.
- A. Falamas, A. Petran, A.-M. Hada and A. Bende, Int. J. Mol. Sci., 2022, 23, 5483 CrossRef CAS PubMed.
- K. Hirata, K.-I. Kasai, K. Yoshizawa, G. Grégoire, S.-I. Ishiuchi and M. Fujii, Phys. Chem. Chem. Phys., 2022, 24, 10737–10744 RSC.
- S. Chopra and L. Maidich, RSC Adv., 2014, 4, 50606–50613 RSC.
- H. Vovusha and B. Sanyal, RSC Adv., 2015, 5, 4599–4608 RSC.
- E. Gruber, R. A. Wilhelm, R. Pétuya, V. Smejkal, R. Kozubek, A. Hierzenberger, B. C. Bayer, I. Aldazabal, A. K. Kazansky, F. Libisch, A. V. Krasheninnikov, M. Schleberger, S. Facsko, A. G. Borisov, A. Arnau and F. Aumayr, Nat. Commun., 2016, 7, 13948 CrossRef CAS PubMed.
- Y. Miyamoto and A. Rubio, J. Phys. Soc. Jpn., 2018, 87, 041016 CrossRef.
- M. Cayambe, C. Zambrano, T. Tene, M. Guevara, G. T. Usca, H. Brito, R. Molina, D. Coello-Fiallos, L. S. Caputi and C. V. Gomez, Mater. Today: Proc., 2021, 37, 4027–4030 CAS.
- M. A. Jabed, J. Zhao, D. Kilin and T. Yu, J. Phys. Chem. C, 2021, 125, 14979–14990 CrossRef CAS.
- S. Özönder, C. Ünlü, C. Güleryüz and L. Trabzon, ACS Omega, 2023, 8, 2112–2118 CrossRef PubMed.
- P. P. Fehér, Á. Madarász and A. Stirling, Chem. Methods, 2023, 3, e202200069 CrossRef.
- N. A. Besley, Chem. Phys. Lett., 2004, 390, 124–129 CrossRef CAS.
- N. A. Besley and A. J. Blundy, J. Phys. Chem. B, 2006, 110, 1701–1710 CrossRef CAS PubMed.
- A. D. Laurent, C. Adamo and D. Jacquemin, Phys. Chem. Chem. Phys., 2014, 16, 14334–14356 RSC.
- J. M. Herbert, X. Zhang, A. F. Morrison and J. Liu, Acc. Chem. Res., 2016, 49, 931–941 CrossRef CAS PubMed.
- N. S. Hill and M. L. Coote, in Annu. Rep. Comput. Chem., ed. D. A. Dixon, Elsevier, 2019, vol. 15, pp. 203–285 Search PubMed.
- M. Coros, F. Pogăcean, L. Măgerusan, M.-C. Roşu, A. S. Porav, C. Socaci, A. Bende, R.-I. Stefan-van Staden and S. Pruneanu, Sens. Actuators, B, 2018, 256, 665–673 CrossRef CAS.
- J.-D. Chai and M. Head-Gordon, Phys. Chem. Chem. Phys., 2008, 10, 6615–6620 RSC.
- S. Grimme, J. Antony, S. Ehrlich and H. Krieg, J. Chem. Phys., 2010, 132, 154104 CrossRef PubMed.
- S. Grimme, S. Ehrlich and L. Goerigk, J. Comput. Chem., 2011, 32, 1456–1465 CrossRef CAS PubMed.
- F. Weigend and R. Ahlrichs, Phys. Chem. Chem. Phys., 2005, 7, 3297–3305 RSC.
- F. Neese, Wiley Interdiscip. Rev.: Comput. Mol. Sci., 2022, 12, e1606 Search PubMed.
- F. Neese, F. Wennmohs, U. Becker and C. Riplinger, J. Chem. Phys., 2020, 152, 224108 CrossRef CAS PubMed.
- S. Hirata and M. Head-Gordon, Chem. Phys. Lett., 1999, 314, 291–299 CrossRef CAS.
- F. Neese, F. Wennmohs, A. Hansen and U. Becker, Chem. Phys., 2009, 356, 98–109 CrossRef CAS.
- F. Weigend, Phys. Chem. Chem. Phys., 2006, 8, 1057–1065 RSC.
- A. Hellweg, C. Hättig, S. Höfener and W. Klopper, Theor. Chem. Acc., 2007, 117, 587–597 Search PubMed.
- H. Li and J. H. Jensen, Theor. Chem. Acc., 2002, 107, 211–219 Search PubMed.
- B. de Souza, F. Neese and R. Izsák, J. Chem. Phys., 2018, 148, 034104 CrossRef PubMed.
- Q. Peng, Y. Yi, Z. Shuai and J. Shao, J. Chem. Phys., 2007, 126, 114302 CrossRef PubMed.
- R. R. Valiev, V. Cherepanov, R. Nasibullin, D. Sundholm and T. Kurtén, Phys. Chem. Chem. Phys., 2019, 21, 18495–18500 RSC.
- T. Lu and F. Chen, J. Comput. Chem., 2012, 33, 580–592 CrossRef CAS PubMed.
- A.-R. Allouche, J. Comput. Chem., 2011, 32, 174–182 CrossRef CAS PubMed.
- M. D. Hanwell, D. E. Curtis, D. C. Lonie, T. Vandermeersch, E. Zurek and G. R. Hutchison, J. Cheminf., 2012, 4, 17 CAS.
- R. Dennington, T. Keith and J. Millam, Gaussview 6.1.1, Semichem Inc., Shawnee Mission, KS, 2009 Search PubMed.
- A. H. Castro-Neto, F. Guinea, N. M. R. Peres, K. S. Novoselov and A. K. Geim, Rev. Mod. Phys., 2009, 81, 109–162 CrossRef CAS.
- L. Khalafi, M. Rafiee and S. Fathi, Spectrochim. Acta, Part A, 2014, 118, 695–701 CrossRef CAS PubMed.
- K. F. Mak, M. Y. Sfeir, Y. Wu, C. H. Lui, J. A. Misewich and T. F. Heinz, Phys. Rev. Lett., 2008, 101, 196405 CrossRef PubMed.
- K. F. Mak, L. Ju, F. Wang and T. F. Heinz, Solid State Commun., 2012, 152, 1341–1349 CrossRef CAS.
- L. Yang, J. Deslippe, C.-H. Park, M. L. Cohen and S. G. Louie, Phys. Rev. Lett., 2009, 103, 186802 CrossRef PubMed.
- P. E. Trevisanutto, M. Holzmann, M. Côté and V. Olevano, Phys. Rev. B: Condens. Matter Mater. Phys., 2010, 81, 121405 CrossRef.
- R. Denk, M. Hohage, P. Zeppenfeld, J. Cai, C. A. Pignedoli, H. Söde, R. Fasel, X. Feng, K. Müllen, S. Wang, D. Prezzi, A. Ferretti, A. Ruini, E. Molinari and P. Ruffieux, Nat. Commun., 2014, 5, 4253 CrossRef CAS PubMed.
- Y. Ge and T. S. Fisher, Front. Nanotechnol., 2022, 4, 999292 CrossRef.
- S. Kim, S. W. Hwang, M.-K. Kim, D. Y. Shin, D. H. Shin, C. O. Kim, S. B. Yang, J. H. Park, E. Hwang, S.-H. Choi, G. Ko, S. Sim, C. Sone, H. J. Choi, S. Bae and B. H. Hong, ACS Nano, 2012, 6, 8203–8208 CrossRef CAS PubMed.
- Z. Jin, P. Owour, S. Lei and L. Ge, Curr. Opin. Colloid Interface Sci., 2015, 20, 439–453 CrossRef CAS.
- X. E. Zhao, C. H. Lei, Y. H. Wang, F. Qu, S. Y. Zhu, H. Wang and J. M. You, RSC Adv., 2016, 6, 72670–72675 RSC.
- D. K. Rai and A. Shukla, Sci. Rep., 2019, 9, 7958 CrossRef PubMed.
- T. Tasnim, M. J. Ayodele and S. P. Pitre, J. Org. Chem., 2022, 87, 10555–10563 CrossRef CAS PubMed.
- S. Kümmel, Adv. Energy Mater., 2017, 7, 1700440 CrossRef.
- N. T. Maitra, Annu. Rev. Phys. Chem., 2022, 73, 117–140 CrossRef CAS PubMed.
- D. Mester and M. Kállay, J. Chem. Theory Comput., 2022, 18, 1646–1662 CrossRef CAS PubMed.
- J. M. Herbert, Phys. Chem. Chem. Phys., 2024, 26, 3755–3794 RSC.
- J. Liang, X. Feng, D. Hait and M. Head-Gordon, J. Chem. Theory Comput., 2022, 18, 3460–3473 CrossRef CAS PubMed.
- P. Avouris and B. N. J. Persson, J. Phys. Chem., 1984, 88, 837–848 CrossRef CAS.
- H. Petek, J. Chem. Phys., 2012, 137, 091704 CrossRef PubMed.
- G. Floß, G. Granucci and P. Saalfrank, J. Chem. Phys., 2012, 137, 234701 CrossRef PubMed.
- H.-T. Chen, J. Chen, D. V. Cofer-Shabica, Z. Zhou, V. Athavale, G. Medders, M. F. S. J. Menger, J. E. Subotnik and Z. Jin, J. Chem. Theory Comput., 2022, 18, 3296–3307 CrossRef CAS PubMed.
- S. Chen, N. Ullah, Y. Zhao and R. Zhang, ChemPhysChem, 2019, 20, 1–6 CrossRef.
- W. Ouyang, W. Dou and J. E. Subotnik, J. Chem. Phys., 2015, 142, 084109 CrossRef PubMed.
- W. Dou, A. Nitzan and J. E. Subotnik, J. Chem. Phys., 2015, 142, 084110 CrossRef PubMed.
- W. Dou, A. Nitzan and J. E. Subotnik, J. Chem. Phys., 2015, 142, 234106 CrossRef PubMed.
- W. Dou, A. Nitzan and J. E. Subotnik, J. Chem. Phys., 2015, 143, 189902 CrossRef PubMed.
- J. Chen, Z. Jin, W. Dou and J. Subotnik, J. Phys. Chem. C, 2021, 125, 2884–2899 CrossRef CAS.
- Z. Jin and J. E. Subotnik, J. Chem. Theory Comput., 2021, 17, 614–626 CrossRef CAS PubMed.
- A. Bende, A.-A. Farcas, A. Falamas and A. Petran, Phys. Chem. Chem. Phys., 2022, 24, 29165–29175 RSC.
- A. Bende and A.-A. Farcas, Int. J. Mol. Sci., 2023, 24, 2906 CrossRef CAS PubMed.
- C. H. Lui, K. F. Mak, J. Shan and T. F. Heinz, Phys. Rev. Lett., 2010, 105, 127404 CrossRef PubMed.
- J. Wang, S. Cao, Y. Ding, F. Ma, W. Lu and M. Sun, Sci. Rep., 2016, 6, 24850 CrossRef CAS PubMed.
Footnote |
| † Electronic supplementary information (ESI) available. See DOI: https://doi.org/10.1039/d4cp00432a |
| This journal is © the Owner Societies 2024 |

