Enthalpies and entropies of hydration from Monte Carlo simulations
Received
22nd January 2024
, Accepted 22nd February 2024
First published on 23rd February 2024
Abstract
The changes in free energy, enthalpy, and entropy for transfer of a solute from the gas phase into solution are the fundamental thermodynamic quantities that characterize the solvation process. Owing to the development of methods based on free-energy perturbation theory, computation of free energies of solvation has become routine in conjunction with Monte Carlo (MC) statistical mechanics and molecular dynamics (MD) simulations. Computation of the enthalpy change and by inference the entropy change is more challenging. Two methods are considered in this work corresponding to direct averaging for the solvent and solution and to computing the temperature derivative of the free energy in the van’t Hoff approach. The application is for neutral organic solutes in TIP4P water using long MC simulations to improve precision. Definitive results are also provided for pure TIP4P water. While the uncertainty in computed free energies of hydration is ca. 0.05 kcal mol−1, it is ca. 0.4 kcal mol−1 for the enthalpy changes from either van’t Hoff plots or the direct method with sampling for 5 billion MC configurations. Partial molar volumes of hydration are also computed by the direct method; they agree well with experimental data with an average deviation of 3 cm3 mol−1. In addition, the results permit breakdown of the errors in the free energy changes from the OPLS-AA force field into their enthalpic and entropic components. The excess hydrophobicity of organic solutes is enthalpic in origin.
Introduction
For the equilibration of a solute between the gas phase and solution at constant temperature and pressure, the Gibbs equation (eqn (1)) applies where ΔGsol, ΔHsol, ΔSsol, ΔEsol and ΔVsol are the changes in free energy, enthalpy, entropy, internal energy, and volume upon solvation. For| | | ΔGsol = ΔHsol − TΔSsol = ΔEsol + PΔVsol − TΔSsol | (1) |
simulations of organic and biomolecular systems in solution, it is important that the accuracy of the modeling procedures and the description of the molecular energetics through force fields be tested in computing these properties for prototypical systems. Fortunately, it was found in the 1980s that precise free energy changes could be computed using Monte Carlo (MC) or molecular dynamics (MD) simulations in conjunction with thermodynamic integration (TI) or free-energy perturbation theory (FEP).1–7 The solvent of greatest interest is water, and some studies have provided FEP results for free energies of hydration (ΔGhyd) for large collections of organic molecules.8–14
In contrast, few precise results have been computed for enthalpies and entropies of hydration, though such information would be very valuable in understanding the sources of errors for ΔGhyd. The two key computational approaches in this case are a “direct” calculation viaeqn (2) or by using eqn (3) or equivalently the van’t Hoff relationship in eqn (4) where ΔGsol = −RT![[thin space (1/6-em)]](https://www.rsc.org/images/entities/char_2009.gif) lnK.
lnK.
| | | ΔHsol = 〈HN+A〉 − 〈HN〉 − 〈HA〉 | (2) |
| | | ΔGsol/T = ΔHsol/T − ΔSsol | (3) |
| | | lnK = −ΔHsol/RT + ΔSsol/R | (4) |
To apply
eqn (2), MC or MD simulations are run for the solute A in solution with
N solvent molecules, the pure solvent with
N molecules, and the solute in the gas phase where the 〈
x〉 is the configurational average for
x in the isothermal isobaric (NPT) ensemble. The problem with this approach is that for an aqueous solution the first two averages in
eqn (2) are
ca. −10 ×
N kcal mol
−1. Thus, for
N > 100, long simulations are required to obtain acceptable precision for their difference. Alternatively,
eqn (3) and (4) require precise computation of Δ
Gsol at several temperatures in order to obtain Δ
Hsol from the slope of plots of Δ
Gsol/
T or ln
K
vs. 1/
T. In view of the computational demands, calculations of this type remain rare and did not begin to be reported until more than ten years after the introduction of molecular FEP calculations.
1 Pioneering efforts were made by Gallichio and Levy, who applied the van’t Hoff or “finite difference” approach in MD simulations for ten small, neutral molecules in TIP3P water at three temperatures.
15,16 They showed that enthalpy and entropy results could be obtained “with an uncertainty on the order of 1 kcal mol
−1”.
15 Subsequently, there was a related MD study by Wan
et al. for two solutes, methylamine and
N-methylacetaamide, in TIP3P water that supported the viability of the van’t Hoff approach.
17 Carlsson and Åqvist then applied the method to ion hydration,
18,19 while the Åqvist group moved on to seminal applications for enzyme kinetics.
20–25 The temperature dependence of the hydration of alkanes in a united-atom format has also received attention,
26 though, as illustrated below, obtaining good linearity for van’t Hoff plots is difficult for small enthalpy changes.
With this background, the present study was carried out to test the current viability of the direct and van’t Hoff methods for computing enthalpies and entropies of hydration using long Monte Carlo simulations for organic solutes. In the pre-FEP days, our group and others had tried direct calculations, but found unacceptable precision, e.g., with uncertainties of ca. ±10 kcal mol−1 or more.27 However, this was with 100–200 solvent molecules and averaging for ca. 2 million (2 M) MC configurations. The present work has used 500 water molecules and averaging for 5 billion (5 B) or more configurations. As it is now possible to obtain ΔGaq results from MC/FEP simulations with a precision of ca. ±0.05 kcal mol−1,14,28 the van’t Hoff approach was also applied. In addition, besides providing better understanding of the performance of the utilized OPLS-AA force field, the work complements our prior study of computing volumes of solution by the direct method or from the pressure-dependence of ΔGsol.29
Computational details
All Monte Carlo simulations and free energy perturbation calculations were carried out with the BOSS program using the isothermal–isobaric ensemble at 1 atm.30 Each system consisted of 1 solute molecule plus 500 water molecules in a cube with periodic boundary conditions. The TIP4P model was used for water and the solutes were represented with the latest version of the OPLS-AA force field.31,32 The combining rules for the Lennard–Jones parameters are σij = (σiiσjj)1/2 and εij = (εiiεjj)1/2. The TIP4P water molecules are rigid, while the sampling of the solutes includes all internal degrees of freedom. Standard procedures were followed with attempted changes for the solute and volume every 120 and 3125 configurations, respectively, and with ranges for translations, rotations, and internal coordinate variations chosen to give ca. 40% acceptance rates for new configurations. Interactions between water molecules are truncated at an O–O distance of 10.0 Å, and solute–water interactions are truncated if no intermolecular distance between the water oxygen and non-hydrogen atoms of the solute is less than 10.0 Å; quadratic smoothing is applied over the last 0.5 Å, and a standard correction for Lennard–Jones interactions neglected beyond the cutoff is included.32 After an equilibration of 25 M configurations starting from a stored water box, the MC calculations for the direct method were run in batches of 500 M configurations for a total of 5 B configurations at 25 °C. The FEP calculations to obtain the free energies of hydration were carried out exactly as described previously.32 Absolute free energies of hydration are obtained by annihilating the solute in both the gas phase and in TIP4P water through four FEP calculations for the elimination of the partial charges and the Lennard–Jones interactions. For the aqueous calculations, 20 evenly spaced windows are used, and the total number of MC configurations is 4 B and 10 B for the charge and Lennard–Jones annihilations. The time required to execute 1 B configurations is 7 h on a 3.2-GHz Intel i5-4570 processor. To obtain the van’t Hoff plots, the free-energy calculations were mostly run at four temperatures (15, 25, 35 and 45 °C), which was augmented in some cases with calculations at 20, 30, and 40 °C.
Results for TIP4P water
The precision of the calculations can be addressed by first considering the results for taking the solute as a TIP4P water molecule in solution with 500 TIP4P molecules. For the direct method, a key limitation is the precision for the energy of the solvent box. In Table 1, the computed energy and volume are listed along with their conversion to heat of vaporization and density for four independent runs of 5 B configurations each for the system with 501 TIP4P water molecules. It is found that the mean of the energy is −5040.72 kcal mol−1 with a standard deviation (1σ) of 0.26 kcal mol−1. The computed heat of vaporization (10.654 ± 0.001 kcal mol−1) and density (1.0030 ± 0.0001 g cm−3) are consistent with many prior results including the original report from 1983 (10.66 ± 0.03 kcal mol−1 and 0.999 ± 0.007 g cm−3)31 in spite of differences in the number of water molecules (500 vs. 125) and cutoff distance (10.0 vs. 7.5 Å).
Table 1 Results for liquid TIP4P water (N = 501)a
| Run (5 B) |
Energy |
Volume |
ΔHvap |
Density |
|
Energies in kcal mol−1; volume in Å3; density in g cm−3 at 25 °C and 1 atm.
See ref. 31.
|
| 1 |
−5040.821 |
14942.589 |
10.654 |
1.00286 |
| 2 |
−5040.385 |
14941.301 |
10.653 |
1.00295 |
| 3 |
−5041.077 |
14937.599 |
10.654 |
1.00320 |
| 4 |
−5040.593 |
14942.867 |
10.654 |
1.00284 |
| Mean |
−5040.719 |
14941.089 |
10.654 |
1.00296 |
| Stnd dev |
0.258 |
2.100 |
0.001 |
0.00014 |
| Exptb |
|
|
10.51 |
0.997 |
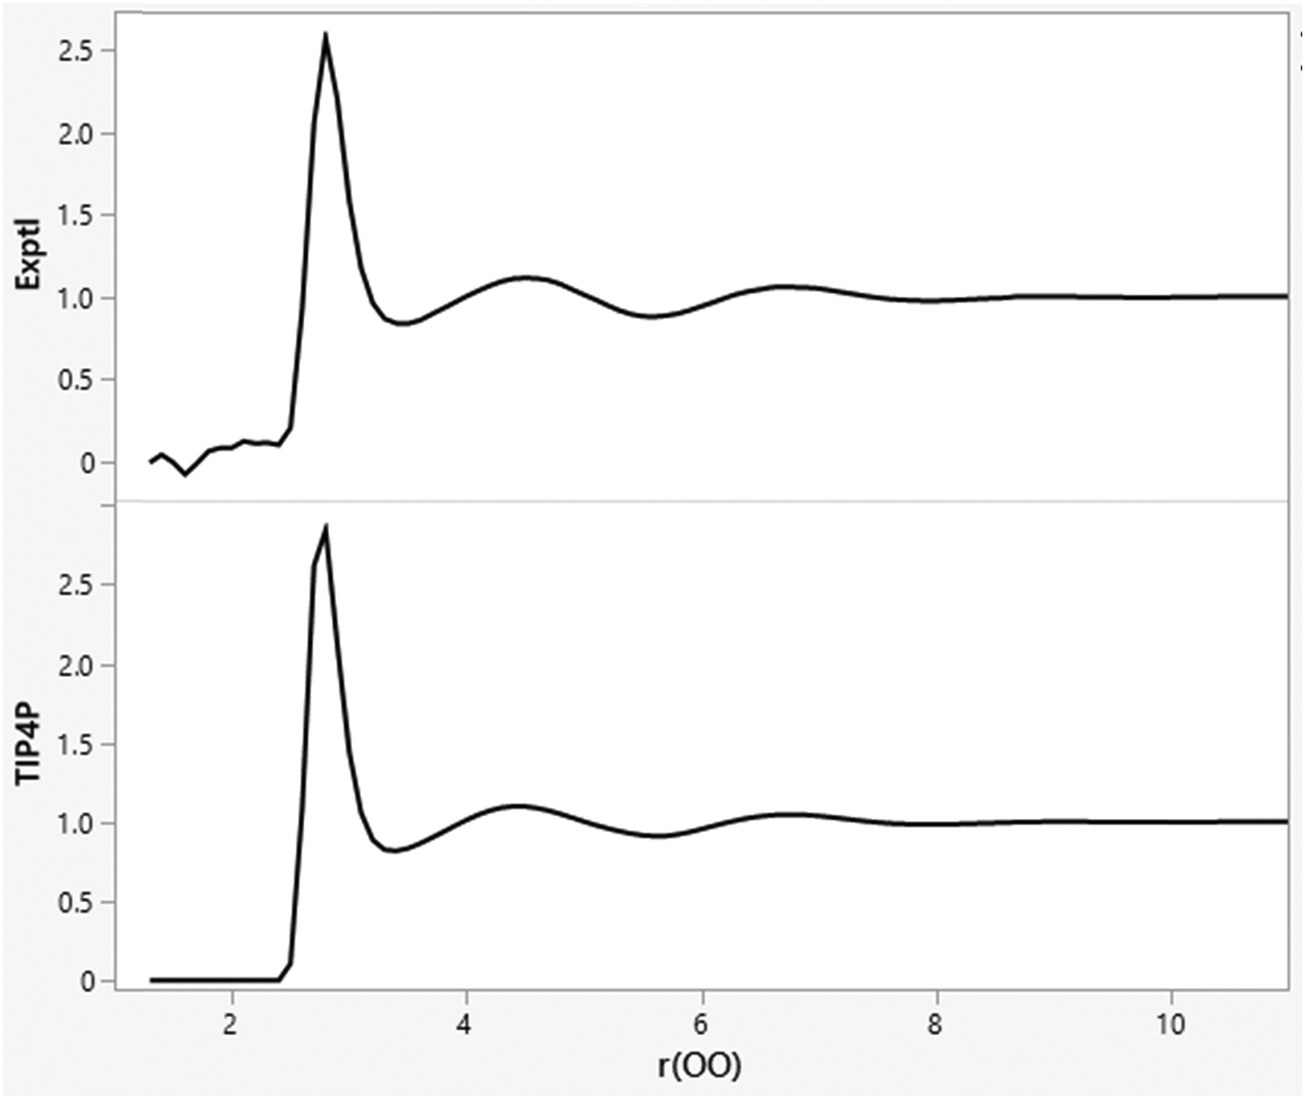
The minimal dependence of the energy and density for such water models with spherical cutoff distances beyond ca. 7 Å is reexamined in Table 2 with averaging for 1 B configurations. The results for cutoffs of 7 to 11.5 Å are not far from the statistical noise level, while a cutoff of 12.0 Å is likely too long given that the box edge length, which averages 24.6 Å, is fluctuating. This pattern been known for 40 years,33–35 and is related to the fact that the OO, OH, and HH radial distribution functions for water at 25 °C and 1 atm are flat (g = 1.0) beyond 8 Å, as illustrated in Fig. 1 for gOO.36,37 The orientations of water molecules separated by more than 8 Å are not correlated. There is no spatial ordering or net electrostatic interaction that is lost by using a cutoff of 8–10 Å. Thus, there is no need for treatments such as Ewald sums for electrostatic interactions beyond such cutoffs in simulations of small, neutral solutes with water models like TIP4P. Similarly, there is no need for treatments of neglected electrostatic interactions beyond 8 Å in simulations for other pure organic liquids such as ethanol.32
Table 2 Cutoff dependence of results for liquid TIP4P water (N = 501)a
| Cutoff (Å) |
Energy |
Volume |
ΔHvap |
Density |
|
Energies in kcal mol−1; volume in Å3; density in g cm−3. Results at 25 °C and 1 atm. for averaging for 1 B Monte Carlo configurations except 5 B for cutoff = 10.0 Å.
See ref. 31.ΔHvap = −energy/N + RT (ref. 35). |
| 7.0 |
−5047.60 |
15094.41 |
10.667 |
0.99293 |
| 8.0 |
−5043.03 |
15056.91 |
10.658 |
0.99541 |
| 9.0 |
−5027.39 |
14978.71 |
10.627 |
1.00060 |
| 10.0 |
−5041.09 |
14947.37 |
10.654 |
1.00252 |
| 11.0 |
−5030.30 |
15034.18 |
10.633 |
0.99681 |
| 11.5 |
−5023.28 |
15055.02 |
10.619 |
0.99553 |
| 12.0 |
−5014.14 |
15060.41 |
10.601 |
0.99518 |
| Exptb |
|
|
10.51 |
0.997 |
 |
| | Fig. 1 Experimental (top; ref. 36) and TIP4P (bottom) oxygen–oxygen radial distribution functions (gOO) for liquid water at 25 °C and 1 atm. The computed results are from an MC simulation with 11.5 Å O–O cutoffs. The gOO curves are flat beyond 8 Å. | |
Turning to the free energy, the current procedure yielded −6.190 ± 0.035 kcal mol−1 for TIP4P water at 25 °C and 1 atmosphere. The uncertainty was obtained from the batch means procedures with batch sizes of 50 M configurations. The experimental value is −6.324 kcal mol−1 for H2O.38 As in prior work,15–19 the standard-state convention of Ben–Naim and Marcus is used such that the gas is ideal and the gas-phase and solution concentrations are the same.38 This removes the need for a pressure-volume term in computing the heats of solution. The computed free-energy result is in agreement with the other highly precise MC result of −6.22 ± 0.02 kcal mol−1 that involved twice as much averaging in each window and 10 replicas.28 It is also notably consistent with the first free-energy result for TIP4P water that was reported in 1989 (−6.06 ± 0.3 kcal mol−1),4 which used 216 water molecules and 8.5 Å cutoffs. Subsequently, an MD value of −6.11 ± 0.03 kcal mol−1 was reported in 2005, which used 900 water molecules, 7.5 Å cutoffs, and Ewald corrections.39 Further consistent MD results have been published.40–42
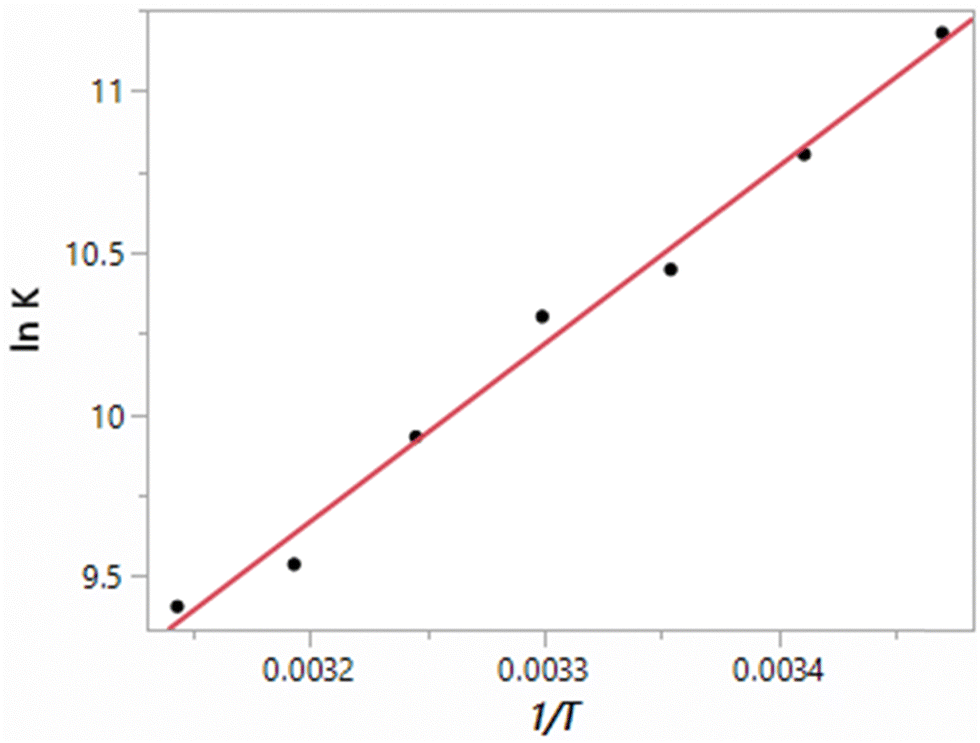
The results obtained here for the free energy, heat of vaporization and density of TIP4P water at seven temperatures from 15 °C to 45 °C at 1 atm are listed in Table 3. The resulting van’t Hoff plot for the free-energy results is shown in Fig. 2. The fit to a line shows good linearity over this temperature range with a correlation coefficient r2 = 0.9900. The slope yields a ΔH of −10.93 kcal mol−1, and in combination with the ΔG of −6.19 kcal mol−1, −TΔS is 4.74 ± 0.3 kcal mol−1. However, focusing around 25 °C, if the five points from 15 to 35 °C are used, ΔH and −TΔS values of −10.64 kcal mol−1 and 4.45 kcal mol−1 are obtained with an r2 of 0.9858. From the alternative linear fits and considering the uncertainties in the individual ΔG results, the uncertainty in the computed enthalpies is ca. 0.4 kcal mol−1. For comparison, the experimental ΔH and −TΔS values are −9.97 and 3.65 kcal mol−1,38 as summarized in Table 4.
Table 3 Temperature dependence of results for liquid TIP4P watera
| Temp (C) |
ΔGaq |
ΔHvap |
Density |
|
Energies in kcal mol−1; density in g cm−3. Pressure is 1 atm.
|
| 15 |
−6.402 |
10.788 |
1.00822 |
| 20 |
−6.294 |
10.719 |
1.00567 |
| 25 |
−6.190 |
10.654 |
1.00294 |
| 30 |
−6.206 |
10.582 |
0.99960 |
| 35 |
−6.080 |
10.515 |
0.99722 |
| 40 |
−5.933 |
10.451 |
0.99329 |
| 45 |
−5.945 |
10.387 |
0.98915 |
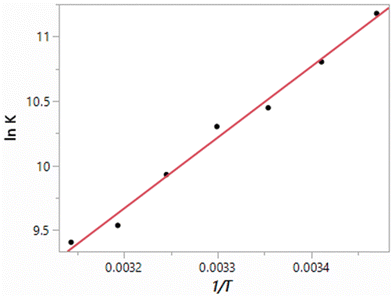 |
| | Fig. 2 van’t Hoff plot (eqn (4)) computed for TIP4P water. | |
Table 4 van’t Hoff enthalpies and entropies of hydration (kcal mol−1)a
| Molecule |
ΔHhyd TIP4Pb |
ΔHhyd exptlc |
−TΔShyd TIP4Pb |
−TΔShyd exptlc |
r
2
|
|
For transfer from the gas phase to aqueous solution at 25 °C and 1 atm. r2 is the correlation coefficient for the van’t Hoff plot.
Computed by FEP; uncertainties are ca. ±0.4 kcal mol−1.
Ref. 38.
|
| Ethane |
−0.89 |
−4.172 |
3.66 |
6.00 |
0.7181 |
| Propane |
−1.21 |
−4.826 |
4.15 |
6.79 |
0.9377 |
| Butane |
−1.83 |
−5.655 |
5.03 |
7.73 |
0.9504 |
| Benzene |
−5.75 |
−7.076 |
6.00 |
6.22 |
0.9818 |
| Methanol |
−9.39 |
−10.25 |
4.78 |
5.15 |
0.9965 |
| Ethanol |
−11.30 |
−12.05 |
6.63 |
7.05 |
0.9990 |
| Methylamine |
−6.44 |
−10.269 |
3.18 |
5.70 |
0.9926 |
| Propylamine |
−9.62 |
−12.821 |
6.64 |
8.43 |
0.9996 |
| Water-TIP4P |
−10.64 |
−9.974 |
4.45 |
3.65 |
0.9858 |
| Mean signed error |
2.38 |
|
−1.35 |
|
|
| Mean unsigned error |
2.38 |
|
1.54 |
|
|
Results for organic solutes
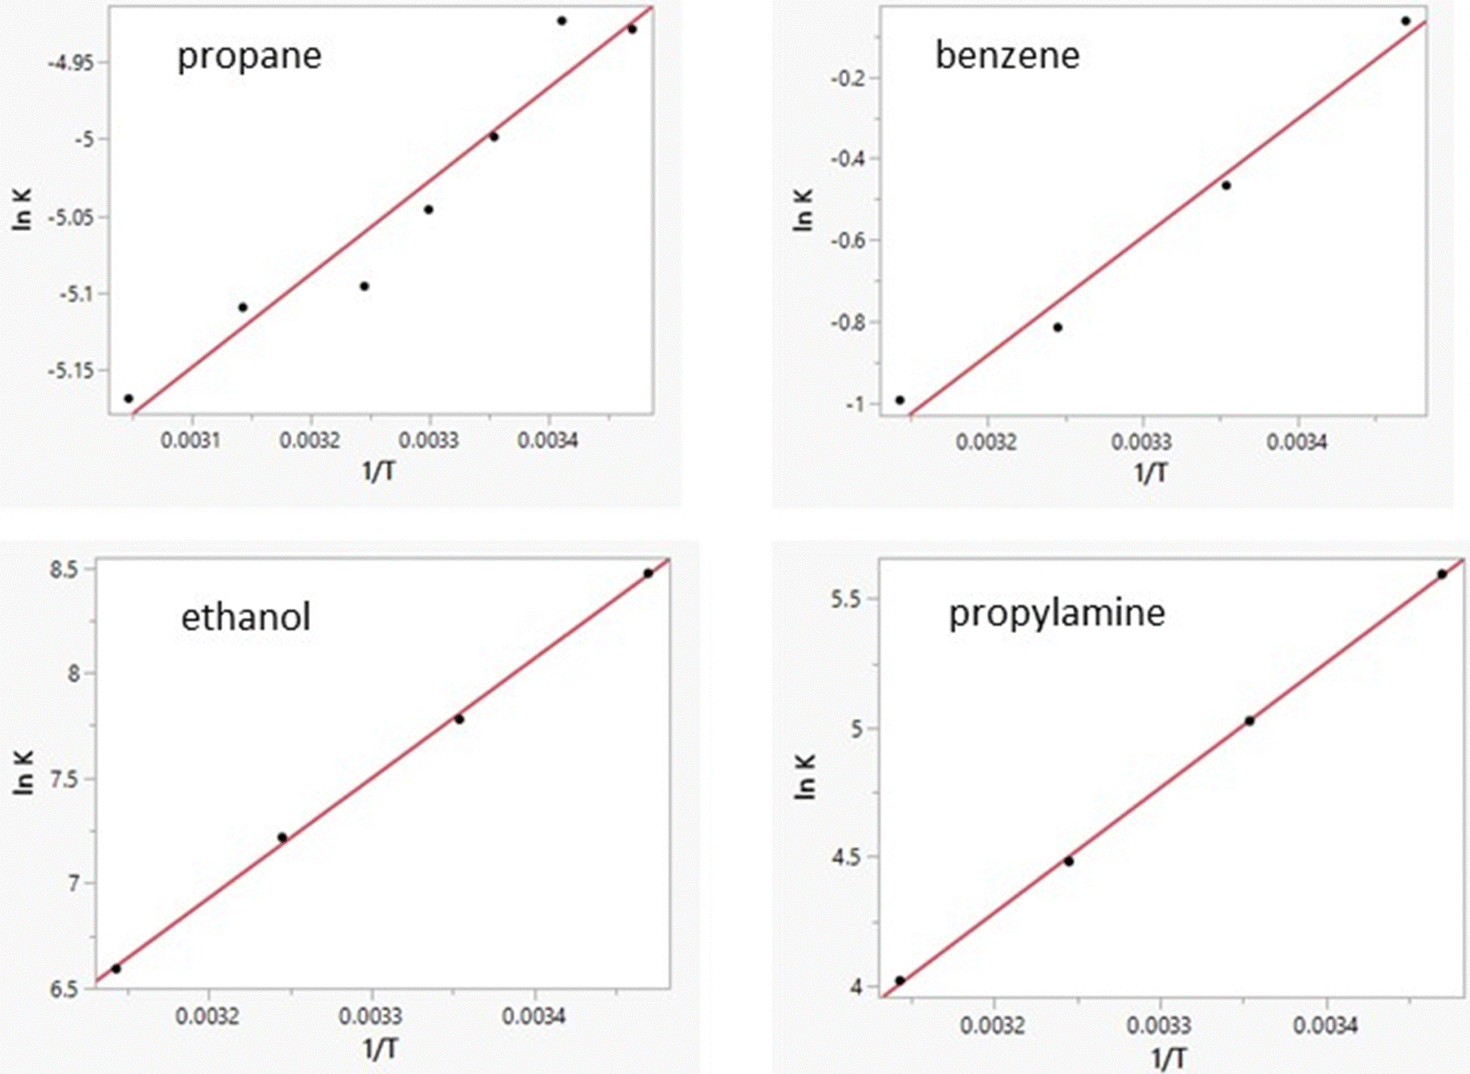
Free energies of hydration from FEP calculations and enthalpies of hydration from the direct calculations were carried out for 22 solutes including the 19 molecules in Table 8 of ref. 38 plus phenol, 2-methyl-2-propanol, and water. The results are listed in Table 5 and a plot of the computed enthalpies of hydration vs. the experimental ones is provided in Fig. 3. van’t Hoff plots were generated for eight of the solutes in addition to water. Representative plots are shown in Fig. 4 and the resultant entropy and entropy data are listed in Table 4 along with the correlation coefficients for the linear fits. Based on the results in Table 1 for water and the standard deviations for the total energies using batch sizes of 0.5 B configurations, the uncertainty in the computed enthalpies of hydration from the direct method is ca. ±0.4 kcal mol−1, essentially the same as the uncertainties from the van’t Hoff method. The van’t Hoff plots become more linear as ΔHhyd becomes more exothermic (Fig. 4), which reflects stronger intermolecular interactions and greater sensitivity of ΔGhyd to temperature. Thus, the more challenging calculations are for the more hydrophobic solutes, i.e., alkanes, which were not treated in the original studies.15–19
Table 5 Free energies, enthalpies, and volumes of hydrationa
| Molecule |
ΔGhyd TIP4Pb |
ΔGhyd exptlc |
ΔHhyd TIP4Pd |
ΔHhyd exptlc |
ΔVhyd TIP4Pe |
ΔVhyd exptlf |
|
For transfer from the gas phase to aqueous solution with at 25 °C and 1 atm; energies in kcal mol−1, volumes in cm3 mol−1.
Computed by FEP; uncertainties are ca. ±0.05 kcal mol−1.
Ref. 38.
Computed by the direct method with MC sampling over 5 B configurations; uncertainties are ca. ±0.4 kcal mol−1.
The average uncertainty is ±2 cm3 mol−1.
Ref. 43.
Ref. 43, estimated.
Ref. 44.
Ref. 45.
Uncertainty is ±0.001 kcal mol−1.
|
| Methane |
2.595 |
1.99 |
−0.356 |
−2.747 |
38.81 |
42.5 |
| Ethane |
2.767 |
1.83 |
−0.722 |
−4.172 |
55.71 |
(52.1)g |
| Propane |
2.944 |
1.96 |
−2.293 |
−4.826 |
68.29 |
57.3 |
| Butane |
3.199 |
2.07 |
−2.219 |
−5.655 |
91.65 |
(83.9)g |
| 2-Methylpropane |
3.342 |
2.32 |
−1.832 |
−4.825 |
83.47 |
(83.9)g |
| Benzene |
0.251 |
−0.86 |
−6.071 |
−7.076 |
87.03 |
82.4h |
| Toluene |
−0.192 |
−0.88 |
−7.346 |
−8.101 |
101.63 |
98.4h |
| Ethylbenzene |
−0.147 |
−0.79 |
−8.730 |
−9.037 |
116.34 |
114.8h |
| Methanol |
−4.612 |
−5.10 |
−9.310 |
−10.25 |
41.32 |
38.2 |
| Ethanol |
−4.665 |
−5.00 |
−11.411 |
−12.05 |
58.22 |
55.1 |
| Propanol |
−4.307 |
−4.85 |
−11.398 |
−13.25 |
73.74 |
70.6 |
| Butanol |
−4.160 |
−4.72 |
−13.256 |
−13.95 |
81.66 |
86.6 |
| 2-Methyl-2-propanol |
−3.204 |
−4.47 |
−10.897 |
−14.73i |
89.15 |
87.6 |
| Phenol |
−4.557 |
−6.61 |
−11.369 |
−13.06i |
84.40 |
86.1 |
| Ammonia |
−2.928 |
−4.305 |
−6.132 |
−7.874 |
28.57 |
|
| Methylamine |
−3.259 |
−4.569 |
−8.711 |
−10.269 |
42.01 |
41.7 |
| Ethylamine |
−3.236 |
−4.507 |
−11.166 |
−12.502 |
56.23 |
58.0 |
| Propylamine |
−2.978 |
−4.401 |
−10.824 |
−12.821 |
71.54 |
74.0 |
| Butylamine |
−3.221 |
−4.302 |
−12.712 |
−13.563 |
86.23 |
88.8 |
| Diethylamine |
−2.723 |
−4.07 |
−13.164 |
−14.762 |
88.35 |
90.8 |
| Triethylamine |
−1.327 |
−3.04 |
−13.756 |
−16.211 |
117.77 |
120.9 |
| Water - TIP4P |
−6.190 |
−6.324 |
−10.061j |
−9.974 |
18.07 |
17.96 |
| Mean signed error |
1.00 |
|
1.726 |
|
0.95 |
|
| Mean unsigned error |
1.00 |
|
1.734 |
|
3.15 |
|
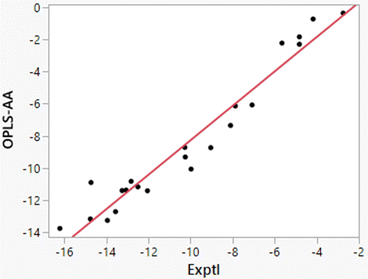 |
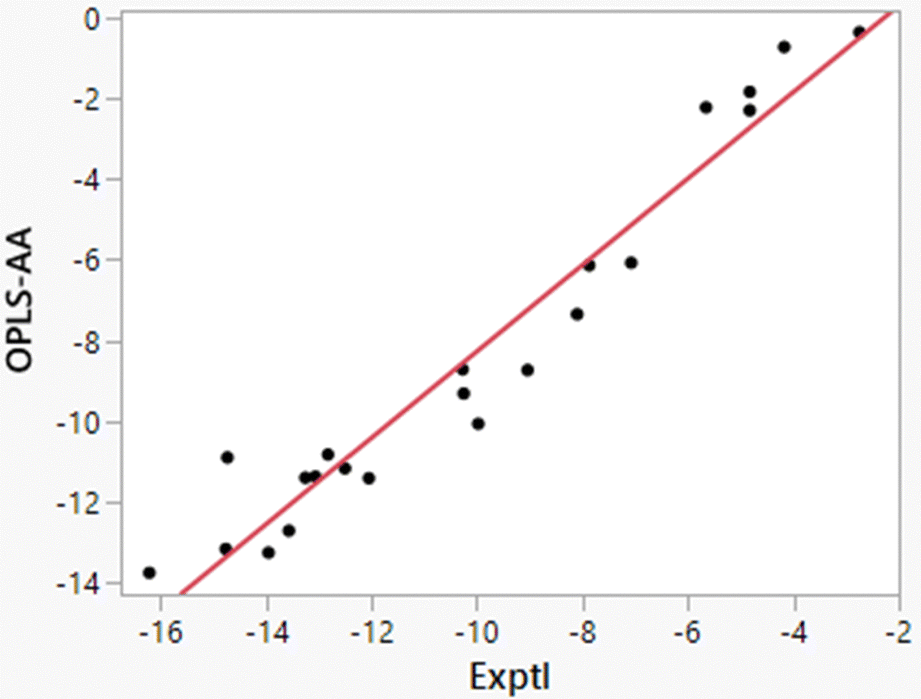
| | Fig. 3 Comparison of experimental and computed enthalpies of hydration from the direct method for 22 solutes (Table 5). The line is the best linear fit and has r2 = 0.9433. | |
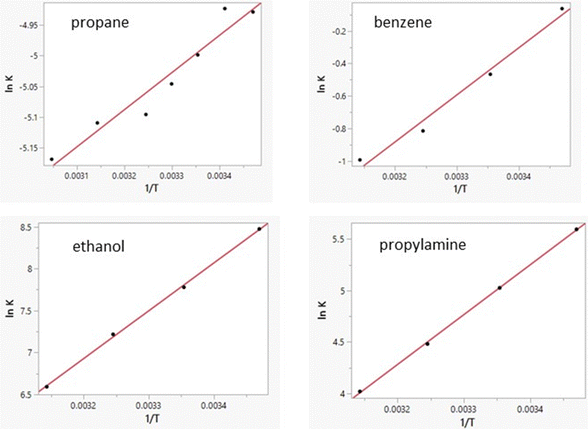 |
| | Fig. 4 Computed van’t Hoff plots for four solutes in TIP4P water. Linearity improves with increasing slope. i.e., sensitivity of ΔGaq to temperature. | |
Additional points should be made. Starting with the FEP results for ΔGhyd in Table 5, the computed values are generally 1 kcal mol−1 too positive with smaller errors for alcohols and water. As discussed previously,32 OPLS-AA and other non-polarizable force fields, which are optimized for simulations of pure organic liquids, utilize atomic partial charges that are under-polarized for the higher dielectric environment in aqueous solutions.14,26 The results in Tables 4 and 5 show that the error is enthalpic in origin with the heats of solution for organic molecules being too positive by 2–3 kcal mol−1; the best linear fit illustrated in Fig. 3 is ΔH(OPLS-AA) = 1.072 × ΔH(Exptl) + 2.447. The enthalpy error is partially compensated by the entropy contribution being less unfavorable by 1–2 kcal mol−1. The errors are most serious for alkanes and highly alkylated molecules like triethylamine. Polarization of the solutes by the solvent is needed for proper treatment of solvation in general, and especially in these cases.46
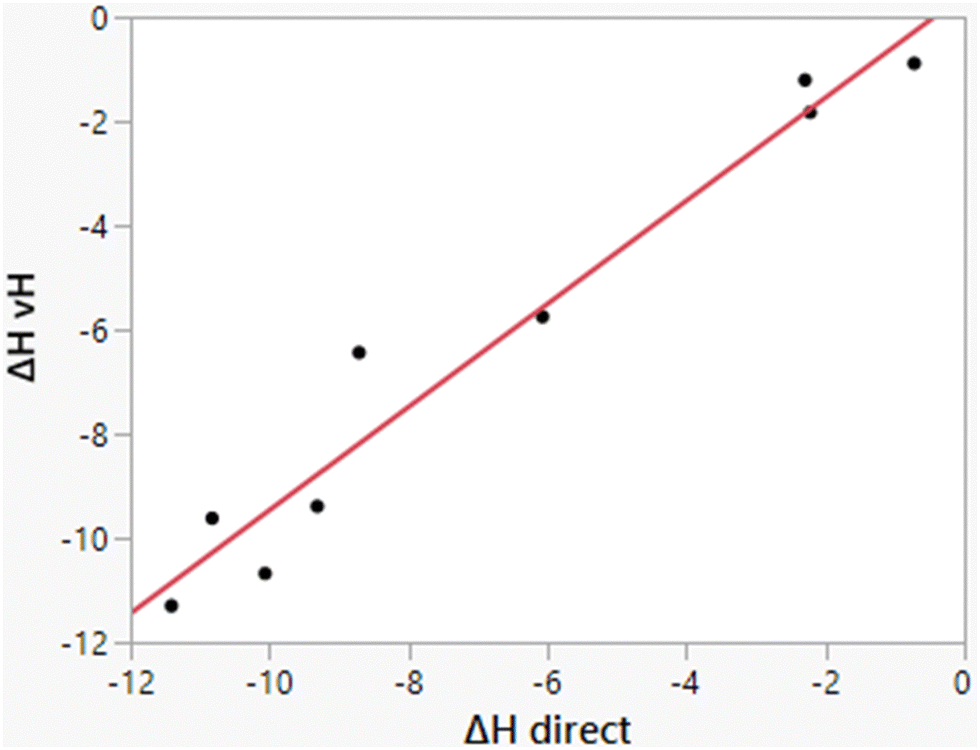
As illustrated in Fig. 3, the computed heats of solution parallel well the experimental data. Consequently, differences ΔΔHhyd benefit from cancellation of errors as for ΔΔGhyd, which contributes to the success of relative FEP calculations in many contexts including protein–ligand binding.32,47,48 The computed enthalpies of hydration from the two methods, direct and van’t Hoff, also correlate well, as shown in Fig. 5; their average difference is 0.69 kcal mol−1, which is within the expected uncertainties. The largest deviation is for methylamine for which the two methods differ by 2.27 kcal mol−1 (−8.71 vs. −6.44 kcal mol−1). The similar results for ethane, propane, and butane from the two methods are reassuring for the accuracy of the results in view of the more challenging convergence in these cases.
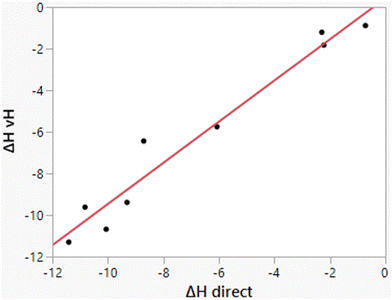 |
| | Fig. 5 Comparison of results for ΔHhyd from the direct and van’t Hoff calculations. The line represents the best linear fit and has r2 = 0.9559. The mean difference is 0.69 kcal mol−1. | |
The enthalpy of TIP4P water, −10.061 ± 0.001 kcal mol−1, in Table 5 just comes from dividing the total energy in Table 1 by N = 501. Combination with the free energy of −6.190 ± 0.035 yields −TΔS = 3.872 ± 0.035 kcal mol−1. These results are in close accord with the corresponding experimental values of −9.974, −6.324, and 3.650 kcal mol−1.38 The discrepancy between the precise enthalpy change (−10.061 kcal mol−1) and the van’t Hoff result (−10.64 kcal mol−1) can be attributed to the uncertainty in the van’t Hoff result and to the fact that the ΔHhyd is not fully temperature independent, as assumed in the van’t Hoff analysis. However, the change in heat capacity for the system upon transfer of the solute from the gas phase into aqueous solution, ΔCp,hyd, is sufficiently small that the resultant curvature in the van’t Hoff plots is not detectable given the temperature range and precision of the computed free energy changes.49
The computed partial molar volumes from the direct calculations are also included in Table 5 and compared with available experimental data.43,44 In this case, the average uncertainty in the computed values is ±2.2 cm3 mol−1 from the batch means procedure with batch sizes of 0.5 B configurations, while alternative experimental measurements often differ by 1–2 cm3 mol−1.44 The mean unsigned error between the computed and experimental values is 3.15 cm3 mol−1, which is within the combined uncertainties. It may be noted that the current result for benzene in TIP4P water, 87.0 ± 2.2 cm3 mol−1, is consistent with the prior report29 of 81.2 ± 5.1 cm3 mol−1 that was obtained from averaging over 1 B MC configurations as opposed to the current 5 B configurations. The good computed results for the volumes of solution undoubtedly benefit from the average errors of only 1% in the densities of TIP4P water and OPLS-AA organic liquids.31,32
Overall, this study finds that the present MC-based methodologies for computing enthalpies of hydration are competitive in precision with both giving average uncertainties of ±0.4 kcal mol−1. However, the direct method is much faster since it requires 5 B configurations of averaging, while the van’t Hoff approach uses FEP calculations at four temperatures encompassing 14 B configurations of averaging at each temperature. On a 3.5-GHz Intel i5 processor, the run times are about 35 hours for the direct calculation and 392 hours to obtain the 4-point van’t Hoff result or 294 hours for 3 temperatures. It is straightforward to improve the precision of the calculations by extending the MC averaging in both cases. Quadrupling the length of the MC averaging can be expected to halve the statistical uncertainty for the computed enthalpies of hydration to ca. ±0.2 kcal mol−1. Though the calculations are already long by traditional MC standards, the four-fold extension for the direct approach to 6 days of computing per solute would be manageable, while 50–65 days for the van’t Hoff calculations would be taxing for processing many solutes. Nevertheless, observance of strong linearity in the van’t Hoff plots provides reassurance for the absence of significant sampling problems in the calculations (Fig. 4). In the end, both approaches are viable, and applying both provides a valuable check for consensus. For computation of volumes of solution, it was also found that the direct method was more efficient for a given level of precision than the FEP-based derivative one.29
Conclusions
Computation of enthalpies and entropies of hydration for organic solutes has been examined using long Monte Carlo simulations in the direct and van’t Hoff approaches. Both methods are viable with the current implementations yielding similar uncertainties of ca. ±0.4 kcal mol−1. The direct method used 5 B configurations of averaging, while the demands for the van’t Hoff alternative are about 10 times greater owing to the use of 20 FEP windows, separate annihilations of the partial charges and Lennard–Jones interactions, and four temperatures. Nevertheless, the van’t Hoff plots are appealing with their linearity providing a measure of confidence in precision. The direct calculations were also found to yield volumes of solution in good accord with experimental data and with precision of ca. ±2 cm3 mol−1. Furthermore, the present results provided valuable insights on the performance of the OPLS-AA force field. The error in computed free energies of hydration of 1 kcal mol−1 is found to come from enthalpies of hydration that are not exothermic enough by 2–3 kcal mol−1, which is partially compensated by a less unfavorable entropy contribution by 1–2 kcal mol−1. With fixed-charge force fields parameterized to give accurate results for pure organic liquids, interactions between organic solutes and water are not attractive enough. The problem can be remedied with polarizable force fields. Testing on not only free energies of hydration, but also its enthalpic and entropic components should now become routine.
Conflicts of interest
The author declares that there are no competing interests.
Acknowledgements
Gratitude is expressed to the National Institutes of Health (GM032136) for support of this research.
References
- W. L. Jorgensen and C. Ravimohan, J. Chem. Phys., 1985, 83, 3050–3056 CrossRef CAS.
- T. P. Straatsma, H. J. C. Berendsen and J. P. M. Postma, J. Chem. Phys., 1986, 85, 6720–6727 CrossRef CAS.
- J. Hermans, A. Pathiaseril and A. Anderson, J. Am. Chem. Soc., 1988, 110, 5982–5986 CrossRef CAS PubMed.
- W. L. Jorgensen, J. F. Blake and J. K. Buckner, Chem. Phys., 1989, 129, 193–200 CrossRef CAS.
- W. L. Jorgensen, Acc. Chem. Res., 1989, 22, 184–189 CrossRef CAS.
- P. A. Kollman, Chem. Rev., 1993, 93, 2395–2417 CrossRef CAS.
-
C. Chipot and A. Pohorille, in Springer Series in Chemical Physics, Free Energy Calculations: Theory and Applications in Chemistry and Biology, ed. C. Chipot and A. Pohorille, Springer-Verlag, Berlin, 2007, vol. 86, pp. 33–75 Search PubMed.
- W. L. Jorgensen and J. Tirado-Rives, Perspect. Drug Discovery Des., 1995, 3, 123–128 CrossRef CAS.
- D. J. Price and C. L. Brooks, III, J. Comput. Chem., 2005, 26, 1529–1541 CrossRef CAS PubMed.
- W. L. Jorgensen and L. L. Thomas, J. Chem. Theory Comput., 2008, 4, 869–876 CrossRef CAS PubMed.
- D. L. Mobley, C. I. Bayly, M. D. Cooper, M. R. Shirts and K. A. Dill, J. Chem. Theory Comput., 2009, 5, 350–358 CrossRef CAS PubMed.
- D. L. Mobley and J. P. Guthrie, J. Comput.-Aided Mol. Des., 2014, 28, 711–720 CrossRef CAS PubMed.
- E. Harder, W. Damm, J. Maple, C. Wu, M. Reboul, J. Y. Xiang, L. Wang, D. Lupyan, M. K. Dahlgren and J. L. Knight,
et al.
, J. Chem. Theory Comput., 2016, 12, 281–296 CrossRef CAS PubMed.
- L. S. Dodda, J. Z. Vilseck, J. Tirado-Rives and W. L. Jorgensen, J. Phys. Chem. B, 2017, 121, 3864–3870 CrossRef CAS PubMed.
- M. M. Kubo, E. Gallicchio and R. M. Levy, J. Phys. Chem. B, 1997, 101, 10527–10534 CrossRef CAS.
- R. M. Levy and E. Gallicchio, Annu. Rev. Phys. Chem., 1998, 49, 531–567 CrossRef CAS PubMed.
- S. Wan, R. H. Stote and M. Karplus, J. Chem. Phys., 2004, 121, 9539–9548 CrossRef CAS PubMed.
- J. Carlsson and J. Åqvist, Phys. Chem. Chem. Phys., 2006, 8, 5385–5395 RSC.
- J. Carlsson and J. Åqvist, J. Phys. Chem. B, 2009, 113, 10255–10260 CrossRef CAS PubMed.
- S. Bjelic, B. O. Brandsdal and J. Åqvist, Biochem., 2008, 47, 100049–100057 Search PubMed.
- J. Åqvist and S. C. L. Kammerlin, Sci. Rep., 2015, 5, 15817 CrossRef PubMed.
- J. Åqvist, M. Kazemi, G. V. Isaksen and B. O. Brandsdal, Acc. Chem. Res., 2017, 50, 199–207 CrossRef PubMed.
- J. Socan, M. Purg and J. Åqvist, Nat. Commun., 2020, 11, 2644 CrossRef CAS PubMed.
- J. Åqvist, ACS Catal., 2022, 12, 1452–1460 CrossRef.
- R. S. Wilkins, B. A. Lund, G. V. Isaksen, J. Åqvist and B. O. Brandsdal, J. Chem. Theory Comput., 2024, 20, 451–458 CrossRef CAS PubMed.
- H. S. Ashbaugh, L. Liu and L. N. Surampudi, J. Chem. Phys., 2011, 135, 054510 CrossRef PubMed.
- W. L. Jorgensen, B. Bigot and J. Chandrasekhar, J. Am. Chem. Soc., 1982, 104, 4584–4591 CrossRef CAS.
- I. Cabeza de Vaca, R. Zarzuela, J. Tirado-Rives and W. L. Jorgensen, J. Chem. Theory Comput., 2019, 15, 3941–3948 CrossRef CAS PubMed.
- J. Z. Vilseck, J. Tirado-Rives and W. L. Jorgensen, Phys. Chem. Chem. Phys., 2015, 17, 8407–8415 RSC.
- W. L. Jorgensen and J. Tirado-Rives, J. Comput. Chem., 2005, 26, 1689–1700 CrossRef CAS PubMed.
- W. L. Jorgensen, J. Chandrasekhar, J. D. Madura, R. W. Impey and M. L. Klein, J. Chem. Phys., 1983, 79, 926–935 CrossRef CAS.
- W. L. Jorgensen, M. Ghahremanpour, A. Saar and J. Tirado-Rives, J. Phys. Chem. B, 2024, 128, 250–262 CrossRef CAS PubMed.
- C. Pangali, M. Rao and B. J. Berne, Mol. Phys., 1980, 40, 661–680 CrossRef CAS.
- W. L. Jorgensen, Chem. Phys. Lett., 1982, 92, 405–410 CrossRef CAS.
- W. L. Jorgensen and J. D. Madura, Mol. Phys., 1985, 56, 1381–1392 CrossRef CAS.
- L. B. Skinner, C. Huang, D. Schlesinger, L. G. M. Pettersson, A. Nilsson and C. J. Benmore, J. Chem. Phys., 2013, 138, 074506 CrossRef PubMed.
- T. Head-Gordon and G. Hura, Chem. Rev., 2002, 102, 2651–2670 CrossRef CAS PubMed.
- A. Ben-Naim and Y. Marcus, J. Chem. Phys., 1984, 81, 2016–2027 CrossRef CAS.
- M. R. Shirts and V. J. Pande, J. Chem. Phys., 2005, 122, 134508 CrossRef PubMed.
- M. J. Vlot, J. Huinink and J. P. van der Eerden, J. Chem. Phys., 1999, 110, 55–61 CrossRef CAS.
- F. Saija, A. M. Saitta and P. V. Giaquinta, J. Chem. Phys., 2003, 119, 3587–3589 CrossRef CAS.
- L. Wang, R. Abel, R. A. Friesner and B. J. Berne, J. Chem. Theory Comput., 2009, 5, 1462–1473 CrossRef CAS PubMed.
- L. Lepori and P. Gianni, J. Solution Chem., 2000, 29, 405–447 CrossRef CAS.
- S. Sawamura, K. Nagaoka and T. Machikawa, J. Phys. Chem. B, 2001, 105, 2429–2436 CrossRef CAS.
- G. I. Makhatadze and P. L. Privalov, J. Mol. Biol., 1993, 232, 639–659 CrossRef CAS PubMed.
- C. R. Rupakheti, A. D. MacKerell, Jr. and B. Roux, J. Chem. Theory Comput., 2021, 17, 7085–7095 CrossRef CAS PubMed.
- Z. Cournia, B. Allen and W. Sherman, J. Chem. Inf. Model., 2017, 57, 2911–2937 CrossRef CAS PubMed.
- C. Chipot, Annu. Rev. Biophys., 2023, 52, 113–138 CrossRef CAS PubMed.
- Collin D. Wick, J. I. Siepmann and M. R. Schure, J. Phys. Chem. B, 2003, 107, 10623–10627 CrossRef CAS.
|
| This journal is © the Owner Societies 2024 |

 Open Access Article
 This Open Access Article is licensed under a Creative Commons Attribution-Non Commercial 3.0 Unported Licence