
 Open Access Article
 This Open Access Article is licensed under a
 Creative Commons Attribution 3.0 Unported Licence
The dawn of hydrogen and halogen bonds and their crucial role in collisional processes probing long-range intermolecular interactions
David
Cappelletti
 *a,
Stefano
Falcinelli
b and
Fernando
Pirani
ab
*a,
Stefano
Falcinelli
b and
Fernando
Pirani
ab
aDipartimento di Chimica, Biologia e Biotecnologie, Università degli Studi di Perugia, via Elce di Sotto 8, 06123 Perugia, Italy. E-mail: david.cappelletti@unipg.it
bDipartimento di Ingegneria Civile ed Ambientale, Università degli Studi di Perugia, via G. Duranti 93, 06215 Perugia, Italy
First published on 13th February 2024
Abstract
This perspective review focuses on the results of an internally consistent study developed in the Perugia laboratory, centered on the fundamental interaction components that, at large intermolecular distances, determine the formation of weak intermolecular hydrogen (HB) and halogen (XB) bonds. This investigation exploits old and novel molecular beam scattering experiments involving several gaseous prototypical systems. In particular, we focus on the kinetic energy dependence of the total (elastic + inelastic) integral cross-sections. Of particular interest is the measure of quantum interference patterns in the energy dependence of cross-sections of targeted systems and their shift compared to that of known reference systems. We interpreted these findings as interaction energy stabilization components, such as charge transfer, σ-hole, and polar flattening, that emerge at intermediate separation distance ranges and selectively manifest for specific geometries of collision complexes. Another significant observable we discuss is the absolute value of the cross-section and its dependence on permanent multipole moments of the collisional partners. Specifically, we show how the spontaneous orientation of rotationally cold and polar molecules, due to the electric field gradient associated with the interaction between permanent multipole moments, can significantly modify the magnitude of the total cross-section, even at high values of the impact parameter. We are confident that the present results can help extend the force field formulation to various interacting systems and carry out molecular dynamics simulations under conditions of application interest.
1. Introduction
The nature, strength, and selectivity of intermolecular forces operating at intermediate and large separation distances determine the absolute and relative stability of weakly bound adducts formed in collisions in gaseous and condensed phases. In several cases, such molecular complexes represent the precursors that selectively control the formation of the transition state and the final products of elementary reactions. Long-range intermolecular forces have been a grand challenge of physical chemistry and chemical physics research. Presumably, they will also be future study objectives, as their detailed characterization in systems of increasing complexity is of great relevance for controlling the static and dynamic properties of matter under various conditions.1–4 Recently,5 for a general textual distinction between intra- and inter-molecular bond formation by interaction forces, it has been suggested that the language of “molecular vs. supramolecular” rather than “covalent vs. noncovalent” can be considered more suitable.This topic is of interest in fundamental research, focused on the rationalization of the transition from a van der Waals (vdW) to a chemical bond6,7 and on assessing the role of the weakly bound precursor state in the stereo-dynamics of elementary processes.8 Moreover, the detailed knowledge of weak intermolecular forces is also of interest in applied research, addressed to prepare systems for nano-material applications and crystal engineering, to design new drugs and to control supra-molecular chemistry,3,4 the development of lasers,9–12 chiral selectivity and biochemistry.13–15 Such forces also drive the dynamics of elementary energy transfer processes, as these promoting vibration–vibration, vibration–rotation, vibration–translation, and vibration–electronic transitions occur in the gas phase, in plasmas, and at gas–liquid and gas–surface inter-phases.16–20
Weak intermolecular hydrogen (HB)21 and halogen (HX)22 bonds, formed by interacting partners in the gaseous and condensed phases, play a central role in several fundamental and applied research studies.3,4,23–34 A critical and still not fully addressed open question is the complete definition of the strength, range, anisotropy, nature, and selectivity of the fundamental interaction components, including the charge transfer (CT) in the perturbation limit, that control the stability of the intermolecular HB and XB. The role and selectivity of CT have been the target of relevant papers that appeared in recent literature studies (see, for instance, ref. 35–38 and references therein). However, CT in the perturbation limit, providing stabilization effects of few meV (fraction of kJ mol−1), is often challenging to isolate even by the most advanced theoretical methods.23,39
This perspective review primarily focuses on the approach we adopted in the last few years in the Perugia laboratory to adequately address some hot topics and open questions emphasized above,23,25,40 with particular attention to the experimental characterization of the basic features of weak HB and XB. The observable exploited is the total (elastic + inelastic) integral cross-section Q(v) measured as a function of the collision velocity, v. A remarkable property of Q(v), when measured under appropriate experimental conditions (see Section 2 below), is its dependence on the absolute scale of the effective interaction strength.7,8,40–44 In particular, the most relevant driving line of our effort has been used to carry out molecular beam (MB) scattering experiments under the same conditions, adopting high resolution in a scattering angle and a collision velocity, in order to resolve the amplitude and frequency of oscillating patterns in the measured Q(v) that arise from quantum interference effects modulating the probability of single collision events. As it is well known, such effects are directly controlled by basic features of the interaction driving two-body collisions.41–43 The attention has been mainly focused on simple systems affected by weak HB and XB and, simultaneously, on other appropriately selected reference cases. The use of rotationally excited molecules as projectiles and targets reduces the probability of inelastic effects due to the interaction anisotropy. This strategy permitted a better resolution in measuring quantum interference effects in the scattering. In particular, the amplitude of the oscillatory pattern in Q(v) exhibits limited quenching effects.7,23,25,26,40,43,45,46 This experimental evidence depends on the fact that the total integral cross-section is mostly determined by collisions occurring at intermediate and large impact parameters, where inelastic events play a limited role compared to elastic ones. Moreover, under the used conditions probing collisions confined in the thermal range of kinetic energies, projectiles and target molecules, rotating faster than the collision times, tend to behave as isotropic partners, and the interaction, driving most of the scattering events, becomes close to the isotropic (spherical) component of the intermolecular potential.23,25,40,43,45,46 Usually, such a component depends on all contributions that are not washed out by averaging over all relative configurations.
We adopted this approach to investigate gas phase complexes interacting with the same (ubiquitous) van der Waals (VvdW) potential component (defined here for convenience as the combination of size repulsion with dispersion attraction) and where the electrostatic contribution of the interaction is null or plays a limited role. In this way, we have observed changes in the quantum interference effects associated with the role of CT on the HB and that of CT, polar flattening, and σ hole on XB.23,25,27–29,40 In specific cases, we also shed light on the role of long-range intermolecular forces characterized by anisotropic electrostatic contributions on the stereodynamics of collisions occurring under thermal conditions.44
Most of the experimental findings were put in solid grounds and broader perspective by theoretical calculations, carried out applying advanced ab initio methods and original models that confirmed the role, strength, and selectivity of the basic interaction components controlling the formation and stability of weak HB and XB.23,25,27–29,40
The approach adopted is summarized in Section 2, and is based mainly on previous results on weak hydrogen bonded complexes. Implications for the stereo-dynamics of hydrogenated molecule collisions are presented in Section 3. Section 4 extends the approach to weak halogen bonded cases, giving basic details on the original model exploited for the interaction potential formulation. Finally, Section 5 provides new cross-section data for the scattering of simple molecules, such as D2, O2, D2O, and ND3, by Br2 targets. A thorough analysis is accompanied by a comparison with homologous Cl2 complexes, which allows us to extend the relevance of the present work.
2. Concerted experimental and theoretical approaches
In this section, we summarize the guidelines of our methodology adopted to investigate water molecules interacting with noble gases and other simple molecules.2.1 Experimental technique
Details on the used experimental apparatus, shown in Fig. 1, are given in previous studies.45–47 Briefly, the setup is composed of differentially pumped vacuum chambers, where the gas expansion from a nozzle generates the MB. The nozzle temperature can be varied in the range of 77–600 K, while its opening diameter is about 1 mm. The pressure in the source is usually maintained at less than 10 mbar. These conditions generate the MB with a near effusive or moderately supersonic character that undergoes collimation by defining slits, with a sequence and diameters chosen in the 0.7–1.5 mm range. We usually produce the MB with the lighter species involved in the scattering study for kinematic reasons; in this case, a broad velocity distribution is generated and can be analysed using a mechanical-slotted disk selector. Therefore, the projectile molecule collides with the stationary target gas at a selected nominal velocity v. The latter is typically the heavier species contained in the scattering chamber at constant pressures, chosen in the range of 10−3–10−4 mbar. The chamber can be cooled at 90 K (the liquid air temperature) to reduce the thermal random motion of the target and then to improve the collision velocity resolution of the experiments. In some specific cases involving heavier target molecules with sufficiently high boiling points, the scattering chamber is kept at room temperature to avoid the condensation effects of the target gas on the walls. The MB is detected downstream using an online quadrupole mass spectrometer coupled with an ion-counting device. Adopting a sufficiently long beam source-detector distance (about 2 meters), coupled with excellent beam collimation and a light projectile, we limited corrections due to the finite angular resolution of the experiment. Under these conditions, it is possible to measure the so-called “true” cross-section, including quantum interference effects.45–47 Moreover, in the case of the MB formed by hydrogen, water, and ammonia molecules, isotopically substituted D2, D2O, and ND3 species have been used to take advantage of the background noise reduction in the associated mass spectrometry detection and then to improve the signal to noise ratio. | ||
| Fig. 1 A sketch of the experimental apparatus used in the present experiments. | ||
The experimental value of the scattering cross-section Q(v) is obtained from a measure of the MB attenuation, defined as I/I0 where I represents the MB intensity detected with the scattering chamber filled with the target at the chosen pressure and I0 that without the target.
 | (1) |
The adopted conditions allow us to determine the absolute value of Q with a small uncertainty (usually lower than 3–4%) and resolve the amplitude and frequency of the oscillatory pattern due to the glory quantum interference effect. The glory effect of our interest (forward glory) is experimentally observable at zero scattering angles under high angular resolution conditions. The glory arises from the interference between two partial waves. The first wave with a high orbital angular momentum is not affected by the interaction; the second wave, at an intermediate value of the orbital angular momentum, is scattered at a zero angle due to the perfect balance between attraction and repulsion interaction components.41–43 The high angular resolution conditions are necessary to discriminate the scattered waves within the uncertainty principle.
The glory oscillations are over-imposed to a smooth monotonic component in the v dependence of Q(v).41–43 In semi-classical approximation, the cross-sections can be written as the sum of the two contributions
 | (2) |
![[Q with combining macron]](https://www.rsc.org/images/entities/i_char_0051_0304.gif) (v) is directly related to the strength of the long-range attraction, the oscillating pattern due to the glory effect, ΔQ(v), is controlled by basic features of the interaction potential well, such as its depth, its shape, and the minimum location (see below).41–43 It is important to note that Q(v) and the second virial coefficient are the exclusive observables probing the interaction in the absolute scale.
(v) is directly related to the strength of the long-range attraction, the oscillating pattern due to the glory effect, ΔQ(v), is controlled by basic features of the interaction potential well, such as its depth, its shape, and the minimum location (see below).41–43 It is important to note that Q(v) and the second virial coefficient are the exclusive observables probing the interaction in the absolute scale.
During the analysis of the experimental data, center-of-mass (CM) cross-section values are calculated from the assumed intermolecular interaction potential V (see following sections) within the semi-classical Jeffreys–Wentzel–Kramers–Brillouin (JWKB) approximation [see ref. 41–43, 45 and references therein], and, after their convolution in the laboratory frame, they are directly compared with the measured Q(v) According to a trial-and-error fit procedure, the parameters defining V are varied within restricted ranges to maintain their appropriate physical meaning and obtain the best comparison between calculations and experimental data.
2.2 The investigation of the weak HB
The weak intermolecular bonds of our interest arise in general from the balance of long-range interaction terms such as dispersion (Vdisp), induction (Vind) and, in some specific cases, electrostatic contributions (Velec). Charge transfer (VCT) and size repulsion (Vrep) components, related to the overlap of outer electronic clouds of two interacting partners, usually become effective at intermediate and shorter distance ranges. The ubiquitous van der Waals interaction, which we define here for convenience as VvdW = Vdisp + Vrep, is used in our work as a reference.The iconic case of hydrogen bonding (HB) is complex, and the current view is that many interaction components are involved, but they exert a different influence depending on the specific system. In particular, the role of CT is of great relevance for HB.21 On these grounds, we have studied weakly bound closed-shell systems involving water and other small hydrogenated molecules, aiming to measure the insurgent role of CT which emerges at intermediate separation distances and may leave clear tracks on the experimental observables.
The choice of reference vdW systems has been made by using predictions of semi-empirical correlation formulas suggested on phenomenological grounds.7,50 These formulas, given in terms of the electronic polarizability α of the involved partners, predict depth ε and minimum location Rm of the potential well and the value of the leading dispersion attraction coefficients for pure vdW interaction potentials, VvdW. In the case of water–Y systems (Y is a noble gas atom Ng or a simple molecule), we exploited the comparison with Ar–Y and O2–Y, selected as reference systems.40 The vdW nature of the O2–Ng interaction has been confirmed by recent ab initio calculations.51 As suggested by the experiments, Ar-Y and O2-Y complexes have a similar spherically averaged vdW interaction.50 This can be understood by taking into account the similarity of the average polarizability of Ar (1.64 Å3) and O2 (1.60 Å3). Water has an α = 1.47 Å3, which is only slightly smaller by about 10%.52 However, in water-Y, compensation effects are provided by the average induction component Vind, due to the permanent dipole-induced dipole interaction, absent in the two reference cases, which adds an extra stabilization contribution of about 10% to the dispersion attraction.25,40 Therefore, any measurable deviation of water-Y from the behaviour expected from the combination of VvdW with Vind is attributable to additional interaction components that modify the potential well features.25,40,53
2.3 Experimental findings
Fig. 2 provides Q(v) data measured under the same conditions for D2O–Ne, O2–Ne, and Ne–Ar. In particular, a rotational hot MB has been used in the first two cases. The results are almost coincident, both in the absolute value and in the oscillatory pattern, suggesting a very similar interaction potential in the well region and at long-range for the three systems. Such an experimental finding demonstrates that VvdW dominates the interaction in D2O–Ne. CT plays a minor role since, within the present experimental uncertainty, any measurable deviation from the behaviour of reference O2–Ne and Ne–Ar vdW systems is lacking. For the basic intermolecular potential features obtained for the three adducts, see Table 1 below.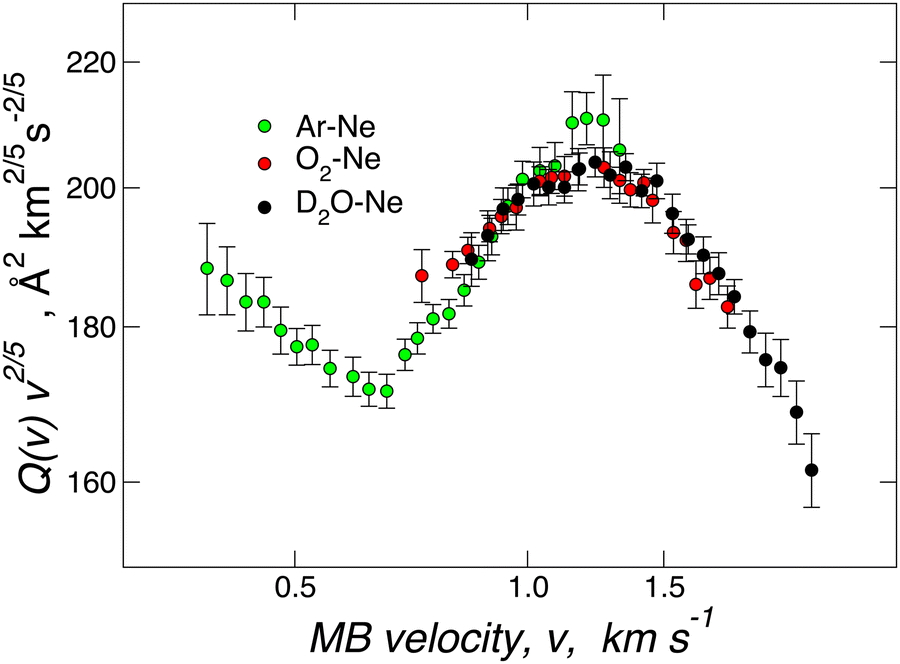 | ||
| Fig. 2 Total integral cross-sections Q(v) for collisions between Ar (green), O2 (red) and D2O (black) and Ne measured at selected beam velocity v. As usual,41–43,58 data are plotted as Q(v)·v2/5 to emphasize the glory patterns. Reproduced from ref. 25 with permission from American Chemical Society, copyright © 2012. | ||
| System | ε (meV) | R m (Å) | Source | Ref. |
|---|---|---|---|---|
| Water–He | 2.75 | 3.45 | Exp | 53 and 54 |
| 2.94 | 3.40 | Model | 53 | |
| 3.19 | 3.32 | Ab initio | 53 | |
| O2–He | 2.50 | 3.50 | Exp | 55 and 56 |
| 2.91 | 3.45 | Model | 50 | |
| Ar–He | 2.59 | 3.48 | Exp | 57 |
| 2.83 | 3.47 | Model | 50 | |
| 2.38 | 3.49 | Ab initio | 53 | |
| Water–Ne | 5.70 | 3.50 | Exp | 40 and 53 |
| 5.65 | 3.46 | Model | 40 and 53 | |
| 6.25 | 3.33 | Ab initio | 53 | |
| O2–Ne | 5.77 | 3.50 | Exp | 55 |
| 5.88 | 3.52 | Model | 50 | |
| Ar–Ne | 5.74 | 3.52 | Exp | 58 |
| 5.74 | 3.52 | Model | 50 | |
| 5.14 | 3.49 | Ab initio | 53 | |
A different phenomenology has been observed in the case of D2O–Ar, Kr, and Xe, where, for each investigated pair, it has been fully resolved (see Fig. 3), the glory pattern, both in the frequency and in the amplitude and, above all, “blue” shifts of the extreme position relative to those measured for the reference cases.23,40,53 Since the adopted methodology resolves differences in the binding energy lower than 6–7%, measured glory shifts provide the strength of a stabilization effect due to an additional component that manifests as an increase of the binding energy and a decrease of the equilibrium distance compared to expectations provided by VvdW + Vind. Systems involving He represent a more challenging case since the glory effect has not been measured due to the weakness of the interaction.53,54
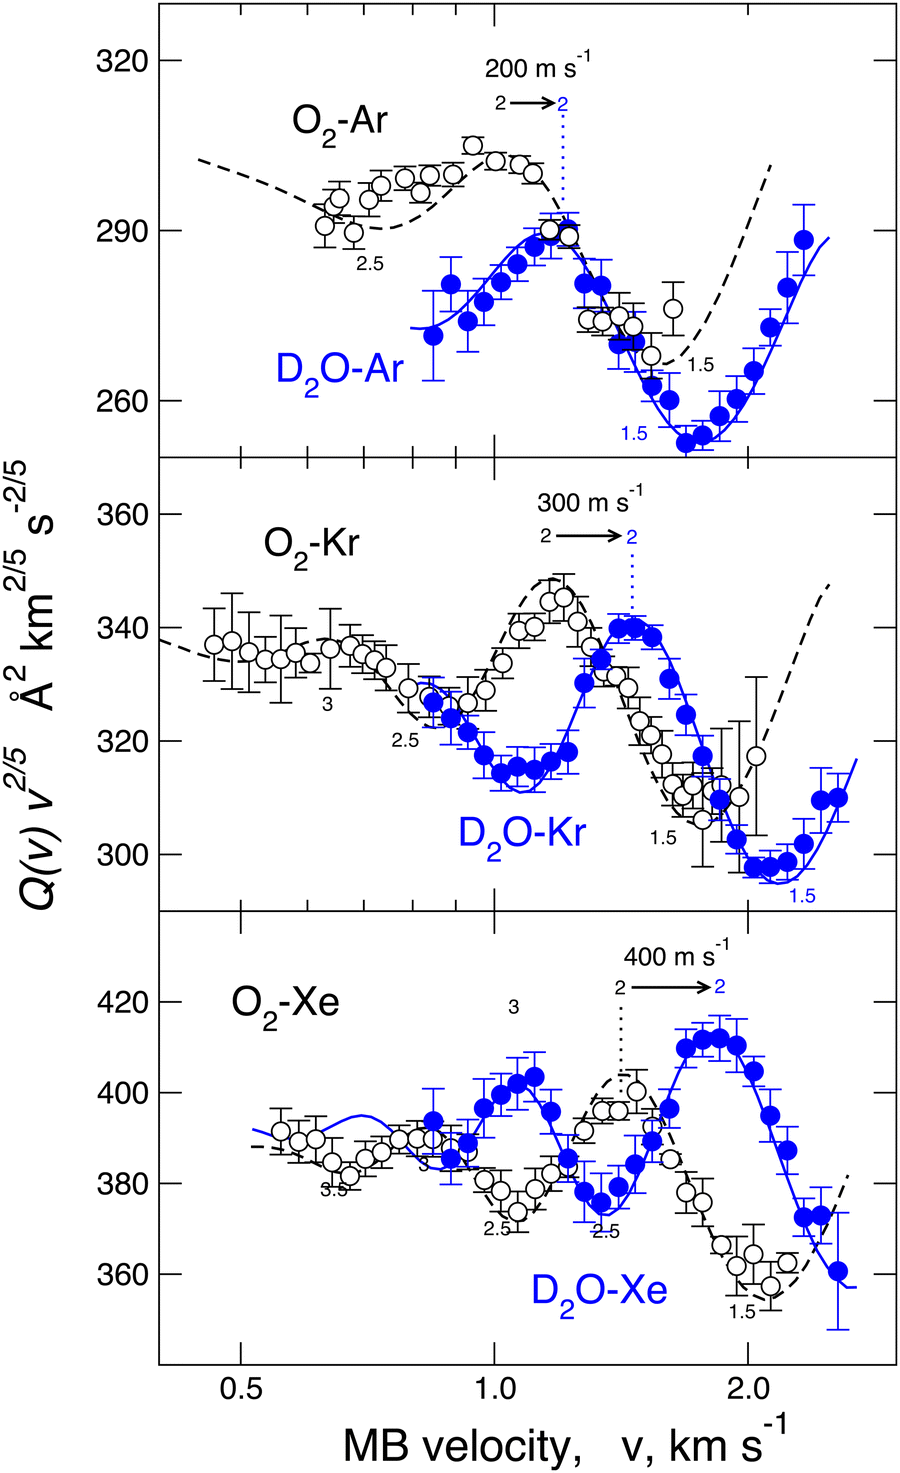 | ||
| Fig. 3 Comparison of integral cross-sections Q(v) of O2 and D2O molecular beams scattered by Ar (upper panel), Kr (middle) and Xe (lower panel) rare gas targets, respectively. Data are plotted as Q(v)·v2/5 to emphasize the glory patterns. The cross-sections of D2O are blue-shifted (amount expressed in meters per second) relative to O2 scattered by the same rare gas. | ||
For a direct-quantitative comparison, the interaction potential well depth ε, representative of the binding energy, and the minimum location Rm, representative of the equilibrium distance, are reported in Table 1 for water, O2, and Ar interacting with He and Ne and in Table 2 for homologous systems with Ar, Kr, and Xe. These results have been obtained from both experimental sources, basically through molecular beam scattering measurements, and from theoretical calculations, exploiting both ab initio methods and predictions of correlation formulas. Table 3 also reports a similar comparison for water, O2, and Ar interacting with a hydrogen molecule.
| System | ε (meV) | R m (Å) | Source | Ref. |
|---|---|---|---|---|
| Water–Ar | 14.40 | 3.63 | Exp | 40 and 53 |
| 11.7 | 3.74 | Model | 40 and 53 | |
| 14.80 | 3.58 | Ab initio | 53 | |
| O2–Ar | 11.50 | 3.72 | Exp | 55 and 59 |
| 11.78 | 3.79 | Model | 50 | |
| Ar–Ar | 12.37 | 3.76 | Exp | 58 |
| 11.61 | 3.79 | Model | 50 | |
| 11.25 | 3.80 | Ab initio | 53 | |
| Water–Kr | 17.10 | 3.75 | Exp | 40 and 53 |
| 14.2 | 3.86 | Model | 40 and 53 | |
| 17.92 | 3.71 | Ab initio | 53 | |
| O2–Kr | 13.37 | 3.88 | Exp | 40 and 60 |
| 14.3 | 3.91 | Model | 50 | |
| Ar–Kr | 14.33 | 3.91 | Exp | 58 |
| 14.1 | 3.92 | Model | 50 | |
| 13.09 | 3.95 | Ab initio | 53 | |
| Water–Xe | 20.20 | 3.93 | Exp | 40 and 53 |
| 16.1 | 4.04 | Model | 40 and 53 | |
| 21.26 | 3.89 | Ab initio | 53 | |
| O2–Xe | 15.24 | 4.05 | Exp | 40 and 60 |
| 16.0 | 4.09 | Model | 50 | |
| Ar–Xe | 16.09 | 4.10 | Exp | 58 |
| 15.9 | 4.09 | Model | 50 | |
| 14.58 | 4.15 | Ab initio | 53 |
It is interesting to note that, in the case of water–D2, it has also been demonstrated61 that the spherically averaged potentials for isotopologues are practically indistinguishable within the present experimental uncertainty, and this represented an essential support to the use of isotopically substituted species in the experiments involving hydrogenated species.
2.4 The theoretical approach
Most of the theoretical calculations for systems involving hydrogenated molecules have been carried out at coupled-cluster singles, doubles, and perturbative triple excitations (CCSD(T)).65–70 The effect of different basis sets has also been explored.65–70 All ab initio calculations have been performed using a MOLPRO program (significant details are given in ref. 53). The BSSE-corrected CCSD(T)/AV5Z approach has been used to obtain the theoretical results reported in Tables 1 and 2.The most important objective has been identifying the nature of the stabilization component that adds to the vdW interaction for several adducts involving water-closed shell partners, as highlighted in Tables 1–3. The results in Tables 1–3 were obtained by considering the average over the entire range of relative configurations probed by scattering events involving rotationally hot molecules.53,61,62 Leveraging very accurate theoretical calculations and detailed analysis of the electron density displacement, we found that electron/charge transfer between interacting partners is the key factor contributing to the stabilization of adducts.23,25,53,61 In particular, when noble gas (Ng) atoms are involved, the charge transfer occurs from Ng to water, while with hydrogen molecules, CT takes place both from hydrogen molecules to water but also from water to hydrogen molecules, depending on the geometry of the adduct. In particular, when the hydrogen molecule approaches water on the oxygen side, water acts as an electron donor, and when the hydrogen molecule approaches water toward the hydrogen atoms, water acts as an electron acceptor.61 Therefore, according to the Lewis definition, water behaves as an amphoteric species, in this intermolecular complex depending on the geometry of formed adduct. Interestingly, this property is connected to the HB stability61 because the CT interaction stabilizes the adduct in both cases.
As can be verified from Tables 1–3, the experimental methodology discussed above is quite sensitive and can reveal intermolecular bond stabilization energy contributions of a few tenths of meV (fractions of 0.1 kJ mol−1). These small interaction effects are very computationally demanding, since a quantitative description of these weak intermolecular interactions (particularly their relative changes when passing from one system to another) requires the use of huge basis sets and must accurately describe the electronic correlation. Moreover, the role of the CT component in the total interaction is a priori complex to be assessed due to only one or two milli-electrons, which is close to the limits of arbitrariness inherent in any charge decomposition model.
In our laboratory, this problem has been successfully tackled23,25,53 by performing state-of-the-art ab initio calculations on the water–Ng and Ar–Ng systems accompanied by a detailed analysis of the computed change in the electron density variation upon the formation of the complexes. The adopted approach is based on the study of the function
 | (3) |
In the present study, the intermolecular axis of interest joins the Ng atom with another Ng or with the oxygen atom of water (close to the water centre of mass). In the latter case, water has been considered at different orientations compared to Ng. The evaluation of Δq(z) by eqn (3) provides a detailed snapshot of electron charge displacement across the entire molecular region. In this way, we were able to show23 that CT occurs more effectively in water-heavier Ng complexes and, most importantly, its amount is almost proportional to the bond stabilization that correlates linearly with the observed glory shifts.53
Fig. 4 compares the behavior of the Ne–Ar reference system, binding by a pure vdW interaction, with that of water–Ne. This figure shows that in the intermolecular region of the water–Ne complex, in its most stable configuration, the Δq(z) curve is negative everywhere. This fact means that at any position along the Ne–O axis, a small (but defined) amount of electronic charge has been transferred from Ne to water. In contrast, the curve for the Ne–Ar complex crosses zero twice, and its integral Δq(z) is zero, indicating a null electron transfer. Moreover, in the considered configuration, water points with an H atom towards Ne, and CT extends roughly constantly across an ample region of z distances. This fact means that roughly the same CT effect would emerge regardless of the exact position where a boundary is placed between the interacting fragments. In other words, this shows that, in this specific case, CT, although small, is essentially model-independent. However, averaging over all the relative configurations makes CT even lower and practically elusive for scattering experiments.
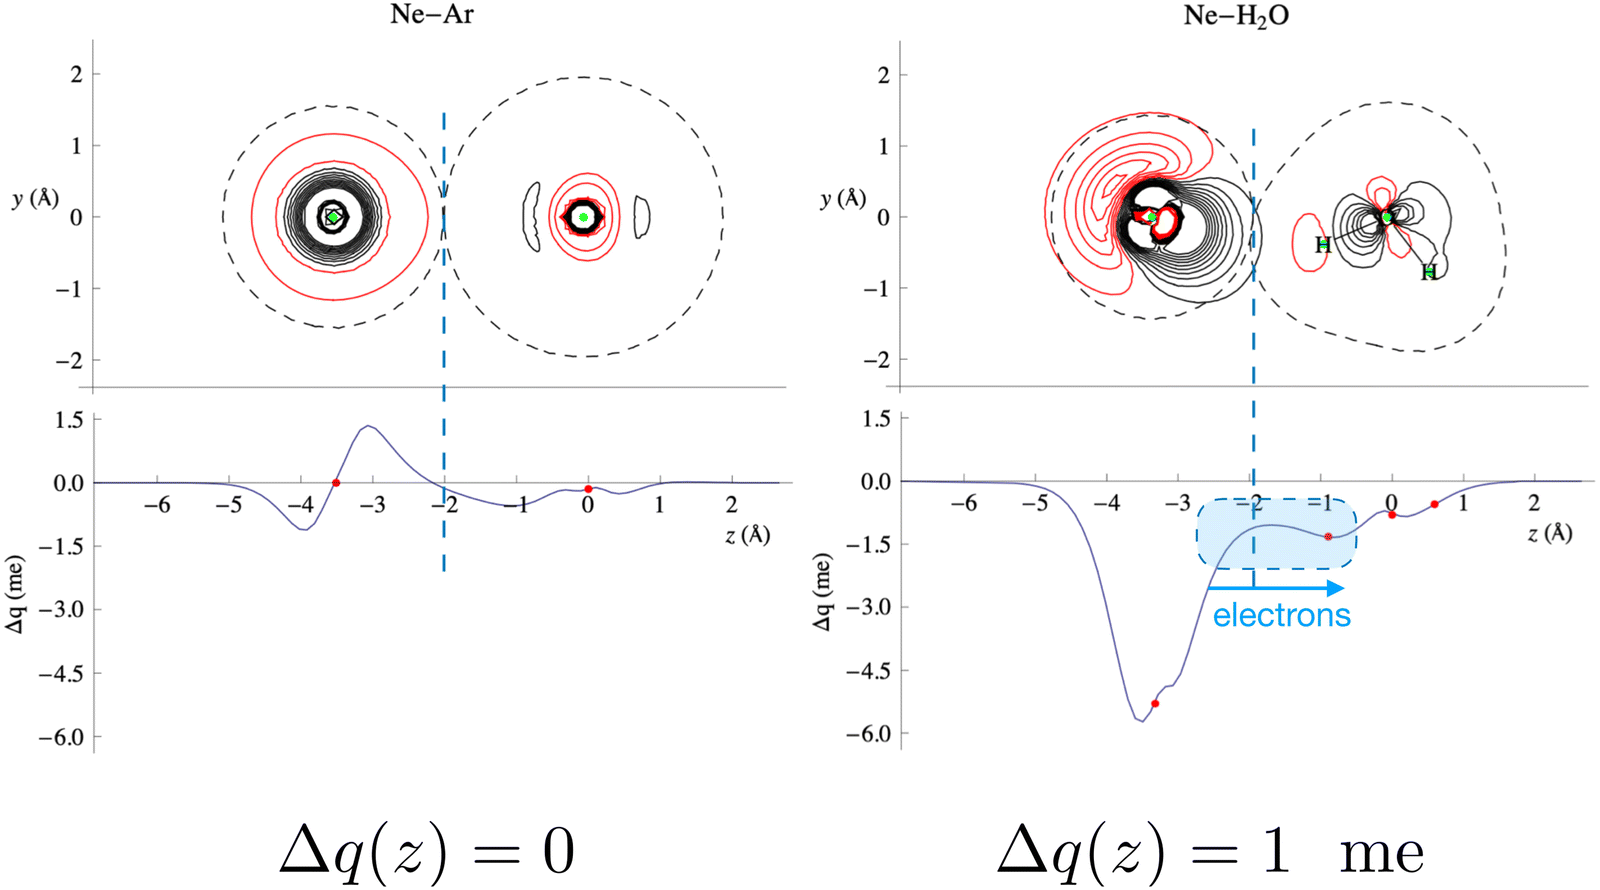 | ||
| Fig. 4 Contour plots of the electron density changes and Δq(z) curves upon formation of the Ne–Ar and Ne–H2O complexes. In the contour plots, the red lines denote negative values (density depletion) and the black lines are positive contours. The red dots on the Δq curves mark the projection of the nuclear positions on the internuclear axis (Ne–O axis in the case of water). The axis origin is at the Ar position for Ne–Ar and at the oxygen position for Ne–H2O. See the text and ref. 25 for more details. Adapted from Fig. 2 of ref. 23. | ||
The Δq(z) values found for the water-heavier Ng complexes are significantly larger, making associated bond stabilizations experimentally measurable.23,25,40 More details on CT taking place in the water–Ng complexes, on its strong anisotropy, on its relationship with both natural bond order analysis,71 and the results of the experiments, are given in ref. 23, 25 and 53. For the prototype water–Xe system, the information provided by the combined experimental–theoretical approach is summarized in Fig. 5. Such a figure also shows how two basic interaction components scale differently with distances: while polarization induced on Xe by the permanent dipole of water decreases as R−3, CT falls off exponentially because it depends on the overlap between the outer electronic clouds of the two interacting partners.
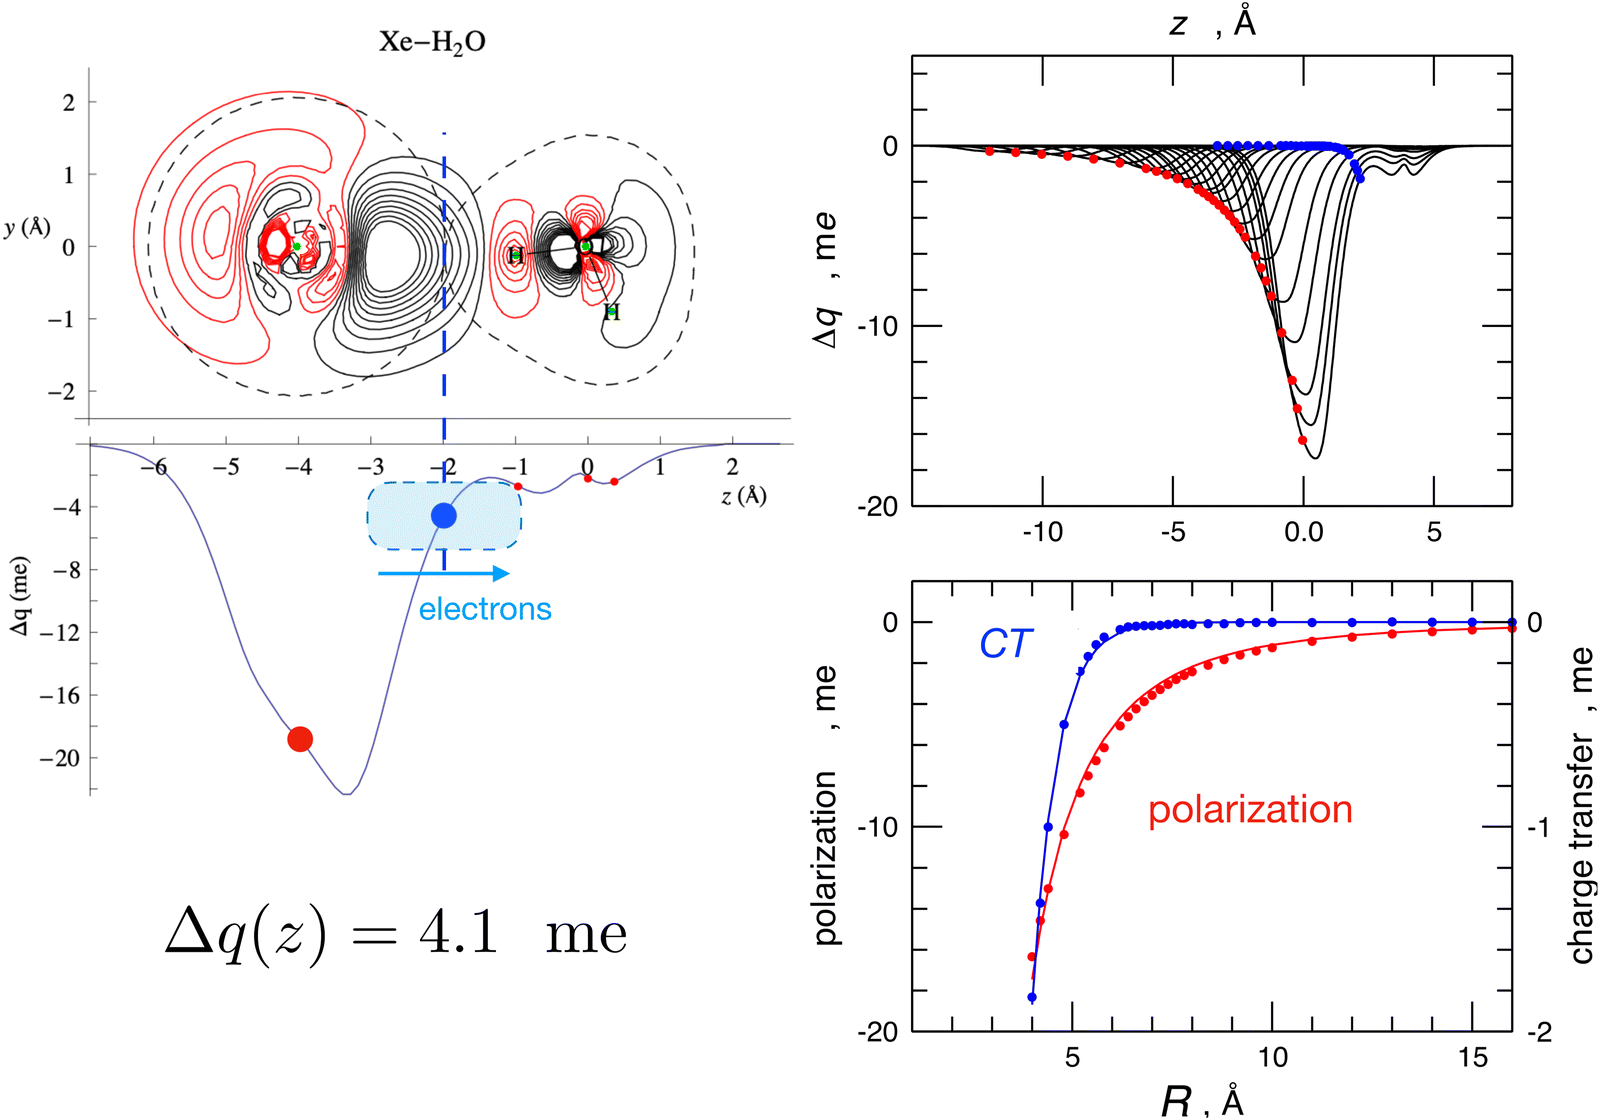 | ||
| Fig. 5 Left: contour plots of the electron density changes and Δq(z) curves upon formation of the Xe–H2O complex. Left lower panel: the CD curve calculated for the equilibrium geometry of the complex. The red circles correspond to the nuclei position, and the blue circles correspond to the isodensity boundary. Right upper panel: CD curves calculated for different distances R between Xe and water's c.m., with Xe lying on the water's C2v axis and on the hydrogen side. R ranges between 4.0 Å, which corresponds to the equilibrium distance, and 16.0 Å. Right lower panel: fit of Δq values at the Xe position (red, polarization) and at the isodensity boundary (blue, charge transfer) as a function of R. Polarization has been fitted with a R−3 function while CT has been fitted with an exponential function. See text and ref. 23 for major details. | ||
The same methodology has been exploited to investigate the interaction of water with other molecules, such as nitrogen, oxygen, and methane,72–74 and the interaction of ammonia and hydrogen sulphide with atomic and molecular partners.75–79 In all cases, the target has been an accurate characterization of the intermolecular interaction with an assessment of the role of the leading components, including the charge transfer.
3. Stereo-dynamical effects in collisions between hydrogenated molecules
A commonly accepted assumption in molecular scattering is that during the temporal evolution of a two-body collision, randomly oriented molecules should maintain a statistical-isotropic distribution of their relative orientations; therefore, in the case of polar molecules, any electrostatic effect due to the permanent dipole–permanent dipole interaction should wash out due to the perfect balance between attractive and repulsive configurations. If this is the case, the effective average long-range attraction probed by polar molecule pair collisions should coincide with the combination of dispersion plus induction attraction only. As anticipated above, the long-range attraction determines the absolute value of the cross-section. For example, in the case of water–water collisional pairs, the absolute value of the cross-section should be close to that of the O2–Ar reference case since the two considered collisional pairs have nearly the same isotropic dispersion plus induction attractive interaction.The measure of the absolute value of the cross-section, performed in the Perugia laboratory, shed light on these aspects. Scattering experiments performed under the same conditions on water–water, water–ammonia, water–hydrogen sulfide, and ammonia–hydrogen sulfide systems evidenced strong anomalies in the trend of the absolute values of Q(v) for what is expected from the commonly accepted statistical behavior of molecules in a collision, introduced above. Such anomalies have been ascribed to the residual (i.e. not fully averaged) role of high anisotropic long-range electrostatic contributions.44,80 For instance, the absolute value of Q(v) measured in the water–water case is about a factor 2.5 higher compared to the O2–Ar reference case, as shown in the upper panel of Fig. 6.
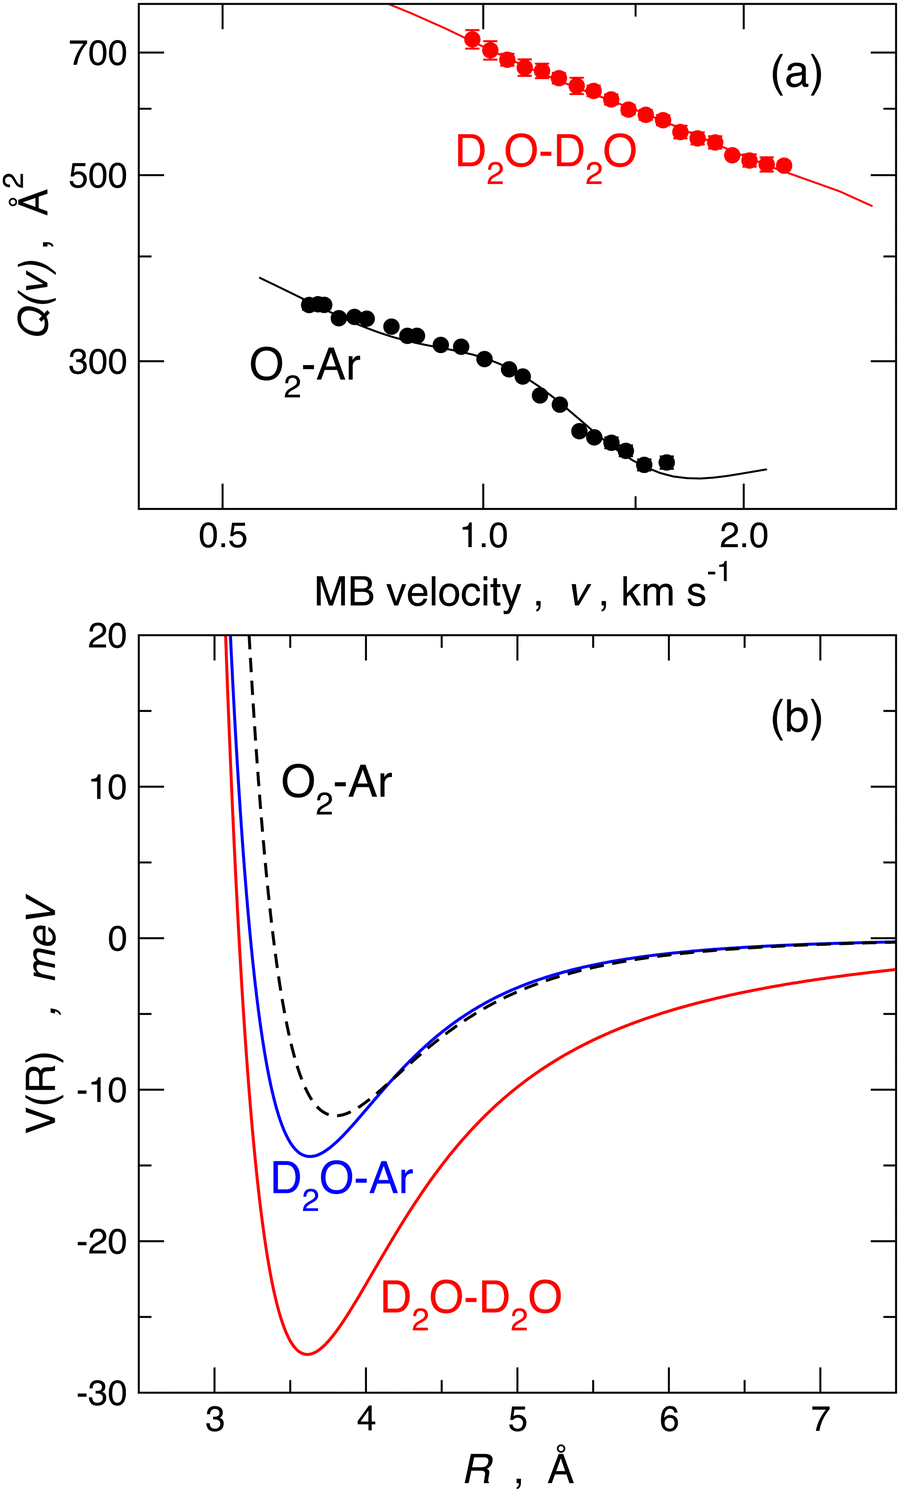 | ||
| Fig. 6 Panel (a): comparison of the measured Q(v) data. Panel (b): the best fit experimental interaction potential for O2–Ar (black dashed, van der Waals), D2O–Ar (blue continuous, weak HB) and D2O–D2O (red, strong HB): 1 meV = 0.096485 kJ mol−1. Spherically averaged potentials are plotted and used for the scattering cross-section calculation reported in panel (a). | ||
In synthesis, the experimental findings suggest an evident role of pendular states, which can engage polar molecules in a concerted rotational motion and bring the outcome of the collision far from the statistical behavior.44,80
Pendular states have been introduced to explain the alignment dynamics of polar molecules in low rotational states induced by strong external electric fields, either static or radiative.81–83 The interaction of the external electric field with either permanent or induced dipole molecular moments creates pendular states, directional superpositions of the field-free rotational states. Under these conditions, the molecular axis is confined to oscillate over a limited angular range about the field direction. Our work demonstrated that the strong intermolecular electric field between two polar molecules can generate pendular states, and confine the molecular axes to librate in restricted angular cones along the intermolecular axis, acting similarly to the external fields mentioned above.
More specifically, in order to visualize the possible free-rotation to pendular state transition, we carried out a classical mechanical simulation44,80 to describe the dynamics of dipole–dipole interaction along a single collision, exploiting a realistic empirical long-range potential obtained from the fit of the experimental data. The lower panel of Fig. 6 shows the interaction potentials that fit the measured cross-sections reported in the upper panel. The model has been extensively applied44,80 to the prototypical water–water systems under a wide variety of rotational states, impact parameters, relative collision velocities, and a manifold of initial relative orientations in order to evaluate the emergence and development of pendular states, the influences of the forces driving this transformation, the role of rotational states and, finally, the characteristic energy and time scale of this process. An example is shown in Fig. 7, which illustrates the case of two water molecules, both in the rotational state J = 1, colliding at a relative collision energy of 1.5 km s−1 at an impact parameter b = 10 Å. This figure illustrates how, at these relatively large-intermediate distances, a transition from free to hindered rotations and, subsequently, at shorter distances, the passage to libration states occurs in a timescale of about 4 picoseconds.
 | ||
| Fig. 7 Example of a molecular collision at a relative collision velocity of g = 1.5 km s−1 and impact parameter b = 10 Å. Both water molecules are initially in the rotational level J = 1. In the initial −6 ps < t < −2 ps time-frame, they freely rotate but, at approximately 40 Å distance (t = −2 ps), they start to interact, as indicated by the slight distortion of their motion; in the −2 ps < t < 2 ps time-frame, a pendular state arises and the associated coupled motion manifests in the neighborhood of the turning point (R = 10 Å; t = 0); further more (2 ps < t < 6 ps) at R >40 Å, the molecules return to the free rotor condition but with a change of the relative orientation of J. For major details, see ref. 44 and 80. Reproduced from ref. 44 with permission from AIP publishing, copyright © 2014. | ||
The adopted treatment of the collision dynamics indicated that an appreciable fraction44,80 of polar molecules could be captured in this synchronized motion. It has also been demonstrated44,80 that the effect increases when both partners are in the same low-lying rotational states in order to obtain the most efficient capture and the best synchronization of “pendular” motions and also depends significantly on the magnitude of the dipole moment of the involved molecules. An illustration is provided in Fig. 8, where experimental cross-sections of water, ammonia and hydrogen sulphide complexes are measured and compared with reference van der Waals cases. The best fit Q(v) has been obtained by exploiting an effective potential including VvdW and Velec terms. This figure shows the dashed lines for the Qref(v) of four reference systems (Ar–Ar, Ar–Kr, Ar, Xe and Kr–Xe), chosen on the basis of their polarizabilities,50 and having similar VvdW terms (but not Velec) as the corresponding polar pairs. A plot of the Q(v)/Qref(v) ratio in the lower panel shows a clear linear trend as a function of the product of the dipole moments of the polar pair and therefore provides the robust support to the present results. Adopted treatment and obtained correlation suggest that, under the used experimental conditions, the pendular state formation should be ineffective for dipole moment products lower than 1 square Debye.
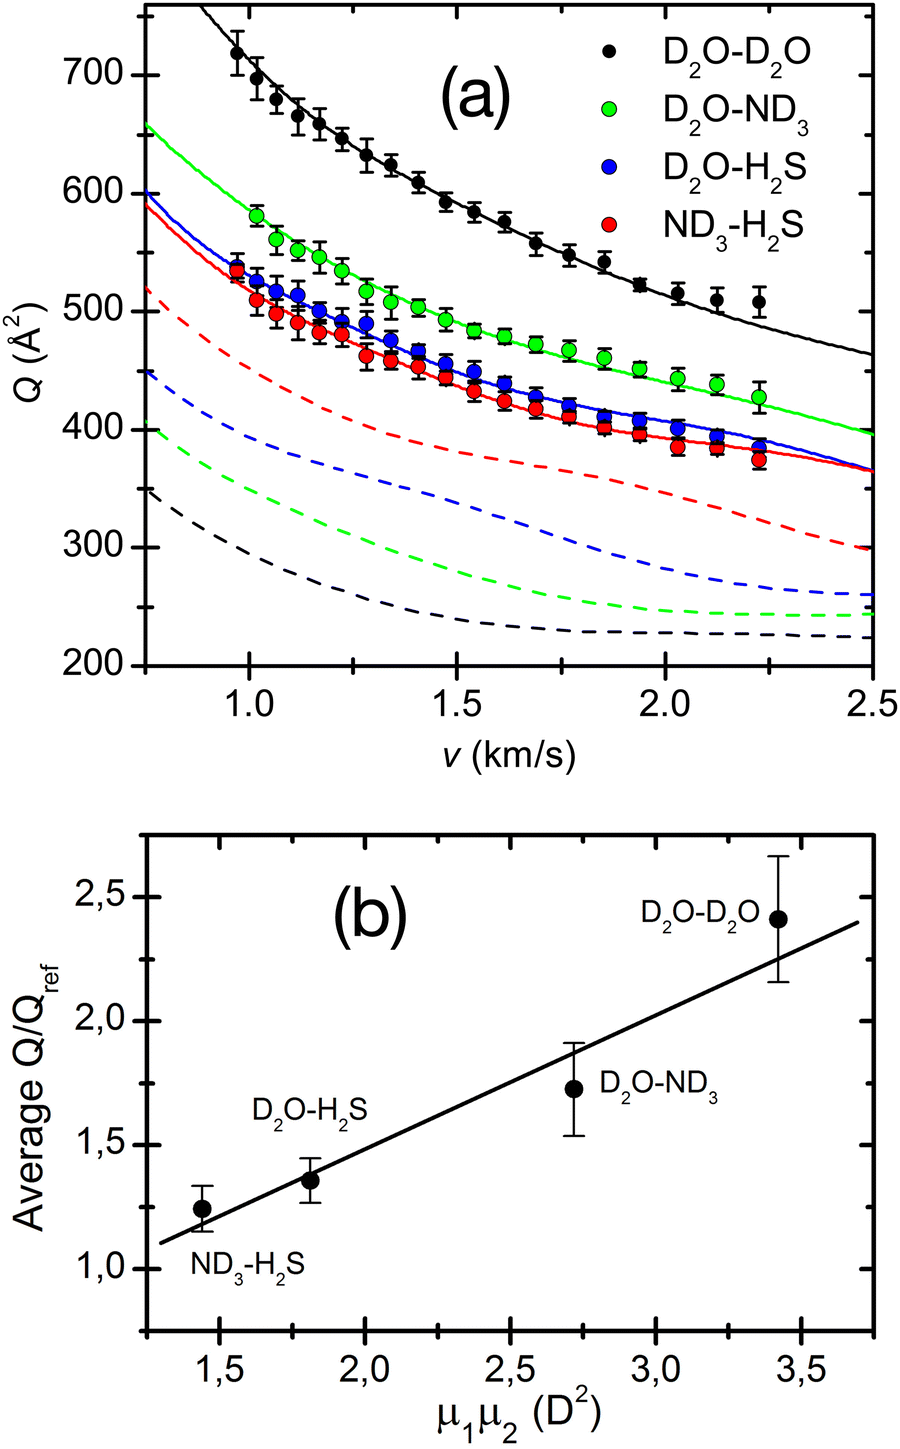 | ||
| Fig. 8 (a) Total integral collision cross-sections Q(v), as a function of the collision velocity v, for the D2O–D2O, D2O–ND3, D2O–H2S and ND3–H2S polar pairs. The dashed lines are Qref(v) calculated for the reference pairs, Ar–Ar (black, reference for D2O–D2O), Ar–Kr (green, reference for D2O–ND3), Ar–Xe (blue, reference for D2O–H2S) and Kr–Xe (red, reference for ND3–H2S) and convoluted in the laboratory frame under the same conditions. (b) Average ratios of the polar pairs cross-sections versus the reference systems as a function of the permanent dipole product of the polar pairs. 1 D (Debye) = 3.336 × 10⁻³⁰ C·m. Reproduced from ref. 44 with permission from AIP publishing, copyright © 2014. | ||
In conclusion, when two polar molecules collide a natural alignment arises at long-range, where the electrostatic interaction dominates and may influence the evolution of the collisional process. We proved this molecular alignment for elastic collisions, but it can also affect reactive processes with obvious relevant consequences on the reaction stereo-dynamics (see references cited below) in particular for rotationally cold molecules.
4. The investigation of weak XB
Our contribution to this topic started with the study of rare gases interacting with the halogenated CCl4, and CF4 molecules.29,84,85 MB scattering experiments revealed that CF4 interacts with typical anisotropic van der Waals forces in all the examined cases. Under the same experimental conditions, CCl4, even in complexes with the lighter He and Ne atoms, shows evidence of a chemical interaction component of appreciable strength that adds to the ubiquitous vdW terms.29,84,85 A detailed partition analysis of the potential energy surface of these systems allowed us to attribute this interaction component to a charge (electron) transfer contribution from Ng (Ng = He, Ne, and Ar) to CCl4. This stabilization energy arises from the anisotropy of the electron density of CCl4. The direct consequence is a stereo-selective stabilization effect that emerges when Ng points toward the σ-hole associated with each C–Cl bond and disappears for the approach perpendicular to the tetrahedral face of CCl4. These findings suggest that CCl4–Ng adducts are peculiar examples of weak halogen bonds.29,84,85We extended the study to analogous complexes involving water, and we found86 that, consistent with previous cases, the water–CF4 adduct binds again through a canonical anisotropic vdW interaction. Conversely, appreciable intermolecular bond stabilization by charge transfer occurs in water–CCl4, but with a more complex anisotropic interaction scenario. Specifically, a sizable CT from H2O to CCl4 is operative for the vertex (halogen bonding) configuration when water approaches CCl4, pointing the oxygen toward the C–Cl bond. In analogy to the Ng–CCl4 cases, this interaction component has been identified as a canonical halogen bond. Interestingly, a CT effect also occurs from CCl4 toward H2O for the configurations where an H atom of water points the Cl along its lone pairs in a direction approximately perpendicular to the C–Cl bond. These features are consistent with the formation of a weak intermolecular hydrogen bond.86
Subsequently,87–90 we investigated in detail the weakly bound complexes formed by a noble gas Ng and a di-halogen molecule X2 (X = Cl, Br, I). The analysis of the interaction anisotropy of these systems has been based on a comparison with classic atom-homonuclear diatom anisotropic van der Waals interactions, such as those in Ng–H2, Ng–N2, and Ng–O2 reference cases.87 Herein, the relative stability of the parallel configurations compared to the perpendicular configurations defines the interaction anisotropy. Usually, the perpendicular configuration is the most stable.
Our results for the Ng–X2 systems demonstrate the formation of a weak intermolecular XB,22 exclusively when the X2 moiety is confined in its ground (X 2Σ+g) electronic state and the complex forms in the collinear configuration. Under such conditions, the σ-hole of X2, combined with the associated polar flattening (PF) and CT effects, substantially increase the stabilization of Ng–X2 intermolecular bonds. It was also found87–90 that the intermolecular bond, formed when the X2 interacting partner is in the first excited (B 3Πu) electronic state, assumes a typical anisotropic van der Waals character just because the σ-hole, PF, and CT effects disappear.
An illustration of the parallel and perpendicular configurations of the Ar–Cl2 complex, with Cl2 in the ground and first excited electronic states, is shown in Fig. 9. In the figure, the empirical potentials (whose formulation is summarized below) are compared with ab initio results and show an excellent agreement. In the same figure, the electron density contour plots of Cl2 in the ground and the first excited electronic state and the coordinate systems employed for the Ng–X2 complexes are also reported. It is apparent from the figure that how the anisotropy of the interaction is strikingly different when considering the Cl2 molecule in the two different electronic states. This effect has been related87 to the presence of an XB for the parallel configuration of the complex for Cl2 in the ground electronic state. The XB is not present for the perpendicular configuration and disappears for the parallel configuration when Cl2 is electronically excited.87
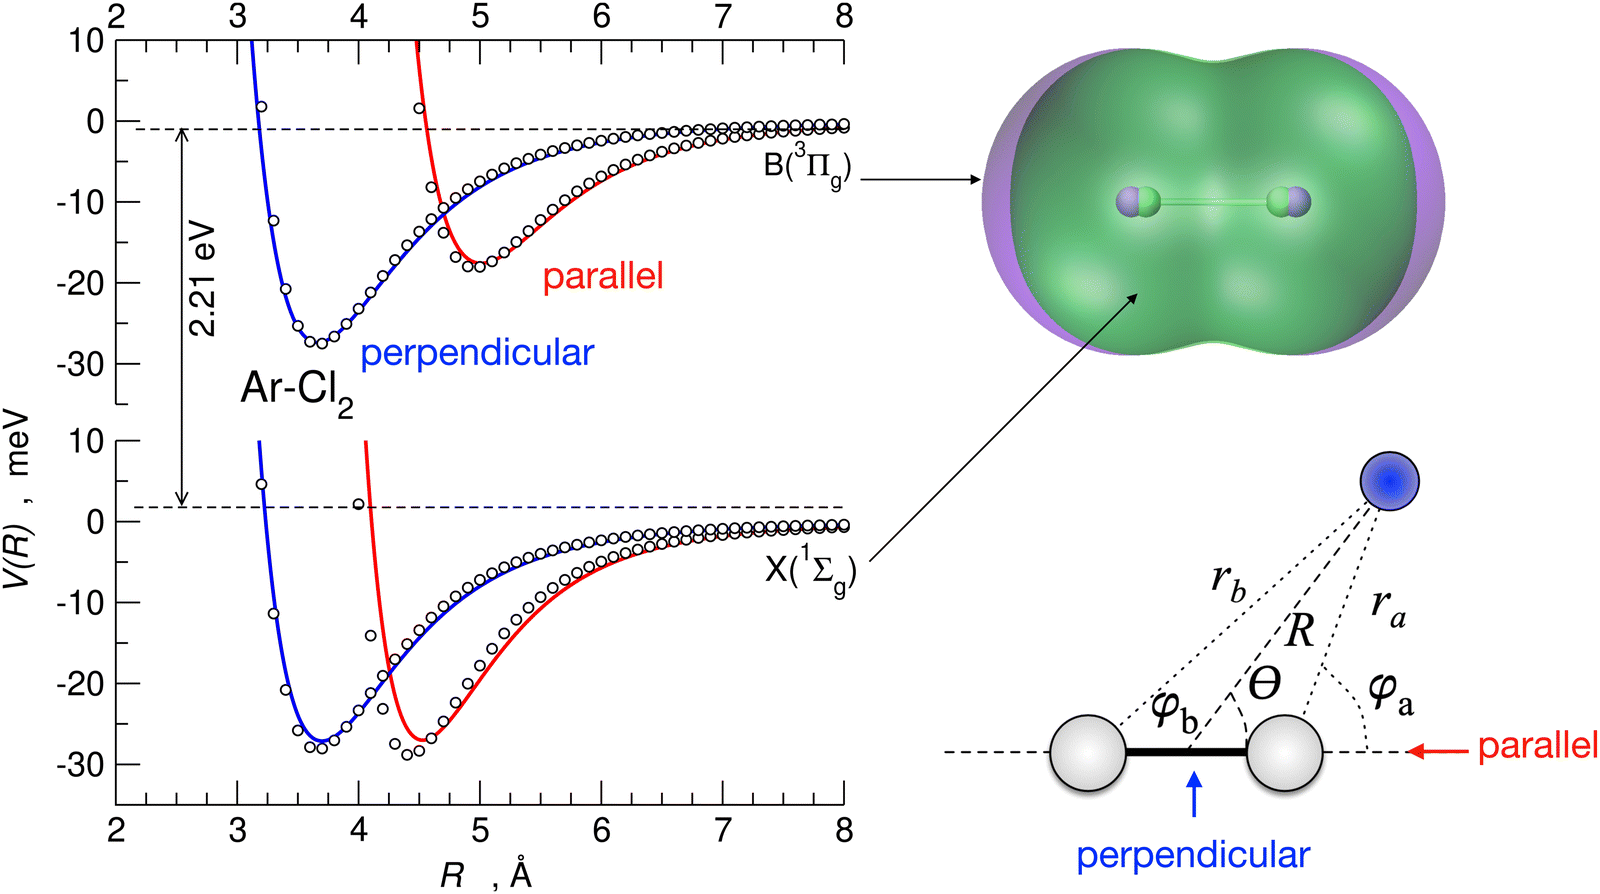 | ||
| Fig. 9 The interaction potential, V, as a function of the intermolecular distance, R, for the Ar–Cl2 complex, in the parallel (red) and perpendicular (blue) configurations, for Cl2 in both the ground X 1Σ+g and excited B 3Πu electronic states derived from the present formulation (solid lines) and ab initio calculations (open circles). Upper right panel: the superposition of the electron density contour plots of Cl2 in the two electronic states (green 1Σ+g, violet B 3Πu, cutoff at 6 × 10⁻⁴ meV Bohr−3). Bottom right: coordinate systems for the Ng–Cl2 systems under study. | ||
In a more recent paper,91 we also evaluated the strength and range of the intermolecular potential of Cl2 interacting with simple diatomic and polyatomic molecules, specifically D2, O2, D2O, and ND3. The analysis of the experimental scattering observables indicates that a weak XB bond characterizes the D2–Cl2 and O2–Cl2 complexes as in Ng–Cl2 systems. The same analysis suggests91 that D2O–Cl2 and ND3–Cl2 are cases where CT plays an increased role,92,93 associated with XB and HB configurations.
5. The simple molecule–Br2 systems
In this perspective review, we extend our investigation of XB to the Br2 molecule interacting with other simple molecules, such as D2, O2, D2O, and ND3. We present novel experimental results and a comparison with the homologous systems involving Cl2. Scattering cross-sections have been measured with the MB technique under the same experimental conditions adopted in our previous work on Ng–Cl2, Br2, and molecule–Cl2 interacting pairs.87–91 Therefore, an internally consistent comparison/analysis of the experimental observables is possible and provides interesting information on the interaction potential features and their effect on the collision dynamics.5.1 Potential energy formulation
Although basic details of the methodology exploited are given in previous works,87–91 some general aspects are summarized here to illustrate the analysis of the new experimental results and to facilitate comparisons among corresponding systems.All scattering experiments were performed using near-effusive and rotationally excited light projectile molecules (D2, O2, D2O, and ND3), which rotate faster than the heavier X2 (X2 = Cl2 or Br2) targets. Therefore, during each collisional event, the projectile molecule tends to average its spatial orientations while the slowly rotating X2 target, particularly at high collision velocity, is seen as frozen in specific angular configurations. Therefore, the experimental observables must depend on different averaging effects, whose balance is influenced by the collision energy. For the symmetric and homo-nuclear diatomic D2 and O2 projectiles, it is reasonable to assume that a full average of their relative orientations is operative for most collision energies. Therefore, extending the formulation we developed for the NgX2 systems,87–91 the interaction potential has been defined as that of an effective atomic species, AS, interacting with a heavier-slower rotating anisotropic X2 molecule. Accordingly, the total intermolecular potential V has been formulated as the sum of three anisotropic components, identified as van der Waals, VvdW, three-body, V3B, and charge transfer, VCT.87–91 The last two components vanish exponentially with the increasing separation distance because they are related to the overlap of valence orbitals.7,87–91 In particular, for X2 molecules, V3B accounts for the peculiar angular dependence of the size repulsion component (see below).
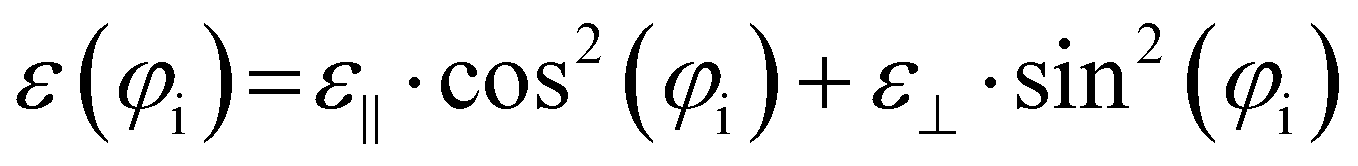
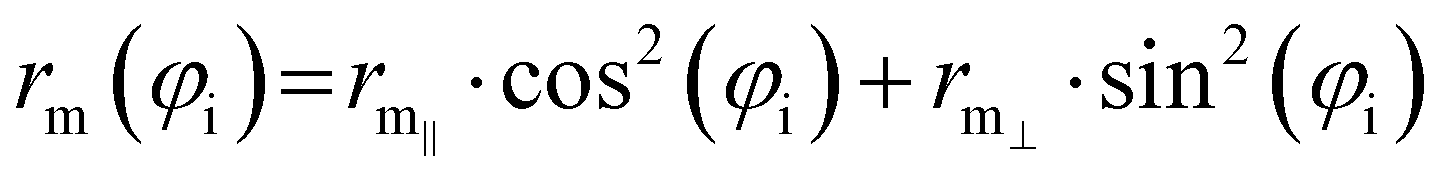
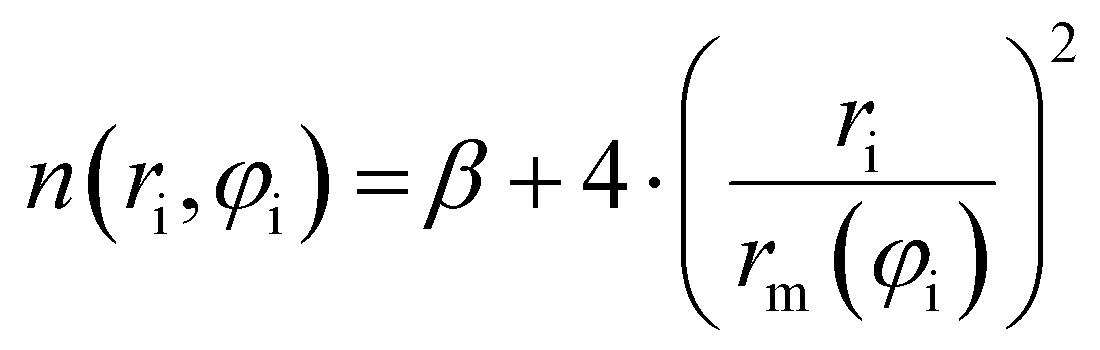
Assuming R as the distance between AS and X2 centers of mass and denoting θ as the angle between the vector R and the Br–Br (or Cl–Cl) bond axis, the total anisotropic intermolecular potential V(R, θ) is defined as the combination of three main components.
 | (4) |
 | (5) |
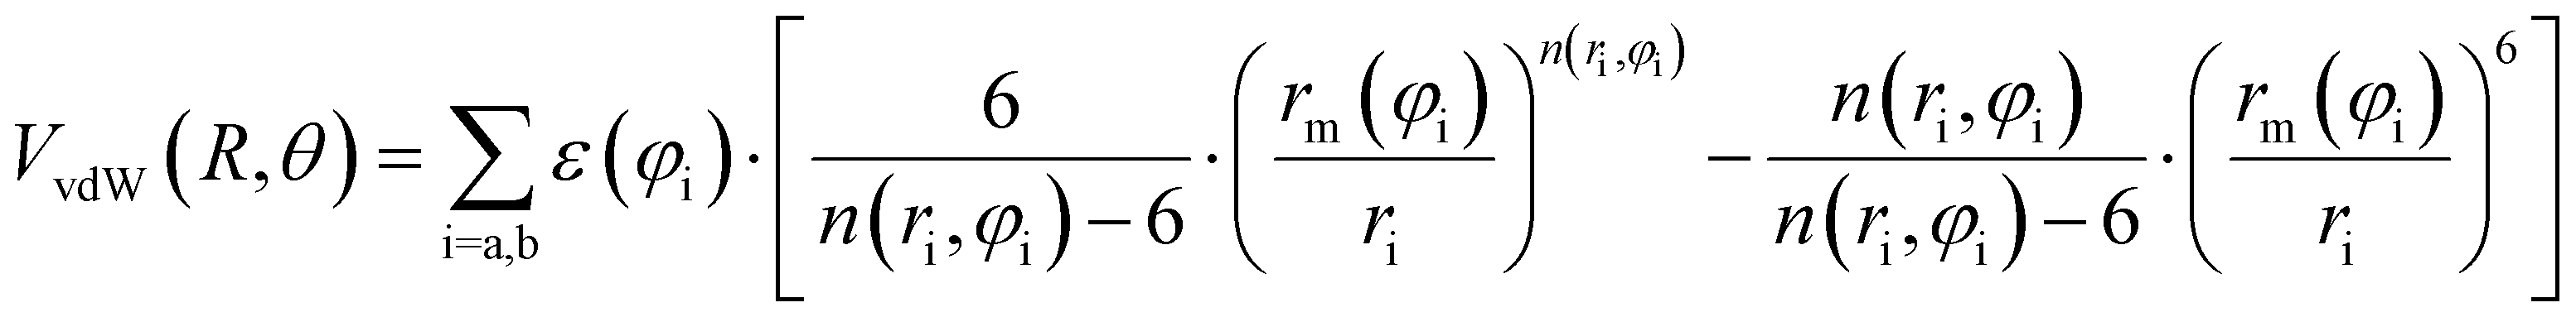 | (6) |
 | (7) |
 | (8) |
 | (9) |
 Accordingly, the total attraction C6t coefficient is given as the sum of the two angular averaged C6i components.
Previously,29,84–91 the zero-order values of the ε and rm parameters have been estimated from the polarizability components of the partners,52,94–96 according to scaling laws of van der Waals interactions,7,50 and evaluated for all systems in an internally consistent way. Such values have been tested and, when necessary, fine-tuned by exploiting the comparison of calculated cross-sections with experimental results. Moreover, the zero-order values of rm‖ have been decreased by about 4–5% to account for the polar flattening effect that emerges more effectively along chemical bond directions involving Cl and Br atoms and provides a shift of the repulsive wall.29,85–91
The three-body term, V3B, was considered to account for the density of outer valence electrons in the π* molecular orbitals of X2, which mainly determines anisotropic size-repulsion contributions:87–91
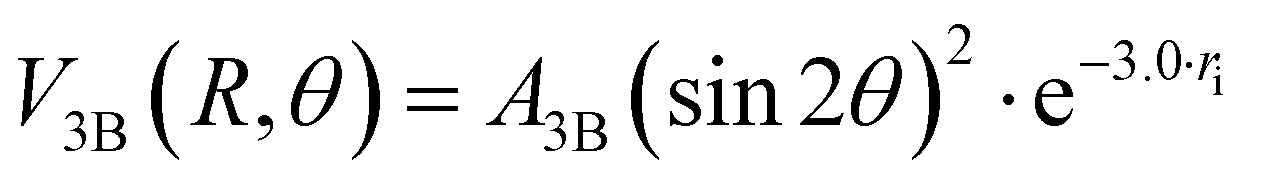 | (10) |
 | (11) |
Furthermore, in the formulation of the interaction energy of the D2O–X2 and ND3-X2 complexes, it is necessary to introduce an additional electrostatic component, Velest, due to the permanent dipole (μe)-permanent quadrupole (θe) interaction.97 This term is strongly dependent on R and on the relative orientation of the two partners and is expected to favor the formation of pendular states (see Section 3) probing the most attractive configurations of the adducts, where molecules in low-lying rotational states can be preferentially trapped because of their anisotropic interaction.
V elest can be formulated with a semi-empirical expression,97 including the permanent electric dipole μe of the polar hydrogenated molecule and the permanent electric quadrupole moments θe of X2:
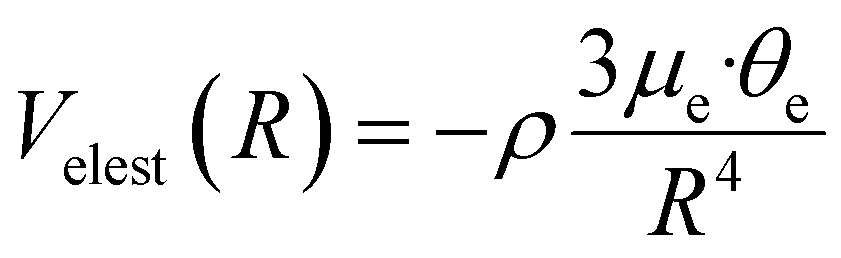 | (12) |
In eqn (12), ρ indicates the average fraction of D2O and ND3 polar molecules undergoing the transition from the isotropic statistical distribution of their orientations (ρ = 0) relative to X2 to a partial polarization (0 > ρ > 1) induced by the anisotropy of the interaction which is effective already at large R. Note that ρ can be evaluated from the experimental fitting the absolute value of the Q(v) and represents a lower limit of the actual average fraction since it accounts only for the most attractive dipole–quadrupole orientation (actually most of the molecules undergoing polarization fall in a larger angular cone of relative orientations).
5.2 Experimental data analysis and discussion
The dynamical treatment used for the data analysis87–91 allows for a sound reproduction of the measured cross-sections for all the investigated systems by a trial-and-error fit of the A3B, ACT, and ρ parameters while keeping unaltered (or variable in restricted ranges in order to maintain their physical meaning) the other parameters, namely those involved in eqn (7)–(9). Particular attention has been given to the correct reproduction of the glory pattern, mainly depending on A3B and ACT, and to the absolute value of Q(v), which varies with ρ. The final values of parameters are reported in Tables 4 and 5. Since Table 2 of ref. 91 provides for molecule–Cl2 systems potential parameter values with some misprints, the present Table 4 replaces the old one.| MA-pair | r m‖ (Å) | ε ‖ (meV) | r m⊥ (Å) | ε ⊥ (meV) | A CT (eV) | A 3B (eV) | ρ |
|---|---|---|---|---|---|---|---|
| The β parameter of the ILJ function (see text) has been fixed to 7.5 for all atom–atom pairs. The maximum estimated uncertainty values are about 7% for ε, 3% for rm, 15% for ACT and A3B and about 25–30% for ρ. | |||||||
| D2–Cl | 3.57 | 10.50 | 3.70 | 7.50 | 240 | 450 | 0 |
| O2–Cl | 3.75 | 17.10 | 3.93 | 11.10 | 160 | 700 | 0 |
| D2O–Cl | 3.61 | 21.00 | 3.70 | 16.00 | 260 | 500 | 0.010 |
| ND3–Cl | 3.72 | 22.10 | 3.86 | 15.50 | 460 | 700 | 0.018 |
| MA-pair | r m‖ (Å) | ε ‖ (meV) | r m⊥ (Å) | ε ⊥ (meV) | A CT (eV) | A 3B (eV) | ρ |
|---|---|---|---|---|---|---|---|
| The β parameter of the ILJ function (see the text) has been fixed to 7.0 for all atom–atom pairs. The maximum estimated uncertainty values are about 7% for ε, 3% for rm, 15% for ACT and A3B and about 25–30% for ρ. | |||||||
| D2–Br | 3.62 | 12.0 | 3.80 | 7.70 | 460 | 900 | 0 |
| O2–Br | 3.80 | 20.1 | 4.00 | 12.8 | 300 | 1400 | 0 |
| D2O–Br | 3.69 | 24.3 | 3.81 | 17.3 | 540 | 1000 | 0.020 |
| ND3–Br | 3.85 | 25.0 | 4.00 | 17.2 | 850 | 1500 | 0.030 |
For molecule–Br2 systems, the comparison between calculated and experimental results is given in Fig. 10, where the analogous molecule–Cl2 systems are also reported. The essential features of the PES for the molecule–Br2 systems are shown in Fig. 11, and for a comparison with those of molecule–Cl2 PESs, see Fig. 3 of ref. 91.
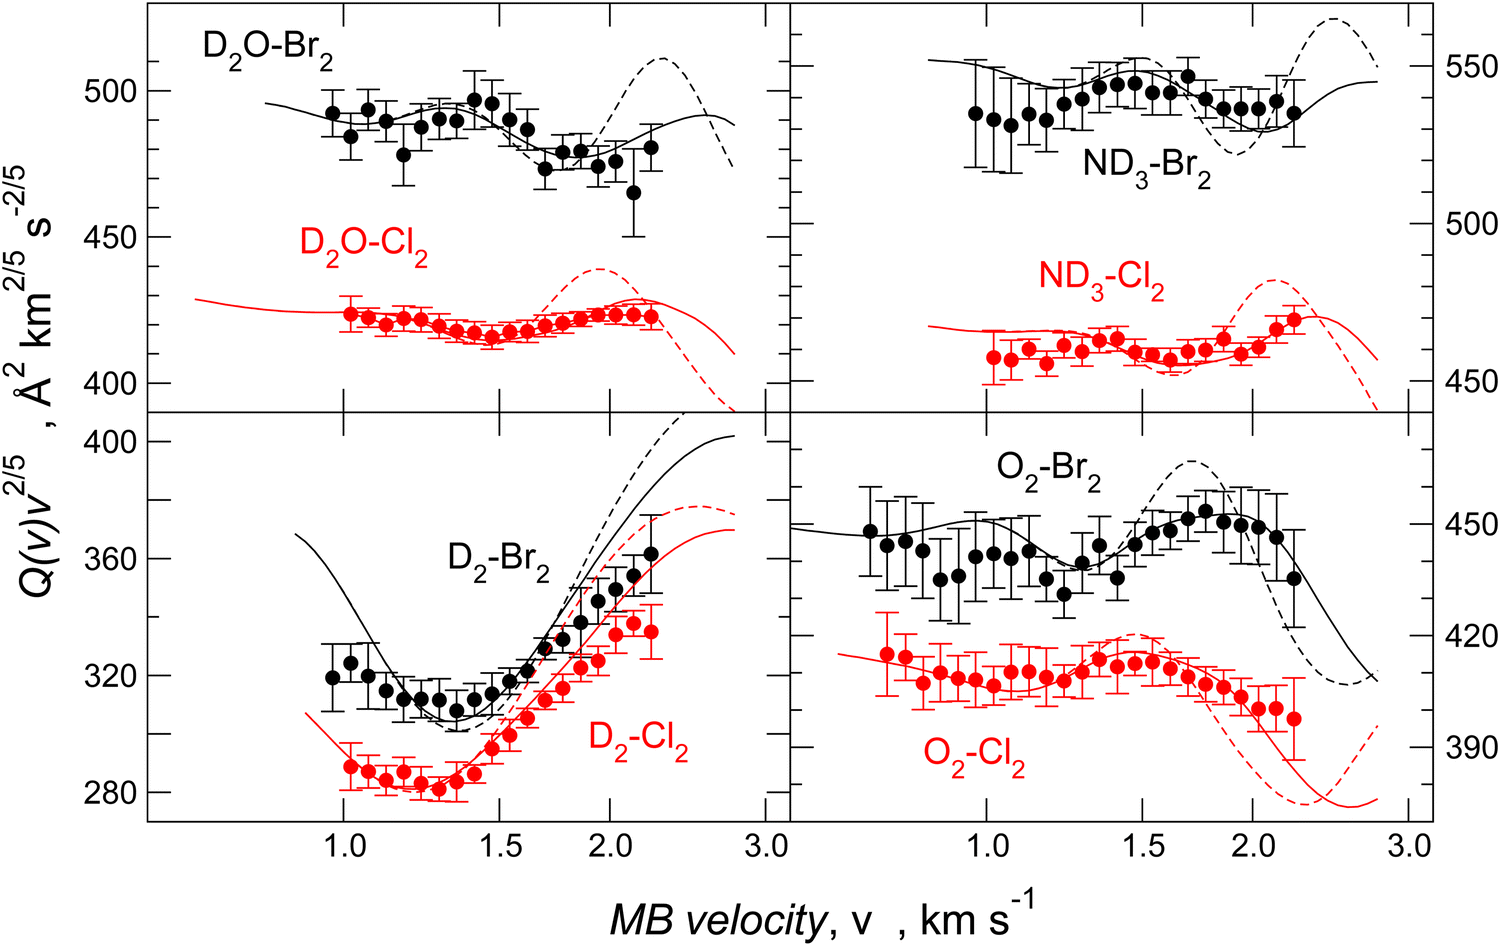 | ||
| Fig. 10 Integral cross-sections Q(v) for D2, O2, D2O, and ND3 molecular beams colliding at selected velocity v with Br2 (black) and Cl2 (red) molecular targets. Data are plotted as Q(v)·v2/5 to emphasize the glory patterns and the shifting in the extreme position. The dashed lines are calculations with spherically averaged interactions. The solid lines are calculations with the anisotropic potential surfaces. | ||
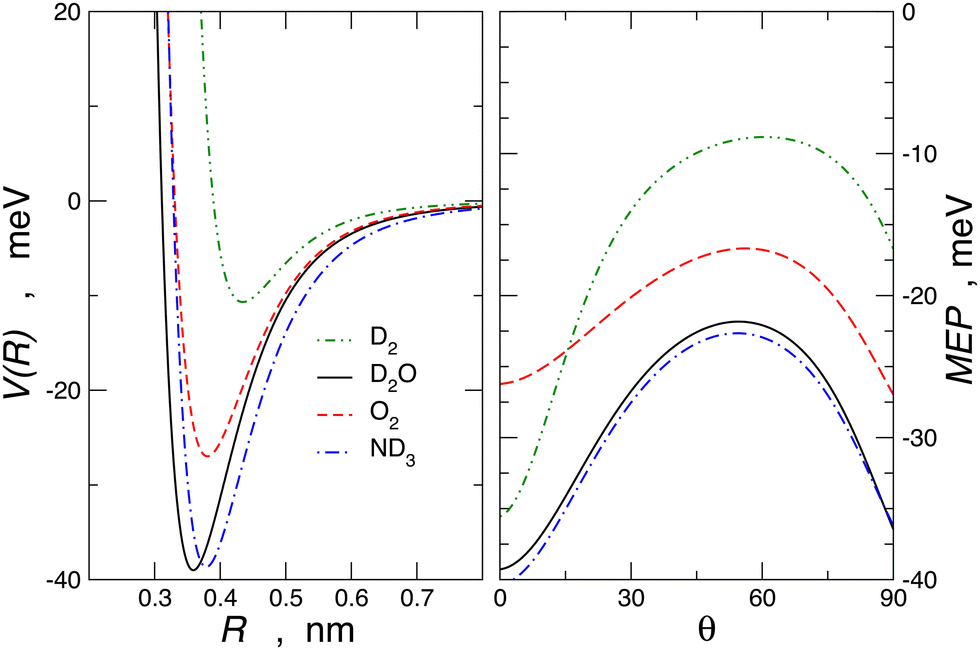 | ||
| Fig. 11 Left panel: spherically averaged potential energy curves, V(R), vs. centre of mass separation distance, R, for the molecule–Br2 complexes. Right panel: minimum energy path, MEP, vs. the angular variable θ for the Br2 complexes under investigation obtained by the present potential formulation. | ||
In all cases, the calculated data reproduces the absolute scale of measured Q(v), position, frequency, and amplitude of the glory pattern, representing an important test of the adopted potential formulation. A second confirmation of the analysis validity is the gradual variation of the potential parameter values according to the change in the fundamental physical properties of the interacting partners. From the parameters ε and rm in Tables 4 and 5, it is also possible to extract the angular averaged dispersion coefficient C6disp for hydrogen, oxygen, water, and ammonia molecules interacting with Cl2 and Br2, respectively. Data reported in Table 6 have been obtained by reducing the total attraction C6t, extracted by the ILJ function, and providing the strength of the long-range attraction, of about 10% in the case of water40,53 and of about 5% in the case of ammonia.75 This correction allows the subtraction of the additive contribution of the isotropic induction, due to the permanent dipole-induced dipole contribution averaged over all relative configurations. The methodology, tested on molecule–Cl2 systems, for which accurate C6disp coefficients are available,101 has been extended here to evaluate the dispersion coefficient for homologous cases involving Br2.
| System | C 6disp (eV·Å6) | Literature value101 |
|---|---|---|
| D2–Cl2 | 40.64 | 40.98 |
| O2–Cl2 | 88.02 | 91.25 |
| D2O–Cl2 | 78.49 | 78.94 |
| ND3–Cl2 | 104.4 | 111.3 |
| D2–Br2 | 49.94 | — |
| O2–Br2 | 112.8 | — |
| D2O–Br2 | 102.6 | — |
| ND3–Br2 | 143.2 | — |
Since Ar–Br2 exhibits  , whose value is in the same scale of C6t determined for O2–Br2 and of C6t obtained for D2O–Br2 (see Table 6), it becomes essential to compare the absolute value of measured cross-sections to show the emerging role of further components, particularly the effectiveness of electrostatic contributions, that add to the long-range dispersion plus induction attraction. An enlightening comparison is shown in Fig. 12, where cross-sections measured in the present experiments for D2O–Br2 and O2–Br2 are compared with those of Ar–Br2 determined with the same apparatus under the same conditions and reported in a recent work.90 Similarly to the case of the analogous chlorine systems,91 O2–Br2 and Ar–Br2 show, within the mutual experimental uncertainty, an average cross-section of the same magnitude, while D2O–Br2 exhibits some relevant differences in the measured cross-sections. In particular, this comparison emphasizes two important findings for D2O–Br2: a well-evident shift of the glory extreme position and a well-evident increase in the absolute value of the measured cross-section. The first finding represents the evidence that additional interaction components stabilize the binding energy of the adducts, where both weak HB and XB are formed simultaneously. In addition, the second finding arises from the “natural” molecular orientation due to anisotropic dipole–quadrupole electrostatic attraction.
 | ||
| Fig. 12 Integral cross-sections Q(v) for D2O, O2, and Ar projectiles colliding at selected velocity v with Br2 targets. Data are plotted as Q(v)·v2/5 to emphasize the glory patterns, the shifting in the extreme position and the increase in the absolute value of cross-sections. | ||
It is worth noting that stereo-dynamic effects related to long-range anisotropic interactions have been observed in other experiments carried out with different techniques. For instance, such effects emerge in inelastic scattering experiments between a molecular beam of CO2 impinging on the surface of a liquid solution containing various cations and anions (Li+, Na+, K+, Cl−, and I−)102 and in reactive cross-sections for the production of H3O+ by the reaction of a rovibrationally selected H2O+ ion and H2.103 We also recall the experimental findings observed in reactivity of He+-polar molecule systems, investigated in a wide collision energy range including thermal and hyper-thermal conditions.104–106
For recent examples of the influence of stereochemical effects on the reactivity of other ion–molecule systems at low and ultra-low collision energies, see, for instance, ref. 107–113.
6. Conclusions
The main focus of this perspective review has been to emphasize the relevance of total integral cross-section measurements by MB scattering experiments, performed under internally consistent experimental conditions, which allow the observation of quantum interference effects in the collision energy dependence and the determination of the absolute value of the cross-section.These experimental findings provide basic details on the intermolecular interaction potential and permit us to discern the selective role of interaction components that add to the ubiquitous vdW term. Particular interest has been paid to those components that determine the formation of the weak HB and XB, such as CT, σ-hole, and PF. Important information has been obtained from the measure of he blue-shift (or higher energy shift) of glory extreme positions compared to those of adequately selected reference cases.
In order to emphasize the sensitivity of the experimental observables, we report in Fig. 13Q(v) measured in the same collision energy range for systems involving water–Ar and water–O2 interacting with a weak HB, water–water giving prototype HB, and also water–Cl2 and water–Br2, where weak HB and XB simultaneously operate. The water–water system shows a long-range dispersion attraction coefficient, C6disp = 24.5 eV Å6, obtained from the vdW component parameters reported in ref. 114, which is the lowest relative to those of other systems plotted in Fig. 13 (see also Table 6). However, from the Figure, it appears that Q(v) measured for water–water exhibits the highest value because of a more prominent induction contribution, compared to that in water–Ar, O2, and, above all, of an effective-additional electrostatic permanent dipole–permanent dipole attraction. Consequently, the electrostatic contribution averaged over the effective molecular orientations is not entirely washed out, although asymptotically, both colliding molecules show isotropic spatial distributions of their rotational states. As emphasized in Section 5, this evidence suggests that during an appreciable fraction of collisions, the attractive configurations play a more significant role in comparison with the repulsive ones, suggesting that a partial orientation of the polar molecule is promoted within the electric field gradient associated with the anisotropic long-range interaction. This effect is natural and manifests as a well-evident increase in the absolute Q(v) value. We have also demonstrated that D2O–Cl291 and D2O–Br2 (see Fig. 12) show the increase in the absolute Q(v) value compared to the expected values from the combination of dispersion and induction attraction components. This observable has been ascribed to the permanent dipole–permanent quadrupole electrostatic anisotropic interaction, which, although less efficient than the permanent dipole–permanent dipole component, is sufficient to generate, in this case, an appreciable orientation of molecules. This phenomenon mainly affects molecules in the low-lying rotational states that collide with a relative kinetic energy confined in the thermal range.
 | ||
| Fig. 13 Comparison of the integral cross-sections Q(v) measured, under the same experimental conditions, for the scattering of D2O molecular beams, velocity selected in the v range, by Br2, Cl2 and other selected targets. | ||
Another important finding appears from the angular dependence of the interaction plotted in Fig. 11. It is shown that for θ = 0, D2–Br2 is more stable than O2–Br2, and this can be attributed to a more efficient role CT component, as also observed in D2–water61 compared to O2–water.72
We think that the present results can stimulate new theoretical investigations based on ab initio calculations, addressed to characterize further details of the nature of the weak HB and XB, and the development of semi-empirical models useful to describe vdW interactions and weak HB and XB in systems at increasing complexity. Two final targets of general interest can also be suggested: (i) the characterization of the structure and stability of the precursor state, formed by the trapping of reagents, stimulated by weak intermolecular long-range interactions, which affects the gas-phase reactivity and particularly that controlling the cold chemistry; (ii) the formulation of the force fields in systems of applied interest, as those involving molecules of biological interest.
Conflicts of interest
There are no conflicts to declare.References
- in Special issue “Long-Range Intermolecular Interactions in chemistry and Physics”, Chem. Phys. Lett., ed. S. Falcinelli and D. Cappelletti, 2022 Search PubMed.
- in Special issue “ Intermolecular forces: from atoms and molecules to nanostructures”, Molecules, ed. J. M. C. Marques, F. Prudente and F. Pirani, 2022 Search PubMed.
- L. C. Gilday, S. W. Robinson, T. A. Barendt, M. J. Langton, B. R. Mullaney and P. D. Beer, Chem. Rev., 2015, 115, 7118–7195 CrossRef CAS PubMed.
- Z. M. Han, G. Czap, C. L. Chiang, C. Xu, P. J. Wagner, X. Y. Wei, Y. X. Zhang, R. Q. Wu and W. Ho, Science, 2017, 358, 206–210 CrossRef CAS PubMed.
- W. Weinhold, Molecules, 2023, 28, 3776 CrossRef PubMed.
- F. Pirani, A. Giulivi, D. Cappelletti and V. Aquilanti, Mol. Phys., 2000, 98, 1749–1762 CrossRef CAS.
- F. Pirani, G. S. Maciel, D. Cappelletti and V. Aquilanti, Int. Rev. Phys. Chem., 2006, 25, 165–199 Search PubMed.
- S. Falcinelli, D. Cappelletti, F. Vecchiocattivi and F. Pirani, Phys. Chem. Chem. Phys., 2023, 25, 16176–16200 RSC.
- M. Krauss, J. Chem. Phys., 1977, 67, 1712–1719 CrossRef CAS.
- P. C. Tellinghuisen, J. Tellinghuisen, J. A. Coxon, J. E. Velazco and D. W. Setzer, J. Chem. Phys., 1978, 68, 5187–5198 CrossRef CAS.
- W. Simon, A. J. Yencha, M.-W. Ruf and H. Hotop, Z. Phys. D, 1988, 8, 71–84 CrossRef CAS.
- I. Tokue, H. Tanaka and K. Yamasaki, J. Phys. Chem. A, 2002, 106, 6068–6074 CrossRef CAS.
- Z. Su, N. Bohro and Y. Xu, J. Am. Chem. Soc., 2006, 128, 17126–17131 CrossRef CAS PubMed.
- B. A. McGuire, P. B. Carroll, R. A. Loomis, I. A. Finneran, P. R. Jewell, A. J. Remijan and G. A. Blake, Science, 2016, 352, 1449–1452 CrossRef CAS PubMed.
- F. Palazzetti, C. Coletti, A. Marrone and F. Pirani, Symmetry, 2022, 14, 249 CrossRef CAS.
- Q. Hong, M. Bartolomei, F. Esposito, C. Coletti, Q. Sun and F. Pirani, Phys. Chem. Chem. Phys., 2021, 23, 15475–15479 RSC.
- Q. Hong, M. Bartolomei, C. Coletti, A. Lombardi, Q. Sun and F. Pirani, Molecules, 2021, 26, 7152 CrossRef CAS PubMed.
- Q. Hong, M. Bartolomei, F. Pirani, F. Esposito, Q. Sun and C. Coletti, Plasma Sources Sci. Technol., 2022, 31, 084008 CrossRef.
- M. Rutigliano and F. Pirani, Plasma Sources Sci. Technol., 2022, 31, 094006 CrossRef.
- M. Rutigliano and F. Pirani, Molecules, 2022, 27, 7445 CrossRef CAS PubMed.
- E. Arunan, G. Desiraju, R. Klein, J. Sadlej, S. Scheiner, I. Alkorta, D. Clary, R. Crabtree, J. Dannenberg, P. Hobza, H. Kjaergaard, A. Legon, B. Mennucci and D. Nesbitt, Pure Appl. Chem., 2011, 83, 1637–1641 CrossRef CAS.
- G. R. Desiraju, P. S. Ho, L. Kloo, A. C. Legon, R. Marquardt, P. Metrangolo, P. Politzer, G. Resnati and K. Rissanen, Pure Appl. Chem., 2013, 85, 1711–1713 CrossRef CAS.
- L. Belpassi, F. Tarantelli, F. Pirani, P. Candori and D. Cappelletti, Phys. Chem. Chem. Phys., 2009, 11, 9970–9975 RSC.
- A. C. Legon, Phys. Chem. Chem. Phys., 2010, 12, 7736–7747 RSC.
- D. Cappelletti, E. Ronca, L. Belpassi, F. Tarantelli and F. Pirani, Acc. Chem. Res., 2012, 45, 1571–1580 CrossRef CAS PubMed.
- V. Aquilanti, M. Bartolomei, D. Cappelletti, E. Carmona-Novillo and F. Pirani, Phys. Chem. Chem. Phys., 2001, 3, 3891–3894 RSC.
- F. Nunzi, B. Di Erasmo, F. Tarantelli, D. Cappelletti and F. Pirani, Molecules, 2019, 24, 4274 CrossRef CAS PubMed.
- F. Nunzi, G. Pannacci, F. Tarantelli, L. Belpassi, D. Cappelletti, S. Falcinelli and F. Pirani, Molecules, 2020, 25, 2367 CrossRef CAS PubMed.
- D. Cappelletti, A. Bartocci, F. Grandinetti, S. Falcinelli, L. Belpassi, F. Tarantelli and F. Pirani, Chem. – Eur. J., 2015, 21, 6234–6240 CrossRef CAS PubMed.
- R. G. Bryant, M. A. Johnson and P. J. Rossky, Special Issue: Water in chemistry. Guest Editorial., Acc. Chem. Res., 2012, 45, 1–2 CrossRef CAS PubMed.
- P. Ball, Chem. Rev., 2008, 108, 74–108 CrossRef CAS PubMed.
- A. Rohrbacker, N. Halberstadt and K. C. Janda, Annu. Rev. Phys. Chem., 2000, 51, 405–433 CrossRef PubMed.
- K. Pfeilsticker, A. Lotter, C. Peters and H. Bösch, Science, 2003, 300, 2078–2080 CrossRef CAS PubMed.
- H. G. Kjaergaard, T. W. Robinson, D. L. Howard, J. S. Daniel, J. E. Headrick and V. Vaida, J. Phys. Chem. A, 2003, 107, 10680–10686 CrossRef CAS.
- A. J. Misquitta, J. Chem. Theory Comput., 2013, 9, 5313–5326 CrossRef CAS PubMed.
- K. U. Lao and J. M. Herbert, J. Chem. Theory Comput., 2016, 12, 2569–2582 CrossRef CAS PubMed.
- Y. Mao, Q. Ge, P. R. Horn and M. Head-Gordon, J. Chem. Theory Comput., 2018, 14, 2401–2417 CrossRef CAS PubMed.
- S. P. Veccham, J. Lee, Y. Mao, P. R. Horn and M. Head-Gordon, Phys. Chem. Chem. Phys., 2021, 23, 928–943 RSC.
- A. J. Stone and A. J. Misquitta, Chem. Phys. Lett., 2009, 473, 201–205 CrossRef CAS.
- V. Aquilanti, E. Cornicchi, M. MoixTeixidor, N. Saendig, F. Pirani and D. Cappelletti, Angew. Chem., Int. Ed., 2005, 44, 2356–2360 CrossRef CAS PubMed.
- R. B. Bernstein, Adv. Chem. Phys., 1966, 10, 75–124 CrossRef.
- U. Buck, Rev. Mod. Phys., 1974, 46, 369–389 CrossRef CAS.
- F. Pirani and F. Vecchiocattivi, Mol. Phys., 1982, 45, 1003–1013 CrossRef CAS.
- L. F. Roncaratti, D. Cappelletti and F. Pirani, J. Chem. Phys., 2014, 140, 124318 CrossRef PubMed.
- D. Cappelletti, M. Bartolomei, F. Pirani and V. Aquilanti, J. Phys. Chem. A, 2002, 106, 10764–10772 CrossRef CAS.
- V. Aquilanti, D. Cappelletti, F. Pirani and L. F. Roncaratti, Int. J. Mass. Spectrosc., 2009, 280, 72–77 CrossRef CAS.
- V. Aquilanti, G. Liuti, F. Pirani, F. Vecchiocattivi and G. G. Volpi, J. Chem. Phys., 1976, 65, 4751–4755 CrossRef CAS.
- T. Nenner, H. Tien and J. B. Fenn, J. Chem. Phys., 1975, 63, 5439–5444 CrossRef CAS.
- F. Pirani and F. Vecchiocattivi, J. Chem. Phys., 1977, 66, 372–373 CrossRef CAS.
- R. Cambi, D. Cappelletti, G. Liuti and F. Pirani, J. Chem. Phys., 1991, 95, 1852–1861 CrossRef CAS.
- C. V. Sousa Costa, G. C. Carvalho de Jesus, L. G. Machado de Macedo, F. Pirani and R. Gargano, Molecules, 2022, 27, 7409 CrossRef PubMed.
- T. N. Olney, N. M. Cann, G. Cooper and C. E. Brion, Chem. Phys., 1997, 223, 59–98 CrossRef CAS.
- L. F. Roncaratti, L. Belpassi, D. Cappelletti, F. Pirani and F. Tarantelli, J. Phys. Chem. A, 2009, 113, 15223–15232 CrossRef CAS PubMed.
- D. Cappelletti, V. Aquilanti, E. Cornicchi, M. MoixTeixidor and F. Pirani, J. Chem. Phys., 2005, 123, 024302 CrossRef PubMed.
- E. Luzzatti, F. Pirani and F. Vecchiocattivi, Mol. Phys., 1977, 34, 1279–1286 CrossRef CAS.
- L. Beneventi, P. Casavecchia and G. G. Volpi, J. Chem. Phys., 1986, 85, 7011–7029 CrossRef CAS.
- L. J. Danielson and M. Keil, J. Chem. Phys., 1988, 88, 851–870 CrossRef CAS.
- F. Pirani, S. Brizi, L. F. Roncaratti, P. Casavecchia, D. Cappelletti and F. Vecchiocattivi, Phys. Chem. Chem. Phys., 2008, 10, 5489–5503 RSC.
- F. Pirani and F. Vecchiocattivi, Chem. Phys., 1981, 59, 387–396 CrossRef CAS.
- V. Aquilanti, D. Ascenzi, D. Cappelletti, M. de Castro and F. Pirani, J. Chem. Phys., 1998, 109, 3898–3910 CrossRef CAS.
- L. Belpassi, M. L. Reca, F. Tarantelli, L. F. Roncaratti, F. Pirani, D. Cappelletti, A. Faure and Y. Scribano, J. Am. Chem. Soc., 2010, 132, 13046–13058 CrossRef CAS PubMed.
- P. Valiron, M. Wernli, A. Faure, L. Wiesenfeld, C. Rist, S. Kedžuch and J. Noga, J. Chem. Phys., 2008, 129, 134306 CrossRef PubMed.
- R. J. LeRoy and J. M. Hutson, J. Chem. Phys., 1987, 86, 837–853 CrossRef CAS.
- C. Bissonnette, C. E. Chuaqui, K. G. Crowell, R. J. LeRoy, R. J. Wheatley and W. J. Meath, J. Chem. Phys., 1996, 105, 2639–2653 CrossRef CAS.
- K. Raghavachari, G. W. Trucks, J. A. Pople and M. Head-Gordon, Chem. Phys. Lett., 1989, 157, 479–483 CrossRef CAS.
- C. Hampel, K. A. Peterson and H.-J. Werner, Chem. Phys. Lett., 1992, 190, 1–12 CrossRef CAS.
- M. J. O. Deegan and P. J. Knowles, Chem. Phys. Lett., 1994, 227, 321–326 CrossRef CAS.
- T. H. Dunning, J. Chem. Phys., 1989, 90, 1007–1023 CrossRef CAS.
- D. E. Woon and T. H. Dunning, J. Chem. Phys., 1993, 98, 1358–1371 CrossRef CAS.
- D. E. Woon and T. H. Dunning, J. Chem. Phys., 1994, 100, 2975–2988 CrossRef CAS.
- A. Reed, L. Curtiss and F. Weinhold, Chem. Rev., 1988, 88, 899–926 CrossRef CAS.
- D. Cappelletti, P. Candori, L. F. Roncaratti and F. Pirani, Mol. Phys., 2010, 108, 2179–2185 CrossRef CAS.
- D. Cappelletti, A. Bartocci, F. Frati, L. F. Roncaratti, L. Belpassi, F. Tarantelli, P. Aiswarya Lakshmi, E. Arunan and F. Pirani, Phys. Chem. Chem. Phys., 2015, 17, 30613–30623 RSC.
- A. Bartocci, F. Frati, L. F. Roncaratti, D. Cappelletti, F. Tarantelli, L. Belpassi and F. Pirani, Mol. Phys., 2015, 113, 3992–3999 CrossRef CAS.
- F. Pirani, L. F. Roncaratti, L. Belpassi, F. Tarantelli and D. Cappelletti, J. Chem. Phys., 2011, 135, 194301 CrossRef PubMed.
- G. Bistoni, L. Belpassi, F. Tarantelli, F. Pirani and D. Cappelletti, J. Phys. Chem. A, 2011, 115, 14657–14666 CrossRef CAS PubMed.
- F. Pirani, P. Candori, M. S. Pedrosa Mundim, L. Belpassi, F. Tarantelli and D. Cappelletti, Chem. Phys., 2012, 398, 176–185 CrossRef CAS.
- F. Pirani, D. Cappelletti, L. Belpassi and F. Tarantelli, J. Phys. Chem. A, 2013, 117, 12601–12607 CrossRef CAS PubMed.
- A. Bartocci, D. Cappelletti, F. Pirani, F. Tarantelli and L. Belpassi, J. Phys. Chem. A, 2014, 118, 6440–6450 CrossRef CAS PubMed.
- L. F. Roncaratti, D. Cappelletti, P. Candori and F. Pirani, Phys. Rev. A, 2014, 90, 012705 CrossRef.
- H. J. Loesch and A. Remscheid, J. Phys. Chem., 1991, 95, 8194 CrossRef CAS.
- B. Friedrich and D. R. Herschbach, Nature, 1991, 353, 412 CrossRef CAS.
- M. Rost, J. C. Griffin, B. Friedrich and D. R. Herschbach, Phys. Rev. Lett., 1992, 68, 1299–1302 CrossRef PubMed.
- D. Cappelletti, P. Candori, F. Pirani, L. Belpassi and F. Tarantelli, Cryst. Growth Des., 2011, 11, 4279–4283 CrossRef CAS.
- A. Bartocci, L. Belpassi, D. Cappelletti, S. Falcinelli, F. Grandinetti, F. Tarantelli and F. Pirani, J. Chem. Phys., 2015, 142, 184304 CrossRef PubMed.
- M. De Santis, F. Nunzi, D. Cesario, L. Belpassi, F. Tarantelli, D. Cappelletti and F. Pirani, New J. Chem., 2018, 42, 10603 RSC.
- F. Pirani, D. Cappelletti, S. Falcinelli, D. Cesario, F. Nunzi, L. Belpassi and F. Tarantelli, Angew. Chem., Int. Ed., 2019, 58, 4195–4199 CrossRef CAS PubMed.
- F. Nunzi, D. Cesario, L. Belpassi, F. Tarantelli, L. F. Roncaratti, S. Falcinelli, D. Cappelletti and F. Pirani, Phys. Chem. Chem. Phys., 2019, 21, 7330–7340 RSC.
- F. Nunzi, B. Di Erasmo, F. Tarantelli, D. Cappelletti and F. Pirani, Molecules, 2019, 24, 4274 CrossRef CAS PubMed.
- D. Cappelletti, A. Cinti, A. Nicoziani, S. Falcinelli and F. Pirani, Front. Chem., 2019, 7, 320 CrossRef CAS PubMed.
- D. Cappelletti, S. Falcinelli and F. Pirani, Chem. Phys. Lett., 2021, 771, 138521 CrossRef CAS.
- A. C. Legon, D. G. Lister and J. C. Thorn, J. Chem. Soc., Faraday Trans., 1994, 90, 3205–3212 RSC.
- I. Alkorta, I. Rozas and J. Elguero, J. Phys. Chem., 1998, 102, 9278–9285 CrossRef CAS.
- K. G. Denbigh, Trans. Faraday Soc., 1940, 36, 936–948 RSC.
- G. Maroulis and C. Makris, Mol. Phys., 1997, 91, 333–341 CrossRef CAS.
- L. Beneventi, P. Casavecchia, G. G. Volpi, C. R. Bieler and K. C. Janda, J. Chem. Phys., 1993, 98, 178–185 CrossRef CAS.
- G. C. Maitland, M. Rigby, E. B. Smith and W. A. Wakeham, Intermolecular Forces: Their origin and determination, Clarendon Press, Oxford, 1987 Search PubMed.
- A. A. Radzig and B. M. Smirnov, Reference Data on Atoms, Molecules and Ions, Springer, Berlin, 1985 Search PubMed.
- R. J. Emrich and W. Steele, Mol. Phys., 1980, 40, 469–475 CrossRef CAS.
- NIST Computational Chemistry Comparison and Benchmark Database, NIST Standard Reference Database Number 101, ed. R. D. Johnson III, https://cccbdb.nist.gov/, Release 21, August 2020.
- M. Kumar, A. Kumar and W. J. Meath, Mol. Phys., 2002, 100, 3271–3279 CrossRef CAS.
- A. W. Gisler and D. J. Nesbitt, Faraday Discuss., 2012, 157, 297–305 RSC.
- A. Li, Y. Li, H. Guo, K. Lau, Y. Xu, B. Xiong, Y.-C. Ghang and C. Y. Ng, J. Chem. Phys., 2014, 140, 011102 CrossRef PubMed.
- A. Cernuto, P. Tosi, L. M. Martini, F. Pirani and D. Ascenzi, Phys. Chem. Chem. Phys., 2017, 19, 19554–19565 RSC.
- A. Cernuto, F. Pirani, L. M. Martini, P. Tosi and D. Ascenzi, ChemPhysChem, 2018, 19, 51–59 CrossRef CAS PubMed.
- V. Richardson, E. Valença Ferreira de Aragão, X. He, F. Pirani, L. Mancini, N. Faginas-Lago, M. Rosi, L. M. Martini and D. Ascenzi, Phys. Chem. Chem. Phys., 2022, 24, 22437–22452 RSC.
- A. Kilaj, J. Wang, P. Stranak, M. Schwilk, U. Rivero, L. Xu, O. A. von Lilienfeld, J. Kupper and S. Willitsch, Nat. Commun., 2021, 12, 6047 CrossRef CAS PubMed.
- A. Kilaj, H. Gao, D. Rosch, U. Rivero, J. Kuepper and S. Willitsch, Nat. Commun., 2018, 9, 2096 CrossRef PubMed.
- A. D. Doerfler, P. Eberle, D. Koner, M. Tomza, M. Meuwly and S. Willitsch, Nat. Commun., 2019, 10, 5429 CrossRef PubMed.
- V. Zhelyazkova, F. B. Martins, V. J. A. Agner, H. Schmutz and F. Merkt, Phys. Chem. Chem. Phys., 2021, 23, 21606–21622 RSC.
- V. Zhelyazkova, F. B. Martins, V. M. Zesko and F. Merkt, Phys. Chem. Chem. Phys., 2022, 24, 2843–2858 RSC.
- V. Zhelyazkova, F. B. Martins, V. J. A. Agner, H. Schmutz and F. Merkt, Phys. Rev. Lett., 2020, 125, 263401 CrossRef CAS PubMed.
- K. Hoveler, J. Deiglmayr and F. Merkt, Mol. Phys., 2021, 119, 17–18 CrossRef , SI.
- M. Albertí, A. Aguilar, M. Bartolomei, D. Cappelletti, A. Laganà, J. M. Lucas and F. Pirani, Phys. Scr., 2008, 78, 058108 CrossRef.
| This journal is © the Owner Societies 2024 |