 Open Access Article
Creative Commons Attribution 3.0 Unported Licence
Benchmarking the anisotropy of nitroxyl radical solvation with IR spectroscopy†
Elisa M.
Brás
 ab,
Charlotte
Zimmermann
 a,
Rui
Fausto
 bc and
Martin A.
Suhm
 *a
*a
aUniversity of Göttingen, Institute of Physical Chemistry, Tammannstr. 6, 37077 Göttingen, Germany. E-mail: msuhm@gwdg.de
bCQC-IMS, Department of Chemistry, University of Coimbra, 3004-535 Coimbra, Portugal
cFaculty of Sciences and Letters, Department of Physics, Istanbul Kultur University, Ataköy Campus, Bakirköy 34156, Istanbul, Turkey
First published on 26th January 2024
Abstract
Two simple nitroxyl radicals, di-tert-butyl nitroxyl (DTBN) and 2,2,6,6-tetramethylpiperidinyloxyl (TEMPO) are solvated by one or two water, methanol, tert-butyl alcohol or phenol molecules. The resulting low temperature IR spectra of the vacuum-isolated microsolvates in the OH stretching range are assigned based on harmonic DFT predictions for closed shell solvent dimers and trimers and their offset from experiment, to minimise theory-guided assignment bias. Systematic conformational preferences for the first and second solvent molecule are observed, depending on the conformational rigidity of the radical. These assignments are collected into an experimental benchmark data set and used to assess the spectral predicting power of different DFT approaches. The goal is to find inexpensive computational methods which provide reliable spectral predictions for this poorly explored class of microsolvates.
1 Introduction
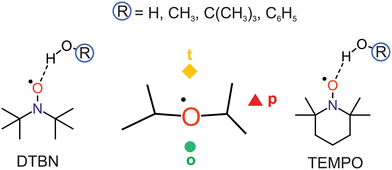
Nitroxyl radicals RR′NO as the homolytic OH bond dissociation products of hydroxylamines RR′NOH are of interest for proton coupled electron transfer reactions,1 organic radical batteries,2 dynamic nuclear polarisation,3 spin labeling4 and spin trapping purposes.5 They can be relatively stable even in protic solvents, which tend to coordinate the O and N atoms.6 The stability can be tuned by sterically shielding and reaction-preventing substituents at the nitrogen-bound α-carbon atoms, but these substituents also offer secondary hydrogen bond interactions with the solvent. Therefore, a systematic investigation of different protic solvents by methods which can resolve the orientation of individual solvent molecules around the N–O radical centre in the gas phase is of interest. Such a microsolvation approach lends itself well to the testing of quantum chemical methods, more so than bulk solutions which require further approximations.7 Once the non-reactive solvation by hydrogen bridges is well characterised, reactive processes such as hydrogen atom transfer to the nitroxyl radicals can also be modeled more accurately.8,9 In the absence of microwave structure investigations of such non-reactive mono- or oligosolvates,10,11 infrared spectroscopy can contribute to a better understanding of the direct solvation environment,12 if low temperature is achieved and further solvent molecules can be eliminated. This is the realm of either matrix isolation13,14 (including superfluid He nanomatrices15) or supersonic jet expansion techniques.16 The latter offer a more direct connection to theory, because there is no need to model the environment. However, the detection sensitivity suffers from the transient observation of the species and it therefore requires the use of long slit nozzles and pulsed operation,17 when coupled to FTIR spectroscopy. The present work investigates one of the simplest bulky nitroxyl radicals, di-tert-butyl nitroxyl (DTBN, Fig. 1), in comparison to the particularly stable 2,2,6,6-tetramethylpiperidinyloxyl (TEMPO, Fig. 1) radical.18 The strategy to vary the protic solvent for a better understanding of the spectra and for testing the underlying electronic structure theory has proven useful before.19 It is applied here for a total of four OH-containing solvents, namely water (HOH), methanol (HOCH3), tert-butyl alcohol (HOC(CH3)3) and phenol (HOC6H5).DTBN and TEMPO may offer locally similar environments for the solvation of the nitroxyl group enclosed by two tertiary carbon atoms, but the closing of the six-membered ring into a chair conformation by the extra carbon atom in TEMPO has significant consequences. The remaining four methyl groups attached to the α-carbons are hindered in their relative torsion, the radical stability increases and the room temperature phase becomes a volatile solid, compared to liquid DTBN. Nevertheless, there is a common descriptor for the solvent coordination, as will be shown in this work. It has been introduced for TEMPO,18 and distinguishes a tightly embedded top position (t), an opposite and more open coordination (o) making the N atom more accessible for secondary solvation and, finally, a coordination near the plane of the nitroxyl group (p), which experiences most steric hindrance and/or secondary interaction with the methyl groups (Fig. 1).
In the present work we show that as a function of protic solvent, there are close analogies, but also characteristic differences between the preferred mono- and disolvation sites of DTBN and TEMPO radicals. These experimental findings are based on theory-assisted assignments, where care is taken to use non-radical reference calculations for a common interpretation of the spectra, because there is very limited quantitative gas phase spectroscopic data available for organic radical solvent complexes. In the end, it is seen that quantum chemistry in the harmonic approximation is able to describe the vibrational signatures of such solvated radical species rather consistently, across a range of density functionals, when using non-radical solvent complexes as a connecting bridge. This is due to similar anharmonic effects in radical and non-radical solvation, which leads to a systematic cancellation of errors.
2 Methods
2.1 Computational techniques
Structure predictions on the radical complexes and their components were carried out using ORCA 4.2.120 at the unrestricted open-shell B3LYP-D3BJ/def2-TZVP level21–24 (Becke–Johnson-damped25–27 Grimme D3 dispersion correction with three-body term28). To identify all relevant minimum energy structures, an extensive search (both manual using B3LYP and with CREST29,30 using the semi-empirical method GFN2-xTB31,32) was performed. Reoptimisations were completed at unrestricted open-shell B3LYP-D3BJ/def2-TZVP (triple) and def2-QZVP (quadruple zeta) levels,21–24 see the ESI.†![[thin space (1/6-em)]](https://www.rsc.org/images/entities/char_2009.gif) 20 The robustness of some predictions was checked with different functionals (TPSS, B2PLYP)33,34 and also by adding single point energies to stationary points at DLPNO-CCSD(T) level35–38 using aug-cc-pVTZ39 and matching auxiliary basis sets. Electronic isomerisation barriers were estimated by relaxed one-dimensional scans (using Gaussian 16;40 unrestricted open-shell B3LYP-D3BJ/def2-TZVP without three body correction, from pre-optimised structures at the same level of computation) along different coordinates to assess the interconvertibility between the three different docking positions (t, o, p) under jet expansion conditions. The latter is less likely in a supersonic jet expansion for barriers significantly exceeding 5 kJ mol−1,41 whereas lower barriers allow for an effective Boltzmann equilibrium between conformations down to some freezing temperature. Technical details of the computations are listed in Section S1.1 of the ESI† and selected optimised structures are given in Section S1.2 (ESI†).
20 The robustness of some predictions was checked with different functionals (TPSS, B2PLYP)33,34 and also by adding single point energies to stationary points at DLPNO-CCSD(T) level35–38 using aug-cc-pVTZ39 and matching auxiliary basis sets. Electronic isomerisation barriers were estimated by relaxed one-dimensional scans (using Gaussian 16;40 unrestricted open-shell B3LYP-D3BJ/def2-TZVP without three body correction, from pre-optimised structures at the same level of computation) along different coordinates to assess the interconvertibility between the three different docking positions (t, o, p) under jet expansion conditions. The latter is less likely in a supersonic jet expansion for barriers significantly exceeding 5 kJ mol−1,41 whereas lower barriers allow for an effective Boltzmann equilibrium between conformations down to some freezing temperature. Technical details of the computations are listed in Section S1.1 of the ESI† and selected optimised structures are given in Section S1.2 (ESI†).
For spectral assignment purposes, to best profit from the analogy between the different nitroxyl radicals and solvents, an elaborate scaling strategy of the B3LYP-D3 harmonic normal mode predictions is needed. It is explained here, anticipating some experimental results, to shorten the explanations in the results section. The corresponding raw data can be found in Table S26 in the ESI.† We adopt the established harmonic theory scaling factor of 0.975 from the hydrogen-bonded OH stretching fundamental in the TEMPO water (HOH) complex18 in the triple-zeta (TZ) basis set calculations of all radical complexes investigated in this work. With this scaling factor, the experimental and theoretical wavenumbers for the o isomer of DTBN–HOH are 3509 and 3510 cm−1, respectively. Scaled theory is thus coincidentally almost perfect, certainly within the deliberately coarse steps of 0.005 which we typically employ for harmonic scaling factors due to their intrinsic limitations. For the more stable t isomer, the more intense band at 3483 cm−1 matches the predicted one at 3488 cm−1. Now theory is slightly too high. The deviations are well within the expectation range and rely on error compensation due to similar anharmonicity and an apparently more than qualitative coverage of all important intermolecular interactions by the employed density functional.
To carry over some of this error cancellation to other species reported in this work, such as radical–alcohol complexes and also radical disolvates, we make use of harmonic reference calculations for the most IR-active OH stretching modes in water dimer, water trimer, methanol dimer, methanol trimer, tert-butyl alcohol dimer and phenol dimer, which all lack radical character and are therefore unbiased reference compounds (see the OH stretching frequencies in Table S28 in the ESI†). To match experiment without scaling for these homoclusters, their calculated TZ wavenumbers have to be shifted by different amounts. For methanol dimer, the required shift, in this case a downshift, has to exceed that of water dimer42–44 by 8 cm−1, for methanol trimer instead of water dimer, an extra downshift of 9 cm−1 is needed, whereas for water trimer, an upshift by 28 cm−1 is required. For tert-butyl alcohol dimer, the required downshift correction is 48 cm−1 and for phenol dimer, it is even 53 cm−1, showing that these two bulky OH⋯OH dimers are described quite differently by harmonic DFT calculations compared to the reference water dimer. The correction shifts ranging from −53 cm−1 to +28 cm−1 relative to water dimer make sure that any harmonic TZ predictions of the corresponding IR homocluster spectra would parallel the one for water dimer. We now simply transfer these homocluster corrections to the radical complexes, where one solvent unit is replaced by the radical (DTBN or TEMPO), assuming that theory error including anharmonicity effects is qualitatively transferable in those cases from a closed shell solvent cluster to the radical solvent cluster with the same number of constituents. This would not be the case for Raman-active transitions which involve concerted motion of all three bound OH stretches of the trimer, but is a legitimate correlation attempt for the IR active modes. After applying these harmonic shifts which account for solvent switches, we apply the uniform scaling factor 0.975 established for TEMPO–water dimers18 to make a minimally biased prediction of the experimental band position for other radical–solvate complexes.
To provide an explicit example, when switching from water to methanol (HOCH3) as a single solvent of a radical, we first correct the harmonic OH stretching prediction for this radical–methanol complex by the difference (8 cm−1) between the experiment-theory gap for (HOH)2 and for (HOCH3)2.42–44 Specifically, the (HOH)2 signal is observed at 3602 cm−1 and harmonically predicted at 3666 cm−1, 64 cm−1 too high. The (HOCH3)2 signal is observed at 3575 cm−1 and harmonically predicted at 3647 cm−1, 72 cm−1 too high. Therefore, a DTBN–HOCH3 prediction at 3601 cm−1 (o) is first downshifted by (72 − 64) cm−1 = 8 cm−1 to correct for the switch in the OH carrier and then scaled by 0.975 to yield 3503 cm−1 which is to be compared to either 3496 cm−1 or 3470 cm−1 in experiment. The weaker band at 3496 cm−1 is closer. Because the same procedure applied to the more stable (t) complex of DTBN–HOCH3 (harmonically predicted at 3575 cm−1) yields 3478 cm−1 and thus corresponds more closely to the stronger signal at 3470 cm−1, a consistent assignment picture emerges for the o and t isomers of DTBN–HOCH3. This illustrates the practicability of scaled and shifted harmonic calculations in semiquantitatively bridging the spectra of two related systems, by making use of experimentally characterised pure solvent cluster results.
2.2 Experimental techniques
The IR spectra were obtained by mixing two helium (Linde, 99.996%) gas flows saturated at reduced temperature with nitroxyl radical (DTBN: Sigma Aldrich and Santa Cruz Biotechnology, 90%; TEMPO: Sigma Aldrich, 98%) and hydroxy compound (HOCH3: Roth, ≥99.9%; HOC(CH3)3: Roth, ≥99.9%; HOC6H5: Alfa Aesar, ≥99%) in a room temperature reservoir, from which 147 ms pulses of several standard litres were expanded through a 600 mm long, 0.2 mm wide slit nozzle into a large vacuum chamber for slower pressure build-up. The adiabatically cooled gas pulses were probed by synchronised FTIR spectrometer scans, followed by a recovery period during which the vacuum was re-established by roots pumps. This sequence was repeated and the spectra co-added to improve the signal-to-noise ratio. Details can be found in a review.17 Preliminary spectra of DTBN–water co-expansions were reported in the ESI of ref. 18, using a gas-recycling variant of the slit jet spectrometer used here.3 Results and discussion
3.1 Conformational options
DTBN is predicted to consist of easily interconvertible C1 symmetric enantiomers due to the twisting of the tert-butyl groups, whereas TEMPO is to a good approximation Cs symmetric.The electronic structure of the NO group is clearly more isotropic than the CO group of ketones with respect to the angle of solvation.18 Instead of a preferential in plane coordination of the oxygen by the first hydrogen-bonding solvent found for ketones, it has the option to place its hydrogen close to the plane (p) or on the tighter (t) or more open (o) pole of the projection along the O–N bond (Fig. 2). This is true for DTBN and TEMPO, but the barrier heights can differ substantially (Fig. S4 in ESI†).
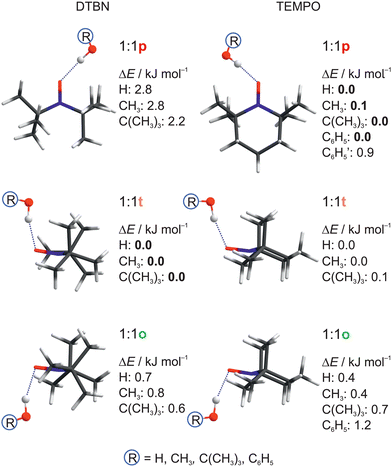 | ||
| Fig. 2 Structural analogies and energetical trends between DTBN and TEMPO monosolvates as a function of protic solvent. Relative energies ΔE including harmonic zero point energy correction of the docking sites are given, setting the most stable predicted docking site to 0.0. See Table S17 in the ESI† for details and for CCSD(T) energy corrections. | ||
For DTBN, all investigated solvents are predicted to prefer the t site. Opposite docking (o) is slightly less stable, although it becomes preferred when a second solvent molecule closes a contact to the nitrogen atom which is more accessible on this side, as in the TEMPO dihydrate18 (Fig. S1–S3 in ESI†). An arrangement of the solvent OH close to the nitroxyl plane (p) is considerably less stable for all solvents. For TEMPO, this in plane coordination is actually predicted to be preferred, now closely followed by t docking, and o docking is also not much higher in energy. This very close competition, which has been verified experimentally for water,18 appears to be largely conserved when the second H in water is replaced by an organic rest R. Apparently, the torsional flexibility of DTBN removes the close degeneracy of p, t, o and renders the t and o docking options more attractive (Fig. 2). Indeed, while the electronic dissociation energies of the ROH complexes with TEMPO and DTBN in the p conformation are within 1 kJ mol−1 for a given R, the t and o complexes are systematically lower for DTBN than for TEMPO by 1–2 kJ mol−1 (Table S19 in the ESI†). This flexibility advantage persists when R increases from –H to –C(CH3)3, while the absolute dissociation energy increases by up to 7 kJ mol−1.
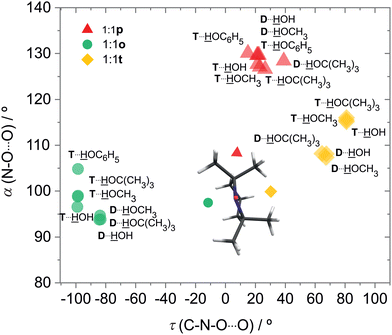
In both radicals, the p, t, o coordination correlates with the hydrogen bond angle N–O⋯H (α), which is close to tetrahedral for t, close to 90° for o and in excess of 120° (sp2-like) for p (Fig. 3). This adds further mnemonic value to the abbreviations t (for tetrahedral) and o (for orthogonal). There is a tendency for o conformations to have a higher predicted OH stretching wavenumber than those of p, because the hydrogen bond is distorted by interaction of the solvent with the N atom in the o structures (see Fig. 2 and Table S26 in ESI†). There is another tendency for t wavenumbers being lower than p, because in t the solvent is not so much pushed away from ideal (roughly tetrahedral) coordination by the protecting groups. It is important to check whether this predicted correlation is robust across different computational methods and of course whether it is consistent with experimental observations. For the latter, information about possible relaxation paths between the different conformations is crucial.
3.2 Relaxation paths for solvent docking
Collisions can catalyse conformational interconversion45,46 and the barrier between the conformations is essential for the survival of excited isomers.47 In this context, an important difference between the two bulky radicals is illustrated in Fig. S4 in ESI.† In DTBN, the torsion around a C–N–O⋯O dihedral angle can easily bring a solvent molecule from the high-energy p position (red triangles) to the o position (green circles) of DTBN–HOH/HOCH3, or to the t position (yellow diamonds) of DTBN–HOC(CH3)3, across very low barriers (within 0.1 kJ mol−1). The barrier between o and t is somewhat higher, but low enough to establish a Boltzmann-like distribution among these two more stable conformations corresponding to a fairly low conformational freezing temperature. In TEMPO solvate complexes, it is easier for a t conformation to relax to a p conformation whenever this offers an energy gain. In contrast, o coordination is hidden behind a higher barrier and may be trapped there at an early stage of cooling. Therefore we expect up to two conformations for the monosolvates of both radicals in a supersonic jet expansion, but different ones for DTBN (t and perhaps o in a Boltzmann-like distribution) and TEMPO (p and perhaps o by a trapping mechanism at somewhat higher conformational freezing temperatures).3.3 Scaled theory-experiment comparison for IR spectra
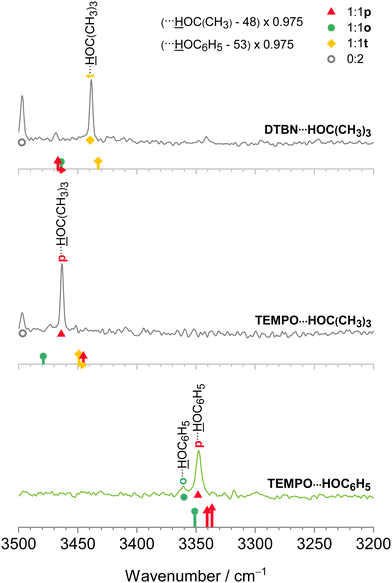
The harmonic scaling approach for DTBN complexes was exemplified in the section on computational techniques. Remarkably, the same procedure can be successfully applied to the TEMPO complexes. This is illustrated in Fig. 4, which compares scaled theory with the experimental spectra in the 3550–3250 cm−1 range relevant for hydrogen-bonded OH groups of water and methanol in the complexes with each radical. The TEMPO–HOH complex is complicated by an anharmonic resonance splitting (b2lib resonance48), but still there is a slight underestimation by scaled theory for the p isomer and a significant overestimation by theory for the o isomer. A very analogous behaviour to TEMPO–HOH is observed for TEMPO–HOCH3, with the p isomer being almost perfectly predicted and the weaker o isomer being overestimated by theory.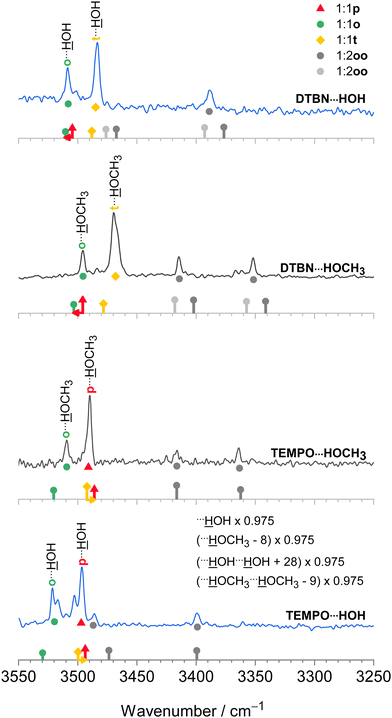 | ||
| Fig. 4 IR spectra of methanol (inner, black) and water (outer, blue) complexes with DTBN (upper) and TEMPO (lower half). The lowest trace is from ref. 18. The simulated stick spectra are uniformly scaled after correcting for pure solvent dimer and trimer deficiencies as described in Section 2.1 and also encode predicted IR intensity in km mol−1. Colour-coded positions of conformations which are predicted to relax over shallow barriers are connected to the more stable ones by horizontal arrows. The proposed assignments are repeated as coloured symbols underneath the spectral features. There is a qualitative correlation of the predicted relative stability of the two surviving conformations for each complex with signal strength, suggesting that the scaling model is successful. For more details see text. | ||
In summary, the p conformation is missing in DTBN because of its high energy and early relaxation. The t conformer is missing in TEMPO due to its easy relaxation, at least in colder expansions. Therefore, TEMPO yields mainly p and trapped o isomers, whereas DTBN yields mainly t and Boltzmann-populated o isomers. It is rewarding that the associated energy sequence predictions for the observed species are largely conserved when switching from B3LYP to CCSD(T) electronic energies (Table S17 in the ESI†).
3.4 Disolvates
In the spectra (Fig. 4) one can also see contributions from disolvates (oo), where the second solvent unit forces the first one into an o position such that it can bind to the nitrogen region of the radical. The radical-unbiased scaling strategy outlined in Section 2.1 is seen to be quite successful for these trimers as well. In the case of DTBN–HOH–HOH, the less shifted OH stretching mode overlaps with the mixed dimer, in contrast to the TEMPO–HOH–HOH case18 where the overlap is avoided by a small margin. For the disolvates of DTBN, two competing structures with slightly different spectral fingerprints are predicted but experiment cannot decide between them. In the context of unusual bulk solvation behaviour,7 it would be of interest to attach more than two water molecules to the persistent radicals, but the lack of size-selectivity in the employed direct absorption experiment makes this difficult to analyse.3.5 Bulky solvents
After having achieved a detailed understanding of water and methanol interaction with nitroxyl radicals, we have extended our investigation to more bulky and aromatic solvents, namely tert-butyl alcohol49 and phenol.50 As Fig. 5 shows, in this case there is a stronger preference for a single mixed dimer, perhaps assisted by secondary interactions. Despite these secondary interactions and the variation between aliphatic and aromatic hydroxy compounds, the scaling model proposed in Section 2.1 works remarkably well. We refrain from speculating about the exact nature of some of the minor signals at this stage, but the theory predictions of the dominant features are fully in line with the smaller solvents, namely a preference for t in DTBN and for p in TEMPO, see also Fig. 2 and Fig. S4 in the ESI.†3.6 Benchmarking potential
Now that the assignments of mono- and disolvates of the two nitroxyl radicals are firmly established and systematic across a number of hydroxy solvents, one can move to a first benchmarking step, namely the comparison to other harmonic predictions. To avoid the complexity of the scaling model, this is done on the basis of spectral shifts relative to the o conformation which is observed in most systems. This o conformation is always predicted at a higher wavenumber than those of t (DTBN) and p (TEMPO) conformations, whenever they are observed (see Table S26 in ESI†). Fig. 6 plots the o–t and o–p wavenumber differences for varying HOR substitution. One can see that B3LYP captures the experimentally secured substitution trends (blue symbols) reasonably well, with B2PLYP getting at least as close, where available. In contrast, TPSS appears somewhat less systematic in the TEMPO case and may thus be of reduced predictive value for spectroscopy. The methods are remarkably uniform in their prediction of the isomer splittings for HOC(CH3)3 solvating DTBN and TEMPO, which may assist a future assignment of the secondary monosolvate isomer for both radicals.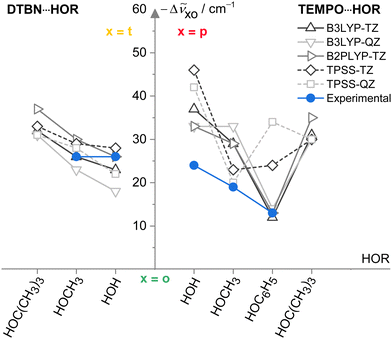 | ||
Fig. 6 Spectral OH stretching downshifts −Δṽxo observed (blue) and harmonically calculated (black QZ(VP), grey TZ(VP) basis set) for t isomers in 1![[thin space (1/6-em)]](https://www.rsc.org/images/entities/char_2009.gif) : :![[thin space (1/6-em)]](https://www.rsc.org/images/entities/char_2009.gif) 1 DTBN–solvent complexes and p isomers in TEMPO–solvent complexes relative to o as a function of the HOR substituent for different functionals. TPSS (dashed) is less systematic than the LYP-based functionals in capturing the TEMPO trends. See Table S27 in the ESI† for details and main text for further discussions. 1 DTBN–solvent complexes and p isomers in TEMPO–solvent complexes relative to o as a function of the HOR substituent for different functionals. TPSS (dashed) is less systematic than the LYP-based functionals in capturing the TEMPO trends. See Table S27 in the ESI† for details and main text for further discussions. | ||
Comparing experiment with scaled harmonic predictions is of course less than satisfactory, because it assumes a systematic cancellation of anharmonic effects and potentially hides electronic structure deficiencies. Therefore, anharmonic51 benchmark calculations are called for, which systematically predict the correct energy order, relaxation behaviour and spectral pattern. This task is significantly more challenging than for non-hydrogen-bonded alcohol monomers52 but the assignments presented in this work provide a starting point.
The monohydrate of DTBN was part of the training set for a blind challenge53 based on a preliminary report of the OH stretching vibration of its dominant conformation18 at 3484 cm−1. We now slightly refine this value to 3483.5 cm−1 and assign it to a t conformation. We also provide evidence that there is no need to invoke a higher order resonance,54 in contrast to TEMPO,18 but that instead the second IR absorption signal at 3509 cm−1 can be explained by a metastable o conformation. These and other core findings for the monosolvates are summarised in Table 1.
4 Conclusions and outlook
When a hydroxy compound attaches to the nitroxyl group of the DTBN radical at low temperature, it does so by coordinating the O atom at a roughly tetrahedral angle on the sterically tight side (t) of the radical plane. The slightly less favourable opposite and more open side (o) can be populated in some cases, whereas coordination in the nitroxyl plane (p) is too high in energy to survive supersonic expansion. If a second solvent unit attaches to the first one, the o side becomes preferred due to secondary interaction with the N atom. In the TEMPO radical, p coordination represents the dominant monosolvate species and the t coordinated radical easily relaxes into this valley, whereas o coordination can survive as a minor Boltzmann-populated species and is again stabilised by a second solvent molecule. This uniform aggregation pattern is found by IR spectroscopy in supersonic jet expansions and successfully modelled with harmonic DFT predictions, once these are shifted by amounts suggested by related closed shell species. Whether or not this two-step procedure (scaling after analogy-based shifting) is more universally applicable to classes of complexes remains to be seen in the future. The present success is encouraging, but by no means a warranty. For example, if the radical acceptor is replaced by closed-shell methanol, the prediction of the phenol–methanol donor spectrum55 based on harmonic calculations of phenol dimer, water dimer and experiment for the water–methanol complex56 at the B3LYP level employed here is not more successful than simple scaling of the harmonic phenol–methanol prediction based on the scaling factor obtained for water–methanol. Both predictions deviate by 20–30 cm−1 from experiment. Still, the present work suggests that radical solvation poses no major challenge for DFT calculations, although the meta-GGA functional TPSS performs less systematically than hybrid and double-hybrid functionals from the LYP family. Even more robust theory tools to predict the conformational dependence of the IR spectra of radical monohydrates would be welcome. This explicitly includes anharmonic approaches, if they can circumvent the problem of large amplitude torsions. Evidently, rotational spectroscopy could offer more rigorous evidence for the conformational preferences deduced in the present work.Currently, this investigation is extended to aromatic alcohols and to model systems for the large dynamical nuclear polarisation effects observed for nitroxyl radicals.57 Radical microsolvation investigations in matrix isolation13,14 could enable longer interaction times and less stable as well as less volatile radicals to be studied. Rotational spectroscopy might provide rigorous structural assignments without having to rely on the sensorial potential of the OH⋯O radical hydrogen bond.
Conflicts of interest
There are no conflicts to declare.Acknowledgements
This research was funded by the Deutsche Forschungsgemeinschaft (DFG, German Research Foundation) – 271107160 (SPP on London dispersion, SU121/5-2) and its benchmarking aspects were inspired by the research training group GRK2455 – 389479699. Computational resources in Göttingen are gratefully acknowledged. E. M. B. thanks the Portuguese Science Foundation FCT for the PhD grant (SFRH/BD/136246/2018), funded by national funds and EU funds through FSE and Por Centro. R. F. and E. M. B. thank the support to CQC-IMS given by the Fundação para a Ciência e a Tecnologia (FCT), through projects UI0313B/QUI/2020 (DOI: 10.54499/UIDB/00313/2020), UI0313P/QUI/2020 (DOI: 10.54499/UIDP/00313/2020) and LA/P/0056/2020. We are grateful to Taija L. Fischer for helpful discussions and for support with the hydrate spectra using gas recycling.Notes and references
- J. J. Warren, T. A. Tronic and J. M. Mayer, Chem. Rev., 2010, 110, 6961–7001 CrossRef CAS PubMed.
- Z. Chen, Y. Li and F. Huang, Chem, 2021, 7, 288–332 CAS.
- T. Prisner, V. Denysenkov and D. Sezer, J. Magn. Res., 2016, 264, 68–77 CrossRef CAS PubMed.
- G. Sicoli, F. Wachowius, M. Bennati and C. Höbartner, Angew. Chem., Int. Ed., 2010, 49, 6443–6447 CrossRef CAS PubMed.
- L. G. Arnaut, M. M. Pereira, J. M. Dabrowski, E. F. F. Silva, F. A. Schaberle, A. R. Abreu, L. B. Rocha, M. M. Barsan, K. Urbanska, G. Stochel and C. M. A. Brett, Chem. – Eur. J., 2014, 20, 5346–5357 CrossRef CAS PubMed.
- F. Hecker, L. Fries, M. Hiller, M. Chiesa and M. Bennati, Angew. Chem., Int. Ed., 2023, 62, e202213700 CrossRef CAS PubMed.
- J. Hunold, J. Eisermann, M. Brehm and D. Hinderberger, J. Phys. Chem. B, 2020, 124, 8601–8609 CrossRef CAS PubMed.
- T. L. Fischer, M. A. Tepaske and M. A. Suhm, Phys. Chem. Chem. Phys., 2023, 25, 11324–11330 RSC.
- S.-A. Hua, L. A. Paul, M. Oelschlegel, S. Dechert, F. Meyer and I. Siewert, J. Am. Chem. Soc., 2021, 143, 6238–6247 CrossRef CAS PubMed.
- C. Pérez, A. Krin, A. L. Steber, J. C. López, Z. Kisiel and M. Schnell, J. Phys. Chem. Lett., 2016, 7, 154–160 CrossRef PubMed.
- M. Chrayteh, E. Burevschi, D. Loru, T. R. Huet, P. Dréan and M. E. Sanz, Phys. Chem. Chem. Phys., 2021, 23, 20686–20694 RSC.
- C. Cézard, C. A. Rice and M. A. Suhm, J. Phys. Chem. A, 2006, 110, 9839–9848 CrossRef PubMed.
- W. Sander, S. Roy, I. Polyak, J. M. Ramirez-Anguita and E. Sanchez-Garcia, J. Am. Chem. Soc., 2012, 134, 8222–8230 CrossRef CAS PubMed.
- E. M. Brás and R. Fausto, J. Mol. Struct., 2018, 1172, 42–54 CrossRef.
- F. J. Hernandez, J. T. Brice, C. M. Leavitt, T. Liang, P. L. Raston, G. A. Pino and G. E. Douberly, J. Chem. Phys., 2015, 143, 164304 CrossRef PubMed.
- R. Campargue, J. Phys. Chem., 1984, 88, 4466–4474 CrossRef CAS.
- M. A. Suhm and F. Kollipost, Phys. Chem. Chem. Phys., 2013, 15, 10702–10721 RSC.
- E. M. Brás, T. L. Fischer and M. A. Suhm, Angew. Chem., Int. Ed., 2021, 60, 19013–19017 CrossRef PubMed.
- D. Bernhard, M. Fatima, A. Poblotzki, A. L. Steber, C. Pérez, M. A. Suhm, M. Schnell and M. Gerhards, Phys. Chem. Chem. Phys., 2019, 21, 16032–16046 RSC.
- F. Neese, Wiley Interdiscip. Rev. Comput. Mol. Sci., 2018, 8, e1327 CrossRef.
- A. D. Becke, Phys. Rev. A: At., Mol., Opt. Phys., 1988, 38, 3098–3100 CrossRef CAS PubMed.
- A. D. Becke, J. Chem. Phys., 1993, 98, 5648–5652 CrossRef CAS.
- C. Lee, W. Yang and R. G. Parr, Phys. Rev. B: Condens. Matter Mater. Phys., 1988, 37, 785–789 CrossRef CAS PubMed.
- F. Weigend and R. Ahlrichs, Phys. Chem. Chem. Phys., 2005, 7, 3297–3305 RSC.
- A. D. Becke and E. R. Johnson, J. Chem. Phys., 2005, 123, 154101 CrossRef PubMed.
- E. R. Johnson and A. D. Becke, J. Chem. Phys., 2005, 123, 024101 CrossRef PubMed.
- E. R. Johnson and A. D. Becke, J. Chem. Phys., 2006, 124, 174104 CrossRef PubMed.
- S. Grimme, J. Antony, S. Ehrlich and H. Krieg, J. Chem. Phys., 2010, 132, 154104 CrossRef PubMed.
- P. Pracht, F. Bohle and S. Grimme, Phys. Chem. Chem. Phys., 2020, 22, 7169–7192 RSC.
- S. Grimme, J. Chem. Theory Comput., 2019, 15, 2847–2862 CrossRef CAS PubMed.
- C. Bannwarth, S. Ehlert and S. Grimme, J. Chem. Theory Comput., 2019, 15, 1652–1671 CrossRef CAS PubMed.
- S. Grimme, C. Bannwarth and P. Shushkov, J. Chem. Theory Comput., 2017, 13, 1989–2009 CrossRef CAS PubMed.
- J. Tao, J. P. Perdew, V. N. Staroverov and G. E. Scuseria, Phys. Rev. Lett., 2003, 91, 146401 CrossRef PubMed.
- S. Grimme, J. Chem. Phys., 2006, 124, 034108 CrossRef PubMed.
- C. Riplinger, B. Sandhoefer, A. Hansen and F. Neese, J. Chem. Phys., 2013, 139, 134101 CrossRef PubMed.
- C. Riplinger and F. Neese, J. Chem. Phys., 2013, 138, 034106 CrossRef PubMed.
- C. Riplinger, P. Pinski, U. Becker, E. F. Valeev and F. Neese, J. Chem. Phys., 2016, 144, 024109 CrossRef PubMed.
- Y. Guo, C. Riplinger, D. G. Liakos, U. Becker, M. Saitow and F. Neese, J. Chem. Phys., 2020, 152, 024116 CrossRef CAS PubMed.
- R. A. Kendall, T. H. Dunning Jr and R. J. Harrison, J. Chem. Phys., 1992, 96, 6796–6806 CrossRef CAS.
- M. J. Frisch, G. W. Trucks, H. B. Schlegel, G. E. Scuseria, M. A. Robb, J. R. Cheeseman, G. Scalmani, V. Barone, G. A. Petersson, H. Nakatsuji, X. Li, M. Caricato, A. V. Marenich, J. Bloino, B. G. Janesko, R. Gomperts, B. Mennucci, H. P. Hratchian, J. V. Ortiz, A. F. Izmaylov, J. L. Sonnenberg, D. Williams-Young, F. Ding, F. Lipparini, F. Egidi, J. Goings, B. Peng, A. Petrone, T. Henderson, D. Ranasinghe, V. G. Zakrzewski, J. Gao, N. Rega, G. Zheng, W. Liang, M. Hada, M. Ehara, K. Toyota, R. Fukuda, J. Hasegawa, M. Ishida, T. Nakajima, Y. Honda, O. Kitao, H. Nakai, T. Vreven, K. Throssell, J. A. Montgomery, Jr., J. E. Peralta, F. Ogliaro, M. J. Bearpark, J. J. Heyd, E. N. Brothers, K. N. Kudin, V. N. Staroverov, T. A. Keith, R. Kobayashi, J. Normand, K. Raghavachari, A. P. Rendell, J. C. Burant, S. S. Iyengar, J. Tomasi, M. Cossi, J. M. Millam, M. Klene, C. Adamo, R. Cammi, J. W. Ochterski, R. L. Martin, K. Morokuma, O. Farkas, J. B. Foresman and D. J. Fox, Gaussian-16 Revision A.03, Gaussian Inc., Wallingford CT, 2016 Search PubMed.
- R. S. Ruoff, T. D. Klots, T. Emilsson and H. S. Gutowsky, J. Chem. Phys., 1990, 93, 3142–3150 CrossRef CAS.
- U. Buck and F. Huisken, Chem. Rev., 2000, 100, 3863–3890 CrossRef CAS PubMed.
- R. W. Larsen, P. Zielke and M. A. Suhm, J. Chem. Phys., 2007, 126, 194307 CrossRef PubMed.
- K. E. Otto, Z. Xue, P. Zielke and M. A. Suhm, Phys. Chem. Chem. Phys., 2014, 16, 9849 RSC.
- U. Erlekam, M. Frankowski, G. von Helden and G. Meijer, Phys. Chem. Chem. Phys., 2007, 9, 3786 RSC.
- W. Y. Sohn, K.-J. Cho, S. Y. Lee, S. S. Kang, Y. D. Park and H. Kang, Chem. Phys. Lett., 2012, 525–526, 37–43 CrossRef CAS.
- S. L. Sherman, K. A. Nickson and E. Garand, J. Phys. Chem. Lett., 2022, 13, 2046–2050 CrossRef CAS PubMed.
- T. L. Fischer, T. Wagner, H. C. Gottschalk, A. Nejad and M. A. Suhm, J. Phys. Chem. Lett., 2021, 12, 138–144 CrossRef CAS PubMed.
- D. Zimmermann, T. Häber, H. Schaal and M. A. Suhm, Mol. Phys., 2001, 99, 413–425 CrossRef CAS.
- T. Ebata, T. Watanabe and N. Mikami, J. Phys. Chem., 1995, 99, 5761–5764 CrossRef CAS.
- V. Barone, J. Chem. Phys., 2005, 122, 014108 CrossRef PubMed.
- R. Medel and M. A. Suhm, Phys. Chem. Chem. Phys., 2021, 23, 5629–5643 RSC.
- T. L. Fischer, M. Bödecker, A. Zehnacker-Rentien, R. A. Mata and M. A. Suhm, Phys. Chem. Chem. Phys., 2022, 24, 11442–11454 RSC.
- T. L. Fischer, T. Wagner, H. C. Gottschalk, A. Nejad and M. A. Suhm, J. Phys. Chem. Lett., 2021, 12, 138–144 CrossRef CAS PubMed.
- A. Doi and N. Mikami, J. Chem. Phys., 2008, 129, 154308 CrossRef PubMed.
- M. Nedić, T. N. Wassermann, R. W. Larsen and M. A. Suhm, Phys. Chem. Chem. Phys., 2011, 13, 14050–14063 RSC.
- G. Liu, M. Levien, N. Karschin, G. Parigi, C. Luchinat and M. Bennati, Nat. Chem., 2017, 9, 676–680 CrossRef CAS PubMed.
Footnote |
| † Electronic supplementary information (ESI) available. See DOI: https://doi.org/10.1039/d3cp05668f |
| This journal is © the Owner Societies 2024 |

