 Open Access Article
Creative Commons Attribution 3.0 Unported Licence
Experimental and computational studies of the optical properties of 2,5,8-tris(phenylthiolato)heptazine with an inverted singlet–triplet gap†
Daniel
Blasco
 *a,
Rinat T.
Nasibullin
b,
Rashid R.
Valiev
b,
Miguel
Monge
 a,
José M.
López-de-Luzuriaga
 a and
Dage
Sundholm
 *b
*b
aDepartamento de Química, Instituto de Investigación en Química (IQUR), Universidad de La Rioja, Madre de Dios 53, 26006, Logroño, Spain. E-mail: daniel.blascos@unirioja.es
bDepartment of Chemistry, Faculty of Science, University of Helsinki, P. O. Box 55 (A. I. Virtasen aukio 1), FIN-00014, Helsinki, Finland. E-mail: dage.sundholm@helsinki.fi
First published on 31st January 2024
Abstract
Photophysical properties of the three-fold symmetric 2,5,8-tris(phenylthiolato)heptazine molecule (1) are studied from combined experimental and computational viewpoints. The intense blue photoemission of 1 in the solid state and in toluene solution is proposed to have a fluorescent origin on the basis of a relatively short emission lifetime and no detectable triplet decay. Calculations at correlated ab initio levels of theory also show that 1 has a large inverted singlet–triplet (IST) gap, a non-vanishing spin–orbit coupling matrix element between the first excited singlet and triplet states, and a fast intersystem crossing rate constant that leads to singlet population from the higher-lying triplet state. The IST gap implies that the first excited singlet state is the lowest excited one, agreeing with the measured fluorescent behaviour of 1. IST gaps are also obtained for the oxygen-containing (2) and selenium-containing (3) analogues of 1 at the ADC(2) level of theory, but not for the tellurium one (4). Calculations of the magnetically induced current density demonstrate that the heptazine core of 1 is globally non-aromatic due to the alternation of carbon and nitrogen atoms along its external rim.
1 Introduction
Heptazine (1,3,4,6,7,9,9b-heptaazaphenalene, tri-s-triazine, or cyamelurine in older texts; see Fig. 1, left) is a fused planar phenalenyl tricycle featuring a central nitrogen atom and alternating carbon and nitrogen atoms along the external rim. The high rigidity of the phenalenyl core, and the precise accumulation of the electron density on the peripheral nitrogen atoms, give rise to remarkable properties that make heptazine derivatives useful in diverse applications e.g., as building blocks for MOFs and COFs, photocatalysts, or electroluminescent species for organic light-emitting diodes (OLEDs).1 In particular, the optical properties of heptazine are well known and there are many examples of intensely luminescent heptazine derivatives,1 some of which even display thermally-activated delayed fluorescence (TADF).2–6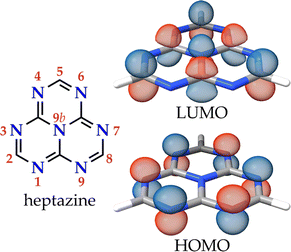 | ||
| Fig. 1 The molecular structure of heptazine with the canonical numbering of the atomic positions and the HOMO and LUMO orbitals. | ||
The lowest-energy excited singlet (S1) and triplet (T1) states of heptazine have the same orbital composition consisting of a localized set of atom-range multiple resonances (MR) from the HOMO, located on the six electron-rich peripheral nitrogen atoms, to the LUMO, on the carbon and central nitrogen atoms (see Fig. 1, right).7 The character of these excitations is almost insensitive to corner functionalization (atomic positions 2, 5, and 8), even when the substituent is a heavy metal such as gold.8 The small HOMO–LUMO overlap minimizes the exchange integral leading to a small energy difference between S1 and T1 [ΔEST, calculated as ΔEST = E(S1 ← S0) − E(T1 ← S0)].9
By performing calculations at different levels of theory, several research groups have recently demonstrated that the energy order of S1 and T1 in heptazine is unexpectedly inverted (IST, see Fig. 2).7,8,10–22 The violation of Hund's maximum multiplicity rule23 by non-alternating polycyclic polyenes is not a new phenomenon. A more stable S1 with respect to T1 was observed for the symmetric forms of propalene, pentalene, heptalene,24 and, more recently, in isopyrene.25–27 However, far from just being a scientific curiosity, IST is expected to give rise to a new kind of light-emitting molecules, the so-called fifth generation of emitters with applications in OLED devices.28,29 The singlet–triplet inversion is expected to eliminate the need of thermal activation for achieving maximum external quantum efficiency. It also supresses the triplet decay channel, overcoming potential bimolecular annihilation processes that ordinary TADF emitters suffer from due to the long lifetime of the excited states, which are detrimental to the performance and stability of OLED devices.
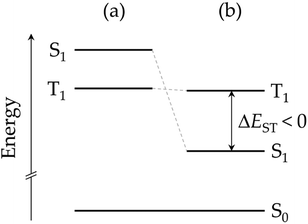 | ||
| Fig. 2 Energy diagram of the first excited states of a molecule (a) obeying Hund's multiplicity rule, and (b) with an inverted singlet–triplet gap. | ||
The origin of IST is attributed to dynamic spin polarization effects of the first excited state,24,30–32 which are accounted for at configuration interaction (CI) levels including double excitations. For a given active orbital space, Pauli's exclusion principle restricts the number of possible doubly-excited triplet configurations with respect to the number of doubly-excited singlet ones. When this extra dynamic spin polarization stabilization of S1 exceeds the exchange energy, ΔEST becomes negative.7,24,30 Thus, a proper description of the IST needs either single or multireference correlated wavefunction-based (ab initio) computational levels that accurately capture contributions from double excitations. These methods, in virtue of an improved description of the electronic structure, are computationally expensive and resource penalties preclude a widespread usage, justifying the use of cheaper but reliable approximate computational levels such as the approximate second-order coupled-cluster (CC2) and algebraic diagrammatic construction of second order [ADC(2)] methods.33–37
Despite the increasing plethora of potential IST molecules identified by high-throughput virtual screenings,10,17,26,38 there are still very few experimental studies of their photophysical properties.7,10,13 In their seminal paper from 2022, Aizawa et al. proposed a decreasing trend of the delayed fluorescence lifetime component with decreasing temperature as a conclusive experimental proof of the so-called heptazine-type delayed fluorescence arising from IST.10 However, we believe that the paucity and non-homogeneity of the available experimental data precludes a generalization of the photophysical behaviour of IST molecules. Thus, it is mandatory to continue gathering experimental data from molecules for which IST gaps are computationally detected, to gain a more complete picture of the actual behaviour and performance of these promising molecules.
Here, we report a thorough experimental study of the photophysical properties of 2,5,8-tris(phenylthiolato)heptazine (molecule 1, see Fig. 3), which is identified to have a large inverted singlet–triplet gap at several ab initio correlated levels of theory. We show that the completely symmetrical derivatives of heptazine, which are excluded at the first stage of virtual screenings due to their vanishing S1 ← S0 oscillator strengths, can also be efficient IST emitters thanks to vibronic coupling. Besides, some of the measurements are performed on pure powder samples, a state that had not been considered in previous studies. We have focused on ether-like derivatives of heptazine due to their relative ease of synthesis and introduction of structural modifications in the pending moieties. Posern et al. synthesized a family of symmetric heptazine arylthio- (aryl = phenyl, p-tolyl, p-chlorophenyl, p-methoxyphenyl, 2-naphthyl, 1-methyltetrazyl) and phenylselenoethers starting from 2,5,8-trichloroheptazine, and studied their thermal stability. X-ray single-crystal structures were determined for the phenylthiolato and phenylselenolato derivatives as mesitylene (1,3,5-trimethylbenzene) solvates, revealing a three-fold symmetry axis and a staggered conformation of the phenyl planes with respect to the heptazine one. Besides, the title molecule 1 was identified as photoemissive in chloroform solution (λem at 552 nm with a λex of 288 nm). Galmiche et al. proposed a new route to heptazine arylthioethers starting from the more soluble 2,5,8-tris(3,5-diethylpyrazolyl)heptazine and presented a more complete study of the photophysical properties of molecule 1. Interestingly, the authors noted that there is a weak absorption band at low energies in all heptazine derivatives they studied. The band was assigned with time-dependent density functional theory (TD-DFT) calculations to a symmetry-forbidden S1 ← S0 transition in the heptazine core.
The synthesis of 1 is described in Section 2.1 and in more detail in the Experimental Section 4. The experimental studies of the photophysical properties are discussed in Section 2.2, which is followed by computational characterization in Section 2.3 that comprises calculations of photophysical properties, the magnetically induced current density of 1, and calculation of optical properties of related compounds where the S atoms are replaced by O (2), Se (3) or Te (4). The main results are summarized in the Conclusions Section 3.
2 Results and discussion
2.1 Synthesis of molecule 1
Molecule 1 was prepared by the nucleophilic attack of an excess of phenylthiol to 2,5,8-trichloroheptazine in refluxing toluene, in a similar way as previously reported (see Fig. 3).39 The reaction gives rise to a mixture of the desired trisubstituted product with the disubstituted one and other unidentified byproducts, that are separated by flash column chromatography.3 The identity and purity of 1 was assessed by 13C{1H} NMR. Molecule 1 is obtained as a white solid displaying intense blue photoluminescence (see inset in Fig. 4, left). The other spectroscopic measurements accord with the already published data.3,392.2 Photophysical studies
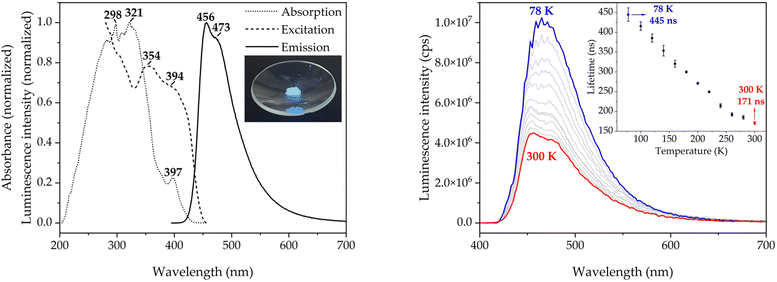
The optical properties of molecule 1 in the solid state, which have not been reported before, are discussed below (see Fig. 4). The diffuse reflectance (DR) UV-vis spectrum of 1 in potassium bromide mull (dotted line in Fig. 3, left) shows a structured asymmetric band centered at 300 nm. The low-energy edge of the band has a well-defined absorption band at 397 nm, which corresponds to the symmetry-forbidden S1 ← S0 transition (vide infra). The excitation and emission spectra at room temperature (dashed and solid lines in Fig. 4, left, respectively) are also examined. The emission spectrum features a single band with maxima at 456 and 473 nm and a broad tail in the green-to-yellow visible region, which is macroscopically observed as bright blue photoluminescence. The structure of the emissive excited state is not heavily distorted as indicated by the small Stokes shift of 3451 cm−1. More interestingly, the spectral profile of the excitation spectrum resembles the low-energy edge of the absorption spectrum, including the energies of the maxima, which suggests that there is a spin-allowed excitation to the singlet manifold. The transient photoluminescence decay data was fitted to a sum of up to three exponential functions. The emission lifetime was calculated as an average weighted by the relative amplitudes of the exponentials (see Experimental Section 4 and the ESI†). The average emission lifetime of 171 ns at 300 K is unexpectedly long due to the symmetry-prohibited transition from the S1 state. The absolute photoluminescence quantum yield (PLQY) of 0.33 is high, but not as high as that of HAP-3TPA of 0.91 (6 wt% embedded in a solid film), which is state-of-the-art.6The emission spectrum and average lifetimes were also measured at low temperature (see Fig. 4, right and the ESI†). The emission intensity nearly triples upon cooling to 78 K as the restriction of vibrational motion disfavors non-radiative deactivations. The vibronic structure of the ground state is also revealed in the emission profile (see Fig. S1, ESI†). The energy difference between consecutive vibronic peaks is roughly 300 cm−1, which is of the same size as the calculated energy of the out-of-plane vibration of the nitrogen atoms of the heptazine core (see Fig. S2, ESI†). The average emission lifetime at 78 K of 445 ns is about a factor of 2.5 longer than the one of 171 ns measured at 300 K indicating the influence of excited vibrational motion on the relaxation of S1. However, it is still fast as compared to other relaxation channels. There is no evidence of participation of the triplet state at 78 K, precluding phosphorescent or TADF behavior.
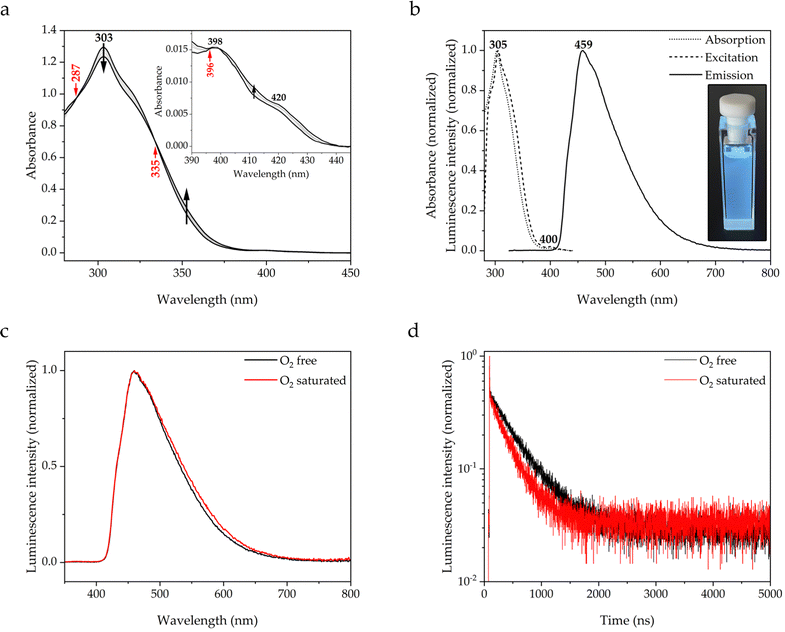
The photophysical properties of molecule 1 have also been measured in toluene solution (see Fig. 5), which was not considered in the study of Galmiche et al.3 The UV-vis spectrum (see Fig. 5a) shows a structured absorption at 303 nm similar to the one observed by DR-UV-vis. A structured spectral trace corresponding to the S1 ← S0 transition is again observed around 410 nm, in line with the findings of Galmiche et al. for other solvents3 (see Introduction Section 1). The spectrum has been measured at different temperatures in the 20 °C to 70 °C range. The spectral profile is slightly modified upon heating, whereas the absorption energies do apparently not depend on the temperature since the position of the maximum is not shifted. Notably, the absorbance of the spectral trace increases. Since the S1 ← S0 transition is symmetry-forbidden, a thermally-prompted increase of the promoting vibrational motion breaks the molecular symmetry and relaxes the prohibition rule, thus increasing the absorbance. The photoemissive properties have been measured in the absence and presence of molecular oxygen, which is a well-known quencher of luminescence via collisional energy transfer and formation of singlet oxygen. Besides that long-lived excited states are sensitive to the presence of molecular oxygen, it can also form an exciplex with the excited emitter molecule and thereby contribute to the luminescence quenching.40
Molecule 1 is extremely luminescent in solution, exhibiting intense blue emission with a PLQY of 0.71 even at μM concentrations (see Fig. 5b). The emission profile resembles the one in the solid state, with a maximum at 459 nm and a tail up to 700 nm, with a long emission lifetime of 462 ns. As expected, the presence of oxygen in solution leads to a drastic drop in the emission intensity, which is reflected in a shortening of the lifetime to 316 ns and a decrease in the PLQY to 0.38. However, it is noteworthy that the emission in not completely quenched, what would be expected if it were of phosphorescent nature. Moreover, the spectral profiles are virtually indistinguishable without loss of vibronic fine structure (see Fig. 5c). This demonstrates that the triplet state is not populated at room temperature, since no part of the spectrum originates from triplet decay. The transient photoluminescence decay data shows monoexponential behaviour over the whole considered time range (see Fig. 5d and Fig. S5, ESI†). The longer lifetime and higher PLQY of 1 in solution than in the solid state, irrespective of the absence or presence of oxygen, suggest the formation of π-stacked exciplexes with toluene molecules, what is supported by the observation of π-stacks with mesitylene molecules in the crystal state.39 The photophysical properties of molecule 1 are summarized in Table 1.
| Molecule | λ abs | λ em (λex) | τ | ϕ (λex) |
|---|---|---|---|---|
| a Presently we do not have instrumentation to measure these values. | ||||
| Solid state, 300 K | 295, 321, 397 | 456 (354) | 171 ± 4 | 0.33 (374) |
| Solid state, 78 K | —a | 472 (354) | 445 ± 17 | —a |
| Toluene, O2 free | 303, 398, 418 | 459 (306) | 462 ± 2 | 0.71 (290) |
| Toluene, O2 saturated | 303, 398, 418 | 459 (306) | 316 ± 2 | 0.38 (290) |
2.3 Computational studies
| Transition | Irrepa | Energy | f | Contributions (%) | |
|---|---|---|---|---|---|
| a Irreducible representation. | |||||
| TD-DFT/PBE0 level of theory | |||||
| S1 ← S0 | a′ | 361 [3.437] | 0.00 | 37a′′ → 38a′′ | (97.0) |
| S6 ← S0 | a′ | 289 [4.290] | 0.44 | 36a′′ → 38a′′ | (98.4) |
| S7 ← S0 | a′ | 289 [4.290] | 0.44 | 35a′′ → 38a′′ | (98.4) |
| S26 ← S0 | a′ | 241 [5.139] | 0.42 | 34a′′ → 39a′′ | (67.7) |
| 31a′′ → 39a′′ | (12.0) | ||||
| S27 ← S0 | a′ | 241 [5.146] | 0.42 | 34a′′ → 40a′′ | (67.7) |
| 31a′′ → 40a′′ | (12.0) | ||||
| T1 ← S0 | a′ | 381 [3.251] | — | 37a′′ → 38a′′ | (97.2) |
| ADC(2) level of theory | |||||
| S1 ← S0 | a′ | 414 [2.993] | 0.00 | 37a′′ → 38a′′ | (50.1) |
| 34a′′ → 38a′′ | (44.5) | ||||
| T1 ← S0 | a′ | 382 [3.246] | — | 37a′′ → 38a′′ | (51.8) |
| 34a′′ → 38a′′ | (45.7) | ||||
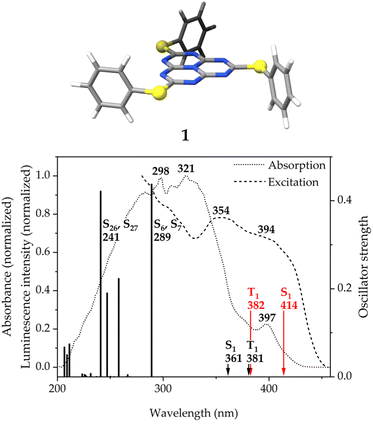
There are two pairs of doubly-degenerate transitions of high intensity at 289 and 241 nm. They are considerably blue-shifted with respect to the absorption maxima. The energy mismatch may be due to stabilizing packing effects in the solid state, that are not taken into account in the calculation. The S6 ← S0 and S7 ← S0 transitions correspond to charge transfers from the HOMO−1 and HOMO−2, mainly located on the sulfur atoms of the pending phenylthiolate substituents with smaller contributions on the phenyl rings and the peripheral nitrogen atoms of the heptazine core, to the LUMO, which, apart from the expected contribution on the peripheral carbon and central nitrogen atoms of the heptazine core (see Fig. 1, right), shows a non-negligible contribution from the sulfur atoms. The S26 and S27 states, on the other hand, involve transitions from HOMO−6 and HOMO−9, which have a bigger contribution from the π-bonding electron density of the phenyl rings, to LUMO+1 and LUMO+2, which are not as clearly defined on the heptazine ring as the LUMO.
The S1 and T1 states calculated at the ADC(2) level consist of the two transitions of similar weight from the HOMO and HOMO-6 to the LUMO that are depicted in Fig. 7. The spatial distribution of the HOMO and HOMO−6 is identical, with only a variation of the sign of the orbital lobes located on the peripheral nitrogen atoms of heptazine. The usual MR pattern of heptazine is accompanied by a charge transfer from a bonding π-orbital of the pending phenyl groups to an empty atomic orbital of the bridging sulfur atoms. The calculated energies at this level of theory are close to the local absorption maximum of the band edge (see Fig. 6, bottom). More importantly, the S1 ← S0 excitation energy is lower (longer wavelength) than the T1 ← S0 one, meaning that the singlet–triplet gap is inverted. The IST is consistent with the strong fluorescent property of molecule 1.
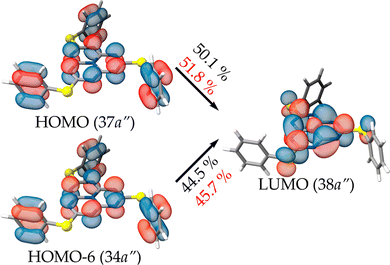 | ||
| Fig. 7 Molecular orbitals and their contributions to the S1 (T1 in red) transition calculated at the ADC(2)/def2-TZVP level of theory for molecule 1. | ||
The excitation energies to the S1 and T1 states have also been calculated at the complete active space self-consistent field (CASSCF) and the extended multiconfigurational quasidegenerate perturbation theory of second order (XMC-QDPT2) levels, with an active space of 6 electrons in 6 orbitals as well as with 12 electrons in 12 orbitals. The excitation energies and the singlet–triplet gaps calculated at the different levels of theory, together with the spin–orbit coupling matrix elements between S1 and T1 (〈S1|![[script letter H]](https://www.rsc.org/images/entities/char_e142.gif) SO|T1〉) and the S1 ← T1 intersystem crossing rate constants (kISC), are collected in Table 3.
SO|T1〉) and the S1 ← T1 intersystem crossing rate constants (kISC), are collected in Table 3.
As expected, TD-DFT gives a positive IST gap. The correlated ab initio methods predict that the excitation energy of the S1 ← S0 transition is smaller than the T1 ← S0 transition leading to a negative singlet–triplet gap. In fact, the ΔEST of −3305 cm−1 obtained at the XMC-QDPT2(12,12) level is large despite the excited singlet and triplet states have the same orbital composition, suggesting a noticeable dynamic spin polarization effect. However, the excitation energies calculated at the XMC-QDPT2 level are for some unclear reason much smaller than the ones calculated at other levels of theory and too small as compared to the energy of the emitted light of 21![[thin space (1/6-em)]](https://www.rsc.org/images/entities/char_2009.gif) 790 cm−1 corresponding to a wavelength of 459 nm. The excitation energies calculated the CASSCF level are rather independent of the size of the active space and in fair agreement with those calculated at other levels of theory and with the experimental value. The SOC matrix element between T1 and S1 is 0.15 cm−1 at the CASSCF(12,12) level yielding a kISC of the order of 106 s−1, which is fast enough to direct the excitons to the fluorescing S1 state. The calculated phosphorescence rate constant from T1 to S0 is 400 s−1 at the CC2 level. The calculated rate constant for the reverse ISC (kRISC) from S1 to T1 is 0.07 s−1 at the XCM-DQPT2(12,12) level. These rate constants are several orders of magnitude smaller than the kISC rate constant from T1 to S1 of 5.5 × 10⁵ s−1, which was calculated at the XMC-QDPT2(12,12) level, the internal conversion rate constant (kIC) from S1 to S0 is 4.0 × 10⁴ s−1, and the experimental fluorescence rate constant (kfluor) from S1 to S0 is 3.1 × 10⁵ s−1 implying that practically all excitons reach S1 where they decay to S0 either by fluorescence or non-radiatively through internal conversion.
790 cm−1 corresponding to a wavelength of 459 nm. The excitation energies calculated the CASSCF level are rather independent of the size of the active space and in fair agreement with those calculated at other levels of theory and with the experimental value. The SOC matrix element between T1 and S1 is 0.15 cm−1 at the CASSCF(12,12) level yielding a kISC of the order of 106 s−1, which is fast enough to direct the excitons to the fluorescing S1 state. The calculated phosphorescence rate constant from T1 to S0 is 400 s−1 at the CC2 level. The calculated rate constant for the reverse ISC (kRISC) from S1 to T1 is 0.07 s−1 at the XCM-DQPT2(12,12) level. These rate constants are several orders of magnitude smaller than the kISC rate constant from T1 to S1 of 5.5 × 10⁵ s−1, which was calculated at the XMC-QDPT2(12,12) level, the internal conversion rate constant (kIC) from S1 to S0 is 4.0 × 10⁴ s−1, and the experimental fluorescence rate constant (kfluor) from S1 to S0 is 3.1 × 10⁵ s−1 implying that practically all excitons reach S1 where they decay to S0 either by fluorescence or non-radiatively through internal conversion.
Previous spectroscopic studies suggested that pristine heptazine is aromatic because it has the δ (1H) signal at 8.3 ppm44 and that cyclazine (9b-azaphenalene) is antiaromatic, with δ (1H) signals at 2.1–3.7 ppm.45–47 In the latter, the central nitrogen atom does not participate in the π-conjugation, leading to a rim consisting of a 12π-electron annulene.
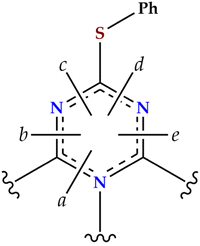
We have performed MIC calculations with the GIMIC method and integrated the strength of the MIC passing through selected cut planes as shown in Fig. 8. The profiles of the MIC passing through the cut planes are depicted in Fig. S11 (ESI†). The integrated MIC strengths of molecule 1 are collected in Table 4. The GIMIC calculations show that molecule 1 is non-aromatic, with a very weak paratropic current of ca. −0.4 nA T−1 circulating around the edge of the molecule. Visualization of the streamlines of the current-density pathways reveals that the MIC consists of small local independent vortices at the nitrogen and sulfur atoms (Fig. S12, ESI†), with hardly any current density circulating around the carbon atoms. The global non-aromaticity of the heptazine core in 1 is thus a consequence of the alternation of carbon and nitrogen atoms along the external rim that precludes free electron circulation.
| Plane | Net | Diatropic | Paratropic |
|---|---|---|---|
| a | 0.03 | 6.00 | −5.97 |
| b | −0.35 | 7.09 | −7.45 |
| c | −0.43 | 7.73 | −8.16 |
| d | −0.41 | 7.72 | −8.13 |
| e | −0.34 | 7.10 | −7.44 |
The structural optimization at the DFT/PBE0-D3(BJ)/def2-TZVP level of theory of molecules 2–4 preserves, in the four cases, the three-fold symmetry of the starting C3h point group of molecule 1 as extracted from its X-ray crystal structure (see Fig. 9). For molecule 4, the σh plane is lost due to the torsion of the bulkier phenyltellurol groups. A selection of bond distances and angles of the optimized molecular structures of 1–4 is compared in the ESI,† with the existing X-ray structural data.39,48 There is no experimental evidence of molecule 4, probably due to the instability of tellurols. The agreement between the available experimental and calculated distances and angles is excellent, validating the use of the computed models for further simulations.
 | ||
| Fig. 9 The molecular structures of molecules 1–4 optimized at the DFT/PBE0-D3(BJ)/def2-TZVP level of theory. | ||
The vertical excitation energies to the S1 and T1 states have been calculated at the ADC(2) level of theory. The results are summarized in Tables 5 and 6. The orbital contributions to the most intense transitions are plotted in the ESI.†
| Molecule | Irrepa | E(S1 ← S0) | Contributions (%) | E(T1 ← S0) | Contributions (%) | ||
|---|---|---|---|---|---|---|---|
| a Irreducible representation. | |||||||
| 2 | a′ | 3.494 | 31a′′ → 35a′′ | (72.4) | 3.787 | 31a′′ → 35a′′ | (74.3) |
| 34a′′ → 35a′′ | (21.4) | 34a′′ → 35a′′ | (22.5) | ||||
| 3 | a′ | 2.920 | 41a′′ → 47a′′ | (49.7) | 3.166 | 41a′′ → 47a′′ | (52.1) |
| 46a′′ → 47a′′ | (40.3) | 46a′′ → 47a′′ | (41.6) | ||||
| 4 | a | 3.272 | 140a → 141a | (84.0) | 3.164 | 140a → 141a′′ | (81.1) |
The chemical identity of the bridging chalcogen atom has an important effect on the calculated ΔEST, which becomes smaller upon increasing the atomic number in the series 2 (X![[double bond, length as m-dash]](https://www.rsc.org/images/entities/char_e001.gif) O) > 1 (X
O) > 1 (X![[double bond, length as m-dash]](https://www.rsc.org/images/entities/char_e001.gif) S) > 3 (X
S) > 3 (X![[double bond, length as m-dash]](https://www.rsc.org/images/entities/char_e001.gif) Se) > 4 (X
Se) > 4 (X![[double bond, length as m-dash]](https://www.rsc.org/images/entities/char_e001.gif) Te). In the extreme case of molecule 4, ΔEST is even positive. The reason for this may be found in the values of the vertical excitation energies and the orbital contributions. For molecules 1–3, for which ΔEST is predicted to be negative, there are two main contributions to the vertical transitions, regardless of the multiplicity of the arriving state. These are analogous to the ones calculated at the same level of theory for molecule 1 (vide supra). The occupied MOs at Se and Te contribute to the exciton of the S1 and T1 states, whereas for the O and S containing molecules they do not. Since Te is larger than O, S and Se the exciton is significantly localized to Te, whereas for the three other molecules the exciton is mainly at the heptazine moiety.
Te). In the extreme case of molecule 4, ΔEST is even positive. The reason for this may be found in the values of the vertical excitation energies and the orbital contributions. For molecules 1–3, for which ΔEST is predicted to be negative, there are two main contributions to the vertical transitions, regardless of the multiplicity of the arriving state. These are analogous to the ones calculated at the same level of theory for molecule 1 (vide supra). The occupied MOs at Se and Te contribute to the exciton of the S1 and T1 states, whereas for the O and S containing molecules they do not. Since Te is larger than O, S and Se the exciton is significantly localized to Te, whereas for the three other molecules the exciton is mainly at the heptazine moiety.
3 Conclusions
The three-fold symmetrical 2,5,8-tris(phenylthiolato)heptazine molecule (1) emits in blue at 459 nm with an emission lifetime of 462 ns and 171 ns, and a PLQY of 0.71 and 0.33, in toluene solution and in the solid state, respectively. The complete overlap of the excitation spectrum with the absorption one, the relatively short lifetimes, and the insensitivity of the emission spectral profile to the presence of dissolved oxygen are indicative of the emission having fluorescent character. The collected photophysical data are not conclusive of an inversion of the first excited states of molecule 1. However, since no emission from an excited triplet state could be detected, this unequivocally demonstrates that the emissive state is of singlet multiplicity. S1 is also the only state from which photoluminescence should be expected for an IST molecule under ambient conditions. Correlated ab initio level calculations show that 1 has a large inverted singlet–triplet energy splitting of −2883 cm−1 (−0.36 eV) at the CASSCF(12,12) level, which is not obtained in TD-DFT calculations. The calculated spin–orbit coupling matrix element between S1 and T1 of 0.15 cm−1 yields a kISC of 106 s−1 between the T1 and S1 states. The relaxation of the excitons directs them to the emitting S1 state leading to the strong luminescence.This study demonstrates the potential of three-fold symmetric ether, thioether, and selenoether derivatives of heptazine to also be among the fifth generation of emitter molecules. Further efforts will be devoted to the synthesis of new analogs of molecule 1 and its implementation in working OLED devices.
4 Experimental
4.1 General procedures
(DR)-UV-Vis spectra were measured in a Shimadzu UV-3600 spectrophotometer. For the collection of DR-UV-vis spectra, a Harrick Praying Mantis diffuse reflection accessory was employed. For the collection of UV-vis spectra, Hellma Quartz Suprasil cells with an optical path of 1 cm were employed. Temperature was controlled with a Shimadzu TCC-240A cell holder. Photoluminescence spectra were measured in an Edinburgh Instruments FLS 1000 spectrofluorimeter. Emission lifetimes were determined with the time-correlated single photon counting (TCSPC) technique employing Edinburgh Instruments EPL-375 (λex of 375 nm) and EPL-295 (λex of 295 nm) picosecond pulsed diode lasers as the excitation source. The transient photoluminescence decay data was fitted to a model function of one to three exponential parameters | (1) |
 | (2) |
Absolute photoluminescence quantum yields were determined with a Hamamatsu Quantaurus-QY C11347 instrument. HPLC grade toluene was degassed and dried with a MBRAUN MB-SPS800 system. The solutions for photophysical measurements were prepared inside a MBRAUN LABstar glovebox under Ar atmosphere. For measurements in the presence of oxygen, air was bubbled through the neat solvent for 10 min.
4.2 Synthesis of 2,5,8-tris(phenylthiolato)heptazine (1)
2,5,8-Tris(phenylthiolato)heptazine (1) was prepared employing standard Schlenk techniques from 2,5,8-trichloroheptazine49 and excess phenylthiol (Sigma-Aldrich) following a previously reported method,39 but employing anhydrous toluene instead of mesitylene as the solvent, and purifying the solid product by flash column chromatography (8 dichloromethane:2 n-hexane).34.3 Computational details
The calculations were carried out using TURBOMOLE version 7.5.1.50,51 The starting geometry of molecule 1 was extracted from its X-ray structure39 and employed as a template for molecules 2–4. The structures were optimized at the density functional theory (DFT) level52 with the PBE0 functional,53–55 def2-TZVP basis sets on all atoms,56 the resolution-of-the-identity (RI) approximation,57–59 and the D3(BJ) semiempirical correction to dispersion interactions.60,61 The models were verified as minima by the analytical computation of the vibrational frequencies.62 The first vertical singlet and triplet excitation energies were calculated at the algebraic diagrammatic construction of second order [ADC(2)] level35 with def2-TZVP basis sets on all atoms.56 The optimized molecular structures, orbitals, and exciton surfaces were visualized and rendered using UCSF ChimeraX version 1.5.63 Excitation energies were calculated with the Firefly program at the state-averaged complete active space self-consistent field (CASSCF) level with the active space consisting of 6 electrons in 6 orbitals as well as with 12 electrons in 12 orbitals64,65 They were also calculated at the extended multiconfigurational quasi degenerate perturbation theory at the second order (XMC-QDPT2) level64,65 using the same active spaces. The matrix element of the one-electron spin–orbit coupling operator between the T1 and S1 states
  was calculated at the CASSCF levels using GAMESS-US.66 The kISC rate constant (in s−1) for the S1 ← T1 transition was calculated using67
 | (3) |
The magnetically induced current (MIC) densities were calculated using the gauge-including magnetically induced currents (GIMIC) method.41–43 Ring-current strength susceptibilities, which are denoted ring-current strengths, were obtained by numerical integration of the current density passing through a cut-plane perpendicular to a selected bond. The current density was calculated at the BHandHLYP/def2-TZVP level of theory (LIBXC ID 436).69–71
Author contributions
J. M. L., M. M., R. R. V., and D. S. acquired funding. J. M. L. and M. M. provided experimental resources. D. S. provided computational resources. D. B. did the experimental work and the calculations at the DFT, TD-DFT and ADC(2) levels of theory. R. T. N. and R. R. V. did the calculations at the CASSCF and XMC-QDPT2 levels of theory. D. B. did the MIC calculations with the GIMIC method. D. B. and D. S. wrote the first version of the manuscript. All authors contributed to the final version of the manuscript.Conflicts of interest
There are no conflicts to declare.Acknowledgements
The research has been supported by the Spanish D. G. I. MINECO/FEDER (project number PID2022-139739NB-00I, AEI/FEDER, UE) and by The Academy of Finland (project numbers 340582 and 340583). DB acknowledges Universidad de La Rioja for the concession of a Margarita Salas postdoc fellowship financed by the Spanish Ministerio de Universidades and the European Union-NextGenerationEU program.References
- P. Audebert, E. Kroke, C. Posern and S.-H. Lee, Chem. Rev., 2021, 121, 2515–2544 CrossRef CAS PubMed.
- D. M. Mayder, C. M. Tonge, G. D. Nguyen, R. Hojo, N. R. Paisley, J. Yu, G. Tom, S. A. Burke and Z. M. Hudson, Chem. Mater., 2022, 34, 2624–2635 CrossRef CAS.
- L. Galmiche, C. Allain, T. Le, R. Guillot and P. Audebert, Chem. Sci., 2019, 10, 5513–5518 RSC.
- J. Li, H. Nomura, H. Miyazaki and C. Adachi, Chem. Commun., 2014, 50, 6174–6176 RSC.
- J. Li, Q. Zhang, H. Nomura, H. Miyazaki and C. Adachi, Appl. Phys. Lett., 2014, 105, 013301 CrossRef.
- J. Li, T. Nakagawa, J. MacDonald, Q. Zhang, H. Nomura, H. Miyazaki and C. Adachi, Adv. Mater., 2013, 25, 3319–3323 CrossRef CAS PubMed.
- J. Ehrmaier, E. J. Rabe, S. R. Pristash, K. L. Corp, C. W. Schlenker, A. L. Sobolewski and W. Domcke, J. Phys. Chem. A, 2019, 123, 8099–8108 CrossRef CAS PubMed.
- D. Blasco, R. T. Nasibullin, R. R. Valiev and D. Sundholm, Chem. Sci., 2023, 14, 3873–3880 RSC.
- P. de Silva, C. A. Kim, T. Zhu and T. Van Voorhis, Chem. Mater., 2019, 31, 6995–7006 CrossRef CAS.
- N. Aizawa, Y.-J. Pu, Y. Harabuchi, A. Nihonyanagi, R. Ibuka, H. Inuzuka, B. Dhara, Y. Koyama, K.-I. Nakayama, S. Maeda, F. Araoka and D. Miyajima, Nature, 2022, 609, 502–506 CrossRef CAS PubMed.
- G. Ricci, J.-C. Sancho-García and Y. Olivier, J. Mater. Chem. C, 2022, 10, 12680–12698 RSC.
- L. Tučková, M. Straka, R. R. Valiev and D. Sundholm, Phys. Chem. Chem. Phys., 2022, 24, 18713–18721 RSC.
- J. Li, Z. Li, H. Liu, H. Gong, J. Zhang, X. Li, Y. Wang and Q. Guo, Dyes Pigm., 2022, 203, 110366 CrossRef CAS.
- S. Ghosh and K. Bhattacharyya, J. Phys. Chem. A, 2022, 126, 1378–1385 CrossRef CAS PubMed.
- F. Dinkelbach, M. Bracker, M. Kleinschmidt and C. M. Marian, J. Phys. Chem. A, 2021, 125, 10044–10051 CrossRef CAS PubMed.
- S. Pios, X. Huang, A. L. Sobolewski and W. Domcke, Phys. Chem. Chem. Phys., 2021, 23, 12968–12975 RSC.
- R. Pollice, P. Friederich, C. Lavigne, G. dos Passos Gomes and A. Aspuru-Guzik, Matter, 2021, 4, 1654–1682 CrossRef CAS.
- K. Bhattacharyya, Chem. Phys. Lett., 2021, 779, 138827 CrossRef CAS.
- A. L. Sobolewski and W. Domcke, J. Phys. Chem. Lett., 2021, 12, 6852–6860 CrossRef CAS PubMed.
- J. Sanz-Rodrigo, G. Ricci, Y. Olivier and J. C. Sancho-García, J. Phys. Chem. A, 2021, 125, 513–522 CrossRef CAS PubMed.
- G. Ricci, E. San-Fabián, Y. Olivier and J. C. Sancho-García, ChemPhysChem, 2021, 22, 553–560 CrossRef CAS PubMed.
- P. de Silva, J. Phys. Chem. Lett., 2019, 10, 5674–5679 CrossRef CAS PubMed.
- F. Hund, Zeitschrift für Physik, 1925, 33, 345–371 CrossRef CAS.
- S. Koseki, T. Nakajima and A. Toyota, Can. J. Chem., 1985, 63, 1572–1579 CrossRef CAS.
- M. H. Garner, J. T. Blaskovits and C. Corminboeuf, Chem. Sci., 2023, 14, 10458–10466 RSC.
- J. T. Blaskovits, M. H. Garner and C. Corminboeuf, Angew. Chem., Int. Ed., 2023, 62, e202218156 CrossRef PubMed.
- M. E. Sandoval-Salinas, G. Ricci, A. J. Pérez-Jiménez, D. Casanova, Y. Olivier and J. C. Sancho-García, Phys. Chem. Chem. Phys., 2023, 25, 26417–26428 RSC.
- J. Li, Z. Li, H. Liu, H. Gong, J. Zhang, Y. Yao and Q. Guo, Front. Chem., 2022, 10, 999856 CrossRef CAS PubMed.
- T. Won, K.-I. Nakayama and N. Aizawa, Chem. Phys. Rev., 2023, 4, 021310 CrossRef CAS.
- H. Kollmar and V. Staemmler, Theor. Chim. Acta, 1978, 48, 223–239 CrossRef CAS.
- W. T. Borden and E. R. Davidson, J. Am. Chem. Soc., 1977, 99, 4587–4594 CrossRef CAS.
- W. T. Borden, J. Am. Chem. Soc., 1975, 97, 5968–5970 CrossRef CAS.
- O. Christiansen, H. Koch and P. Jørgensen, Chem. Phys. Lett., 1995, 243, 409–418 CrossRef CAS.
- C. Hättig and F. Weigend, J. Chem. Phys., 2000, 113, 5154–5161 CrossRef.
- C. Hättig, Adv. Quantum Chem., 2005, 50, 37–60 CrossRef.
- A. Dreuw and M. Wormit, Wiley Interdiscip. Rev.: Comput. Mol. Sci., 2015, 5, 82–95 CAS.
- A. Dreuw and M. Head-Gordon, Chem. Rev., 2005, 105, 4009–4037 CrossRef CAS PubMed.
- Ö. H. Omar, X. Xie, A. Troissi and D. Padula, J. Am. Chem. Soc., 2023, 145, 19790–19799 CrossRef PubMed.
- C. Posern, U. Böhme, J. Wagler, C.-C. Höhne and E. Kroke, Chem. – Eur. J., 2017, 23, 12510–12518 CrossRef CAS PubMed.
- B. Valeur and M. N. Berberan-Santos, Molecular Fluorescence: Principles and Applications, John Wiley & Sons, Ltd, 2012, ch. 6, pp. 141–179 Search PubMed.
- J. Jusélius, D. Sundholm and J. Gauss, J. Chem. Phys., 2004, 121, 3952–3963 CrossRef PubMed.
- D. Sundholm, H. Fliegl and R. J. Berger, Wiley Interdiscip. Rev.: Comput. Mol. Sci., 2016, 6, 639–678 CAS.
- GIMIC, version 2.0, a current density program, Can be freely downloaded from https://github.com/qmcurrents/gimic and https://zenodo.org/record/8180435.
- R. S. Hosmane, M. A. Rossman and N. J. Leonard, J. Am. Chem. Soc., 1982, 104, 5497–5499 CrossRef CAS.
- D. Farquhar and D. Leaver, J. Chem. Soc., D, 1969, 24–25 RSC.
- C. Trujillo, G. Sánchex-Sanz, I. Alkorta and J. Elguero, Struct. Chem., 2017, 28, 345–355 CrossRef CAS.
- E. Kleinpeter and A. Koch, Eur. J. Org. Chem., 2022, e202101362 CrossRef CAS.
- M. R. Schwarz, H. Ehrenberg, M. A. Kloc and E. Kroke, Heterocycles, 2006, 68, 2499–2507 CrossRef CAS.
- E. J. Rabe, K. L. Corp, A. L. Sobolewski, W. Domcke and C. W. Schlenker, J. Phys. Chem. Lett., 2018, 9, 6257–6261 CrossRef CAS PubMed.
- S. G. Balasubramani, G. P. Chen, S. Coriani, M. Diedenhofen, M. S. Frank, Y. J. Franzke, F. Furche, R. Grotjahn, M. E. Harding, C. Hättig, A. Hellweg, B. Helmich-Paris, C. Holzer, U. Huniar, M. Kaupp, A. Marefat Khah, S. Karbalaei Khani, T. Müller, F. Mack, B. D. Nguyen, S. M. Parker, E. Perlt, D. Rappoport, K. Reiter, S. Roy, M. Rückert, G. Schmitz, M. Sierka, E. Tapavicza, D. P. Tew, C. van Wüllen, V. K. Voora, F. Weigend, A. Wodynski and J. M. Yu, J. Chem. Phys., 2020, 152, 184107 CrossRef CAS PubMed.
- TURBOMOLE V7.5.1 2021, a development of University of Karlsruhe and Forschungszentrum Karlsruhe GmbH, 1989–2007, TURBOMOLE GmbH, since 2007; available from https://www.turbomole.org (accessed 25.10.2022).
- O. Treutler and R. Ahlrichs, J. Chem. Phys., 1995, 102, 346–354 CrossRef CAS.
- J. P. Perdew, K. Burke and M. Ernzerhof, Phys. Rev. Lett., 1996, 77, 3865 CrossRef CAS PubMed.
- J. P. Perdew and M. Ernzerhof, J. Chem. Phys., 1996, 105, 9982 CrossRef CAS.
- C. Adamo and V. Barone, J. Chem. Phys., 1999, 110, 6158–6170 CrossRef CAS.
- F. Weigend and R. Ahlrichs, Phys. Chem. Chem. Phys., 2005, 7, 3297–3305 RSC.
- K. Eichkorn, O. Treutler, H. Öhm, M. Häser and R. Ahlrichs, Chem. Phys. Lett., 1995, 242, 652–660 CrossRef CAS.
- K. Eichkorn, F. Weigend, O. Treutler and R. Ahlrichs, Theor. Chem. Acc., 1997, 97, 119–124 Search PubMed.
- F. Weigend, Phys. Chem. Chem. Phys., 2006, 8, 1057–1065 RSC.
- S. Grimme, J. Antony, S. Ehrlich and H. Krieg, J. Chem. Phys., 2010, 132, 154104 CrossRef PubMed.
- S. Grimme, S. Ehrlich and L. Goerigk, J. Comput. Chem., 2011, 32, 1456–1465 CrossRef CAS PubMed.
- P. Deglmann, K. May, F. Furche and R. Ahlrichs, Chem. Phys. Lett., 2004, 384, 103–107 CrossRef CAS.
- E. F. Pettersen, T. D. Goddard, C. C. Huang, E. C. Meng, G. S. Couch, T. I. Croll, J. H. Morris and T. E. Ferrin, Protein Sci., 2021, 30, 70–82 CrossRef CAS PubMed.
- A. A. Granovsky, Firefly version 8.0.0, https://classic.chem.msu.su/gran/firefly/index.html (accessed 30.9.2023).
- A. A. Granovsky, J. Chem. Phys., 2011, 134, 214113 CrossRef PubMed.
- M. W. Schmidt, K. K. Baldridge, J. A. Boatz, S. T. Elbert, M. S. Gordon, J. H. Jensen, S. Koseki, N. Matsunaga, K. A. Nguyen, S. Su, T. L. Windus, M. Dupuis and J. A. Montgomery, J. Comput. Chem., 1993, 14, 1347–1363 CrossRef CAS.
- R. R. Valiev, B. S. Merzlikin, R. T. Nasibullin, A. Kurtzevitch, V. N. Cherepanov, R. R. Ramazanov, D. Sundholm and T. Kurtén, Phys. Chem. Chem. Phys., 2023, 25, 6406–6415 RSC.
- R. R. Valiev, V. N. Cherepanov, G. V. Baryshnikov and D. Sundholm, Phys. Chem. Chem. Phys., 2018, 20, 6121–6133 RSC.
- A. D. Becke, Phys. Rev. A: At., Mol., Opt. Phys., 1988, 38, 3098–3100 CrossRef CAS PubMed.
- A. D. Becke, J. Chem. Phys., 1993, 98, 1372–1377 CrossRef CAS.
- S. Lehtola, C. Steigemann, M. J. Oliveira and M. A. Marques, SoftwareX, 2018, 7, 1–5 CrossRef.
Footnote |
| † Electronic supplementary information (ESI) available: Emission spectrum of molecule 1 in the solid state at 78 K, transient photoluminescence spectra of molecule 1, molecular orbital contributions to the most intense transitions of molecules 1–4, streamlines of the MIC pathways of molecule 1, selected bond lengths and angles of molecules 1–4, Cartesian coordinates of molecules 1–4. See DOI: https://doi.org/10.1039/d3cp05242g |
| This journal is © the Owner Societies 2024 |


