 Open Access Article
Cortisol sensing by optical sensors
Rossella
Santonocito
 a,
Roberta
Puglisi
a,
Alessia
Cavallaro
a,
Andrea
Pappalardo
a,
Roberta
Puglisi
a,
Alessia
Cavallaro
a,
Andrea
Pappalardo
 ab and
Giuseppe
Trusso Sfrazzetto
 *ab
*ab
aDepartment of Chemical Sciences, University of Catania, Viale Andrea Doria 6, 95125, Catania, Italy. E-mail: giuseppe.trusso@unict.it
bINSTM Udr of Catania, Viale Andrea Doria 6, 95125, Catania, Italy
First published on 28th December 2023
Abstract
During a stress condition, the human body synthesizes catecholamine neurotransmitters and specific hormones (called “stress hormones”), the most important of which is cortisol. The monitoring of cortisol levels is extremely important for controlling the stress levels. For this reason, it has important medical applications. Common analytical methods (HPLC, GC-MS) cannot be used in real life due to the bulkiness of the instruments and the necessity of specialized operators. Molecular probes solve this problem. This review aims to provide a description of recent developments in this field, focusing on the analytical aspects and the possibility to obtain real practical devices from these molecular probes.
Introduction
Cortisol, a lipophilic human hormone produced by the adrenal cortex, plays a crucial role in many biological processes, including blood pressure regulation and sugar metabolism.1 In addition, this hormone is recognized as a marker of the stress levels of humans due to the increase of its concentration in relation with the stress conditions. In these conditions, it is released by the hypothalamic-pituitary-adrenal axis (HPA) in response to stress events.2 Cortisol levels are not constant under normal conditions and are dependent on the person and the hours of the day.3 The physiological concentration of cortisol is regulated by the normal homeostasis; however, under stress conditions, its levels increase together with gluconeogenesis, lipolysis, and proteolysis, thus leading to the decrease of immunity.4 Cortisol can be found in many biological fluids, such as saliva,5 sweat, serum, plasma, urine, hair, and cerebrospinal fluid, as well as in hairs.6Table 1 summarizes the concentration ranges of cortisol in different human matrixes.| Matrix | Concentration | Ref. |
|---|---|---|
| Blood | 25 μg mL−1 (morning) | 7 |
| 0.1–3 ng mL−1 (evening) | 8 | |
| 2 μg mL−1 (night) | 8 | |
| Serum | 45–227 ng mL−1 (morning) | 9 |
| 17–141 ng mL−1 (evening) | ||
| Saliva | 0.1–12 ng mL−1 (morning) | 9 and 10 |
| 0.5–2 ng mL−1 (evening) | ||
| 2.2–4.1 ng mL−1 (night) | ||
| Sweat | 8–142 ng mL−1 | 10 |
| Hair | 18–153 pg mg−1 | 11 |
| Plasma | 40–250 pg mg−1 | 12 |
| Urine | 21–150 μg pe die | 10 |
Human blood contains a higher concentration of this hormone. However, obtaining a blood sample requires specialized medical staff for removal from the vein. Urine samples require 24 hours of collection. Thus, it is not practical during a common day. The sensing of cortisol sweat requires the use of epidermal adhesive devices that use natural pressures associated with perspiration. The main limitation is the amount of sweat produced under normal conditions (without physical effort). Saliva is thus a cheaper source of cortisol compared to these other bodily fluids due to its collection by simple practical kits (also known as “salivette”).
Different diseases are related to abnormal cortisol concentrations; chronic stress conditions lead to high cortisol concentrations (up to nine times higher than normal values).13 Examples of chronic stress conditions include depression,14 anxiety,15 osteoporosis,16 schizophrenia,17 cancer, diabetes, Cushing's, cardiovascular and autoimmune diseases.18–24 A worldwide increase of chronic stress over the last years was recently reported, probably due to the COVID-19 pandemic, leading to anxiety conditions.25
Cortisol analysis can be performed in the laboratory by analytical techniques, mainly based on mass spectrometry.26–28 Although these methods are highly selective and sensitive, they require specialized staff, expensive instruments and complicated protocols. The use of other easier methodologies, which are able to perform a facile cortisol analysis is strongly required, mainly for a continuous and self-use cortisol monitoring. In this context, optical sensors that are able to give a change of colour or emission in the presence of cortisol can be a practical alternative to the instrumental analysis, due to the fast response, easy analytical protocols and small size.
In general, a sensor able to detect an analyte by giving a change of color or emission is constituted by two main parts: (i) a recognition site that is able to recognize (more or less selectively) the target analyte, and (ii) a transductor moiety that is able to give an optical signal of the presence of the analyte. The recognition site can be “biological”, such as aptamers29,30 and antibodies,31 which show high affinity and selectivity for the selected analyte, or organic scaffolds that are able to interact with the analyte with covalent or non-covalent interactions.32
Molecular sensors
Detection of a target analyte by a molecular sensor is based mainly on two different approaches: covalent and supramolecular sensing, in which a functional group of the sensor molecule reacts with the analyte, leading to the formation of new covalent bond (Fig. 1a).33 This approach leads to a new molecule having different optical properties from the starting sensor. For this reason, it is detectable by the change of color or emission. This detection method is very sensitive. However, in many cases, it suffers from low selectivity (due to the presence of other analytes having similar reactivity to the selected one) and a slow response, depending on the kinetics of the chemical reaction involved.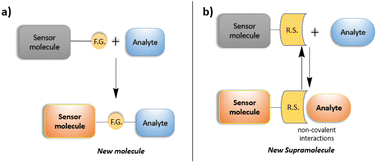 | ||
| Fig. 1 Schematic representation of the mechanism of action for (a) covalent and (b) supramolecular sensing. | ||
Otherwise, supramolecular sensing is based on the formation of one or more non-covalent interactions (i.e., hydrogen bonds, π–π, cation–π, ion–dipole, dipole–dipole interactions) between the sensor and analyte (Fig. 1b).34 This approach requires a specific design of the organic sensor. In particular, the recognition site must be carefully designed and synthetized. It should have a fast response due to the formation of instantaneous intermolecular interactions, and high selectivity due to the possibility of establishing multiple non-covalent interactions with the target analyte.35–40
Aptamer sensors
Aptamer sensors, which are also called aptasensors, consist of short single strand DNA or RNA having high affinity and selectivity for the target analytes. For these reasons, aptamers are used in many analytical fields, such as diagnosis, drug and blood analysis.41–45 The high affinity for the target analyte leads to high stability of the complex aptamer-analyte, low detection limits,46,47 and in some cases, the possibility of reusing the sensor.48 The development of the microfluidic devices allows for the integration of aptamers into a microfluidic chip, thus obtaining innovative sensor devices (lab-on-chip).49 These devices conveniently have small dimensions (e.g., few centimeters or less) and contain an injection sample, enabling the mixing of reactants, as well as transport and detection systems. Thus, these devices may be optimal for real practical applications.50 Aptamers are also used in strip tests, called Lateral Flow Assays, in which the liquid sample is transported by capillary.51Antibody sensors
Together with aptasensors, antibodies (immunosensors) can be classified as biosensors due to their non-synthetic nature. The interaction between an antibody and its target analyte (antigen) is extremely strong and selective.52,53 For this reason, antibody-based sensors have been applied in many research fields, such as the screening of many diseases and cancer, or the detection of food contamination.54,55 Immunosensors can be classified into two main groups: a label-free system and labeled antibodies. Sensing by the former is based on the detection of the interaction between the antigen and antibody, monitoring a change of a chemical–physical parameter. Meanwhile, sensing by the labeled antibody monitors the amount of label species.Many recently published reviews have focused on cortisol sensing by immunodetection,56 portable and wearable devices,57–61 electrochemical immunoassays,62,63 point-of-care systems,64,65 and nanomaterials.66
This review summarizes the recent advances on the sensing of cortisol by optical sensors based on molecular, aptamers and antibody receptors, highlighting the analytical parameters, such as limits of detection, linearity, selectivity, and focusing on the possibility of using these sensors in real life to control cortisol levels, thus monitoring the stress conditions.
Cortisol detection by chemical sensors
Tao and co-workers have reported on the detection of stress hormones in mammalian cells with bioluminescent systems.67 The method is cost-effective, non-immunological, non-isotopic and colorimetric. In particular, to sensitively detect low cortisol levels, single chain-based bioluminescent indicators were synthesized by including the recognition part of cortisol and the colorimetric transducer into one single molecule. The probe consists of a LXXLL coactivator motif ligand, which was linked with a GS linker to the ligand binding domain of the glucocorticoid receptor. The obtained fusion protein was then interposed between two fragments (N-termini and C-termini) of Gaussia luciferase (GLuc). The calibration curve showed a biphasic response of the probe to agonists, which is typical of the presence of a corepressor motif. This kind of curves evidences the existence of two equilibria involving GR LBD: one in the binding with the corepressor motif and the other in the interaction with the coactivator motif, suggesting a different behavior according to the different concentrations of agonist. The method plans to illuminate the cortisol activity with a bioluminescence strip. The determination of cortisol was also performed in urine samples, and further crosschecked with the classical ELISA. The main goals of this system are as follows: (i) high selectivity of the probe to cortisol, (ii) no interference by other agonists or steroids, (iii) a small quantity of the probe is required, (iv) the possibility to determinate the ligand activity on-site, (v) response to cortisol in 20 min (faster than ELISA, which needs 4 hours), (vi) mammalian cells containing bioluminescent probes can be used for the determination of cortisol in real samples.In their report, Khalil and co-workers described the development of a low cost, simple and accurate method for the qualitative and quantitative determination of cortisol in pharmaceuticals, urine and serum samples.68 This method uses a new synthesized photo probe (5-(p-ethoxy) benzoyl methyl-2-diazo-α-naphthol thiazol), which presents an emission band at 424 nm (λex 320 nm): it reveals the presence of different concentrations of cortisol in acetonitrile at pH 5.7 through the enhancement of the fluorescence intensity of the band. The probe was synthesized using β-(p-ethoxy)benzoylacrylic acid and thiourea; after a diazotization, a moiety of naphthol was added. The selectivity found for cortisol at the described conditions appears to be excellent. The authors critically investigated the impact of different parameters that could determine the enhancement of the fluorescence, such as solvent, pH, cortisol concentrations and foreign ion concentration. Moreover, the influence on the enhancement process due to other steroids and analogues of cortisol was minimized compared to other methods. This probe shows a limit of detection of 4.7 × 10⁻⁹ mol L−1 and a linear dynamic range of cortisol concentrations from 8.0 × 10⁻⁶ mol L−1 to 5.5 × 10⁻⁹ mol L−1.
Takeuchi and co-workers proposed molecularly imprinted polymer particles (MIP-NPs), prepared with cortisol-21-monomethacrylate (as template molecule), itaconic acid (as a functional monomer), styrene (as a comonomer) and divinylbenzene (as a crosslinker), put together through radical polymerization (Fig. 2).69 The MIP-NPs were used as probes in a nano-platform for the detection of cortisol based on fluorescence polarization, in competition with dansyl-labeled cortisol. The affinity for cortisol was proven to be improved by the presence of the template molecule containing cortisol, because NPs synthesized with only methacrylic acid exhibited a minor binding activity. Also, itaconic acid appeared to affect the formation of the initial complex between MIP-NPs and dansyl-cortisol, suggesting a cooperative work with the template molecule. The process of sensing is based on the competitive displacement of the dansyl-cortisol due to the concentration-dependent addition of cortisol. The binding process is followed by fluorescence polarization, and is transduced into a different fluorescence anisotropy of dansyl-cortisol, which switches to the free state once the complex with MIP-NPs breaks (Fig. 2). The detection limit achieved with the fluorescence polarization-based assay is about 80 nM; it also showed selectivity, which was proved by the binding differences found between cortisol and progesterone. Moreover, the proposed assays are cheaper and more versatile than other devices and sensor chips based on surface plasmon resonance (SPR) or quartz crystal microbalance (QCM).
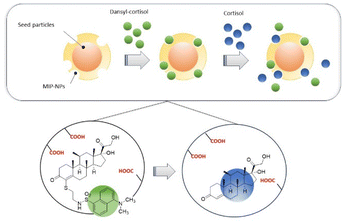 | ||
| Fig. 2 Schematic representation of the molecularly imprinted polymer particles (MIP-NPs). Adapted from ref. 68 with permission from The Royal Society of Chemistry, copyright 2016. | ||
Nau and co-workers reported on the use of cucurbit[n]urils (CBn) as receptors for steroidal compounds.70 The binding affinities between steroids and these hosts were estimated by isothermal titration calorimetry (ITC) and fluorescence displacement titrations. The selectivity was also examined through NMR, ITC, quantum chemical calculations and X-ray crystal diffraction, and a remarkable binding selectivity was found. Supramolecular complexes between CBn and steroids are stable in aqueous media, like blood serum, buffers, artificial gastric acid and water itself. The study was conducted with 21 representative steroids, like estranes, andostranes, and pregnanes (which have major binding affinities with CB8), and steroidal drugs, which have high binding affinities with both CB7 and CB8 (Fig. 3).
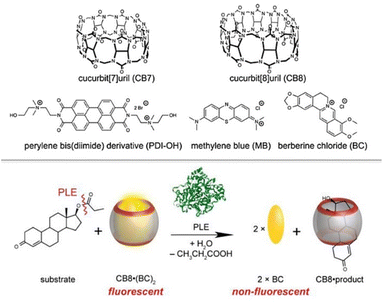 | ||
| Fig. 3 Cucurbit[n]urils (CBn) as receptors for steroidal compounds and the proposed displacement approach. Adapted from ref. 69 with permission from American Chemical Society, copyright 2016. | ||
The calculated binding constant value for the complex cortisol-CB8 is 4 × 10⁶ M−1. This study suggests that cucurbit[n]urils are promising candidates as chemosensors for steroidal compounds at micromolar concentrations for different applications: monitoring of enzymatic conversion with steroidal substrates, and the enhancement of solubility in water for steroids (relevant in drug delivery) through host–guest detection, which is helpful to improve the bioavailability of steroidal compounds or to eliminate steroid impurities. Steckl and Ray reported on the label-free detection of several key stress-related biomarkers (dopamine, norepinephrine, epinephrine, cortisol) in buffer solution and in different body fluids (sweat, plasma, urine, and saliva) using the precise optical absorbance of the biomarkers in the near-ultraviolet (UV) region (Fig. 4).71 While catecholamines display very similar absorption characteristics such as a major peak at λ1 = 204 nm and secondary peaks at λ2 = 217 and λ3 = 278 nm, cortisol exhibits a single dominant peak at ∼247 nm that is detectable down to ∼0.5 μg mL−1 (healthy physiological range 0.1–0.3 μg mL−1), and allows cortisol to be easily monitored and quantified, even in the presence of other catecholamines. Measurements of biomarkers in different biofluids were performed. The cortisol LOD in sweat by means of UV absorption is ∼0.2 μg mL−1 (0.5 μM), which fits the healthy physiological range (0.1–0.4 μg mL−1). Additionally, the authors designed and fabricated an optical sensor integrated onto a solid support that was based on UV absorption to detect biomarkers. Although serotonin and dopamine revealed a LOD of <1 μg mL−1, the authors are confident that a LOD improvement can be achieved by integrating optoelectronics components on this sensor.
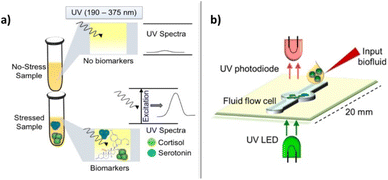 | ||
| Fig. 4 Optical absorption approach for label-free biomarker detection: (a) basic absorption function; (b) integration approach. Reproduced from ref. 70 with permission from American Chemical Society, copyright 2019. | ||
Mohammad-Andashti and co-workers developed a simple and eco-friendly method to produce highly luminescent MoS2 quantum dots (QDs) through microwave exfoliation of MoS2 powder (Fig. 5).72 They experimented with different solvents and microwave setups, finding that the best luminescent MoS2 QDs were obtained when the powder was dispersed in 1 M NaOH solution and exposed to 850 W microwave radiation in a closed microwave system at 30 bars for 30 minutes. Various microscopic and spectroscopic techniques were used to characterize the as-prepared MoS2 QDs, which exhibited maximum emission at 413 nm when excited at 310 nm. The quantum yield of the QDs was measured at 1.98%. The researchers also investigated the behavior of the MoS2 QDs in the presence of different metal ions. They found that Cu2+, Pb2+, Cd2+, Ag+, Fe3+, and Al3+ quenched the luminescence intensity of the MoS2 QDs. However, the luminescence of MoS2 QDs–Ag+ and Cu2+ mixtures could be recovered upon the addition of cortisol, with Cu2+ showing a higher emission recovery. The authors demonstrated the potential application of these MoS2 QDs in cortisol sensing in human saliva using an “off–on” response. They successfully established a linear calibration curve for cortisol in the range of 100 to 500 ng mL−1, with a low detection limit of 16 ng mL−1. Overall, the method proved effective for determining the cortisol levels in saliva.
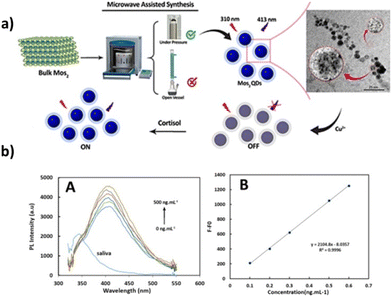 | ||
| Fig. 5 (a) Schematic representation of the production of highly luminescent MoS2 quantum dots (QDs) by microwave exfoliation of the MoS2 powder. (b) Fluorescence spectra of the MoS2 QDS–Cu2+ on cortisol addition in the range of 0–500 ng mL−1 (left), and calibration curve for cortisol (λex = 310 nm and λem = 413 nm) (right). Adapted from ref. 72 with permission from Elsevier, copyright 2022. | ||
Among several optical methods for cortisol detection, surface plasmon resonance (SPR) has gained great interest due to the notably low limits-of-detection (LOD) that have been achieved and reported in the literature.73,74 In particular, fiber optic (FO)-based SPR sensors have attracted even more attention due to the small-size, portability, lightweight sensing layout, remote sensing, high sensitivity and notable figure of merit (FOM).75
In order to enhance the sensitivity and the overall sensing performance, compared to the existing FOSPR sensors, several strategies are under evaluation. Among others, innovative 2D materials are emerging as a powerful component for a new generation of FOSPR sensors, with special focus on MXenes, 2D materials composed of a transition metal (M) and carbon or nitrogen, where “ene” is due to the similarity with graphene. In this context, Sharma, Marques et al. reported on a FOSPR sensor, bearing a chalcogenide core and either conventional 2D materials (MoS2, WS2, graphene) or MXenes (Ti3C2, Ti3C2O2, Ti3C2F2, Ti3C2(OH)2), for salivary cortisol detection.76 The performance of the sensors was simulated and analyzed at λ = 830 nm, using both angular and intensity interrogation mode (AIM, IIM), with a cortisol concentration range of 0.36–4.50 ng mL−1. Notably, the MXene-based sensors (in particular Ti3C2O2-based probe) can achieve a LOD as low as 15.7 fg mL−1.
Pandey and co-workers reported the detection of the salivary cortisol level, using fiber optic plasmonic sensors based on a grating structure of alternatively SiO2 or SiC, in combination with a thin Ag layer.77 The detection mechanism is based on the interaction between the cortisol present in the analyzed solution with the SiO2 or Sic grating/Ag layer system, measuring the variation of power loss (PL) spectra with the angle of incidence. Indeed, it has been demonstrated that the SPR sensing technique, performed using PL mode, facilitates an improvement of the overall sensing performance, expressed in terms of LOD and FOM.78 In detail, a six-layer probe was designed and developed as schematized below, comprising: (a) a Se95Te5Sm0.25 fiber core, (b) a clad dielectric layer made of perfluorinated homopolymer; (c) thin Ag layer; (d) SiO2 layer, (e) grating structure, SiO2 or SiC and (f) analyte layer. In order to obtain the maximum power loss response, low LOD and high FOM, the thickness of the Ag thin layer, as well as the grating SiO2 and SiC layers were accurately optimized by keeping the laser operating wavelength constant at λ = 830 nm. Remarkably, the sensor layouts based on the SiO2 and SiC grating layers provided LOD values of 9.9 pg mL−1 and 9.8 pg mL−1, respectively, by operating in angular interrogation mode (AIM). These values decrease when represented in intensity interrogation mode (IIM), namely by reporting the LOD of 22.6 fg mL−1 and 64.17 fg mL−1, respectively, for the SiO2 and SiC grating sensors. The SiO2 grated system displayed an average sensitivity and FOM value of 0.091° (ng mL−1)−1 and 0.705 (ng mL−1)−1, respectively, which are within a consistent range in terms of sensor performance. Due to the excellent results obtained, the ease of processability and the portability of the above-described sensing configuration, it represents a good candidate for the detection/monitoring of cortisol levels in aquaculture water, as well as wearable devices for cortisol monitoring in human sweat.
In 2021, Zhao et al. reported on a novel four-fold interpenetrated lanthanide-based metal–organic framework MHT-1, which showed a selective fluorescent response to cortisol with concentration values ranging from 10−9 M to 4 × 10⁻³ M in artificial human sweat (Fig. 6).79 Ln-MOFs have received growing attention because of their excellent optical properties (large Stokes’ shifts and high color purity) that can improve sensitivity, selectivity, and recyclability for luminescence detection.
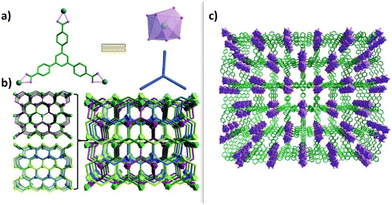 | ||
| Fig. 6 (a) The coordination environments of Eu3+ and H3BTB. (b) The topology structure of MHT-1 with a [2 + 2] mode. (c) The 3D four-fold interpenetrated framework of MHT-1. Reproduced from ref. 78 with permission from Royal Society of Chemistry, copyright 2019. | ||
The stability of MHT-1 was investigated using different methods, such as powder X-ray diffraction (PXRD), thermogravimetric analysis (TGA) and the solvent and pH stability. These results reveal the high thermal/solvent stability of MHT-1, which is stable until 460 °C or after immersion in different organic solvents (CH3OH, CH3CN, DMA, and dioxane). Moreover, the water and pH stability of MHT-1 was assessed after soaking MHT-1 in different aqueous solutions (pH values from 1 to 12) in order to mimic the sensing conditions in human sweat. The sensing of MHT-1 towards cortisol in water was explored by adding various cortisol solutions with concentrations ranging from 10−9 M to 4 × 10⁻³ M. The emission intensity of MHT-1 decreased progressively with the increasing concentration of cortisol (11.90% of the original intensity when the cortisol concentration reached 4 × 10⁻³ M), and the corresponding LOD for MHT-1 is 10−9 M, which is comparable to those of previously reported studies. The luminescence intensity of MHT-1 was tested for 20 cycles for cortisol detection without loss of sensitivity. In addition, since MHT-1 showed a good linear relationship between the luminescence intensity and cortisol concentration, an intelligent logic gate was proposed to achieve cortisol detection in human sweat with the naked eye, leading to a fast, simple and visual detection of cortisol.
Cortisol detection by aptamer-based sensors
In 2020, Cheng reported on a biosensor for the recognition of cortisol based on functionalized Quantum Dot (QD) probes (Fig. 7).80 The QD-based cortisol nanosensors are able to detect the cortisol concentration by following the target-induced fluorescence quenching without additional labeling. Cortisol selectivity was obtained by either the cortisol-selective aptamers or anti-cortisol antibodies bound on CdSe/ZnS core–shell QDs. Both type of QDs were carried by magnetic nanoparticles (MNPs) to give antibody–QD@MNP or aptamers–QD@MNP nanosensors. Moreover, two types of QDs were evaluated: red QDs (630 nm emission) and green QDs (540 nm emission). The aptamer-conjugated red QDs exhibited a larger fluorescence quenching than the aptamer-conjugated green QDs. This is probably ascribed to the larger surface of red QDs that increases the conjugation of aptamers.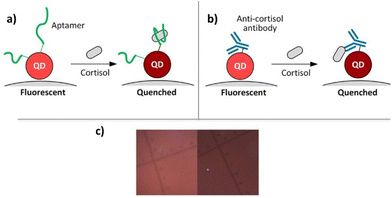 | ||
| Fig. 7 Schematics of cortisol detection by (a) aptamer-based, (b) antibody-based carbon dots, (c) real image. Reproduced from ref. 79 with permission from American Chemical Society, copyright 2020. | ||
Luminescent experiments were conducted with both nanosensors aptamer–QD@ MNP probes and antibody–QD@MNP probes by the addition of different cortisol concentrations (from 0.01 nM to 100 nM in PBS buffer), after 20 min of incubation time. A quenching of the fluorescence intensity is observed in response to different cortisol concentrations: a 35% signal decrease was found with aptamer-based nanosensors in a 100 nM cortisol solution, with a limit of detection of about 1 × 10⁻⁹ M. The antibody-based nanosensors presented 20% quenching efficiency with 100 nM cortisol solution, and a LOD of about 1 × 10⁻¹¹ M, lower than the one offered by the aptamer-based nanosensor. The presence of MNPs facilitates the sample preparation of saliva samples in the cortisol detection. The increase in the ionic strength of the rinsing buffer (PBS concentration from 0.5× to 2×) boosted the fluorescence quenching efficiency, with the final detection recovery rate growing from 42% to 96%.
Niu and coworkers compared two truncated aptamers, 40-mer 15-1a and 42-mer CSS.1, using isothermal titration calorimetry for the cortisol sensing.81 Only CSS.1 exhibited an interaction with cortisol, with a dissociation constant (Kd) of 245 nM. The authors explored label-free fluorescence and colorimetric detection methods for cortisol. Using SYBR Green I to stain the aptamers, CSS.1 showed a 53% saturated fluorescence enhancement. This assay revealed that CSS.1 binding was independent of Na+ and weakly dependent on Mg2+. A linear response has been found in the concentration range of 1–10 mM, with a detection limit of 742 nM. They also evaluated two mutants and three truncated aptamers of CSS.1. Furthermore, a colorimetric assay using gold nanoparticles (AuNPs) was tested for cortisol binding. Although a cortisol-dependent color change was observed, this assay was susceptible to interference from other molecules (like dopamine), which could cause AuNP aggregation. Interestingly, none of the assays showed cortisol binding with the truncated 15-1a aptamer. Therefore, the researchers concluded that 15-1a cannot bind to cortisol, suggesting the need for a more careful truncation study on the original aptamer.
A fascinating sensing device for cortisol in human sweat was reported by Weng, Jiang and co-workers.82 In this study, they developed a selective and sensitive point-of-care system composed of a 3D origami microfluidic device obtained by the combination of the cortisol-selective aptamer-based immunosensing, FRET mechanism mediated by MoS2 nanosheets, and smartphone detection method (Fig. 8). A four-layered 3D origami microfluidic chip was obtained by the screen-printing of hybrid paper, and it includes MoS2 nanosheets and a cortisol-selective aptamer, labeled with a fluorescent probe (6-FAM-aptamer). The sensing mechanism consists of the competitive interaction of MoS2 nanosheets and the cortisol analyte with the cortisol-selective aptamer. In the absence of the cortisol target analyte, MoS2 is non-covalently bound to the aptamer, quenching its fluorescence emission. When a small concentration of cortisol is present, the higher affinity of the aptamer leads to the cortisol-aptamer complex formation, the release of MoS2 and the restoration of the fluorescence emission. This last signal is detected by a smartphone that is placed in a proper dark chamber, and is able to process the data. The microfluidic sensor was tested towards artificial sweat, containing cortisol in the concentration range of 10–1000 ng mL−1, and towards real sweat collected by healthy patients. The results demonstrated remarkable sensitivity and specificity towards cortisol detection, displaying an LOD of 6.76 ng mL−1. Due to the encouraging results, the sensor was also tested under real conditions, by manufacturing a wearable patch that was able to linearly measure cortisol levels in real human sweat.
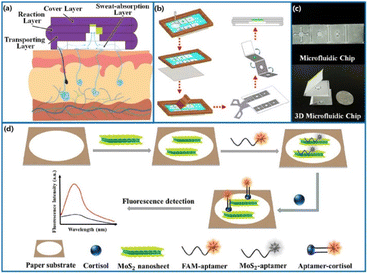 | ||
| Fig. 8 Schematic representation of the fabricated 3D origami microfluidic device (a) sweat channels, (b) 3D microfluidic origami chip, (c) four-layered microfluidic origami chip, (d) MoS2-mediated FRET device. Reproduced from ref. 81 with permission from American Chemical Society, copyright 2022. | ||
Zhang and co-workers developed a dual fluorescent homogeneous cortisol aptasensor based on the tandem hybridization chain reaction (HCR) amplification strategy.83 The system used split G-quadruplex (G4)/thioflavin T (ThT) complexes and dsDNA-templated copper nanoparticles (Cu NPs) as signal reporters (Fig. 9). When cortisol binds to its aptamer, it inhibits the triggering of HCRs between the aptamer and four hairpin structures (H1–H4), thereby preventing the generation of the dsDNA template and G4 structure. This interaction leads to a detectable change in the fluorescence signals. Under optimized conditions, the limit of detection for the G4/ThT complex is 3 fg mL−1, and for Cu NPs, it is 2.5 fg mL−1. The method showed a linear range of 1 fg mL−1 to 100 pg mL−1, indicating high specificity to various potential interfering substances. The researchers applied this method to determine cortisol levels in 54 clinical blood samples, and the results correlated well with those obtained by the electrochemiluminescence immunoassay (ECL-IA) kit and radiological findings. Using this approach, they were able to distinguish CS patients from healthy controls and other patients, achieving a 0.94 area under the receiver operating characteristic curve (AUC). The cortisol quantification method demonstrated 100% specificity and 83.3% sensitivity. This sensing strategy has shown significant potential as an additional diagnostic tool for cortisol-related disorders.
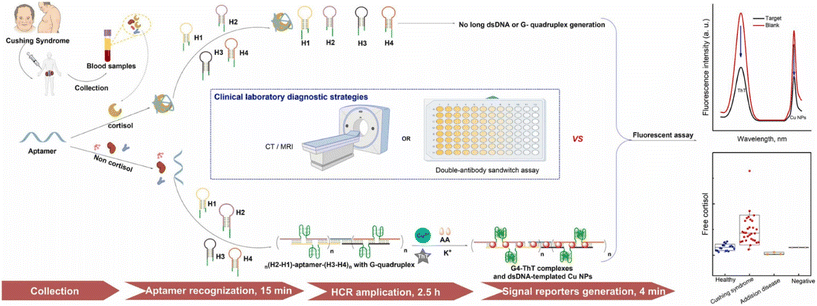 | ||
| Fig. 9 Dual fluorescence homogeneous cortisol aptasensor synthesis strategy based on the tandem hybridization chain reaction (HCR) amplification strategy. Reproduced from ref. 82 with permission from Elsevier, copyright 2023. | ||
Ding and co-workers prepared near-infrared carbon quantum dots (NIR-CQDs) using a simple one-step hydrothermal approach with reduced glutathione and formamide as raw materials.84 These NIR-CQDs were then utilized for the fluorescence sensing of cortisol. To achieve cortisol sensing, the researchers combined NIR-CQDs with an aptamer (Apt) and graphene oxide (GO). The NIR-CQDs-Apt complex was attached to the surface of GO through π–π stacking interactions, leading to a fluorescence “off” state due to an inner filter effect (IFE) between NIR-CQDs-Apt and GO (Fig. 10). However, in the presence of cortisol, the IFE process was disrupted, causing the NIR-CQDs-Apt fluorescence to turn “on”. This sensing approach demonstrated excellent selectivity for cortisol over other cortisol sensors. The sensor had a wide detection range, allowing the detection of cortisol concentrations from 0.4 to 500 nM, with a low detection limit of 0.13 nM. Importantly, this sensor was capable of detecting intracellular cortisol with excellent biocompatibility and cellular imaging capabilities, showing promise for biosensing applications. The study highlights the potential of NIR-CQDs-based sensors for the sensitive and selective detection of cortisol, offering possibilities for bioimaging and other biomedical applications.
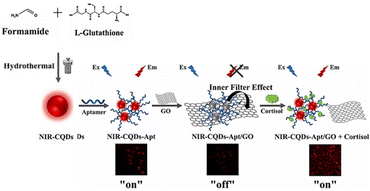 | ||
| Fig. 10 Hydrothermal approach to obtain near-infrared carbon quantum dots (NIR-CQDs) in one step with reduced glutathione and formamide as raw materials. Reproduced from ref. 83 with permission from Elsevier, copyright 2023. | ||
Bang and co-workers developed a wearable LSPR-based biosensor for the detection of cortisol in human sweat.85 This innovative flexible biosensor was fabricated by anchoring gold nanoparticles (Au-NPs) onto poly-dimethylsiloxane (PDMS), through 3-aminopropyltriethyloxysilane (APTES). Specifically, they selected PDMS as the substrate owing to its cost-effectiveness, biocompatibility and flexibility. Hence, after O2 plasma treatment, APTES was deposited onto the PDMS substrate. Subsequently, the strong affinity between AuNPs and the amine groups emerging from the APTES-modified PDMS was exploited to anchor the gold nanoparticles to the flexible substrate. Finally, using the great affinity between AuNPs and thiol groups, a 5′-thiol modified cortisol-selective aptamer was anchored to the surface of the LSPR biosensor. As a result, they obtained a flexible and wearable LSPR biosensor that was able to selectively detect cortisol in human sweat in the concentration range of 0.1–1000 nM, which is consistent with cortisol levels in human sweat. The efficiency was also tested under real conditions by placing the biosensor on the human epidermis, showing a limit of detection of 0.1 nM. The morphology and composition of the LSPR biosensor was studied by means of SEM images, EDX analysis, and FT-IR spectroscopy. In particular, the SEM images revealed a homogeneous distribution of the AuNPs on the APTES-modified PDMS substrate, showing an average diameter range of 86 ± 7 nm. Meanwhile, the EDX analysis and FT-IR spectroscopy data confirmed the composition of the biosensors. Detection measurements revealed a red-shift of the extinction peak of the LSPR biosensor after interaction with cortisol solution (1000 nM), which was due to the change of the refractive index of the metallic nanoparticles after the interaction with the analyte. In order to examine the sensitivity of the wearable LSPR biosensor, several cortisol solutions at a concentration range of 0.01–1000 nM were tested, observing a linearity in the change of the LSPR spectra. Finally, the biosensor was directly attached to the human epidermis (patch 1 × 1 cm2), measuring the cortisol level in healthy patients’ sweat during exercise. The UV-Vis absorption spectra of the extinction peaks shift, identifying the cortisol level, and further displaying great mechanical stability.
Cortisol detection by antibody-based sensors
Kobayashi and co-workers reported a sensitive immunoassay system based on Gaussia luciferase (GLuc) forming a fusion protein with artificial antibodies, wherein they realized a BL-ELISA (bioluminescent enzyme-linked immunosorbent assay) for the sensing of cortisol and cortisone.86 The genes that encode for the variable domains of a monoclonal antibody were duplicated and associated with encoding a variable fragment with a single chain (scFv). A wild-type Gaussia luciferase (wtGLuc) gene was linked to the single-chain variable fragment, and was expressed in different strains of Escherichia coli's periplasmatic space, where coelenterazine was used as a support to keep track of the GLuc activity. The linked final system (scFv-wtGLuc) was able to competitively stick cortisol bound in a conjugate with albumin, and subsequently exhibit batch-type luminescence. A dose–response plot was then obtained, which showed a detection limit of 0.25 pg per assay and a midpoint at 4.1 pg per assay. The main goals of this system are as follows: (i) stability for over a year, with storage at −30 °C as a periplasmatic extract; (ii) obtained concentration ranges were compatible with those of serum cortisol levels summed up with its metabolite cortisone; (iii) the sensitivity for cortisol was higher than other existing immunoassays; (iv) the experiment could be conducted without requiring special equipment.Besides its biomedical importance, the cortisol hormone is also considered a relevant biomarker in marine biology. For instance, it is considered a reliable stress indicator in the field of fish aquaculture.87 The detection of cortisol levels of fishes is extremely relevant, since it is related to several aspects of fish's well-being, such as the growth of the immune system, reproduction, and the quality of the water environment. It is possible to measure the cortisol level released by fishes directly in water instead of the traditional assessment in fish's blood. In this context, several conventional analytical techniques are employed. However, these are time-consuming procedures and require specialized operators. To overcome these drawbacks, portable devices that are able to detect cortisol in water in the useful range of concentration are highly desirable. In this context, Soares and co-workers selected the SPR detection technique as a rapid and accurate optical method.88 In particular, the fiber optic SPR facilitates higher flexibility, miniaturization, real-time monitoring and portability of the system. In light of this, the authors developed and characterized a fiber optic immunosensor in a D-shaped configuration, using a gold coating functionalized with anti-cortisol antibody. To this purpose, the silica optical fibers (SOF, with a typical size of 125 μm as diameter and ∼9 μm as core diameter) were coated with gold by sputtering (thickness 50 nm), and subsequently functionalized with anti-cortisol antibody. Specifically, the well-known physicochemical interactions between gold and thiol groups were exploited by using cysteamine as a linker. Afterwards, the amine groups and antibody were linked through EDC/NHS chemistry. The final Au-SOF sensor was placed in a proper PTFE support, as schematized below. Once the experimental conditions were set up, the Au-SOF sensor was firstly characterized with the surrounding refractive index (RI), using standard solutions of glucose at several concentrations and known RI, in order to study the spectral response upon RI changing. Subsequently, cortisol-containing solutions were analyzed in a concentration range of 0–100 ng mL−1, by measuring the spectral response to different concentrations, observing a limit of detection of 1.46 ng mL−1. Moreover, the sensor showed remarkable sensitivity towards cortisolb over other interferent analytes tested, such as cholesterol and glucose.
An innovative approach for cortisol monitoring using Surface Plasmon Resonance (SPR) and Plastic Optical Fibers (POF) technology based biosensing was reported in 2021 by Marques and co-workers.89 SPR is an optical sensing technique progressively exploited in biosensing because of its high sensitivity to the refractive index. In the last years, POFs have become particularly attractive due to their features, such as ease of handling, flexibility, and low-cost instrumentation. The combination of POFs biosensors and SPR has proven to be very useful for sensitivity enhancement. In the literature, different configurations have been considered, such as tapered and uncladded to mention a few. The uncladded POF samples were first coated with a AuPd alley, by means of the sputtering technique. Then, the samples were functionalized with cysteamine, exploiting the strong interaction of sulphur and gold. Finally, the anti-cortisol antibodies were covalently attached to yield the biosensor (Fig. 11).
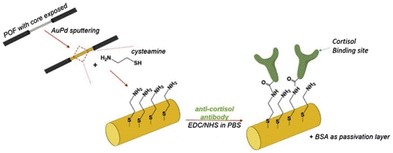 | ||
| Fig. 11 Preparation of the Optical fiber. Reproduced from ref. 88 with permission from Elsevier, copyright 2021. | ||
The biosensor was tested with different cortisol concentrations, ranging from 0.005 to 10 ng mL−1. A naked eye red shift suggests the high sensitivity of the sensor for this concentrations range, achieving a LOD of 1 pg mL−1. The resonance wavelength shift for this concentration range was found to be 14.9 nm, while the sensitivity was calculated to be 3.56 to 0.20 nm log(ng mL−1)−1. Lastly, as control tests for selectivity evaluation, a sensor functionalized with antibodies for human chorionic gonadotropin (anti-hCG antibodies) was used, resulting just in 1 nm variation of the resonance wavelength.
Naik and co-workers described a novel method for detecting and quantifying low molecular weight organic compounds like metabolites, drugs, additives, and organic pollutants.90 The method uses a competitive immunoassay with an ultrabright fluorescent nanolabel, called “plasmonic-fluor”, which consists of a polymer-coated gold nanorod and bovine serum albumin conjugated with molecular fluorophores and biotin. The plasmon-enhanced competitive assay allows for rapid detection within 20 minutes, and achieves over 30-fold lower limits of detection for cortisol compared to conventional competitive ELISA. By implementing the partition-free digital assay, the sensitivity is further improved. Moreover, the spatially multiplexed plasmon-enhanced competitive assay enables simultaneous detection of two analytes, cortisol, and fluorescein. This simple, rapid, and ultrasensitive method has broad applications in biomedical research, clinical diagnosis, food safety, and environmental monitoring, particularly for multiplexed detection of various small molecules in different settings.
Detection of cortisol in human serum is widely performed by using immunoassay-based methods associated with chemiluminescence, surface plasmon resonance or electrochemical techniques. However, for point-of-care applications, faster and easier readout strategies are required. To this purpose, a paper-based lateral flow immunoassay (LFIA) has been developed as a promising diagnostic tool.91 An interesting example was reported by Praphairaksit and co-workers.92 They used the competitive immunoassay approach, where the target analyte competes with a small amount of a similar labeled analyte, replacing it and producing a response. In order to increase the sensitivity of the classical LFIA systems, the authors manufactured a geometrical-modified device with a concave test line by using a very cheap method. In this device (called cLFIA), a cortisol-selective antibody is immobilized on the concave-shaped paper test line. The labeled analyte is represented by the complex cortisol-bovine serum albumin (BSA), conjugated with gold nanoparticles (AuNPs). In the absence of the target analyte, only the AuNPs/cortisol-BSA conjugate interacts with the test line, producing a clearly visible red spot. Conversely, when a small concentration of cortisol in the sample competes with AuNPs/cortisol-BSA for the antibody binding sites, this last one is replaced with a consequent decrease of red color. This innovative concave geometry promotes the binding between the antibody and the target analyte, enabling a reduction of the amount of employed antibody. Recognition studies were performed with standard solutions containing cortisol in the concentration range of 25, 50, and 75 ng mL−1. The limit of detection for cortisol was estimated to be 1.4 ng mL−1, which is consistent with sensing applications in human serum. A selectivity assessment was performed by testing the cLFIA device towards solutions containing other steroids, such as cortisone, corticosterone and progesterone, observing a remarkable selectivity towards the cortisol analyte. The system was demonstrated to be cheap and portable, and the response is really easy to read within 10 minutes. For these reasons, the cLFIA sensor was also tested for the detection of cortisol in certified human serum with good results.
Pompa and coworkers combined the plasmonic properties of gold nanospheres and nanostars to create an efficient paper-based immunosensor for the visual assessment of salivary cortisol.93 The dual-color system allowed for the easy and immediate evaluation of cortisol levels, indicated by a color change from blue to pink in the detection zone. Additionally, this approach demonstrated potential as a fast and portable monitoring system, capable of distinguishing different target concentrations (Fig. 12). In particular, three main color regions were identified, corresponding to three relevant ranges of salivary cortisol, i.e., physiological conditions, inflammatory stress response and pathological conditions, using a cut-off value of 10 ng mL−1 salivary concentration. Notably, analyses were performed by using a smartphone as detector. This work confirms the advantages of the two-color plasmonic system over traditional lateral competitive lateral flow immunoassays. The proposed mechanism showed potential applicability as a rapid and easy-to-use POC technology for non-invasive, naked-eye assessment of cortisol levels.
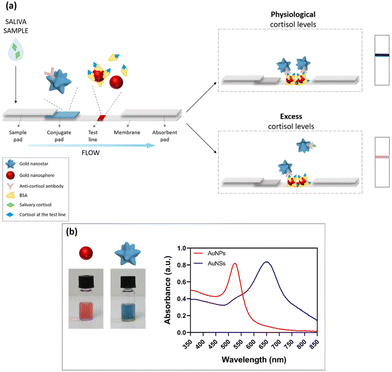 | ||
| Fig. 12 Design and working principle of the dual-color plasmonic LFIA device; (a) scheme of the proposed POC system, based on the combination of gold nanospheres (AuNPs) and nanostars (AuNSs); (b) the bottom panel displays the plasmonic properties of the two types of gold nanoparticles employed. Reproduced from ref. 92 with permission from Royal Society of Chemistry, copyright 2023. | ||
Table 2 summarizes the limit of detection, linearity range and interferent analytes of the sensors described in this review. In many cases, the limit of detections and linearity range are from femtograms to nanograms per mL. The selectivity (in terms of interferents used) was also evaluated.
| Reference | LOD | Linear range | Interferents used |
|---|---|---|---|
| J. Fluoresc., 2014, 24, 337–344 | 1.7 ng mL−1 | 2.9 × 10⁻⁶–1.9 × 10⁻⁹ g mL−1 | Steroids like (dexamethasone, prednisone, prednisolone, deoxycorticosterone, 11-dehydrocorticosterone, testosterone, androsterone, 17α-hydroxyprogesterone, aldosterone, 11-deoxycorticosterone, tetrahydrocorticosterone, acortolone, 3-cortol, 11-deoxycortisol, estrone, estradiol, estriol, and progesterone) |
| Anal. Chem., 2015, 87, 12387–12395 | 0.020 fmol per assay | — | — |
| J. Mater. Chem. B, 2016, 4, 1770–1777 | 30 ng mL−1 | 0.3 ng mL−1–36 μg mL−1 | progesterone |
| J. Am. Chem. Soc., 2016, 138, 13022–13029 | — | — | Testosterone, estradiol, 17α-ethinyl estradiol, cholesterol, pancuronium, vecuronium, nandrolone, cholic acid, corticosterone, spironolactone. |
| ACS Sens., 2019, 4, 1346–1357 | ∼200 ng mL−1 (in sweat) | 0–20 μg mL−1 | Dopamine, norepinephrine, epinephrine, serotonin. |
| Adv. Healthcare Mater., 2020, 9, 2000429 | μg mL−1 range (not stated) | 3.6–36 μg mL−1 | progesterone |
| Biotechnol. Rep., 2021, 29, e00587 | 1 pg mL−1 | 0.005–10 ng mL−1 | — |
| J. Mater. Chem. C, 2021, 9, 9643–9649 | — | 0.3 ng mL−1–1.4 mg mL−1 (in artificial human sweat) | Cations: (Na+, K+, Mg2+, Ca2+, Mn2+, Co2+, Ni2+, Zn2+, and Cd2+). Anions: (F−, Cl−, Br−, I−, HCO3−, and SO42−). Organic molecules: glucose, urea, and niacin. Amino acids: valine, isoleucine, leucine, alanine, threonine, glycine, and phenylalanine |
| Langmuir, 2020, 36, 7781–7788 | 0.4 ng mL−1 (aptamer-based) | 0.1–144 ng mL−1 | Dehydroepiandrosterone, estrone, cortisone, and progesterone |
| 36 ng mL−1 (antibody-based) | |||
| Materials, 2020, 13, 1623 | 9.9 pg mL−1 and 9.8 pg mL−1 (AIM) | — | — |
| 22.6 fg mL−1 and 68.17 fg mL−1 (IIM) | |||
| Optik, 2020, 218, 164891 | 15 fg mL−1 | 0.36–4.50 ng mL−1 | — |
| Anal. Chem., 2022, 94, 3526–3534 | 6.76 ng mL−1 (in artificial sweat) | 10–1000 ng mL−1 | glucose, uric acid, lactic acid, ascorbic acid, Na+, K+, and corticosterone |
| Anal. Lett., 2022, 55, 2517–2530 | 1.6 ng mL−1 | 5–5000 ng mL−1 | cortisone, corticosterone, and progesterone |
| Biomed. Opt. Express, 2022, 13, 1 | 1.46 ng mL−1 | 0.01–100 ng mL−1 | Glucose, cholesterol |
| Biosensors, 2023, 13, 184 | 36 pg mL−1 | 0.036–362 ng mL−1 | cortisone, corticosterone, progesterone, triamcinolone |
| Biosens. Bioelectron., 2022, 200, 113918 | 0.65 pg ml−1 | — | — |
| Colloids Surf., A, 2022, 647, 129048 | 16 ng mL−1 | 100–500 ng mL−1 | — |
| Microsyst. Nanoeng., 2023, 9, 36 | — | 36 ng mL−1–3.6 μg mL−1 | Artificial sweat: glucose, lactate, uric acid, magnesium chloride |
| Nanoscale Adv., 2023, 5, 329–336 | — | 0–50 ng mL−1 | — |
| Sens. Diagn., 2022, 1, 541–549 | 26 μg mL−1 | 3.6–36 μg mL−1 | Thymidine, β-estradiol, deoxycholic acid, dopamine |
| Sens. Actuators, B, 2023, 384, 133673 | 3 fg mL−1 | 1 fg mL−1–100 pg mL−1 | Epinephrine, norepinephrine, dopamine, progesterone, cortisone, testosterone, estradiol, aldosterone, dehydroepiandrosterone, melatonin, glucose, urea, creatinine, cholesterol, alanine, glycine, lysine, proline, valine, CaCl2, Mg(NO3)2 |
| Talanta, 2023, 260, 124637 | 47 pg mL−1 | 0.14–181 ng mL−1 | Estradiol, progesterone, testosterone, cholesterol, estrone, ascorbic acid, NaCl, KCl |
Conclusions and future perspectives
Real-time analysis of health conditions is a field that is in continuous improvement and increasing interest. In particular, the monitoring of some important analytes can give a fast diagnosis of the human status. Cortisol is a hormone strictly related to stress conditions, and its measurement can lead to a quantification of stress levels. Many analytical methods have been developed during the last years to measure cortisol levels in different human matrixes, such as blood, urine, sweat and saliva. This review summarizes sensing methods based on chemical, aptamer and antibody-based sensors, focusing on some important aspects, such as limit of detection, linearity and selectivity.A future goal is the realization of advanced wearable and implementable devices for the real-time measurements of cortisol levels in blood, sweat and saliva, with preference for the last two matrixes. However, due to the low concentration value of cortisol in these two fluids, one of the main problems to solve is improving the sensitivity, in order to also decrease the amount of sample required. In this context, the sensor technology has been improved. Many limitations are still present with the electronic part of these sensor.
In addition, some practical problems need to be solved: (1) the collection of some biological sample is not easy due to the rapid evaporation in normal conditions. Collection from saliva is probably easier, and leads to a small volume of liquid that is suitable for rapid analysis with common point-of-care devices. Furthermore, sweat and saliva are not constant throughout the day even in the same person. This is due to many factors, particularly diet and environment. Thus, the possibility to perform multiple analyses in one single day is challenging.
(2) The specific recognition site is a crucial part of a sensor device. The most common element used are enzymes, antibodies and antigens that have been isolated from living systems. For this reason, they suffer from some limits, such as the high cost and low stability (mainly after a long period of time from the manufacturing process). Thus, the possibility to develop new recognition sites, different from the biological one, can lead to more stable and cost-effectiveness devices. In addition, as reported in this review, sensing by biological recognition site shows high selectivity and specificity. For this reason, each individual device can detect one single analyte per time. The possibility to develop devices that are able to simultaneously detect multiple analytes is a huge target for the future. This goal can be achieved by the realization of a multi-sensor platform, also called an array, containing different non-specific chemical probes. The absence of specificity of the single probe guarantees the possibility to detect different analytes. The selectivity is guaranteed by the total response of all probes (in terms of color, emission or electrical change) elaborated by multivariate analysis. Furthermore, the recognition site can react with the analyte by two different pathways: a covalent or non-covalent reaction. The first one, exploited by the biological recognition site, is not suitable for a continuous monitoring of the important analytes/hormones, due to the irreversible chemical modification of the site. On the contrary, the non-covalent pathway leads to the formation of a reversible interaction between the recognition site and the analyte, thus leading to the possibility of restoring the starting sensor and performing a continuous monitoring of the human health.
(3) Size and thickness of the devices: the portability and wearability of these devices are crucial factors to obtain a practical diagnostic system. Dimensions that are a few millimeters in thickness and few centimeters in size are fundamental.
(4) Non-invasive analysis: the possibility to obtain human samples under non-stress conditions, as in the cases of blood or long-time sampling of urine, is useful for a daily monitoring of cortisol, also with a homemade kit.
Conflicts of interest
There are no conflicts to declare.Acknowledgements
The authors thank the University of Catania for financial support.References
- M. D. Taves, C. E. Gomez-Sanchez and K. K. Soma, Am. J. Physiol. Endocrinol. Metab., 2011, 301, E11–E24 CrossRef CAS PubMed.
- C. Tsigos and G. P. Chrousos, J. Psychosom. Res., 2002, 53, 865–887 CrossRef PubMed.
- N. A. S. Mohd Azmi, N. Juliana, S. Azmani, N. Mohd Effendy, I. F. Abu, N. I. Mohd Fahmi Teng and S. Das, Int. J. Environ. Res. Public Health, 2021, 18, 676 CrossRef PubMed.
- G. F. Grabner, H. Xie, M. Schweiger and R. Zechner, Nat. Metab., 2021, 3, 1445–1465 CrossRef CAS.
- E. Kaufman and I. B. Lamster, Crit. Rev. Oral Biol. Med., 2002, 13, 197–212 CrossRef.
- E. Russell, G. Koren, M. Rieder and S. Van Uum, Psychoneuroendocrinology, 2012, 37, 589–601 CrossRef CAS PubMed.
- A. Kaushik, A. Vasudev, S. K. Arya, S. K. Pasha and S. Bhansali, Biosens. Bioelectron., 2014, 53, 499–512 CrossRef CAS PubMed.
- F. Mastorci, A. Gemignani, P. Salvo and R. Fuoco, Microchem. J., 2018, 136, 177–184 CrossRef.
- N. Ljubijankic, R. Popovic-Javoric, S. Sceta, A. Sapcanin, I. Tahirovic and E. Sofic, J. Basic Med. Sci., 2008, 8, 110 CrossRef PubMed.
- S. Upasham, A. Tanak, B. Jagannath and S. Prasad, Sci. Rep., 2018, 8, 1–12 CAS.
- D. Gonzalez, D. Jacobsen, C. Ibar, C. Pavan, J. Monti, N. Fernandez Machulsky, A. Balbi, A. Fritzler, J. Jamardo and E. M. Repetto, Sci. Rep., 2019, 9, 1–6 CrossRef CAS.
- E. Tu, P. Pearlmutter, M. Tiangco, G. Derose, L. Begdache and A. Koh, ACS Omega, 2020, 5, 8211–8218 CrossRef CAS PubMed.
- M. Cay, C. Ucar, D. Senol, F. Cevirgen, D. Ozbag, Z. Altay and S. Yildiz, North. Clin Istanb., 2018, 5, 295–301 Search PubMed.
- H. M. Burke, M. C. Davis, C. Otte and D. C. Mohr, Psychoneuroendocrinology, 2005, 30, 846 CrossRef CAS PubMed.
- S. A. Vreeburg, F. G. Zitman, J. van Pelt, R. H. DeRijk, J. C. M. Verhagen, R. van Dyck, W. J. Hoogendijk, J. H. Smit and B. W. J. H. Penninx, Psychosom. Med., 2010, 72, 340 CrossRef CAS PubMed.
- B. M. K. Biller, V. Saxe, D. B. Herzog, D. I. Rosenthal, S. Holzman and A. Klibanski, J. Clin. Endocrinol. Metab., 1989, 68, 548 CrossRef CAS PubMed.
- F. Streit, A. Memic, L. Hasandedic, L. Rietschel, J. Frank, M. Lang, S. H. Witt, A. J. Forstner, F. Degenhardt, S. Wüst, M. M. Nothen, C. Kirschbaum, J. Strohmaier, L. Oruc and M. Rietschel, Psychoneuroendocrinology, 2016, 69, 26–34 CrossRef CAS PubMed.
- S. Yang, F. Dai, L. Lu, M. Yin, L. Xue, W. Feng, B. Li, J. Jiao and Q. Chen, Biosens. Bioelectron., 2022, 216, 114655 CrossRef CAS PubMed.
- N. Vogg, M. Kurlbaum, T. Deutschbein, B. Grasl, M. Fassnacht and M. Kroiss, Clin. Chem., 2021, 67, 998–1007 CrossRef PubMed.
- M. K. Kwok, I. Kawachi, D. Rehkopf and C. M. Schooling, BMC Med., 2020, 18, 363 CrossRef CAS PubMed.
- E. Montero-Lopez, A. Santos-Ruiz, R. Gonzalez, N. Navarrete-Navarrete, N. Ortego-Centeno, O. Martínez-Augustín, M. Rodríguez-Blazquez and M. I. Peralta-Ramírez, Stress, 2017, 20, 541–548 CrossRef CAS PubMed.
- S. E. Sephton, R. M. Sapolsky, H. C. Kraemer and D. Spiegel, J. Natl. Cancer Inst., 2000, 92, 994–1000 CrossRef CAS PubMed.
- S. E. Sephton, E. Lush, E. A. Dedert, A. R. Floyd, W. N. Rebholz, F. S. Dhabhar, D. Spiegel and P. Salmon, Brain, Behav., Immun., 2013, 30, S163–S170 CrossRef CAS PubMed.
- E. Iob and A. Steptoe, Curr. Cardiol. Rep., 2019, 21, 1–11 CrossRef PubMed.
- T. Qi, T. Hu, Q.-Q. Ge, X.-N. Zhou, J.-M. Li, C.-L. Jiang and W. Wang, BMC Psychiatry, 2021, 21, 1 CrossRef PubMed.
- S. K. Baid, N. Sinaii, M. Wade, D. Rubino and L. K. Nieman, J. Clin. Endocrinol. Metab., 2007, 92, 3102–3107 CrossRef CAS PubMed.
- R. Miller, F. Plessow, M. Rauh, M. Groschl and C. Kirschbaum, Psychoneuroendocrinology, 2013, 38, 50–57 CrossRef CAS PubMed.
- S. Lee, H.-S. Lim, H.-J. Shin, S.-A. Kim, J. Park, H.-C. Kim, H. Kim, H. J. Kim, Y.-T. Kim, K.-R. Lee and Y.-J. Kim, J. Anal. Methods Chem., 2014, 787483 Search PubMed.
- A. D. Ellington and J. W. Szostak, Nature, 1990, 346, 818–822 CrossRef CAS PubMed.
- T. Adachi and Y. Nakamura, Molecules, 2019, 24, 4229 CrossRef CAS PubMed.
- A. K. Trilling, J. Beekwilder and H. Zuilhof, Analyst, 2013, 138, 1619–1627 RSC.
- G. Trusso Sfrazzetto, C. Satriano, G. A. Tomaselli and E. Rizzarelli, Coord. Chem. Rev., 2016, 311, 125–167 CrossRef CAS.
- V. Kumar, H. Kim, B. Pandey, T. D. James, J. Yoon and E. V. Anslyn, Chem. Soc. Rev., 2023, 52, 663–704 RSC.
- E. Butera, A. Zammataro, A. Pappalardo and G. Trusso Sfrazzetto, ChemPlusChem, 2021, 86, 681–695 CrossRef PubMed.
- G. Catania, N. Tuccitto, A. Pappalardo and G. Trusso Sfrazzetto, Chem. – Eur. J., 2021, 27, 13715–13718 CrossRef PubMed.
- N. Tuccitto, L. Spitaleri, G. Li Destri, A. Pappalardo, A. Gulino and G. Trusso Sfrazzetto, Molecules, 2020, 25, 5731 CrossRef CAS PubMed.
- N. Tuccitto, L. Riela, A. Zammataro, L. Spitaleri, G. Li Destri, G. Sfuncia, G. Nicotra, A. Pappalardo, G. Capizzi and G. Trusso Sfrazzetto, ACS Appl. Nano Mater., 2020, 3(8), 8182–8191 CrossRef CAS.
- L. Legnani, R. Puglisi, A. Pappalardo, M. A. Chiacchio and G. Trusso Sfrazzetto, Chem. Commun., 2020, 56, 539–542 RSC.
- R. Puglisi, A. Pappalardo, A. Gulino and G. Trusso Sfrazzetto, ACS Omega, 2019, 4, 7550–7555 CrossRef CAS.
- R. Puglisi, A. Pappalardo, A. Gulino and G. Trusso Sfrazzetto, Chem. Commun., 2018, 54, 11156–11159 RSC.
- H. Zahraee, Z. Khoshbin, M. Ramezani, M. Alibolandi, K. Abnous and S. M. Taghdisi, Spectrochim. Acta, Part A, 2023, 290, 122305 CrossRef CAS PubMed.
- Y.-F. Huang, D. Shangguan, H. Liu, J. A. Phillips, X. Zhang, Y. Chen and W. Tan, ChemBioChem, 2009, 10, 862–868 CrossRef CAS PubMed.
- Z. Khoshbin, H. Zahraee, M. Ramezani, M. Alibolandi, A. Verdian, K. Abnous and S. M. Taghdisi, Microchem. J., 2023, 193, 109002 CrossRef CAS.
- K. K. Leung, A. M. Downs, G. Ortega, M. Kurnik and K. W. Plaxco, ACS Sens., 2021, 6, 3340–3347 CrossRef CAS PubMed.
- Z. Khoshbin, E. Sameiyan, H. Zahraee, M. Ramezani, M. Alibolandi, K. Abnous and S. M. Taghdisi, Anal. Chim. Acta, 2023, 1270, 341478 CrossRef CAS PubMed.
- L. Zhou, L.-J. Ou, X. Chu, G.-L. Shen and R.-Q. Yu, Anal. Chem., 2007, 79, 7492–7500 CrossRef CAS PubMed.
- C. Ma, X. Sun, L. Kong, X. Wang, S. Zhou, X. Wei, D. Kirsanov, A. Legin, H. Wan and P. Wang, Anal. Methods, 2021, 13, 4345–4353 RSC.
- K. Urmann, J.-G. Walter, T. Scheper and E. Segal, Anal. Chem., 2015, 87, 1999–2006 CrossRef CAS PubMed.
- B. K. Gale, A. R. Jafek, C. J. Lambert, B. L. Goenner, H. Moghimifam, U. C. Nze and S. K. J. I. Kamarapu, Micromachines, 2020, 11, 220 CrossRef PubMed.
- H. Wang, Y. Liu, C. Liu, J. Huang, P. Yang and B. J. E. C. Liu, Electrochem. Commun., 2010, 12, 258–261 CrossRef CAS.
- M. Citartan and T.-H. J. T. Tang, Diagnostics, 2019, 199, 556–566 CAS.
- M. Aydin, E. B. Aydin and M. K. Sezgintürk, Adv. Clin. Chem., 2021, 102, 1–62 CAS.
- J. Leva-Bueno, S. A. Peyman and P. Millner, Med. Microbiol. Immunol., 2020, 209, 343–362 CrossRef CAS PubMed.
- Y. Qasim Almajidi, R. H. Althomali, K. Gandla, H. Uinarni, N. Sharma, B. M. Hussien, M. S. Alhassan, R. M. Romero-Parra and Y. S. Bisht, Microchem. J., 2023, 191, 108907 CrossRef.
- G. Duffy and E. Moore, Anal. Lett., 2017, 50, 1–32 CrossRef CAS.
- Y. Zhang, Q. Lai, W. Chen, C. Zhang, L. Mo and Z. Liu, Chemosensors, 2023, 11, 90 CrossRef CAS.
- J. Tu, R. M. Torrente-Rodriguez, M. Wang and W. Gao, Adv. Funct. Mater., 2020, 30, 1906713 CrossRef CAS.
- O. Parlak, Sens. Actuators Rep., 2021, 3, 100036 CrossRef.
- M. Mathew, S. Radhakrishnan, A. Vaidyanathan, B. Chakraborty and C. S. Rout, Anal. Bioanal. Chem., 2021, 413, 727–762 CrossRef CAS PubMed.
- S. Khumngern and I. Jeerapan, Anal. Bioanal. Chem., 2023, 415, 3863–3877 CrossRef CAS PubMed.
- J. Ok, S. Park, Y. H. Jung and T.-i. Kim, Adv. Mater., 2023, e2211595 Search PubMed.
- M. Zea, F. G. Bellagambi, H. Ben Halima, N. Zine, N. Jaffrezic-Renault, R. Villa R, G. Gabriel and A. Errachid, TrAC, Trends Anal. Chem., 2020, 132, 116058 CrossRef CAS.
- Q. Lyu, S. Gong, J. M. Dyson and W. Cheng, Curr. Anal. Chem., 2022, 18, 689–704 CrossRef CAS.
- A. Kaushik, A. Vasudev, S. K. Arya, S. K. Pasha and S. Bhansali, Biosens. Bioelectron., 2014, 53, 499–512 CrossRef CAS PubMed.
- C. Samson and A. Koh, Front. Bioeng. Biotechnol., 2020, 8, 1037 CrossRef PubMed.
- G. Trusso Sfrazzetto and R. Santonocito, Nanomaterials, 2022, 12, 3790 CrossRef CAS PubMed.
- S. B. Kim, M. Sato and H. Tao, Anal. Chem., 2009, 81, 3760–3768 CrossRef CAS PubMed.
- M. S. Attia, E. El-Swagy, A. O. Youssef, H. A. Hefny and M. H. Khalil, J. Fluoresc., 2014, 24, 337–344 CrossRef CAS PubMed.
- N. Murase, S. Taniguchi, E. Takano, Y. Kitayama and T. Takeuchi, J. Mater. Chem. B, 2016, 4, 1770–1777 RSC.
- A. I. Lazar, F. Biedermann, K. R. Mustafina, K. I. Assaf, A. Hennig and W. Nau, J. Am. Chem. Soc., 2016, 138, 13022–13029 CrossRef CAS PubMed.
- P. Ray and A. J. Steckl, ACS Sens., 2019, 4, 1346–1357 CrossRef CAS PubMed.
- P. Mohammad-Andashti, Z. Ramezani, V. Zare-Shahabadi and P. Torabi, Colloids Surf., A, 2022, 647, 129048 CrossRef CAS.
- X. Chen, L. Zhang and D. Cui, Micro–Nano Lett., 2016, 11, 20–23 CrossRef CAS.
- H. Jung, J. Jung, Y. H. Kim, D. Kwon, B. G. Kim, H. B. Na and H. H. Lee, Biochip J., 2018, 12, 249–256 CrossRef CAS.
- R. C. Stevens, S. D. Soelberg, S. Near and C. E. Furlong, Anal. Chem., 2008, 80, 6747–6751 CrossRef CAS PubMed.
- A. K. Sharma, B. Kaura and C. Marquesb, Optik, 2020, 218, 164891 CrossRef CAS.
- A. Kumar Pandey, A. K. Sharma and C. Marques, Materials, 2020, 13, 1623 CrossRef PubMed.
- L. Zeng, M. Chen, W. Yan, Z. Li and F. Yang, Opt. Commun., 2020, 457, 124641 CrossRef CAS.
- M.-H. Tang, Y. Shi, X.-L. Jiang, H. Xu, Y. Ma and B. Zhao, J. Mater. Chem. C, 2021, 9, 9643–9649 RSC.
- Y. Liu, B. Wu, E. K. Tanyi, S. Yeasmin and L.-J. Cheng, Langmuir, 2020, 36, 7781–7788 CrossRef CAS PubMed.
- C. Niu, Y. Ding, C. Zhang and J. Liu, Sens. Diagn., 2022, 1, 541–549 RSC.
- X. Weng, Z. Fu, C. Zhang, W. Jiang and H. Jiang, Anal. Chem., 2022, 94, 3526–3534 CrossRef CAS PubMed.
- X. Zeng, Y. Xiong, L. Yan, P. Jiang, X. Lv, J. Chen, J. Zhang and P. Chen, Sens. Actuators, B, 2023, 384, 133673 CrossRef CAS.
- J. Yang, H. Liu, Y. Huang, L. Li, X. Zhu and Y. Ding, Talanta, 2023, 260, 124637 CrossRef CAS PubMed.
- M. Nan, B. A. Darmawan, G. Go, S. Zheng, J. Lee, S. Kim, T. Lee, E. Choi, J.-O. Park and D. Bang, Biosensors, 2023, 13, 184 CrossRef CAS PubMed.
- H. Oyama, I. Morita, Y. Kiguchi, S. Miyake, A. Moriuchi, T. Akisada, T. Niwa and N. Kobayashi, Anal. Chem., 2015, 87, 12387–12395 CrossRef CAS PubMed.
- L. C. Silva, B. Lopes, M. J. Pontes, I. Blanquet, M. E. Segatto and C. Marques, Aquaculture, 2021, 530, 735931 CrossRef CAS.
- M. S. Soares, L. C. B. Silva, M. Vidal, M. Loyez, M. Facao, C. Caucheteur, M. E. V. Segatto, F. M. Costa, C. Leitao, S. O. Pereira, N. F. Santos and C. A. F. Marques, Biomed. Opt. Express, 2022, 13, 3259 CrossRef CAS PubMed.
- C. Leitão, A. Leal-Junior, A. R. Almeida, S. O. Pereira, F. M. Costa, J. L. Pinto and C. Marques, Biotechnol. Rep., 2021, 29, e00587 CrossRef PubMed.
- Z. Wang, Q. Zhou, A. Seth, S. Kolla, J. Luan, Q. Jiang, P. Rathi, P. Gupta, J. J. Morrissey, R. R. Naik and S. Singamaneni, Biosens. Bioelectron., 2022, 200, 113918 CrossRef CAS PubMed.
- S. A. Torralba, D. B. Ngo, C. Parolo, L. Hu, R. Alvarez-Diduk, J. F. Bergua, G. Rosati, W. Surareungchai and A. Merkoci, Biosens. Bioelectron., 2020, 168, 112559 CrossRef PubMed.
- T. Kosawatphat, A. Yakoha, S. Rengpipatc, N. Khongchareonporn, O. Chailapakul, S. Chaiyoa and N. Praphairaksit, Anal. Lett., 2022, 55, 2517–2530 CrossRef CAS.
- A. Scarsi, D. Pedone and P. P. Pompa, Nanoscale Adv., 2023, 5, 329–336 RSC.
| This journal is © The Royal Society of Chemistry 2024 |
