
Tunable Janus geometric morphology from aqueous two-phase systems on a superhydrophobic substrate†
Quanyong
Cheng
,
Jingyi
Chen
,
Yuhang
Song
,
Xiang
Yu
,
Chengshu
Guan
,
Chuchu
Wan
,
Xuemei
Tan
and
Caili
Huang
*
Key Lab of Materials Chemistry for Energy Conversion and Storage of Ministry of Education, School of Chemistry and Chemical Engineering, Huazhong University of Science and Technology (HUST), Wuhan, 430074, China. E-mail: cailihuang@hust.edu.cn
First published on 18th January 2023
Abstract
Janus particles have garnered extensive attention owing to their considerable potential in the field of material engineering applications. Their properties are determined on the basis of the asymmetric structure or morphology. However, precisely engineering the morphology of Janus particles remains a grand challenge since the conventional preparation methods usually contain complicated dynamic processes. Herein, we report a facile route, which is wholly dependent on the thermodynamic characteristics of solution, to finely manipulate the morphologies of aqueous Janus droplets on a superhydrophobic surface. These Janus droplets contain polyethylene glycol (PEG) and dextran (DEX), and their Janus structures are controlled by the phase separation of the two polymers in aqueous solution. This phase separation procedure greatly relies on the molecular weight (MW) and concentration of PEG and DEX. As such, we can easily customize the morphology of the resultant Janus structure, including the Janus balance and curvature of the convex and concave phase interface, by varying those component inputs. This facile approach provides fresh insights into the tunable geometric morphology of Janus particles and holds potential applications in the preparation of asymmetric materials, particularly in biological fields.
Introduction
Janus particles consist of two strictly separated sides with distinct physicochemical properties, which are determined by their morphology and composition of each side. They have been explored for numerous applications, such as the self-assembly of colloidal particles, stabilization of emulsions, display of optics and electronics, and diagnosis and treatment of diseases.1–4 Compared to the homogeneous particles, Janus particles not only break the symmetry, endowing the particles with geometric diversity, but also integrate various components together to perform more functions.5–11 Many kinds of techniques have been advanced to fabricate such asymmetric particles with various geometries, such as self-assembly, seed-mediated polymerization, selective surface modification, among others.12–17 However, these methods usually contain complicated dynamic procedures, making it difficult to precisely manipulate the morphology of the Janus particles.18–20 For example, the self-assembly of block copolymers enables us to obtain a number of Janus particles with diverse geometric appearances by varying the component inputs.21–23 The intermediates, i.e., micelles or multicompartment micelles, in this procedure are often non-uniform due to the dynamic competition between the micro-phase segregation driven by the incompatibility of the polymer blocks and the mixing of polymer chains due to entropy favoring. After the disassembly and crosslinking steps, polydisperse and heterogeneous Janus particles are generated. The seed-mediated polymerization strategy has also been widely used to produce polymeric Janus particles with various morphologies through two-step polymerization and dynamic rearrangement of the obtained polymers.24–26 Nevertheless, the spontaneous symmetry-breaking to form the Janus structure in this method is determined by an opposite dynamic process, i.e., segregation and mixing between the incompatible polymers, thus leading to the inaccuracy in controlling the morphology of the resultant Janus particles. Although the selective surface modification of particles provides another alternative to endow them with diverse Janus balances,27–30 the particles are usually consistently compartmentalized due to the continuous procedure of immobilization, masking and bare side depositing.Phase separation of an incompatible polymer blend pair in a confined solvent environment is an efficient technique to create polymeric Janus particles.31–34 Such process is wholly dependent on the thermodynamic characteristics of the system. However, little attention has been paid to the use of this facile method to construct the Janus particles or the precise manipulation of their morphologies. Herein, we utilized the phase separation of PEG and DEX in an aqueous droplet on a superhydrophobic surface, achieving a Janus structured droplet. Such separation of the mixed droplet occurs when concentrations of these two polymers exceed their thresholds, which makes the loss in enthalpy related with de-mixing become greater than the entropic production in the system,35–39 thereby generating a Janus droplet. The morphologies of the resultant Janus structure, including the interfacial geometry and Janus balance, are dependent on the thermodynamic characteristics of the above mixed droplet. The interfacial geometry, i.e., shape and curvature of the phase interfaces, is thus determined by the cohesion of water molecules and interaction between water molecules and polymer chains in the two separated phases, which can be manipulated by the concentration and MW of the two polymers. This all-aqueous phase separation system provides an easy and high-efficiency method to customize the Janus morphology, and holds great potential in other aqueous-based systems.
Results and discussion
Interactions between two incompatible polymers in their mixed aqueous solution can lead to the formation of two distinct thermodynamic phases that are both aqueous, but each predominantly harboring one of the polymer types—aqueous two-phase system (ATPS).40–43 The phase separation of such aqueous mixture is attributed to the high molecular weight of the polymers combined with the unfavorable interaction between their segments.44–46 To demonstrate this liquid–liquid phase separation visually, we mixed 10% w/w PEG 20k (20![[thin space (1/6-em)]](https://www.rsc.org/images/entities/char_2009.gif) 000 g mol−1) and 15% w/w DEX 450–650k (450000–650000 g mol−1) aqueous solutions at the volume ratio of 1:1 in a vial. Emulsions were observed after intensive mixing of this typical PEG/DEX ATPS (Fig. 1a). While resting to equilibrium, the emulsions gradually coalesced and finally displayed two separated liquid phases (lower density PEG-rich phase at top and higher density DEX-rich phase at bottom). It should be noted that the volume ratio of the two separated phases was incongruous in comparison with the initial mixing ratio (1:1). This is attributed to the re-solvation of these two polymers in aqueous solvent as a result of their discrepant dissolvability. Furthermore, the higher concentrations of PEG and DEX are the prerequisite for the larger enthalpic contribution than entropic gain during the de-mixing in the system. Therefore, the composition, interaction between the polymer pair, and the solvation of each polymer (the interaction between polymer chains and water) play a key role in tuning the thermodynamics of the PEG/DEX ATP, guiding the following morphology design of the Janus structure.
000 g mol−1) and 15% w/w DEX 450–650k (450000–650000 g mol−1) aqueous solutions at the volume ratio of 1:1 in a vial. Emulsions were observed after intensive mixing of this typical PEG/DEX ATPS (Fig. 1a). While resting to equilibrium, the emulsions gradually coalesced and finally displayed two separated liquid phases (lower density PEG-rich phase at top and higher density DEX-rich phase at bottom). It should be noted that the volume ratio of the two separated phases was incongruous in comparison with the initial mixing ratio (1:1). This is attributed to the re-solvation of these two polymers in aqueous solvent as a result of their discrepant dissolvability. Furthermore, the higher concentrations of PEG and DEX are the prerequisite for the larger enthalpic contribution than entropic gain during the de-mixing in the system. Therefore, the composition, interaction between the polymer pair, and the solvation of each polymer (the interaction between polymer chains and water) play a key role in tuning the thermodynamics of the PEG/DEX ATP, guiding the following morphology design of the Janus structure.
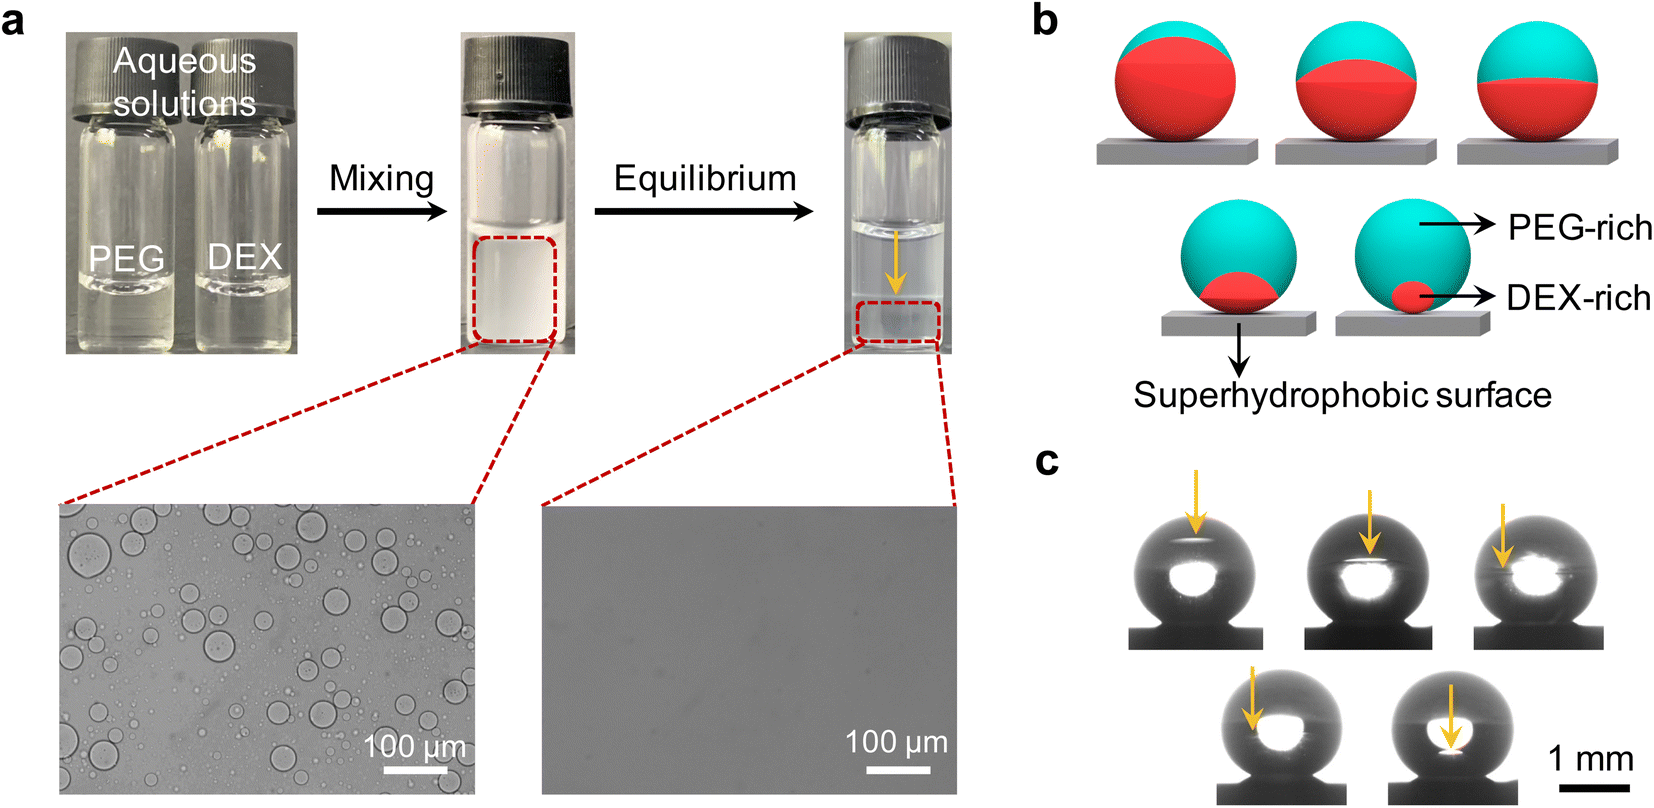 | ||
| Fig. 1 (a) Formation of the ATPS solution by 10% w/w PEG 20k and 15% w/w DEX 450–650k aqueous solutions with their mixing ratio of 1:1. (b) Schematic showing the ATPS Janus droplets with diverse morphologies composed of PEG-rich top phase and DEX-rich bottom phase. (c) Photographs of the Janus droplets with diverse morphologies prepared by mixing 10% w/w PEG 20k and 15% w/w DEX 450–650k aqueous droplets at different volume ratios on the superhydrophobic surfaces (resting for 5 min to equilibrium). The total volume of each mixed droplet was 5 μL. The yellow arrows direct the internal phase interfaces of the aqueous two-phase solution and Janus droplets. | ||
To utilize this PEG/DEX ATPS to construct the Janus structure and tune the morphology, a superhydrophobic surface was used to support ATPS droplets (contact angle > 150°) (Fig. 1b and c). To remove the effect of water evaporation on the liquid/liquid phase separation behavior of PEG and DEX, a humidity controller was used to ensure an unchangeable volume and contact angle of the obtained droplets over time (Fig. S1, see details in ESI†). Fig. 1c also shows us that different morphologies of these droplets can be achieved by varying the mixing ratio between 10% w/w PEG 20k and 15% w/w DEX 450–650k aqueous solution. This morphological diversity is derived from the concentration variation of PEG and DEX, which leads to the discrepancy of their proportions in separated phases due to the solvation and redistribution of these two polymers.
In addition to the concentration, the MW of the two polymers relates to their solvation in the aqueous mixture. To understand how the spatial structure of the resultant Janus droplet is influenced by those component inputs, we drew a phase diagram of PEG 20k and different MWs of DEX (40k, 100k and 450–650k) aqueous systems (see details in the drawing of the phase diagram part in ESI†). At low concentrations of the two polymers, their aqueous mixture forms a single phase (below the binodal curve), while at high concentrations, their mixture spontaneously phase-separates into the aqueous two-phase system (above the binodal curve) (Fig. 2a). This two-phase region allows us to design the Janus droplets, and is why we choose high concentrations of PEG (10% w/w) and DEX (15% w/w) aqueous solutions as a typical example to construct the Janus droplets in this work. In addition, decreasing the MW of DEX leads to the shift of the binodal curve to the high concentration region on this phase diagram. Such shift is attributed to a larger mixing entropy of lower MW DEXs having more molecules at the same concentration (i.e., PEG and DEX need more chains to generate the de-mixing enthalpy).
 | ||
| Fig. 2 (a) Phase diagram for the aqueous solution of PEG 20k and DEX (40k, 100k and 450–650k). (b) Images showing the Janus droplets (5 μL) prepared by merging 10% w/w PEG 20k with 15% w/w DEX (40k, 100k and 450–650k) aqueous droplets at different mixing ratios on the superhydrophobic surfaces, and resting for 5 min to equilibrium. The red dashed curves marked the phase interfaces between the two separated phases for better observation. (i) DEX 40k; (ii) DEX 100k; (iii) DEX 450–650k. (c) The volume ratio between the top and bottom phases, i.e., Janus balance, of the Janus droplets versus the mixing ratio of 10% w/w PEG and 15% w/w DEX aqueous solutions. (d) The interfacial curvature in the Janus droplets in (b) versus the mixing ratio of 10% w/w PEG and 15% w/w DEX aqueous solutions. | ||
Having quantified the thermodynamic profiles for the PEG and DEX aqueous mixtures, we then merged the two polymeric aqueous droplets on a superhydrophobic substrate to produce Janus droplets and established the role of component inputs, i.e., concentration and MW of the two polymers, on the Janus spatial structures. To simplify the preparation procedure, we mixed these two polymeric aqueous droplets with their volume ratios (VPEG:VDEX) varying as 1:9, 3:7, 5:5, 7:3, and 9:1 on the superhydrophobic surfaces and resting for 5 min to prepare Janus droplets (Fig. 2b and S2†). Upon phase separating of the mixed droplets, the concentrations of the two polymers in each phase can be calculated, which gives the corresponding Janus balance information of the resultant Janus droplets, according to the length ratio of each segment on tie lines from the phase diagrams (Fig. S3a, S4a and S5a†). For the Janus droplets prepared by PEG 20k and DEX 40k aqueous solutions, the Janus balances (Vtop:Vbottom) are 0 (the two polymers' concentrations located below the binodal curve on phase diagram), 3:4.1, 5:2.6, 7:1.4 and 9:0.5, respectively (Fig. 2c and S3†). Comparing the values between VPEG:VDEX and Vtop:Vbottom shows that the volume of the PEG-rich phase increases in comparison with its mixing state, demonstrating the more favorable interaction of PEG and water molecules. However, there is a special case for VPEG:VDEX = 1:9, since the point of the two polymers' concentration is located below the binodal curve. Replacing the above DEX 40k with DEX 100k or DEX 450–650k, the Janus balances of the corresponding Janus droplets are 1:11.4, 3:5.1, 5:3.3, 7:2.0, 9:0.7 or 1:11.6, 3:3.8, 5:4.2, 7:2.4, 9:1.1, respectively (Fig. 2c, S4b and S5b†), suggesting that raising the MW of DEX contributes to a lower Janus balance in the resultant Janus droplets. This trend can be attributed to the longer DEX chains having stronger interaction with water molecules or interacting with more water molecules during the phase separation. For the lowest mixing ratio of 1:9, it was found that it is between the binodal curves of PEG 20k/DEX 40k and PEG 20k/DEX 100k.
Apart from this Janus balance information of the resultant Janus droplets, another geometric morphology, i.e., interfacial curvature, varied with the concentration and MW of the two polymers accordingly. As shown in Fig. 2b(i) and d, there is a transition of the interface between the PEG-rich and DEX-rich phases from concave to convex shape (i.e., from −0.64 to 0.30 mm−1, here we defined the convex interface as the positive value, while the concave was defined as negative) when the mixing ratio of PEG and DEX droplets changed from 3:7 to 5:5. Such transition can be attributed to the reversion of the PEG-rich phase from minority to majority (3:4.1 to 5:2.6), and the minor phase tends to be spherical shape due to the cohesion of water molecules and the minimum rule of energy. Further increasing the mixing ratio to 7:3 and 9:1 leads to the reduction of the DEX-rich phase, resulting in the larger curvature of the interface (0.49 and 1.08 mm−1). On the other hand, increasing the MW of DEX from 40k to 100k, the transition of the concave to convex interfaces was also found between a mixing ratio of 3:7 and 5:5 (Fig. 2b(ii)). The curvature was also found to become larger (−0.32 and 0.32 mm−1), demonstrating that the interaction increase between water and DEX plays a dominant role in determining the interfacial shape when competing with the effect of volume increase of the DEX-rich phase. In this competition, the interaction increase between water and DEX will lead the interface to inflect inward the DEX-rich phase, while the volume increase of the DEX-rich phase will naturally promote the interface of the DEX-rich phase to develop outward. Furthermore, if a much higher MW of DEX was used (450–650k), the convex interface was found when the mixing ratio was 1:9 or 3:7 (Fig. 2b(iii)). Such reversion from concave to convex interface points to the water molecules adhering much stronger on the longer DEX chains. As a result, all values of interfacial curvature were found to increase to 0.68, 0.75, 0.43, 0.61 and 1.40 mm−1.
Establishing an association between the phase diagram and the geometric appearances, i.e., Janus balance and interfacial curvature, of the Janus structure would enable us to more precisely comprehend and manipulate the Janus droplet, which can be realized by converting the above mixing ratios into the two polymers' concentration as the initial state relating to the Janus morphology. To distinguish the Janus droplets formed by PEG 20k and different MWs of DEX, we separated the phase diagram in Fig. 2a into three individual ones and prolonged each of the respective binodal curve. Fig. 3a–c represent the Janus droplets composed of PEG 20k/DEX 40k, PEG 20k/DEX 100k and PEG 20k/DEX 450–650k, respectively. As such, we compartmentalized the aqueous two-phase region (above the binodal curve) on each phase diagram into three portions to illustrate the Janus morphology according to the polymers' concentrations based on the information from Fig. 2. As shown in Fig. 3a, the Janus droplet in region 1 features a PEG-rich top phase as the major phase (>70% v/v) envelopes the minor phase (DEX-rich phase) and an upward convex interface with the curvature > 0.49 mm−1. An approximate volume ratio between the two separated phases (40–70% v/v PEG-rich phase) and relatively low curvature (<0.49 mm−1, including approaching flat interface) are the characteristics of the Janus droplet in region 2. In contrast to the convex interface in regions 1 and 2, region 3 characterizes the Janus droplet with a concave interface (interfacial curvature > −2.04 mm−1), and a PEG-rich phase (<30% v/v) is suspended on top of the dominant DEX-rich phase, like a small ellipsoidal droplet suspended in the top of a large droplet. For the phase diagram formed by PEG 20k/DEX 100k aqueous solution, the binodal curve shifts to the bottom left region in comparison to that formed by PEG 20k/DEX 40k, providing a larger aqueous two-phase region that enables us to prepared the Janus droplet. The Janus droplet has similar morphology in each corresponding region on these two phase diagrams from the results in Fig. 2a and b. As shown in Fig. 3b, region 4 features a Janus droplet > 70% v/v PEG-rich phase and a convex interface with curvature value > 0.64 mm−1. The Janus droplet in region 5 has similar volume occupations of the two separated phases (40–70% v/v PEG-rich phase) and a convex interface with relatively low curvature (<0.64 mm−1). Region 6 has characterizations of <40% v/v PEG-rich phase and a concave interface with curvature value > −2.56 mm−1. The binodal curve further shifts to the bottom left region for the phase diagram of PEG 20k/DEX 450–650k aqueous solution, and the Janus droplet in the bottom right region (i.e., region 9) on this phase diagram has the opposite interfacial orientation in comparison to those corresponding regions (regions 3 and 6) on the phase diagrams formed by PEG 20k/DEX 40k and PEG 20k/DEX 100k (Fig. 3c). In region 7, the Janus droplet characterized by a PEG-rich top phase as the major phase (>60% v/v) wraps the minor phase (DEX-rich bottom phase), presenting a convex interface with curvature > 0.45 mm−1. The comparable volume proportions between the two separated phases (40–60% v/v PEG-rich phase) and a convex interface with relatively low curvature (<0.45 mm−1) are the characteristics of the Janus droplet in region 8. Region 9 features a Janus droplet with a crescent-shaped PEG-rich phase as a minor phase (<40% v/v) covered on the bottom of the major phase—a DEX-rich phase with interfacial curvature ranging from 0.45 to 0.94 mm−1. As such, the above information involving the relationships between the phase diagrams and Janus geometric morphologies enables us to customize Janus droplets.
 | ||
| Fig. 3 Dividing each phase diagram into three representative regions above the binodal curve to represent the resultant ATPS Janus droplets using accordingly simulated morphologies (inset pictures). These phase diagrams represent the Janus droplet formed by PEG 20k and DEX 40k aqueous solutions (a), PEG 20k and DEX 100k aqueous solutions (b), PEG 20k and DEX 450–650k aqueous solutions (c), respectively. | ||
Having investigated the Janus balance and interfacial curvature of the Janus droplets varying with the MW of DEX, we further altered the MW of PEG from 20k to 100k to explore the impact of this MW change on the Janus morphology. For the Janus droplet prepared by PEO 100k and DEX 450–650k aqueous solutions, it has a larger Janus balance in comparison to that fabricated by PEG 20k and DEX 450–650k at the same mixing ratio, showing that the longer PEO chains interact with more water molecules during the phase separation (Fig. 2c and 4a). In addition, there is a discrepancy in the interfacial shape of the Janus droplet, that is, a concave interface for PEO 100k/DEX 450–650k, while a convex shape for PEG 20k/DEX 450–650k is observed at the mixing ratios of 1:9 and 3:7 (Fig. 2b(iii), 4b and S6†). We attribute this result to the longer PEO chains having a stronger interaction with the water molecules, leading to a larger bending of the interface towards the PEO-rich phase than in toward the DEX-rich phase. Similar to the Janus droplet composed of PEG 20k and different MWs of DEX aqueous, the Janus balance and interfacial curvature increased with the mixing ratio and MW of DEX for the Janus droplet prepared by PEO 100k and different MWs of DEX aqueous solutions.
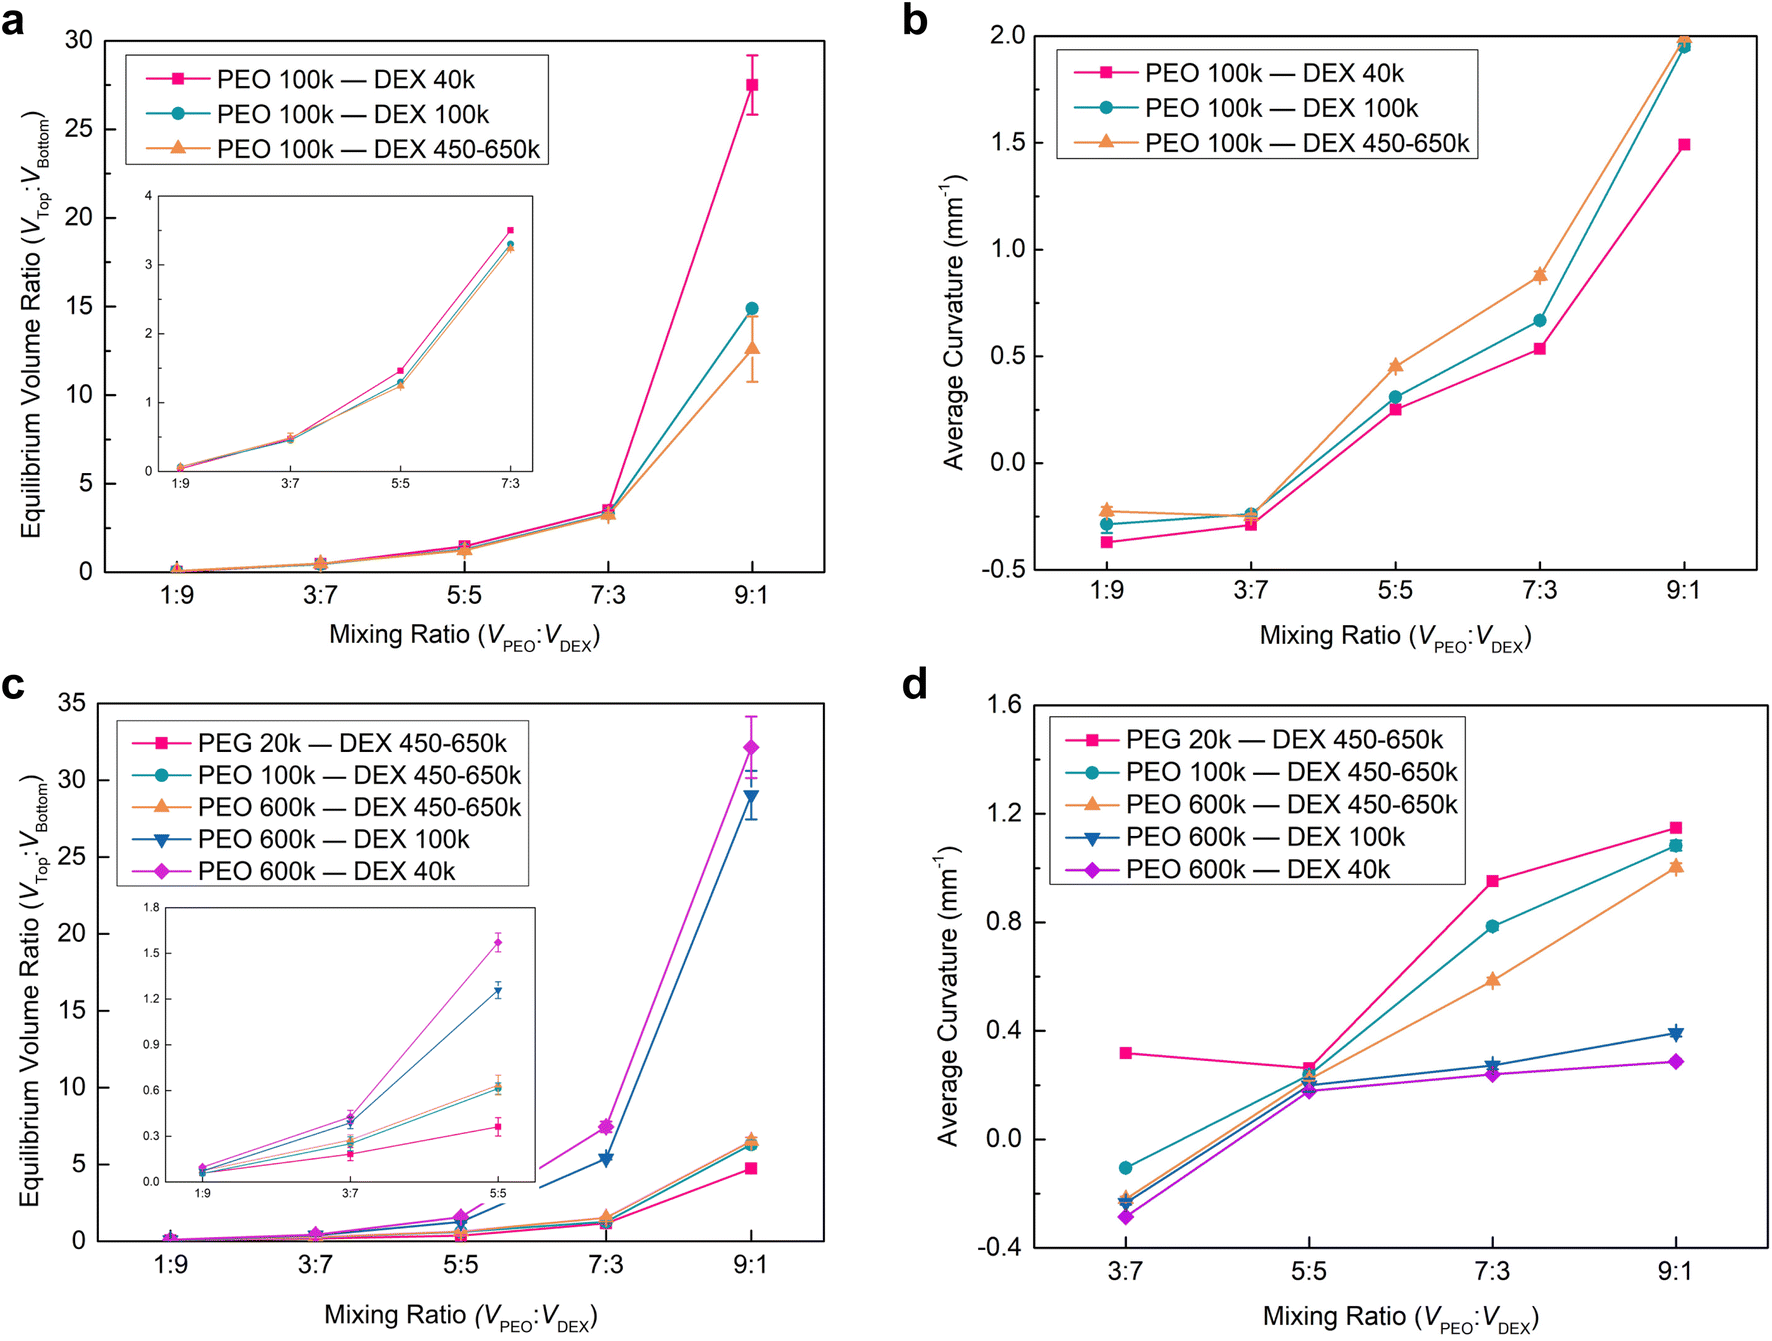 | ||
| Fig. 4 The volume ratio of the top and bottom phases and interfacial curvature in the Janus droplets versus the mixing ratio of 10% w/w PEO 100k and 15% w/w DEX (40k, 100k and 450–650k) (a and b), 5% w/w PEO (20k, 100k and 600k) and 15% w/w DEX 450–650k (c and d) aqueous solutions. | ||
To integrally explore the impact of MW and concentration of the two polymers on the Janus morphology, we altered the concentration of PEO to 5% w/w, and prepared the Janus droplets by separately mixing PEO 600k with DEX (40k, 100k and 450–650k) and PEO (20k, 100k and 600k) with DEX 450–650k aqueous solutions. It was found that phase separation occurred in the equilibrium solutions at the mixing ratio of 1:9 in the vials, while the phase interfaces were hardly observed in the corresponding droplets on the superhydrophobic surfaces (Fig. S7 and S8†). This likely arises from the relatively low concentration of PEO aqueous solution leading to the composition of the two polymers approaching the binodal curve on the phase diagram, and a small top phase in the Janus droplet at this mixing ratio, thereby making the phase interface extremely close to the top of the droplet and unable to be observed. For the resultant Janus droplets, we found that their Janus balance and interfacial curvature presented a similar variation with MW and concentration of the two polymers to those generated by 10% w/w PEO and 15% w/w DEX aqueous solutions (Fig. 2c, d and 4). The main discrepancy, therein, was that these Janus droplets had a lower Janus balance and interfacial curvature at the identical mixing ratio. As for an example of the Janus droplets composed of PEO 100k and DEX 450–650k at the volume ratio of 7:3, the Janus balance and interfacial curvature are respectively 7:5.5 and 0.76 mm−1 for the concentration of 5% w/w, while 7:1.6 and 0.88 mm−1 for 10% w/w. We attribute this variation to the low concentration of PEO decreasing the volume of the top phase. This decrease leads to a larger bending of the interface towards the PEO-rich phase due to the cohesion of water molecules and the minimum rule of energy.
Apart from the concentration and MW of the polymers, some other properties of the aqueous mixture, such as the acidity and alkalinity, may have an impact on the Janus morphology. To investigate these potential factors, we prepared different pH values (2–12) of ATPS solutions and Janus droplets by 10% w/w PEG 20k and 15% w/w DEX 450–650k aqueous solutions, and probed their Janus balance and interfacial curvature. The phase interface formed at a similar position in each obtained ATPS solution at the mixing ratio of 5:5, with the volume ratio values of the two separated phases (Vtop:Vbottom) at 1.3 to 1.4 (Fig. S9†). In addition, the resultant Janus droplets had similar geometric morphologies at the same mixing ratios despite the discrepancy in pH values (Fig. S10 and S11†), suggesting that the solution acidity and alkalinity had little influence on the phase separation behavior of the two polymers in their mixed droplets. This is likely attributed to the hydrogen and hydroxide ions having little impact on the cohesion of water molecules and interaction between the polymer chains and water molecules.
Conclusion
In conclusion, we have developed a facile phase separation method to control the geometric morphology of Janus droplets by leveraging ATPS on a superhydrophobic surface. This method was easily realized by adjusting the component inputs, i.e., concentration and MW of PEG and DEX, in an aqueous droplet. The geometric morphologies of the resultant Janus droplets, including the Janus balance and interfacial curvature, were well tailored by locating the composition point of these two polymers on the phase diagram. The shape of two separated phases in the Janus droplet was found to depend on the cohesion of water molecules and interaction between the polymer chains and water molecules relating to the polymers' concentration and MW. Increasing the MW or reducing the concentration of one polymer led to the interface inflecting towards this polymer-rich phase in the Janus droplets, and concave and convex interfaces were well manipulated by tuning these two parameters. As a simply aqueous-based phase separation method, we believe it can serve as an alternative candidate for customizing the Janus morphology by conventional techniques, and will find a broad range of applications.Author contributions
Quanyong Cheng performed the investigation, data collation, formal analysis and validation, and writing of the original draft. Jingyi Cheng, Yuhang Song, Xiang Yu, Chengshu Guan, Chuchu Wan, and Xuemei Tan provided valuable guidance and writing assistance. Caili Huang performed the conceptualization, writing – review and editing, supervision, and funding acquisition. All authors have given approval to the final version of the manuscript.Conflicts of interest
There are no conflicts to declare.Acknowledgements
This work was supported by the National Natural Science Foundation of China (No. 21903033, 22275063, and 52293474), the Fundamental Research Funds for the Central Universities (No. 5003013050), and start-up funds from the Huazhong University of Science and Technology.References
- P. G. Degennes, Science, 1992, 256, 495–497 CrossRef CAS PubMed.
- Z. Zhang, H. Li, X. Huang and D. Chen, ACS Macro Lett., 2017, 6, 580–585 CrossRef CAS PubMed.
- G. Singh, K. Arora, G. Singh, M. Kaur and T. S. Kang, J. Mater. Chem. A, 2019, 7, 5185–5189 RSC.
- L. Cheng, G. Zhang, L. Zhu, D. Chen and M. Jiang, Angew. Chem., Int. Ed., 2008, 47, 10171–10174 CrossRef CAS PubMed.
- Z. Gao, H. L. Ring, A. Sharma, B. Namsrai, N. Tran, E. B. Finger, M. Garwood, C. L. Haynes and J. C. Bischof, Adv. Sci., 2020, 7, 1901624 CrossRef CAS PubMed.
- J. Mosquera, Y. Zhao, H. J. Jang, N. Xie, C. Xu, N. A. Kotov and L. M. Liz-Marzán, Adv. Funct. Mater., 2020, 30, 1902082 CrossRef CAS.
- J. Song, X. Yang, O. Jacobson, L. Lin, P. Huang, G. Niu, Q. Ma and X. Chen, ACS Nano, 2015, 9, 9199–9209 CrossRef CAS PubMed.
- J. Du and R. K. O'Reilly, Chem. Soc. Rev., 2011, 40, 2402–2416 RSC.
- Z. Yu, C. Wang, L. Ling, L. Chen and S. Chen, Angew. Chem., Int. Ed., 2012, 51, 2375–2378 CrossRef CAS PubMed.
- G. Agrawal and R. Agrawal, ACS Appl. Nano Mater., 2019, 2, 1738–1757 CrossRef CAS.
- B. Yan, X. Zheng, P. Tang, H. Yang, J. He and S. Zhou, ACS Appl. Mater. Interfaces, 2018, 10, 36249–36258 CrossRef CAS PubMed.
- D. Pan, F. Mou, X. Li, Z. Deng, J. Sun, L. Xu and J. Guan, J. Mater. Chem. A, 2016, 4, 11768–11774 RSC.
- J. B. Kim, S. Y. Lee, N. G. Min, S. Y. Lee and S. H. Kim, Adv. Mater., 2020, 32, 2001384 CrossRef CAS PubMed.
- K. Cho, H. J. Lee, S. W. Han, J. H. Min, H. Park and W. G. Koh, Angew. Chem., Int. Ed., 2015, 54, 11511–11515 CrossRef CAS PubMed.
- Y. Zhao, H. Gu, Z. Xie, H. C. Shum, B. Wang and Z. Gu, J. Am. Chem. Soc., 2013, 135, 54–57 CrossRef CAS PubMed.
- Z. Luo and B. Liu, Angew. Chem., Int. Ed., 2018, 57, 4940–4945 CrossRef CAS PubMed.
- Y. Ning, C. Wang, T. Ngai and Z. Tong, Langmuir, 2013, 29, 5138–5144 CrossRef CAS PubMed.
- D. Dendukuri, D. C. Pregibon, J. Collins, T. A. Hatton and P. S. Doyle, Nat. Mater., 2006, 5, 365–369 CrossRef CAS PubMed.
- J. Qiu, Z. Chen, M. Chi and Y. Xia, Angew. Chem., Int. Ed., 2021, 60, 12980–12984 CrossRef CAS PubMed.
- F. Han, R. Wang, B. Chen, Yu. Feng, H. Liu, S. Wang, D. Su, H. Zhang and H. Chen, J. Am. Chem. Soc., 2020, 142, 15396–15402 CrossRef CAS PubMed.
- R. Deng, H. Li, T. Zhu, B. Li, F. Liang, F. Jia, Z. Qu and Z. Yang, Macromolecules, 2016, 49, 1362–1368 CrossRef CAS.
- A. H. Groschel, A. Walther, T. I. Lobling, J. Schmelz, A. Hanisch, H. Schmalz and A. H. Muller, J. Am. Chem. Soc., 2012, 134, 13850–13860 CrossRef PubMed.
- X. Hou, S. Guan, T. Qu, X. Wu, D. Wang, A. Chen and Z. Yang, ACS Macro Lett., 2018, 7, 1475–1479 CrossRef CAS PubMed.
- J. Fan, H. Liu, Y. Song, Z. Luo, Z. Lu and S. Wang, Macromolecules, 2018, 51, 1591–1597 CrossRef CAS.
- K. Sansanaphongpricha, M. C. DeSantis, H. Chen, W. Cheng, K. Sun, B. Wen and D. Sun, Small, 2016, 13, 1602569 CrossRef PubMed.
- J.-W. Kim, R. J. Larsen and D. A. Weitz, J. Am. Chem. Soc., 2006, 128, 14374–14377 CrossRef CAS PubMed.
- H. Huang, H. Liu, P. H. Hsu, C. S. Chiang, C. H. Tsai, H. S. Chi, S. Chen and Y. Chen, Adv. Mater., 2015, 27, 655–661 CrossRef CAS PubMed.
- Y. Liu, Z. Yang, X. Huang, G. Yu, S. Wang, Z. Zhou, Z. Shen, W. Fan, Y. Liu, M. Davisson, H. Kalish, G. Niu, Z. Nie and X. Chen, ACS Nano, 2018, 12, 8129–8137 CrossRef CAS PubMed.
- L. Cheng, X. W. Wang, F. Gong, T. Liu and Z. Liu, Adv. Mater., 2020, 32, 1902333 CrossRef CAS PubMed.
- C. Wei, Y. Du, Y. Liu, X. Lin, C. Zhang, J. N. Yao and Y. Zhao, J. Am. Chem. Soc., 2019, 141, 5116–5120 CrossRef CAS PubMed.
- H. Hu, L. Wu, Y. Tan, Q. Zhong, M. Chen, Y. Qiu, D. Yang, B. Sun, Q. Zhang and Y. Yin, J. Am. Chem. Soc., 2018, 140, 406–412 CrossRef CAS PubMed.
- Y. Xia, X. Na, J. Wu and G. Ma, Adv. Mater., 2019, 31, 1801159 CrossRef PubMed.
- K. H. Ku, Y. Lee, G. Yi, S. Jang, B. V. K. J. Schmidt, K. Liao, D. Klinger, C. J. Hawker and B. J. Kim, Macromolecules, 2017, 50, 9276–9285 CrossRef CAS.
- T. Higuchi, A. Tajima, K. Motoyoshi, H. Yabu and M. Shimomura, Angew. Chem., Int. Ed., 2008, 47, 8044–8046 CrossRef CAS PubMed.
- Y. Chao and H. C. Shum, Chem. Soc. Rev., 2020, 49, 114–142 RSC.
- C. D. Keating, Acc. Chem. Res., 2012, 45, 2114–2124 CrossRef CAS PubMed.
- A. G. Teixeira, R. Agarwal, K. R. Ko, J. Grant-Burt, B. M. Leung and J. P. Frampton, Adv. Healthcare Mater., 2018, 7, 1701036 CrossRef PubMed.
- W. Guo, A. B. Kinghorn, Y. Zhang, Q. Li, A. D. Poonam, J. A. Tanner and H. C. Shum, Nat. Commun., 2021, 12, 3194 CrossRef CAS PubMed.
- C. D. Crowe and C. D. Keating, Interface Focus, 2018, 8, 20180032 CrossRef PubMed.
- M. Iqbal, Y. Tao, S. Xie, Y. Zhu, D. Chen, X. Wang, L. Huang, D. Peng, A. Sattar, M. A. B. Shabbir, H. I. Hussain, S. Ahmed and Z. Yuan, Biol. Proced. Online, 2016, 18, 18 CrossRef PubMed.
- M. T. Zafarani-Moattar, S. Hamzehzadeh and S. Nasiri, Biotechnol. Prog., 2012, 28, 146–156 CrossRef CAS PubMed.
- R. D. Field, M. A. Jakus, X. Chen, K. Human, X. Zhao, P. V. Chitnis and S. K. Sia, Angew. Chem., Int. Ed., 2022, 61, e202116515 CrossRef CAS PubMed.
- T. O. Merland, L. Waldmann, O. Guignard, M. C. Tatry, A. L. Wirotius, V. Lapeyre, P. Garrigue, T. Nicolai, L. Benyahia and V. Ravaine, J. Colloid Interface Sci., 2022, 608, 1191–1201 CrossRef CAS PubMed.
- G. Xie, P. Li, P. Y. Kim, P. Gu, B. A. Helms, P. D. Ashby, L. Jiang and T. P. Russell, Nat. Chem., 2022, 14, 208–217 CrossRef CAS PubMed.
- B. U. Moon, L. Clime, J. A. Hernandez-Castro, D. Brassard, C. Nassif, L. Malic and T. Veres, Langmuir, 2022, 38, 79–85 CrossRef CAS PubMed.
- R. Adkins, I. Kolvin, Z. You, S. Witthaus, M. C. Marchetti and Z. Dogic, Science, 2022, 377, 768–772 CrossRef CAS PubMed.
Footnote |
| † Electronic supplementary information (ESI) available. See DOI: https://doi.org/10.1039/d2ta09202f |
| This journal is © The Royal Society of Chemistry 2023 |