 Open Access Article
Crystalline restacking of 2D-materials from their nanosheets suspensions†
Lina
Cherni
a,
Karin
El Rifaii
 b,
Henricus H.
Wensink
 *b,
Sarah M.
Chevrier
 a,
Claire
Goldmann
 b,
Laurent J.
Michot
 c,
Patrick
Davidson
 *b and
Jean-Christophe P.
Gabriel
 *a
*a
aUniversité Paris-Saclay, CEA, CNRS, NIMBE-LICSEN, 91191 Gif-sur-Yvette, France. E-mail: Jean-Christophe.gabriel@cea.fr
bLaboratoire de Physique des Solides, Université Paris-Saclay, CNRS, 91405 Orsay, France. E-mail: rik.wensink@universite-paris-saclay.fr; patrick.davidson@universite-paris-saclay.fr
cLaboratory of Physical Chemistry of Electrolytes and Interfacial Nanosystems (PHENIX), Sorbonne Université, CNRS, 75005 Paris, France
First published on 6th November 2023
Abstract
We report here the highly ordered restacking of the layered phosphatoantimonic dielectric materials H3(1−x)M3xSb3P2O14, (where M = Li, Na, K, Rb, Cs and 0 ≤ x ≤ 1), from their nanosheets dispersed in colloidal suspension, induced by a simple pH change using alkaline bases. H3Sb3P2O14 aqueous suspensions are some of the rare examples of colloidal suspensions based on 2D materials exhibiting a lamellar liquid crystalline phase. Because the lamellar period can reach several hundred nanometers, the suspensions show vivid structural colors and because these colors are sensitive to various chemicals, the suspensions can be used as sensors. The structures of the lamellar liquid crystalline phase and the restacked phase have been studied by X-ray scattering (small and wide angle), which has followed the dependence of the lamellar/restacked phase equilibrium on the cation exchange rate, x. The X-ray diffraction pattern of the restacked phase is almost identical to that of the M3Sb3P2O14 crystalline phase, showing that the restacking is highly accurate and avoids the turbostratic disorder of the nanosheets classically observed in nanosheet stacking of other 2D materials. Strikingly, the restacking process exhibits features highly reminiscent of a first-order phase transition, with the existence of a phase coexistence region where both ∼1 nm (interlayer spacing of the restacked phase) and ∼120 nm lamellar periods can be observed simultaneously. Furthermore, this first-order phase transition is well described theoretically by incorporating a Lennard-Jones-type lamellar interaction potential into an entropy-based statistical physics model of the lamellar phase of nanosheets. Our work shows that the precise cation exchange produced at room temperature by a classical neutralization reaction using alkaline bases leads to a crystal-like restacking of the exfoliated free Sb3P2O143− nanosheets from suspension, avoiding the turbostratic disorder typical of van der Waals 2D materials, which is detrimental to the controlled deposition of nanosheets into complex integrated electronic, spintronic, photonic or quantum structures.
Introduction
Although a few 2D materials have been used by humankind for millennia, such as clays or graphitic materials (charcoal), they have attracted renewed interest following their integration, one layer by layer, into complex nanoelectronic devices.1 In addition, few-layer films of nanosheets are promising for their barrier properties or their integration into filtration membranes.2–7 A key feature to enable such developments lies in the deposition of different nanosheets with different physical properties (conductivity, magnetism, porosity, etc.), in the correct order and relative orientations.8–10 Indeed, it has been shown that these materials tend to stack in a disordered, turbostratic fashion, which can lead to great variability in the electronic behavior of the device.11 It is therefore paramount to develop a set of deposition methods that are robust to such disorder.We therefore report here our investigations into this issue by studying the restacking of the dielectric 2D material M3Sb3P2O14 (hereafter called M3) (M = H, Li, Na, K, Rb, Cs), a well-defined model system of low-dimensional compounds.12,13 Furthermore, this material has been shown to readily exfoliate in water, resulting in colloidal suspensions of individual nanosheets that exhibit a lamellar liquid crystalline phase at very low mass fractions (≈1 w/w%) and a rare example of a lamellar material that diffracts visible light.14,15 As a result, aqueous suspensions of H3Sb3P2O14 (H3) have structural colors that vary from blue to red depending on concentration and chemical or physical stress,16 which also makes this material a good candidate for photonic and sensing applications.17,18 Therefore, we report the observation, in natural and polarized light, of the aspect of lamellar liquid crystalline phases in different systems when varying the cation exchange rate (x) and the alkaline metal M. We then present our X-ray scattering study of the structural evolution of the nanosheet suspensions and their restacking. Finally, we discuss and theoretically model the transition from the exfoliated to the restacked state from a thermodynamic point of view.
Experimental results and discussion
The fact that the K3Sb3P2O14 crystalline phase does not spontaneously exfoliate in aqueous suspension, in contrast to its acidic H3Sb3P2O14 parent phase is somewhat puzzling. This prompted us to study the precipitation of suspensions of single nanosheets by monitoring the effects of a gradual cation exchange of H+ by K+, and, by extension, by other alkaline cations, (M = Li, Na, K, Rb, Cs), to give [H3(1−x)M3x]Sb3P2O14, hereafter referred to as H3(1−x)M3x. The cation exchange was carried out by an acido-basic neutralization reaction with the corresponding alkaline bases (MOH) according to eqn (1):| H3Sb3P2O14 + 3xMOH → H3(1−x)M3xSb3P2O14 + 3xH2O | (1) |
H3Sb3P2O14 titrations with MOH solutions
The pH titration curves versus the number of moles of alkaline base added are shown in Fig. 1. With the exception of LiOH, all the curves are similar in shape, with only a single inflection point corresponding to a complete exchange of H+ ions for alkaline cations, as expected for the titration of a strong acid with a strong base. In contrast to the other bases, the titration curve with LiOH shows two inflection points. This acid–base behavior has already been briefly described.13,19 Only in this case does H3Sb3P2O14 behave like a multi-acid with two different pKa values of pKa1 = 2.8 and pKa3 = 7.1. As a first approach, it can be assumed by analogy that this is related to the presence of two partially occupied crystallographic sites for the alkali metal cations in the K3Sb3P2O14 structure.12 This interesting behavior requires an extensive study, by solid state Magic Angle Spinning NMR, which goes beyond the scope of the present article.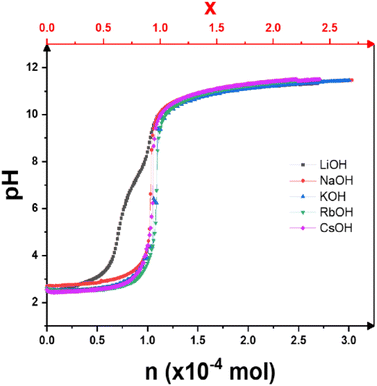 | ||
| Fig. 1 Potentiometric titration curves of H3Sb3P2O14 dispersions with different alkaline base solutions: LiOH, NaOH, KOH, RbOH, and CsOH. x (top axis) is the theoretical exchange rate. | ||
Visual observation of H3(1−x)M3x samples
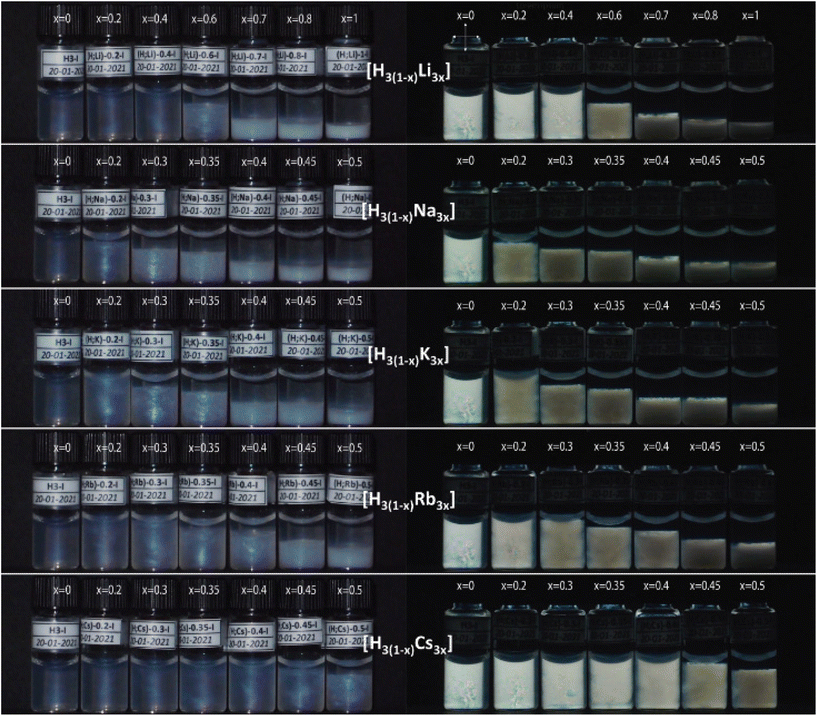
The exchange of protons with alkaline cations has a remarkable influence on the colloidal stability of [Sb3P2O143−] nanosheets, as shown in Fig. 2. Indeed, the blue structural color exhibited by most of the samples suggests the presence of a liquid-crystalline lamellar phase with a period (≈120 nm) that does not depend much on either x or the nature of M+. Moreover, above a critical value of x, which depends on the nature of the M+ cation, a white precipitate starts to appear. Furthermore, the volume of the precipitate increases with an increase of x.In addition, the observation of all samples between crossed polarizers (Fig. 2) revealed that the birefringence typical of the lamellar phase gradually disappears with increasing exchange rate for the different H3(1−x)M3x systems. However, a small amount of lamellar phase may persist up to high values of x as a thin birefringent layer localized between the precipitate and the upper isotropic phase.
For the H3(1−x)Li3x system, at x = 1, a single white precipitate phase is found at the bottom of the tube, coexisting with a very dilute isotropic suspension of nanosheets at the top. This indicates that the exchange of H+ cations by Li+ is complete and that the phase at the bottom of the tube corresponds to the water-insoluble solid Li3Sb3P2O14. The precipitate begins to appear at x ≈ 0.6, as the liquid-crystalline lamellar phase begins to disappear.
For the other H3(1−x)M3x systems, with M = Na, K, and Rb, the values at which the precipitate appeared were lower, at x ≈ 0.2, but this was associated with the observation of a wider range of x values in which both the lamellar phase and the precipitate coexisted. Finally, for the H3(1−x)Cs3x system, the precipitation did not start until x = 0.5 (the maximum x value studied in this study), at which point the lamellar phase, with its blue characteristic color, could still be observed.
X-ray scattering experiments (SAXS & WAXS)
In order to confirm our phase identification, the samples were further studied by SAXS and WAXS. The SAXS data provides information on the organization of the particles over large scales (up to a few 100 nm) whereas the WAXS data can be used to determine the crystalline structure of the precipitate (at ≈1 nm scale and below). Hereafter, only the results for the H3(1−x)K3x system are discussed in the main text as they are fairly representative of the other systems (data for the other systems are presented in ESI†). The initial liquid-crystalline lamellar phase H3Sb3P2O14 (x = 0) shows equidistant diffraction peaks in the SAXS patterns (Fig. 3, left). The peaks shift slightly to lower q values upon increasing exchange rate (for x between 0 and 0.4), suggesting a slight increase of the lamellar period. Starting from x = 0.45, the intensities of the diffraction peaks become weaker until they almost disappear at x = 0.5.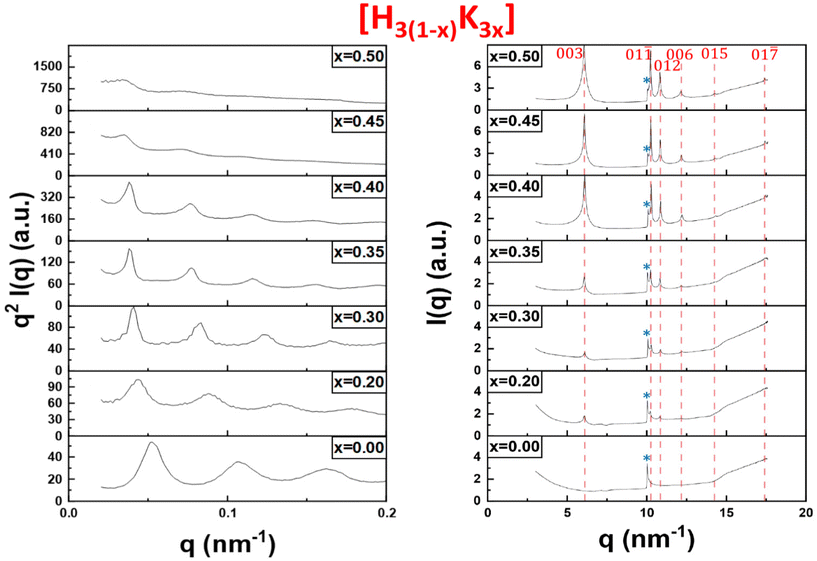 | ||
| Fig. 3 SAXS (left) and WAXS (right) patterns of the bottom phase of the H3(1−x)K3x samples shown in Fig. 2. The peaks related to the K3Sb3P2O14 crystalline phase are shown with red dashed lines. The peak tagged with a star (*) is the signature of the lamellar phase in WAXS patterns. | ||
In the WAXS patterns (Fig. 3, right), very sharp diffraction peaks start to appear at x = 0.2 and become more and more intense upon increasing x values. All the peaks present in the WAXS patterns have been identified as they actually correspond to the diffraction peaks of the crystalline K3Sb3P2O14. 1.32H2O powder observed long ago during the determination of its crystallographic structure.12,20 Therefore, quite surprisingly, the white precipitate observed in Fig. 2 at high values of x is simply made of K3Sb3P2O14 hydrated crystallites and the flocculation of the colloidal suspension leads to a highly organized state of the nanosheets.
The WAXS patterns also display an additional peak at q = 10 nm−1 that is present for all values of x. This peak, which is strongest for x = 0 (i.e. in the pure liquid-crystalline lamellar phase), represents the first (and strongest) reflection arising from the 2-dimensional crystalline order of each individual nanosheet. It is therefore the signature in WAXS of the lamellar mesophase. Its intensity decreases with increasing x that is with increasing proportion of the crystalline precipitate. Altogether, the X-ray scattering data therefore confirm the visual observations described above.
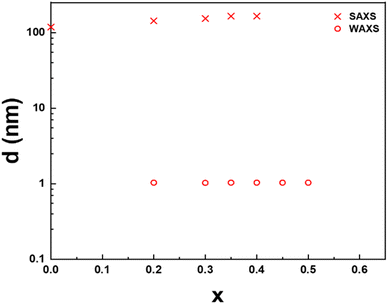
The lamellar period, d, of the mesophase is related to the position of the first-order diffraction peak in SAXS by Bragg's law, d = 2π/q. Similarly, the stacking period of the nanosheets in the crystalline precipitate is also directly obtained by the position of the (003) reflection in WAXS since there are three nanosheets per crystal cell along the c-axis. The dependence of these periods on the cation exchange rate, x, for both phases of the H3Sb3P2O14 system, is presented in Fig. 4. For x ≤ 0.4, the lamellar period increases from 119 nm at x = 0 to 165 nm at x = 0.4, which is consistent with the color of the samples that slowly shifts from blue at x = 0 to green at x = 0.4. In contrast, the stacking period of the restacked crystalline phase remains remarkably constant at 1 nm. Between x = 0.2 and x = 0.45, the lamellar liquid-crystalline phase and the restacked crystalline phase coexist. At x = 0.5, the remaining amount of lamellar phase is negligible.
Very importantly, none of the many samples investigated in this study showed a lamellar period intermediate between 1 and 100 nm, which suggests an abrupt transition between the lamellar mesophase and the restacked crystalline state, with phase coexistence, i.e. a 1st order phase transition that calls for theoretical modeling.
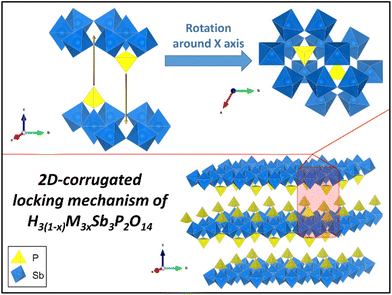
One may wonder why the restacked phases show such good crystallinity instead of turbostratic disorder. This can be explained by the corrugated surface of the Sb3P2O143− nanosheets, which is in stark contrast to flat 2D nanosheets, such as graphene. Indeed, the crystallographic structure of the former, presented in Fig. 5, shows that: (i) PO4 tetrahedra are alternately located above or below a plane of SbO6 octahedra; (ii) these tetrahedra are themselves centered in small cavities of the SbO6 plane which are located at the centers of the 6-ring structure of SbO6 octahedra. Such a structure creates a lock-in mechanism that allows only for a single stacking orientation of the nanosheets (modulo 2π/3). This is further detailed with a quick animation in ESI II.† Such mechanism cannot take place for common van der Waals 2D materials, which usually do not present any surface corrugation or structural roughness to play this role. To further investigate the generality of this topologically induced restacking mechanism and associated crystallinity, we searched the literature for other such examples. It is worth noting that in the only similar report of crystallinity induced by re-stacking, although the mechanism was not discussed, if one looks at the structure of the nanosheets involved, one can find similar protruding tetrahedra.21
Theoretical modeling of phase coexistence of colloidal lamellar and restacked mesophases
FL ∼ (M − 1)AfL![[thin space (1/6-em)]](https://www.rsc.org/images/entities/char_2009.gif) exp(−d/λD) exp(−d/λD) | (2) |
Fintra ∼ kBTM(ln![[thin space (1/6-em)]](https://www.rsc.org/images/entities/char_2009.gif) ρ⊥Λ2 − 1) ρ⊥Λ2 − 1) | (3) |
 | (4) |
Minimizing with respect to d and implicitly renormalizing all variables in terms of the unit length λD and energy kBT, we obtain the equilibrium lamellar distance as a solution of the non-linear equation:
 | (5) |
Non-ideal intralamellar fluid
In our previous work, a more sophisticated expression for the intralamellar fluid was used that combines electrostatic repulsion and an excluded-volume effect that prevents discs from packing together too closely.16 This gives rise to an additional non-ideal (excess) free energy that combines mean-field electrostatic repulsion between particles within the lamella and a contribution from hard-core volume exclusion: | (6) |
 the intralamellar packing fraction of discs with diameter D which from now on serves as our unit of length. Furthermore, a = π
![[small script l]](https://www.rsc.org/images/entities/i_char_e146.gif) BλDwL is a prefactor in terms of the Bjerrum length
BλDwL is a prefactor in terms of the Bjerrum length ![[small script l]](https://www.rsc.org/images/entities/i_char_e146.gif) B and electrostatic amplitude wL that gathers various characteristics pertaining to the effective charge, shape, and intralamellar fluid structure of the nanosheets.16 Furthermore, for the interlamellar repulsion we identify fL = 8/π
B and electrostatic amplitude wL that gathers various characteristics pertaining to the effective charge, shape, and intralamellar fluid structure of the nanosheets.16 Furthermore, for the interlamellar repulsion we identify fL = 8/π![[small script l]](https://www.rsc.org/images/entities/i_char_e146.gif) BλD (in dimensionless units). Taking typical values for the Sb3P2O143− nanosheets with average diameter D = 〈D〉 ≈ 800 nm we find λD ≈ 0.125,
BλD (in dimensionless units). Taking typical values for the Sb3P2O143− nanosheets with average diameter D = 〈D〉 ≈ 800 nm we find λD ≈ 0.125, ![[small script l]](https://www.rsc.org/images/entities/i_char_e146.gif) B ≈ 9 × 10⁻⁴, a ≈ 1.7 × 10⁴ and fL ≈ 2.3 × 104.16
B ≈ 9 × 10⁻⁴, a ≈ 1.7 × 10⁴ and fL ≈ 2.3 × 104.16
In the restacked state, the long-range electrostatic forces are no longer dominant and we need to account for additional (van der Waals) attractive and steep repulsive steric forces that are at play at short interlamellar separations. We thus write:
 | (7) |
For the intralamellar part, we combine the ideal gas contribution eqn (2) with the excess part eqn (5) that accounts for disc-disc correlations due to electrostatic repulsion and hard-core volume exclusion:16
 | (8) |
The free energy diverges when the discs reach close-packing, ϕ⊥ → 1, even though actual close packing of uniform-sized discs happens at  . We assume that the van der Waals attraction does not affect the intralamellar structure given the vanishing side-by-side contact area between two co-planar sheets. As before, minimization of the total free energy Ftot = FL + Fintra with respect to ∂Ftot/∂d = 0 yields the equilibrium lamellar distance which now further depends on the lamellar Lennard-Jones amplitude ε and range d* (see ESI†).
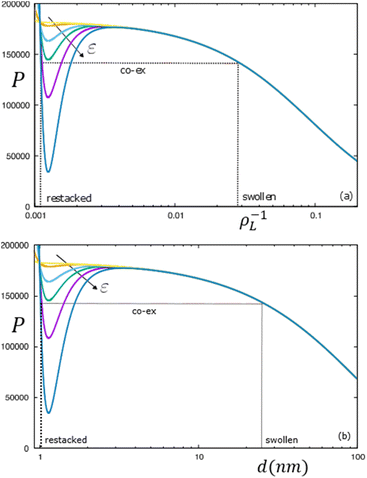
The possibility of an isostructural lamellar phase co-existence induced by the van der Waals forces can be explored by plotting (van der Waals) isotherms in terms of the total osmotic pressure of the lamellar phase P/ρL2 = ∂(Ftot/N)/∂ρL upon variation of the LLJ amplitude ε that may be interpreted as an inverse effective temperature. The isotherms in Fig. 6 clearly demonstrate the possibility of a gas–liquid type coexistence between a high-density restacked lamellar phase and a swollen lamellar phase (indicated by the dotted lines). For the particular case analysed in Fig. 4, we find that the lamellar system remains uniform for weak van der Waals forces (ε < 0.1) but phase separates at elevated attraction ε ≫ 1.
Conclusion
In this work, we took advantage of the delamination of the 2D material H3Sb3P2O14 in water, which leads to the spontaneous organization of its nanosheets into a rare example of nanosheet-based lamellar mesophase, to study their controlled restacking. In contrast to the turbostratic restacking of typical 2D van der Waals materials, we show here that a crystalline-like restacking of the exfoliated free anionic nanosheets can be induced by the precise cation exchange produced by a neutralization reaction with alkaline bases, thanks to a first-order transition. Finally, the restacking process was modelled as a first-order phase transition using a theoretical approach that explicitly takes into account the van der Waals attractive forces between nanosheet-laden lamellae at short distances through a Lennard-Jones-like potential.From a physical chemistry point of view, this study sheds new light on the exfoliation/restacking process of nanosheets in colloidal suspension, which should be considered as a first-order equilibrium phase transition. From the more applied perspective of controlled deposition of 2D materials into complex integrated structures, our investigation shows that the use of self-locking 2D materials provides a new means to avoid the undesired turbostratic orientation disorder of the nanosheets.
Experimental section
H3Sb3P2O14 synthesis and delamination
The synthesis of large amounts of H3Sb3P2O14 was derived from the protocol published by Piffard and co-workers13 and has previously been published elsewhere.14,15 Herein, its steps are briefly described.K3Sb3P2O14 was first synthesized using a stoichiometric mixture of NH4H2PO4 (0.224 mol, 25.823 g), Sb2O3 (MERCK, 0.166 mol, 48.367 g) and KNO3 (PROLABO, 0.332 mol, 33.552 g) that was heated at 300 °C for 10 h, then at 1000 °C for 24 h, using a ramp of 50 °C h−1. X-ray powder diffraction showed that the resulting solid (K3Sb3P2O14) had an impurity level lower than 1%.12
A cationic exchange of K3Sb3P2O14 by acidic treatment was done to produce the phosphatoantimonic acid H3Sb3P2O14. For this, 60 g of K3Sb3P2O14 was dissolved and stirred in a 2 L solution of 7.5 M nitric acid at 50 °C for 24 h. Centrifugation at 4500g was made to recover the treated solid. This procedure was repeated three times to complete the cationic exchange.
The solid obtained (H3Sb3P2O14) was finally rinsed several times with absolute ethanol and recovered by centrifugation, then dried in air at 60 °C overnight.
A solution of H3Sb3P2O14 (solution A) in water was first prepared by dispersing and stirring 20 g of the H3Sb3P2O14 powder into 1 L of 18.2 MΩ cm H2O (PURELAB® Chorus, ELGA, 18.2 MΩ cm) for 30 min. The solution A was then centrifuged at 3600 G for 15 min and the supernatant, which appeared milky and opalescent, was collected (solution B), whose concentration, measured by thermogravimetric analysis (TGA), is 1.65 w/w%. Solution B's residual nitrate ion concentration, estimated with a JBL nitrate test, was below 1 ppm (lowest level of detection of the test). Another solution of H3Sb3P2O14 was prepared by diluting solution B by a factor of 10 (solution C, at 0.165 w/w%).
Sample preparation
In order to study as a function of pH the colloidal stability and properties of the lamellar phase of H3Sb3P2O14 nanosheets, several samples with different neutralization ratios (x) were prepared, according to the reaction eqn (1).First, for each targeted value of x, the volume of the base required was added drop by drop to 5 mL of H3Sb3P2O14 suspension (solution B) under vigorous stirring to obtain a homogeneous mixture. Then, sample series with different dilution factors (1, 1.25, 2, 3, 5, and 10) were prepared from each of these mixtures by adding the required volume of water (18.2 MΩ cm). All samples are therefore defined by the nanosheet weight fraction (in w/w%) and the exchange rate, x. Each sample prepared had a final volume of 1 mL and was poured in a 2 mL glass vial.
H3Sb3P2O14 titrations
Titrations were performed using a Metrohm automatic titrator (Titrino plus 484). NaOH and KOH solutions were purchased (Titrinorm solutions, VWR, 0.1 M). LiOH, RbOH, and CsOH were prepared by dilution of the corresponding 0.1 M base purchased from Alfa Aesar. The concentrations of the latter solutions were accurately determined by titration using a titrinorm solution of HCl (VWR, 0.1 M).In a typical titration of H3Sb3P2O14, 15 mL of H3Sb3P2O14 suspension (solution C, 0.165 w/w%) was titrated by adding the selected basic solution at a low rate of 0.05 mL min−1, by increment of 0.01 mL, under vigorous stirring. Titration experiments were performed at very slow rates of base addition because the titration of an acidic colloidal suspension of charged nanosheets is a complex process. Indeed, each time a drop of basic solution is added into the suspension, before the base neutralizes the acid, a charge excess builds up locally and may screen the electrostatic repulsions that provide the nanosheets with colloidal stability, and therefore may lead to flocculation around the drop. Prior and after each titration, the pH electrode was rinsed with deionized water.
M3Sb3P2O14 reverse cationic exchange back to H3Sb3P2O14
Flocculates of K3Sb3P2O14 (K3), Rb3Sb3P2O14 (Rb3), and Na3Sb3P2O14 (Na3), formed during the titration of H3Sb3P2O14, were dried at 60 °C for 2 h in an oven. Similar to the synthesis of H3Sb3P2O14 described above, a cationic exchange of dried K3, Rb3 and Na3 (16.4 mg, 13.8 mg and 19.0 mg, respectively) was performed to recover H3Sb3P2O14. For this reverse cationic exchange, the solid was dispersed and stirred in 1 mL solution of 7.5 M nitric acid at room temperature for 24 h. Centrifugation at 4500g was performed to recover the treated solid. This procedure was repeated three times to complete the cationic exchange.Sample visual inspection
Series of H3(1−x)M3xSb3P2O14 (M+ = Li+, Na+, K+, Rb+, and Cs+) samples with constant nanosheet concentration but increasing values of x were examined with the naked eye in natural light and in polarized light (i.e. between crossed polarizers) to check their birefringence and distinguish the different coexisting phases. These observations were recorded with an Olympus XZ-1 camera at normal incidence using the flash only for the photographs in natural light. All observations reported here were made after six months of sample aging.Optical microscopy
H3Sb3P2O14 samples prepared by reverse cationic exchange of M3Sb3P2O14 were placed between a microscope slide and a coverslip and observed using a polarizing microscope (AxioScope A1, Zeiss) equipped with a Canon EOS 2000D camera. Droplets of pure water were added to the powder to observe the swelling of the nanosheets. The resulting photographs are presented in the ESI.†SEM-EDX analysis
M3Sb3P2O14 samples were analysed by SEM-EDX (SEM: Ultra-55, Zeiss, EDX: XFlash 5030, Bruker) to verify the value of x of the phases restacked at the nominal value of x = 1. A few drops of the flocculates were dried on silicon wafers at 60 °C for 2 h in an oven. A thin gold film was deposited on the samples with a sputter coater (Agar). EDX analyses are presented in the ESI.†Small-angle X-ray scattering experiments
A collection of small-angle X-ray scattering (SAXS) measurements of the H3(1-x)M3x systems was conducted at the Swing SAXS beamline of the SOLEIL synchrotron facility at Saint-Aubin, France. As previously reported, the X-ray energy was 12 keV corresponding to the wavelength λ = 0.1033 nm. The sample-to-detector distance was 6.226 m, so that the scattering vector modulus, q (q = (4π![[thin space (1/6-em)]](https://www.rsc.org/images/entities/char_2009.gif) sin
sin![[thin space (1/6-em)]](https://www.rsc.org/images/entities/char_2009.gif) θ)/λ where 2θ is the scattering angle) ranged between 10−2 and 0.5 nm−1. The beam size was 375 × 75 μm2 at the sample level. The scattering patterns were recorded with an Eiger-4 M detector and the exposure time was typically 0.5 s. The usual SAXS data reduction procedures were made, using the Swing data reduction software (Foxtrot 3.4.9), and the data was displayed either as 2-dimensional SAXS patterns or as plots of the scattered intensity versus scattering vector modulus, I(q), obtained by azimuthal averaging of the SAXS patterns. The samples were filled into cylindrical Lindemann glass capillaries of 1.0 ± 0.1 mm diameter (Glas-Technik & Konstruktion, Germany) and sealed with silicone glue.
θ)/λ where 2θ is the scattering angle) ranged between 10−2 and 0.5 nm−1. The beam size was 375 × 75 μm2 at the sample level. The scattering patterns were recorded with an Eiger-4 M detector and the exposure time was typically 0.5 s. The usual SAXS data reduction procedures were made, using the Swing data reduction software (Foxtrot 3.4.9), and the data was displayed either as 2-dimensional SAXS patterns or as plots of the scattered intensity versus scattering vector modulus, I(q), obtained by azimuthal averaging of the SAXS patterns. The samples were filled into cylindrical Lindemann glass capillaries of 1.0 ± 0.1 mm diameter (Glas-Technik & Konstruktion, Germany) and sealed with silicone glue.
Wide-angle X-ray scattering experiments
The wide-angle X-ray scattering (WAXS) measurements were made at the same beamline with the same samples in the same conditions as for the SAXS experiment but with D = 0.528 m and covering the q-range of 2.5–18 nm−1.To facilitate the indexation of the peaks of the WAXS data of all phases, powder diffraction diagrams have been simulated with the CrystalDiffract software using the Crystallographic Information file (CIF) of K3Sb3P2O14 (#1545655) (it should be noted that this structure was later corrected and its true formulation is actually K3Sb3P2O14·1,32 H2O20). The same was done for H3Sb3P2O14, Na3Sb3P2O14, Rb3Sb3P2O14, and Cs3Sb3P2O14 by simply changing the nature of the metallic chemical element in the above CIF file, but keeping all other parameters the same. They are all listed in the SI. A detailed X-ray powder diffraction study of the M3Sb3P2O14·xH2O (M = Li, Na, K, Rb, Cs; x = 0, 5, 6 or 10) compounds, has already been performed by Piffard et al.13
Author contributions
The manuscript was written through scientific and editing contributions of all authors as follow: PD & JCPG conceptualized the experimental part, HHW the theoretical part; LC, KER & CG performed the titrations; LC and KER prepared all samples and with PD and JCPG performed optical observations; LC, KER, LM, PD, JCPG collected and reduced data at SWING Synchrotron; LC, KER & PD performed further SWING data treatment and together with LM and JCPG analysed them; HHW developed the theoretical model with inputs from PD; SMC studied the reverse cationic exchange, performed and treated EDX analysis; SMC and JCG performed optical microscopy observations and explained the 2D-corrugated locking mechanism; first draft parts by LC, JCG and HHW. All authors have given approval to the final version of the manuscript.Abbreviations
| H3 | H3Sb3P2O14 |
| M3 | M3Sb3P2O14 |
| SAXS | Small angle X-ray scattering |
| WAXS | Wide angle X-ray scattering. |
Conflicts of interest
There are no conflicts to declare.Acknowledgements
We acknowledge SOLEIL for provision of synchrotron radiation facilities (under the approved proposals #20190467 #20191221 & #20201118). We thank Thomas Bizien and Stéphan Rouzière for help with the X-ray scattering experiments (SOLEIL and tests at MORPHEUS Platform of LPS, respectively) as well as (i) middle school intern Alistair J. Gabriel for our group's first synthesis and observations of H3(1−x)Li3xSb3P2O14 samples; (ii) Engineering school third year interns Pan Zhou and Fatima Hami for preliminary results on other H3(1−x)M3xSb3P2O14 synthesis. LC, KER, LM, PD & JCPG acknowledge financial support from the “Agence Nationale de la Recherche” Grant no. ANR-17-CE04-0003, project 4WATER. LC and JCPG acknowledge CEA's Nanoscience program financial support, project NANOFILTRE.References
- A. K. Geim and I. V. Grigorieva, Nature, 2013, 499, 419–425 CrossRef CAS PubMed.
- D. A. Dikin, S. Stankovich, E. J. Zimney, R. D. Piner, G. H. B. Dommett, G. Evmenenko, S. T. Nguyen and R. S. Ruoff, Nature, 2007, 448, 457–460 CrossRef CAS PubMed.
- M. E. Suk and N. R. Aluru, J. Phys. Chem. Lett., 2010, 1, 1590–1594 CrossRef CAS.
- R. R. Nair, H. A. Wu, P. N. Jayaram, I. V. Grigorieva and A. K. Geim, Science, 2012, 335, 442–444 CrossRef CAS PubMed.
- H. Li, Z. Song, X. Zhang, Y. Huang, S. Li, Y. Mao, H. J. Ploehn, Y. Bao and M. Yu, Science, 2013, 342, 95–98 CrossRef CAS PubMed.
- R. K. Joshi, P. Carbone, F. C. Wang, V. G. Kravets, Y. Su, I. V. Grigorieva, H. A. Wu, A. K. Geim and R. R. Nair, Science, 2014, 343, 752–754 CrossRef CAS PubMed.
- G. Liu, W. Jin and N. Xu, Chem. Soc. Rev., 2015, 44, 5016–5030 RSC.
- Z. Zhou, Y. Tan, Q. Yang, A. Bera, Z. Xiong, M. Yagmurcukardes, M. Kim, Y. Zou, G. Wang, A. Mishchenko, I. Timokhin, C. Wang, H. Wang, C. Yang, Y. Lu, R. Boya, H. Liao, S. Haigh, H. Liu, F. M. Peeters, Y. Li, A. K. Geim and S. Hu, Nat. Commun., 2022, 13, 4031 CrossRef CAS PubMed.
- M. Onoda, Z. Liu, K. Takada and T. Sasaki, J. Appl. Crystallogr., 2009, 42, 22–29 CrossRef CAS.
- M. Onoda, Z. Liu, Y. Ebina, K. Takada and T. Sasaki, J. Phys. Chem. C, 2011, 115, 8555–8566 CrossRef CAS.
- S. Shallcross, S. Sharma, E. Kandelaki and O. A. Pankratov, Phys. Rev. B: Condens. Matter Mater. Phys., 2010, 81, 165105 CrossRef.
- Y. Piffard, A. Lachgar and M. Tournoux, J. Solid State Chem., 1985, 58, 253–256 CrossRef CAS.
- M. Piffard, Y. Verbaere, A. Lachgar, A. Deniard-Courant and S. Tournoux, Rev. Chim. Miner., 1986, 23, 766–775 Search PubMed.
- J. C. P. Gabriel, F. Camerel, B. J. Lemaire, H. Desvaux, P. Davidson and P. Batail, Nature, 2001, 413, 504–508 CrossRef CAS PubMed.
- P. Davidson, C. Penisson, D. Constantin and J. C. P. Gabriel, Proc. Natl. Acad. Sci. U. S. A., 2018, 115, 6662–6667 CrossRef CAS PubMed.
- K. El Rifaii, H. H. Wensink, C. Goldmann, L. Michot, J. C. P. Gabriel and P. Davidson, Soft Matter, 2021, 17, 9280–9292 RSC.
- K. Szendrei, P. Ganter, O. Sànchez-Sobrado, R. Eger, A. Kuhn and B. V. Lotsch, Adv. Mater., 2015, 27, 6341–6348 CrossRef CAS PubMed.
- K. Szendrei, P. Ganter and B. V. Lotsch, in Photonic Crystal Materials and Devices XII, ed. D. Gerace, G. Lozano, C. Monat and S. G. Romanov, 2016, p. 98850Z Search PubMed.
- A. Galarneau, PhD thesis, Université de Nantes, 1993.
- A. Lachgar, S. Deniard-Courant and Y. Piffard, J. Solid State Chem., 1988, 73, 572–576 CrossRef CAS.
- K. Maeda and M. Eguchi, Catal. Sci. Technol., 2016, 6, 1064–1069 RSC.
- B. W. Ninham and V. Yaminsky, Langmuir, 1997, 13, 2097–2108 CrossRef CAS.
- F. W. Tavares, D. Bratko and J. M. Prausnitz, Curr. Opin. Colloid Interface Sci., 2004, 9, 81–86 CrossRef CAS.
- I. Palaia, A. Goyal, E. Del Gado, L. Šamaj and E. Trizac, J. Phys. Chem. B, 2022, 126, 3143–3149 CrossRef CAS PubMed.
Footnote |
| † Electronic supplementary information (ESI) available: Fig. SI I: SI1: Photographs of a series of sample tubes with H3Sb3P2O14 weight fraction decreasing from left to right: 1.65, 1.32, 0.83, 0.55, 0.33, and 0.17 w/w% observed (a) in natural light and (b) between crossed polarizers; Fig. SI2: A typical scanning electron microscopy image of H3Sb3P2O14 nanosheets; Fig. SI3: A typical atomic force microscopy image of H3Sb3P2O14 nanosheets with a horizontal cut showing that the nanosheet thickness is ≈1.2 nm; Fig. SI4–7: photographs of 5 series of sample tubes observed in natural light and between crossed polarizers at 4 different concentrations of H3 and different values of x for the cations (Na+, K+, Rb+, Cs+). Fig. SI8: Photographs of five series of sample tubes observed in natural light and between crossed polarizers for H3(1−x)M3xSb3P2O14 nanosheet weight fraction 0.17 w/w%, and variable x values; Fig. SI9–12. SAXS and WAXS patterns of the bottom phase of the samples shown in Fig. SI2 for the [H3(1−x)M3x] systems; SI13: simulated X-ray diffraction patterns for M3Sb3P2O14 (M = Li, Na, Rb, Cs); Fig. SI14: dependence of the lamellar period on the cation exchange rate x for H3(1x)M3xSb3P2O14 (M = Li, Na, Rb, Cs); Fig. SI15: dependence of the pH value on the cation exchange rate x for all series of samples shown in Fig. SI2 (with constant H3Sb3P2O14 weight fraction (1.65 w/w%)); Tables SI1–3: Fast swelling of H3Sb3P2O14 prepared by reverse cationic exchange of M3Sb3P2O14; SI19: Lamellar Lennard-Jones potential; Fig. SI16: SEM-EDX analysis of M3Sb3P2O14 restacked phases. SI II: Animation showing the 2D-corrugated locking mechanism for the restacking of H3(1−x)M3xSb3P2O14. See DOI: https://doi.org/10.1039/d3nr04885c |
| This journal is © The Royal Society of Chemistry 2023 |

