
 Open Access Article
 This Open Access Article is licensed under a Creative Commons Attribution-Non Commercial 3.0 Unported Licence
Photo-enhanced lithium-ion batteries using metal–organic frameworks†
Holly
Andersen
a,
Yinan
Lu
a,
Joanna
Borowiec
b,
Ivan P.
Parkin
 b,
Michael
De Volder
*c and
Buddha
Deka Boruah
*a
b,
Michael
De Volder
*c and
Buddha
Deka Boruah
*a
aInstitute for Materials Discovery, University College London, London WC1E 7JE, UK. E-mail: b.boruah@ucl.ac.uk
bDepartment of Chemistry, University College London, London WC1H 0AJ, UK
cDepartment of Engineering, University of Cambridge, Cambridge CB3 0FS, UK. E-mail: mfld2@cam.ac.uk
First published on 26th January 2023
Abstract
The development of photo-enhanced lithium-ion batteries, where exposing the electrodes to light results in higher capacities, higher rate performance or self-charging, has recently gained substantial traction. The challenge in these devices lies in the realisation of photo-electrodes with good optical and electrochemical properties. Herein, we propose copper-hexahydroxybenzene as the active photo-electrode material which both harvests light and stores energy. This material was mixed with reduced graphene oxide as a conductive additive and charge transfer medium to create photo-active electrodes. Under illumination, these electrodes show improved charge storage kinetics resulting in the photo-accelerated charging and discharging performance (i.e. specific capacities improvement from 107 mA h g−1 to 126 mA h g−1 at 200 mA g−1 and 79 mA h g−1 to 97 mA h g−1 at 2000 mA g−1 under 1 sun illumination as compared to dark).
Introduction
The interaction of light with photo-active battery materials has led to a range of different light-enhanced battery properties, including improved rate performance and light charging.1–3 Different strategies have been proposed to achieve this functionality. For instance, photo-electrodes combining an active battery material (LiFePO4) and a photosensitive Ru dye (N719) were reported for solar energy conversion and charge storage.4 Thereafter, dual-functional optically and electrochemically active photo-electrode materials have been reported for lithium (Li)-ion and zinc (Zn)-ion systems, including perovskites,5,6 vanadium oxides,7 and organic molecules.8 However, some of these materials show poor cycling stability, are toxic or expensive. Herein, we explore a copper-hexahydroxybenzene (Cu-HHB) metal–organic framework (MOF) photo-cathode with a bandgap energy of ∼1.81 eV for photo-enhanced Li-ion batteries (Ph-LIBs).Cu-HHB has previously been used in Li-ion batteries, achieving a specific capacity of 111 mA h g−1 at 200 mA g−1 in the potential window of 1.3–2.6 V with long-term cycling stability of 90% capacity retention after 1000 cycles.9 Besides the Li-ion storage ability, Cu-HHB MOF also possess low toxicity, abundant active sites and tunable redox sites, which allow the foundation for their applications in batteries. Here we show how photo-electrodes are obtained by mixing Cu-HHB with reduced graphene oxide (rGO), with the latter serving as a conductive additive and charge transport medium. We found that under illumination, the cell specific capacity increases from 107 mA h g−1 to 126 mA h g−1 at 200 mA g−1, along with ∼ 20% improvement in the Li-ion diffusion constant under 1 sun illumination (inferred from CV peak current analysis).
Fig. 1a shows a schematic representation of the Cu-HHB based Ph-LIB half cell and the respective energy band diagram of the photo-cathode is shown in Fig. S1.† The Cu-HHB MOF is synthesised by a solution synthesis process using copper(II) acetate, sodium dodecyl sulfate, tetrahydroxy-1,4-quinone, and sodium hydroxide (see the experimental section, ESI†). Fig. 1b shows a scanning electron microscope (SEM) image of the synthesised Cu-HHB MOF (see Fig. S2† high magnification SEM image). The estimated bandgap energy of MOF is ∼1.81 eV (see the inset Tauc plot in Fig. 1c). The powder X-ray diffraction (PXRD) pattern of Cu-HHB is shown in Fig. 1d, the diffraction peaks at 2![[thin space (1/6-em)]](https://www.rsc.org/images/entities/char_2009.gif) θ ∼ 7.8°, 15.7°, and 27.2° correspond to the (100), (200) and (300) crystallographic planes of the Cu-HHB structure.9 Moreover, the peak at 2θ ∼ 30.2° can be indexed to (001), suggesting an ordered stacking.9 These PXRD results confirm that the synthesised Cu-HHB is crystalline with a hexagonal packing in ab planes (a = b = 1.2 nm) along with an interlayer spacing of ∼2.88 Å (001).9,10 Further, the high-resolution X-ray photoelectron spectroscopy (XPS) scan of Cu 2p3/2 (Fig. 1e) shows dominant characteristic peaks associated with the +2 oxidation state on Cu along with a trace peak of +1 oxidation state. Moreover, the high-resolution spectra in the C 1s and O 1s regions are provided in ESI (Fig. S3†). Based on the temperature N2 adsorption isotherm (Fig. 1f), the estimated BET surface area of Cu-HHB is 69.5 m2 g−1. Next, the photo-cathodes are prepared by mixing Cu-HHB with rGO, and polyvinylidene fluoride (PVDF) in a wt% ratio of 85:10:5, followed by drop casting on carbon felt (CF) current collectors. The electrodes are mounted in coin cells with an optical window of ∼7 mm diameter (Ph-LIB). A 5M lithium bis(trifluoromethanesulfonyl)imide in ethylene carbonate/propylene carbonate (v:v = 1:1) electrolyte is used in all experiments.
θ ∼ 7.8°, 15.7°, and 27.2° correspond to the (100), (200) and (300) crystallographic planes of the Cu-HHB structure.9 Moreover, the peak at 2θ ∼ 30.2° can be indexed to (001), suggesting an ordered stacking.9 These PXRD results confirm that the synthesised Cu-HHB is crystalline with a hexagonal packing in ab planes (a = b = 1.2 nm) along with an interlayer spacing of ∼2.88 Å (001).9,10 Further, the high-resolution X-ray photoelectron spectroscopy (XPS) scan of Cu 2p3/2 (Fig. 1e) shows dominant characteristic peaks associated with the +2 oxidation state on Cu along with a trace peak of +1 oxidation state. Moreover, the high-resolution spectra in the C 1s and O 1s regions are provided in ESI (Fig. S3†). Based on the temperature N2 adsorption isotherm (Fig. 1f), the estimated BET surface area of Cu-HHB is 69.5 m2 g−1. Next, the photo-cathodes are prepared by mixing Cu-HHB with rGO, and polyvinylidene fluoride (PVDF) in a wt% ratio of 85:10:5, followed by drop casting on carbon felt (CF) current collectors. The electrodes are mounted in coin cells with an optical window of ∼7 mm diameter (Ph-LIB). A 5M lithium bis(trifluoromethanesulfonyl)imide in ethylene carbonate/propylene carbonate (v:v = 1:1) electrolyte is used in all experiments.
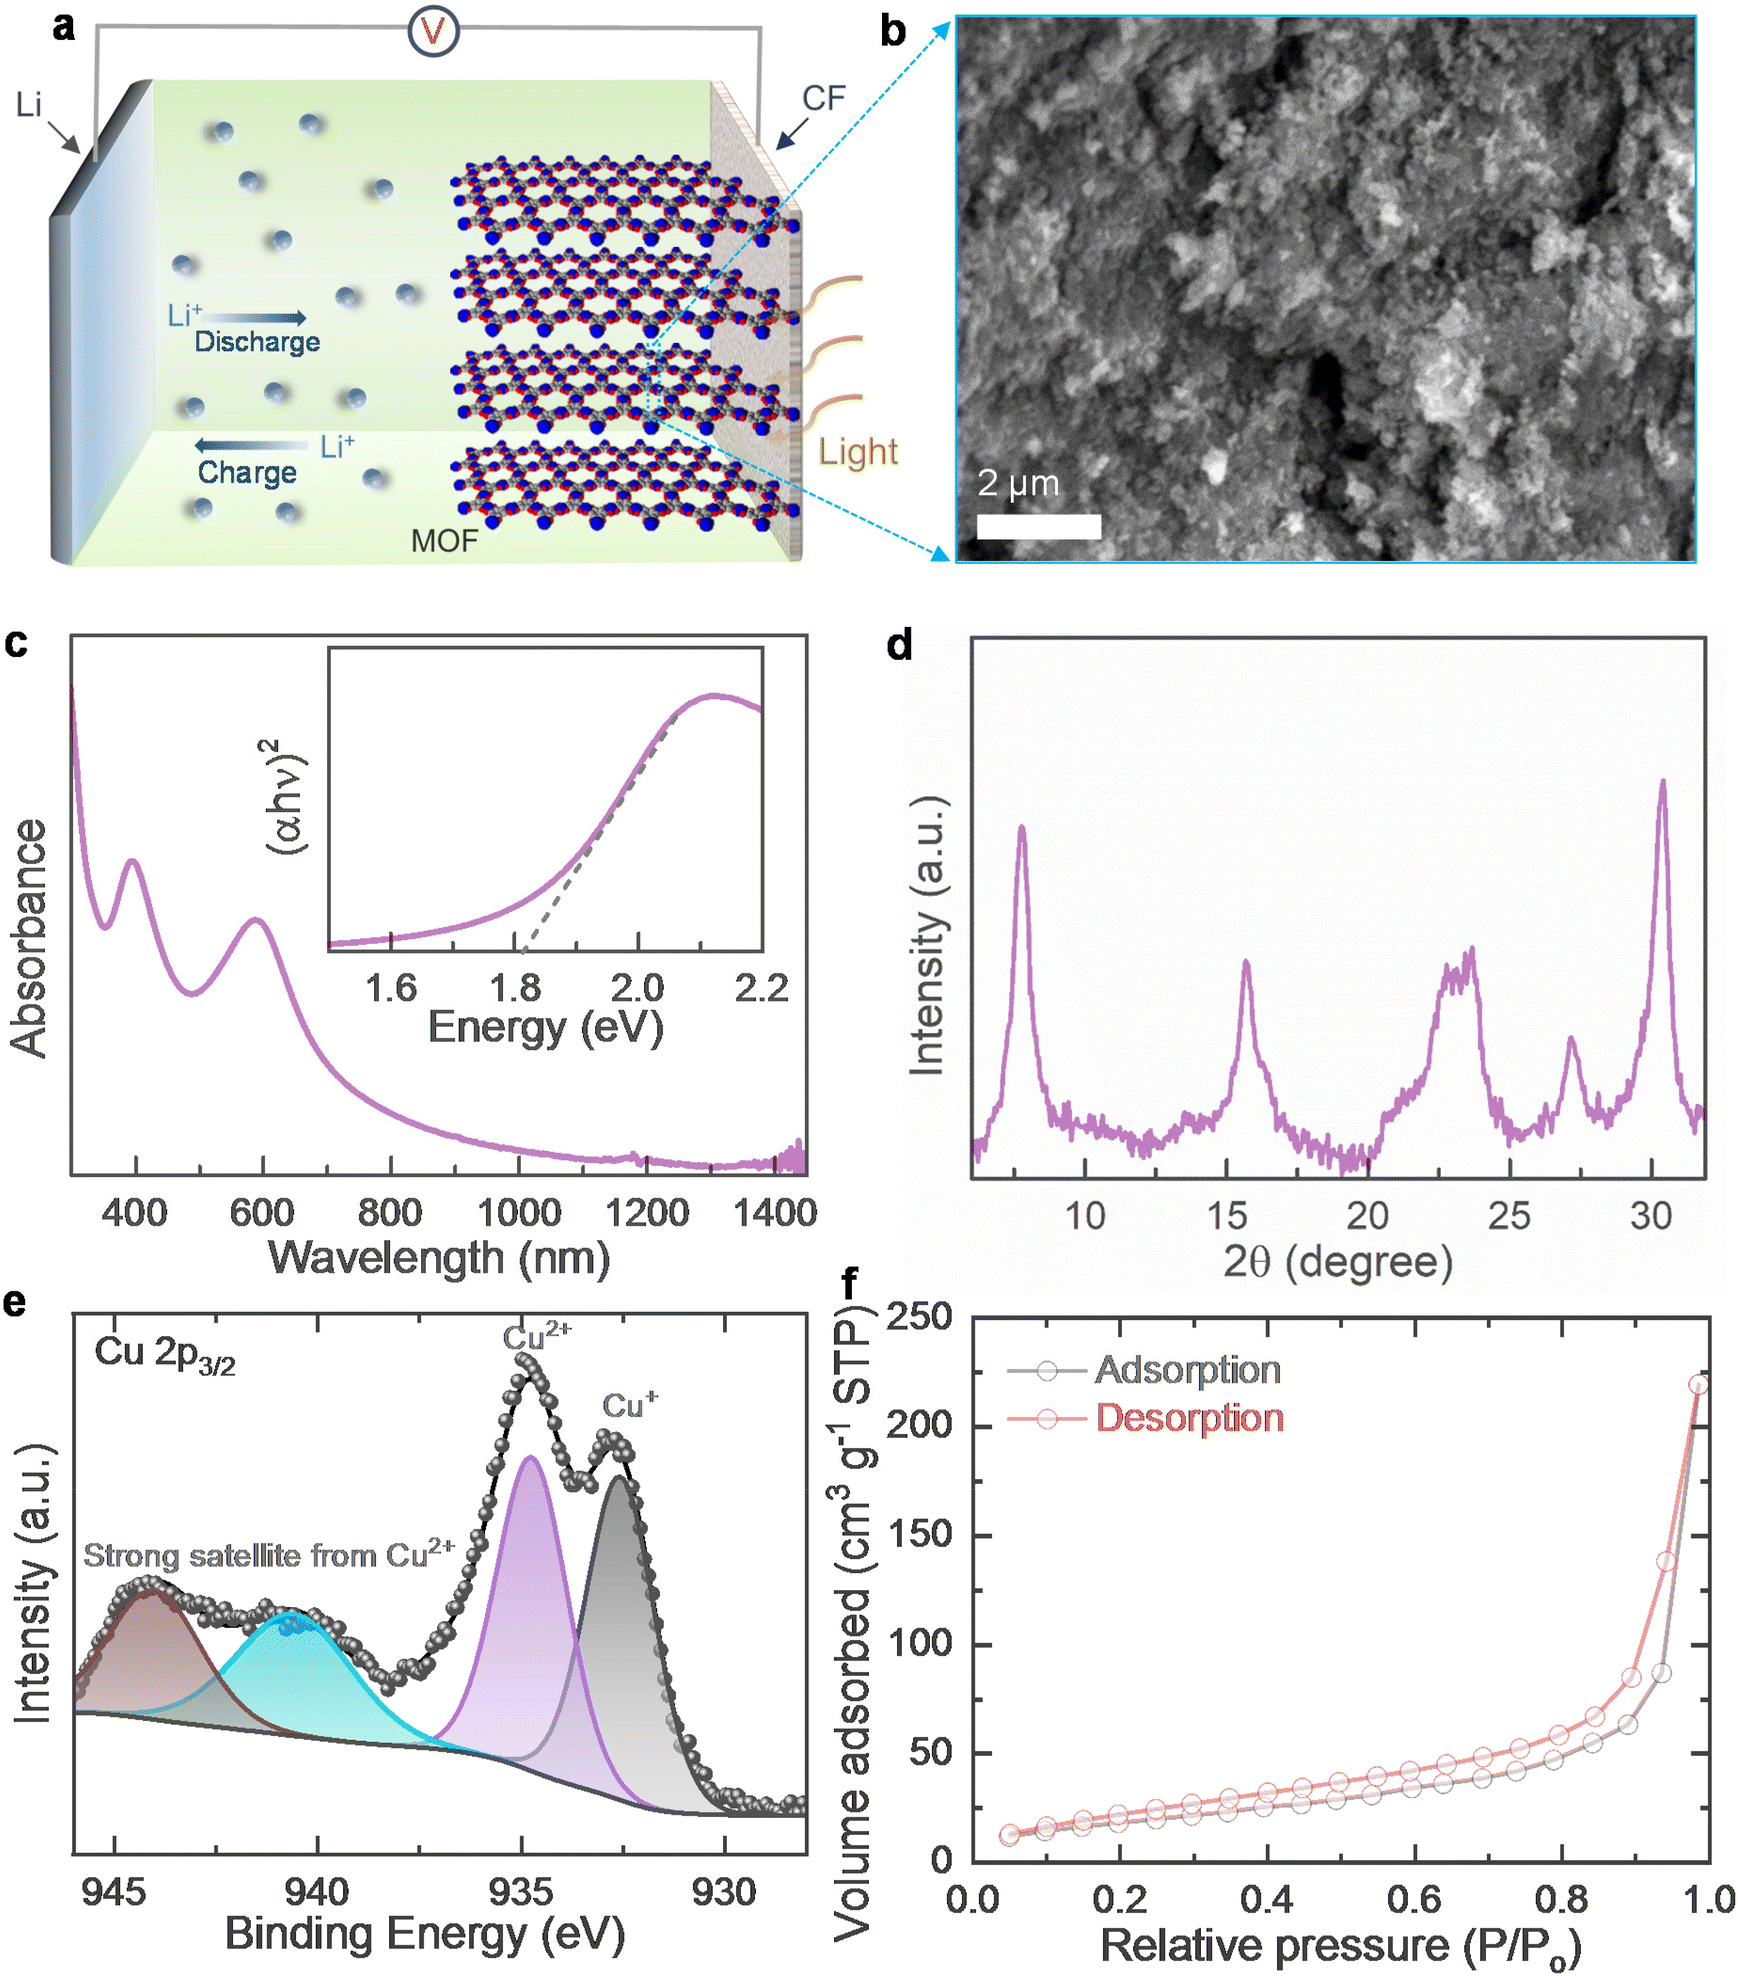 | ||
| Fig. 1 (a) Schematic illustration of Ph-LIB using Cu-HHB photo-cathode and Li counter electrode. (b) SEM image of the Cu-HHB MOF. (c) UV-Vis absorption spectrum of Cu-HHB: the Tauc plot (inset) shows the absorption edge energy of ∼1.81 eV. (d) PXRD pattern of Cu-HHB, with diffraction peaks at 2θ ∼ 7.8°, 15.7°, 27.2°and 30.2° can be indexed to (100), (200), (300) and (001) planes. The broad peak at 2θ ∼ 22–24.2° could be attributed to the glass substrate. (e) High-resolution XPS scan of Cu 2p3/2 of Cu-HHB. (f) BET N2 adsorption isotherms of Cu-HHB. | ||
The electrical photoresponse of the Cu-HHB is studied by fabricating planar metal–semiconductor–metal type photodetector (PD) and the details of the fabrication of PDs and electrical measurements are provided in the ESI.† As shown in Fig. 2a, the increase in the current response of the gold (Au)–Cu-HHB–Au PD under light confirms the photosensitivity of the Cu-HHB. Further, Fig. 2b supports the photosensitivity of the Cu-HHB where, significant increase in the response current (= photo-current − dark current) of the PD measured under illumination at 2 V bias voltage. Moreover, in order to study the separation of photoexcited charges between Cu-HHB and rGO, a layer-by-layer stacked on fluorine-doped tin oxide (FTO) transparent substrate i.e. FTO/rGO/Cu-HHB/silver (Ag) PD is fabricated and Fig. 2c shows the energy band diagram under illumination illustrating generation and separation of photocharges even in the absence of bias voltage (V = 0 V). The observed response current (Fig. 2d) under illumination at a 0 V bias voltage of the FTO/rGO/Cu-HHB/Ag PD proves that Cu-HHB and rGO material stack is capable of separating photogenerated charges that require for the development of photo-rechargeable batteries.
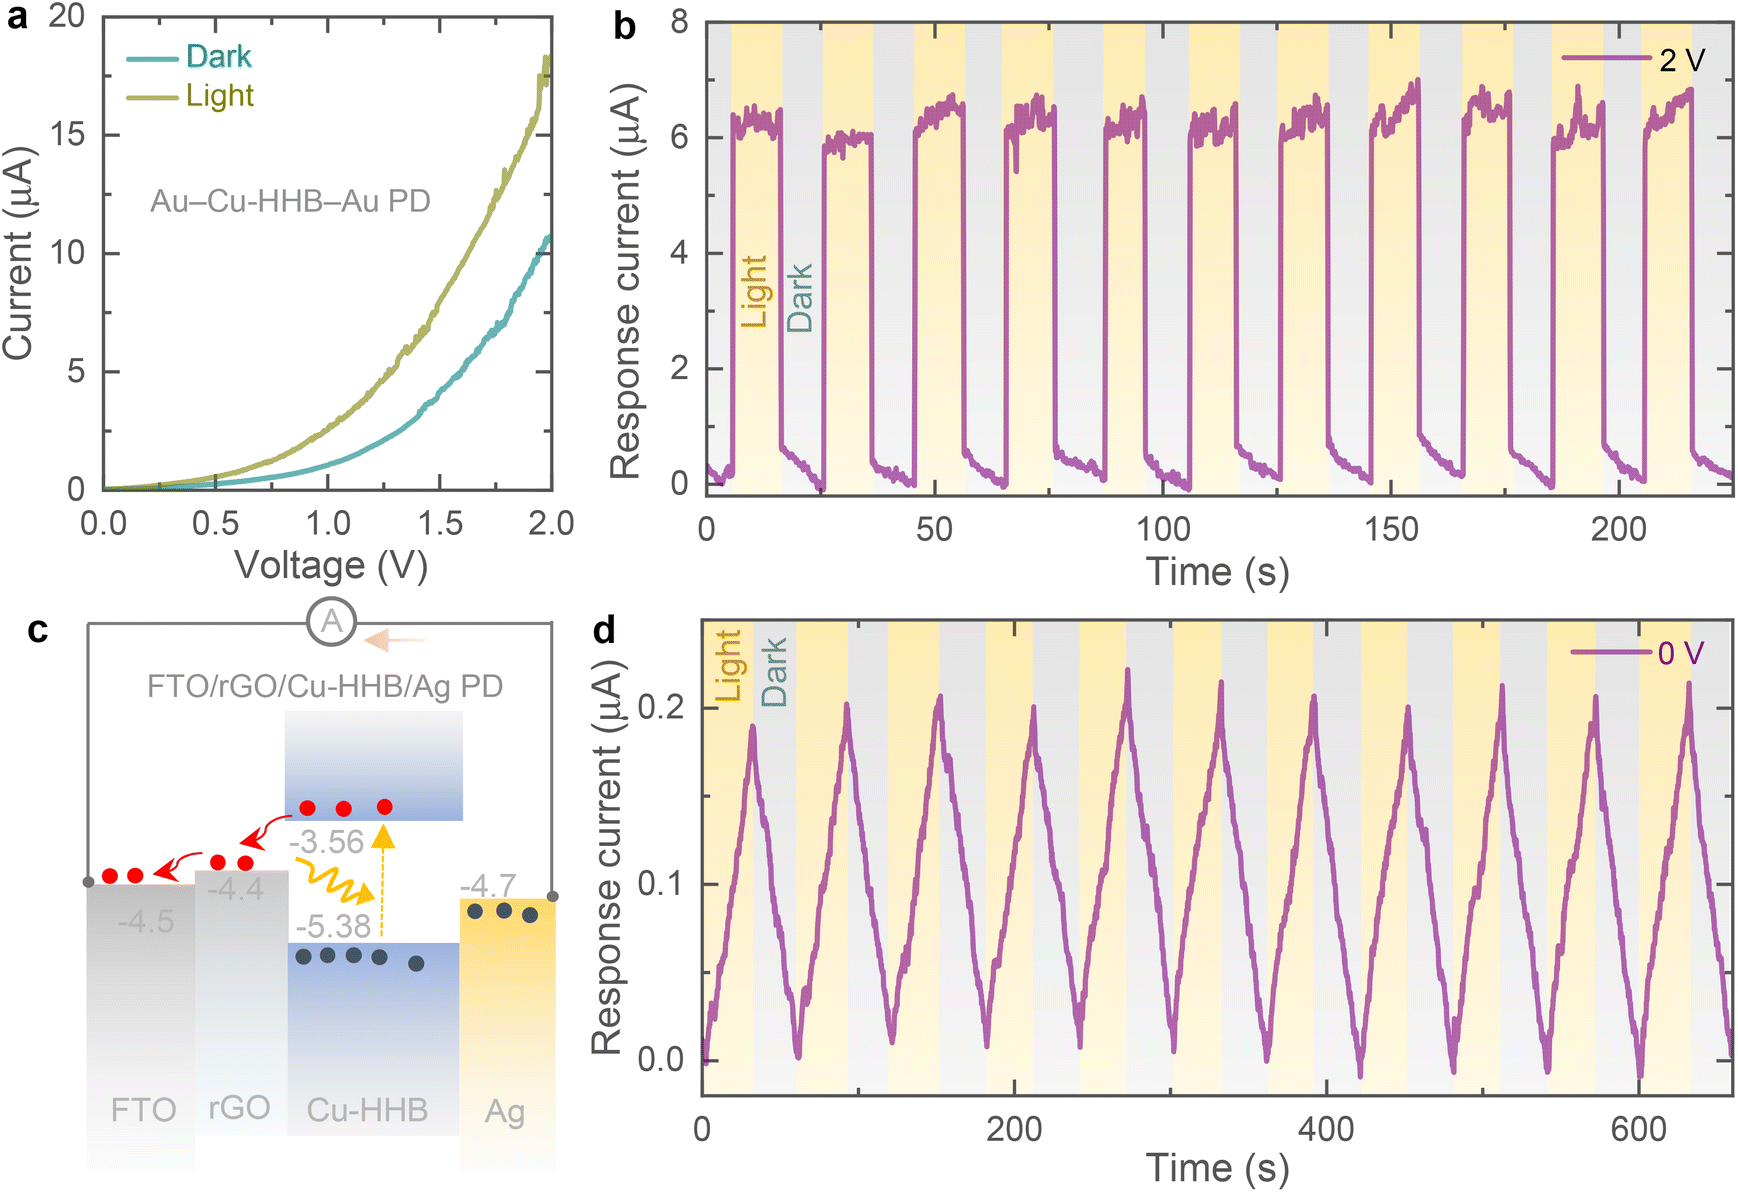 | ||
| Fig. 2 (a) Current–voltage curves of Au–Cu-HHB–Au PD in dark and light. (b) Current–time response of the Au–Cu-HHB–Au PD under alternating dark and light conditions at 2 V applied bias (V = 2 V). (c and d) Energy band diagram of FTO/rGO/Cu-HHB/Ag PD and respective current–time curve of the PD under alternating dark and light illuminated conditions in the absence of external bias voltage (V = 0 V). | ||
Cyclic voltammogram (CV) tests are recorded at different scan rates of 0.1 mV s−1 to 1 mV s−1 in a potential window of 1.3–2.6 V (vs. Li/Li+) both in the dark and under 1 sun illumination (LSH-7320 LED Solar Simulator). The upper cut-off voltage is set to 2.6 V because Cu-HHB based MOFs have previously been reported to suffer from rapid capacity fade above 3 V (vs. Li/Li+).9 All CVs show one pair of redox peaks (see Fig. 3a and b) that can be assigned to a previously reported one-electron redox process (CuO4−/CuO42−)9 and CV curves suggest reversible neutral and negatively charged states transformation of Cu-HHB during insertion and extraction of Li ions. The peak currents increase under 1 sun illumination due to the optical activity of Cu-HHB, and we found that the CV area increased by ∼ 22.4% at 0.2 mV s−1 under 1 sun illumination. Moreover, the light illumination also reduces the peak voltage separation by 13.2 mV. Additional CVs at scan rates of 0.1 mV s−1 and 0.5 mV s−1 in dark and illuminated conditions, are provided in the ESI (see Fig. S4†). The charge storage can be broken down into capacitive and diffusion-controlled processes from CV curves at different scan rates.11 The peak current (ip) of CV curves can be correlated with the scan rate (v) following the power-law relation, ip = avb; where a and b are variable parameters.12,13 The b-values can be obtained from the log(ip) vs. log(v) plots for both cathodic and anodic peaks; if the value of b approaches 0.5, the charge storage process is dominated by a diffusion-controlled mechanism, while a value of b approaching 1.0, indicates the dominance of a capacitive-controlled process.14 The estimated b-values are 0.95 and 0.94 for cathodic and anodic peaks in dark conditions (Fig. 3c). This suggests that capacitive-controlled processes dominate the overall charge storage contribution. Likewise, capacitive controlled charge storage contributions are maintained under light illumination where the estimated b-values are 0.95 and 0.97 for cathodic and anodic peaks (Fig. 3c). Further, we calculate capacitive contribution to the charge storage using the relation i(V) = k1v + k2v1/2, where k1v and k2v1/2 are capacitive-controlled and diffusion-controlled components and are estimated to be ∼98% and ∼100% in the dark and 1 sun illumination at scan rate of 1 mV s−1 (Fig. S5†). Further, the peak current of CVs can be related to the diffusion constant (D) of Li-ion as follows, ip = 0.4463F(F/RT)1/2AC D1/2v1/2 = ND1/2v1/2; where F represents the Faraday constant, R is the gas constant, T is the cell testing temperature, C is the initial Li-ion molar concentration in the electrolyte, and A represents electrode area.15,16 If we consider that the electrode area is not influenced by illuminating the electrode, then N = 0.4463F(F/RT)1/2AC can be regarded as a constant value for dark and illuminated conditions. Hence, from the following relation, we can estimate the diffusion constant from the slope of ip/N vs. v1/2 as shown in Fig. 3d. The calculated diffusion constant enhancements are 20.4% and 20.8% for cathodic and anodic peaks under 1 sun illumination compared to those in dark conditions.
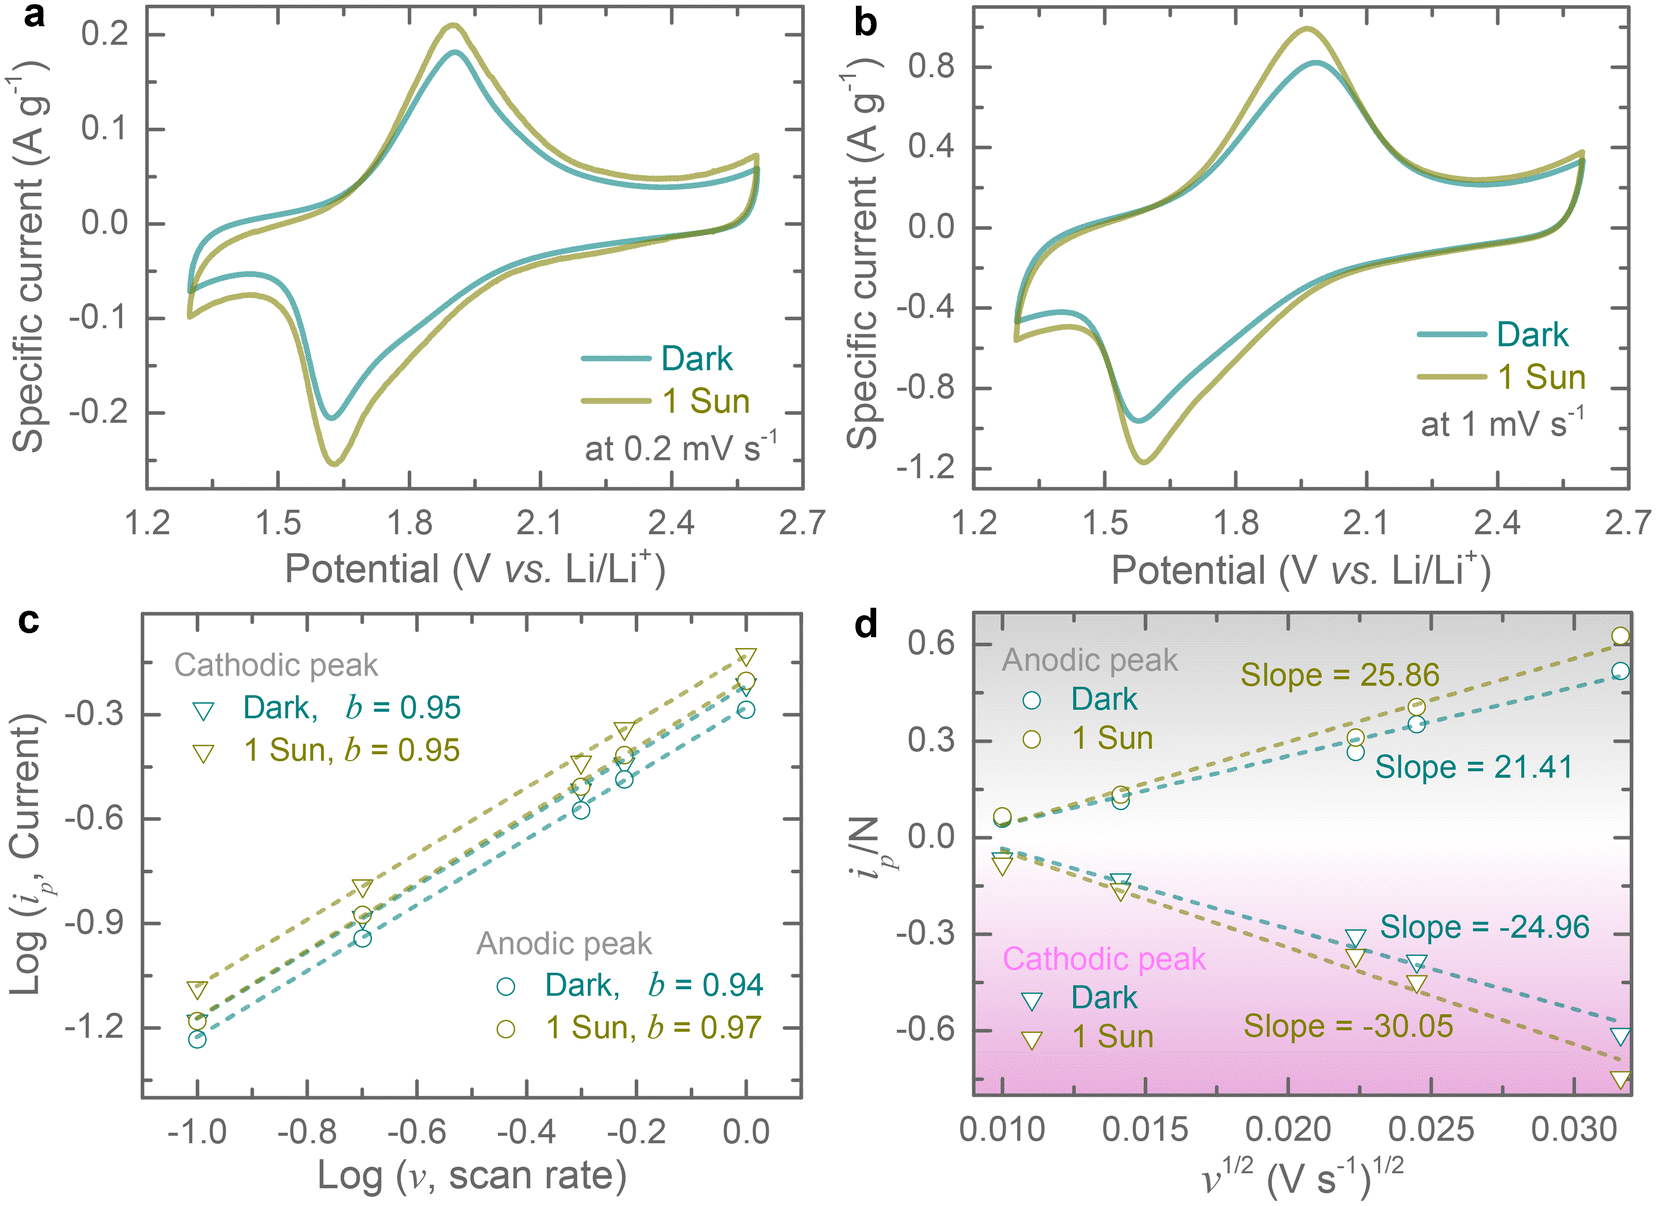 | ||
| Fig. 3 Electrochemical performance of Cu-HHB electrodes both in the dark and 1 sun illuminated conditions. (a and b) CV profiles at 0.2 mV s−1 and 1 mV s−1 in the dark and 1 sun illumination. (c) Plots of log (ip) vs. log(v): estimation of b-values for cathodic and anodic peaks in the dark and 1 sun illumination. (d) Estimation of Li-ion diffusion constant improvements under illumination from Ip/N vs. v1/2 curves. | ||
Galvanostatic discharge–charge (GDC) curves were recorded at different current densities ranging from 100 mA g−1 to 2000 mA h g−1 in the dark and 1 sun illumination (potential window of 1.3–2.6 V). As expected from the CVs profiles, the GDC curves show a single discharge/charge plateau which aligns with the CV results. Further, the specific capacity increases under illumination from 107 mA h g−1 to 126 mA h g−1 (∼ 17.76% enhancement) at 200 mA g−1 (Fig. 4a), and 79 mA h g−1 to 97 mA h g−1 (∼ 22.78% enhancement) at 2000 mA g−1 (Fig. 4b), respectively. The increasing capacitive improvement with specific current under illumination could be due to the increasing capacitive contributions. Additional comparative GDCs at specific currents of 100 mA g−1, 500 mA g−1 and 1000 mA g−1 in dark and illuminated conditions, are provided in the ESI (see Fig. S6†). dQ/dV curves extracted at 200 mA g−1 show a reduction in overpotential of 17 mV (see Fig. 4c) under illumination as compared to dark. The specific capacity improvements under illumination are attributed to the generation of photo-charges. Upon 1 sun illumination, electron–hole pairs are generated, resulting in electrons reaching LUMO and holes reaching HOMO. The introduction of rGO with the Cu-HHB matrix could facilitate the photo-charge separation and transportation as the LUMO energy of Cu-HHB (i.e. −3.56 eV relative to vacuum level) is energetically favourable for electron transfer to rGO with −4.4 eV work function relative to the vacuum level (see Fig. S1†).10,17 Electrochemical Impedance Spectroscopy (EIS) in dark and illuminated conditions was carried out to study the influence of light on the charge transfer processes. Fig. 4d shows the Nyquist plots acquired after the 2nd galvanostatic discharge cycle to 2.0 V in the frequency range of 10 mHz – 100 kHz at 10 mV voltage amplitude. It is observed that the photo-generated charges slightly reduce the charge transfer resistance from ∼66 Ω to ∼52 Ω under illumination.18
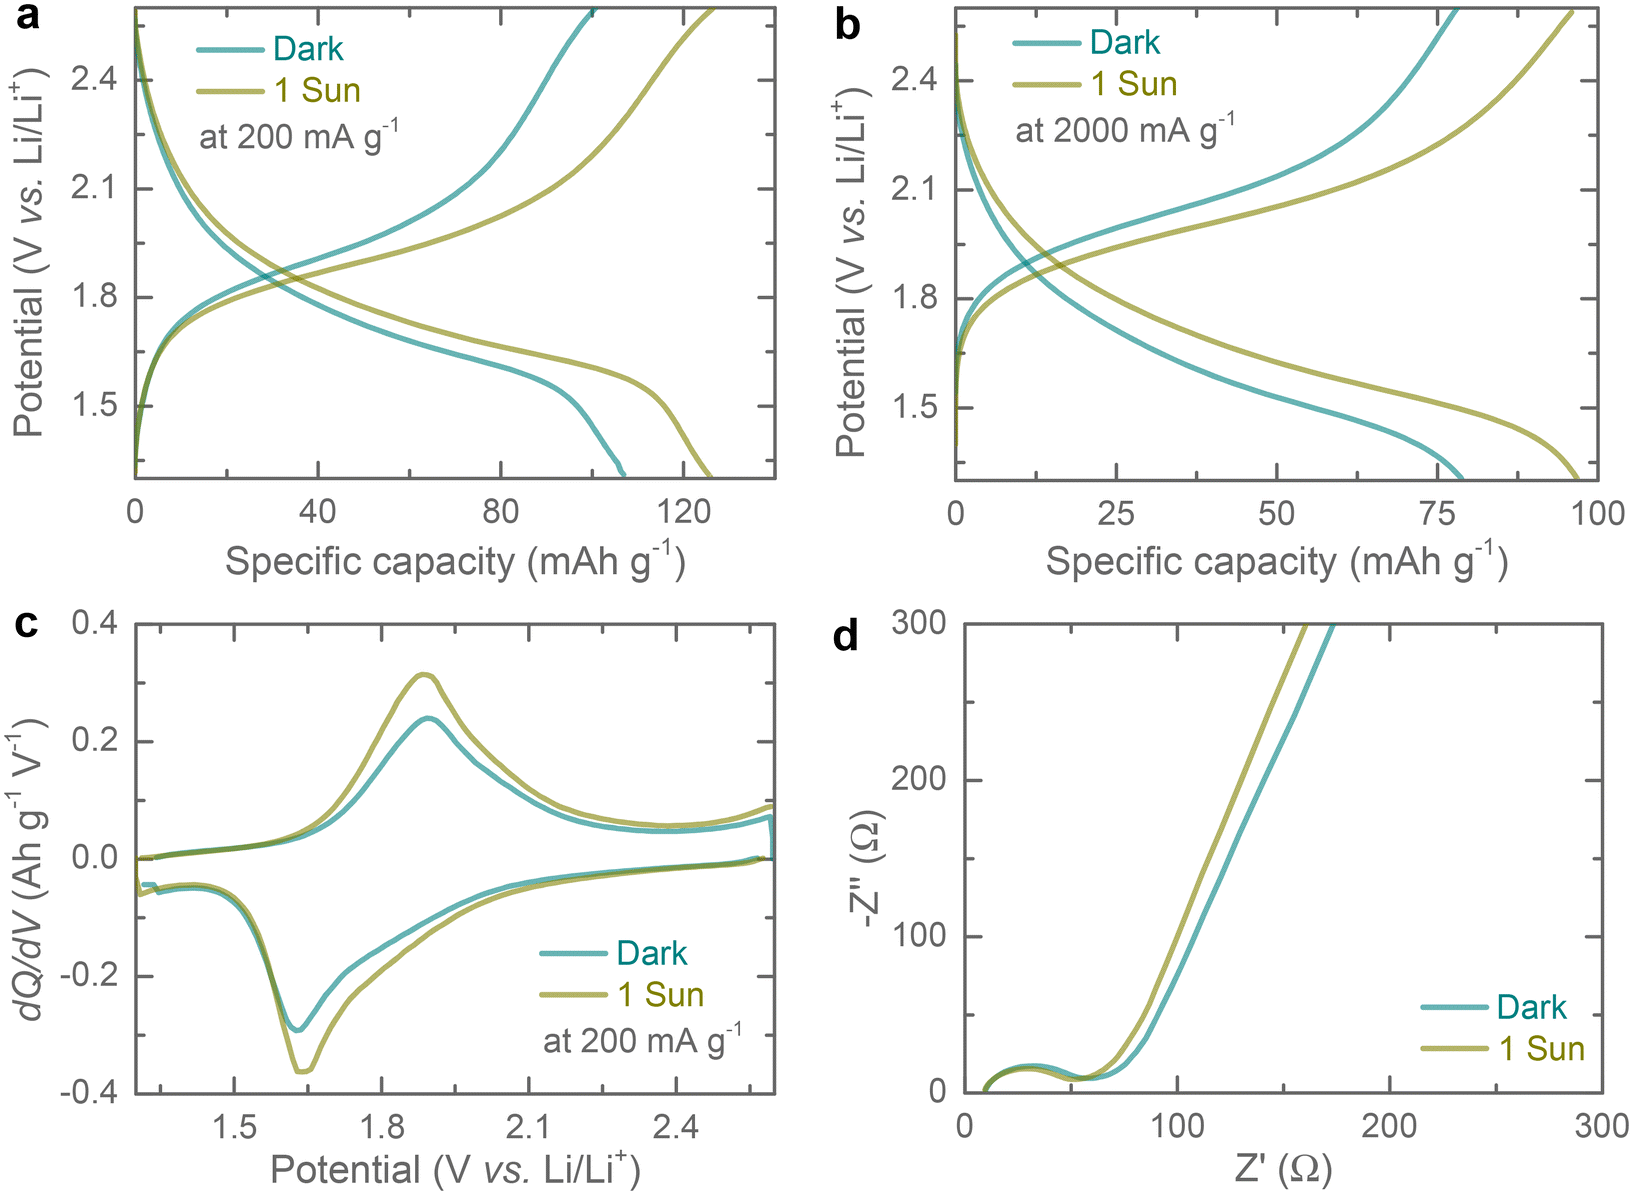 | ||
| Fig. 4 (a and b) GDC profiles at 200 mA g−1 and 2000 mA g−1 and (c) the respective dQ/dV curves at 200 mA g−1 in the dark and 1 sun illuminated conditions. (d) Nyquist plots of the Ph-LIB in the dark and 1 sun conditions. EIS results were recorded in the frequency range of 10 mHz – 100 kHz at 10 mV amplitude after the 2nd galvanostatic discharge cycle to 2 V. | ||
Rate specific capacity tests of the proposed Ph-LIBs both in the dark and under 1 sun illumination (see Fig. 5a), show a similar increase in specific capacities across different current densities. In other publications, the light enhancement is often times rate dependent, and the possible explanation for the difference observed here is that our cells do not show a substantial reduction in impedance under illumination which enhances high current density performance this is different from other materials reported previously which show a large decrease in impedance upon illumination.19–21 Finally, we tested the specific capacity retention over 500 cycles at a current density of 1000 mA g−1 (Fig. 5b). These Cu-HHB based LIBs show specific capacity retention of ∼67% and ∼55% after 100 and 500 cycles, with most of the specific capacity loss in the first 10 cycles.
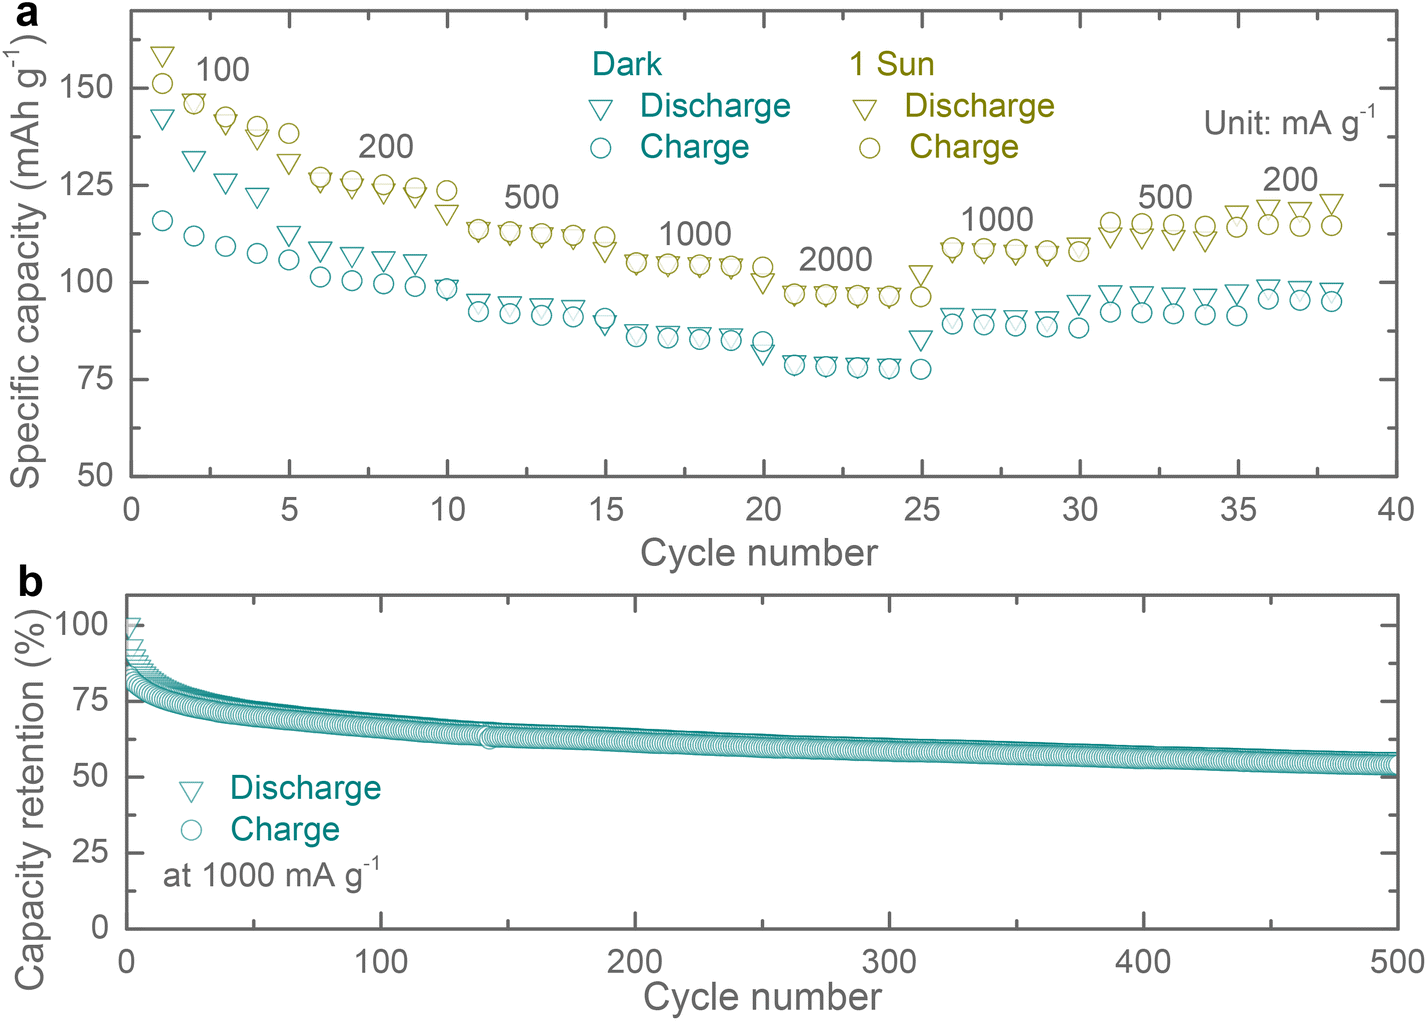 | ||
| Fig. 5 (a) Rate specific capacity tests in the dark and 1 sun illuminated conditions. (b) Long term cycling stability test at 1000 mA g−1 in dark condition, showing specific capacity retentions of ∼67% and ∼55% after 100 and 500 cycles. | ||
In conclusion, we report photo-enhanced LIBs using a Cu-HHB MOF mixed with rGO as photo-cathodes. These MOFs are attractive due to their low-cost, low toxicity and stability in ambient conditions. For photo-enhanced LIBs, Cu-HHB is attractive because it can simultaneously act as a photo-active and charge storage material. We show that illuminating the electrode enhances the diffusion kinetics and accelerates the rate performance. Under illumination, these electrodes also show an apparent specific capacity increase from 107 mA h g−1 to 126 mA h g−1 at 200 mA g−1 under 1 sun illumination. To the best of our knowledge, this is the first report of a MOF based photo-electrode and we anticipate that this may open a new class of light-enhanced batteries.
Conflicts of interest
The authors declare no competing financial interest.Acknowledgements
M. D. V acknowledges support from the ERC Consolidator grant MIGHTY – 866005.References
- J. Lv, J. Xie, A. G. A. Mohamed, X. Zhang and Y. Wang, Chem. Soc. Rev., 2022, 51, 1511–1528 RSC.
- A. Paolella, A. Vijh, A. Guerfi, K. Zaghib and C. Faure, J. Electrochem. Soc., 2020, 167, 120545 CrossRef CAS.
- A. D. Salunke, S. Chamola, A. Mathieson, B. D. Boruah, M. D. Volder and S. Ahmad, ACS Appl. Energy Mater., 2022, 5, 7891–7912 CrossRef CAS.
- A. Paolella, C. Faure, G. Bertoni, S. Marras, A. Guerfi, A. Darwiche and P. Hovington, et al. , Nat. Commun., 2017, 8, 14643 CrossRef CAS PubMed.
- N. Tewari, S. B. Shivarudraiah and J. E. Halpert, Nano Lett., 2021, 21, 5578–5585 CrossRef CAS PubMed.
- S. Ahmad, C. George, D. J. Beesley, J. J. Baumberg and M. D. Volder, Nano Lett., 2018, 18, 1856–1862 CrossRef CAS PubMed.
- B. D. Boruah, B. Wen and M. D. Volder, Nano Lett., 2021, 21, 3527–3532 CrossRef CAS PubMed.
- K. Kato, A. B. Puthirath, A. Mojibpour and M. Miroshnikov, et al. , Nano Lett., 2021, 21, 907–913 CrossRef CAS PubMed.
- Z. Wang, G. Wang, H. Qi, M. Wang and M. Wang, et al. , Chem. Sci., 2020, 11, 7665–7671 RSC.
- J. Park, A. C. Hinckley, Z. Huang and D. Feng, et al. , J. Am. Chem. Soc., 2018, 140, 14533–14537 CrossRef CAS PubMed.
- V. Augustyn, J. Come, M. A. Lowe, J. W. Kim, P.-L. Taberna, S. H. Tolbert, H. D. Abruña, P. Simon and B. Dunn, Nat. Mater., 2013, 12, 518–522 CrossRef CAS PubMed.
- B. D. Boruah, B. Wen and M. D. Volder, ACS Nano, 2021, 15, 16616–16624 CrossRef CAS PubMed.
- B. D. Boruah and M. D. Volder, J. Mater. Chem. A, 2021, 9, 23199–23205 RSC.
- V. Augustyn, J. Come, M. A. Lowe and J. W. Kim, et al. , Nat. Mater., 2013, 12, 518–522 CrossRef CAS PubMed.
- Y. W. Denis, C. Fietzek, W. Weydanz, K. Donoue, T. Inoue, H. Kurokawa and S. Fujitani, J. Electrochem. Soc., 2007, 154, A253 CrossRef.
- B. D. Boruah, A. Mathieson, S. K. Park and X. Zhang, et al. , Adv. Energy Mater., 2021, 11, 2100115 CrossRef.
- B. D. Boruah, A. Mathieson, B. Wen, C. Jo, F. Deschler and M. D. Volder, Nano Lett., 2020, 20, 5967–5974 CrossRef CAS PubMed.
- B. D. Boruah, A. Mathieson, B. Wen, S. Feldmann, W. M. Dose and M. D. Volder, Energy Environ. Sci., 2020, 13, 2414–2421 RSC.
- J. Wang, Y. Wang, C. Zhu and B. Liu, ACS Appl. Mater. Interfaces, 2022, 14, 4071–4078 CrossRef CAS PubMed.
- Q. Zhang, M. Wei, Q. Dong, Q. Gao, X. Cai, S. Zhang, T. Yuan, F. Peng, Y. Fang and S. Yang, J. Energy Chem., 2022 DOI:10.1016/j.jechem.2022.11.029.
- X. Zhang, W.-L. Song, M. Wang, J. Tu, H. Jiao and S. Jiao, Energy Storage Mater., 2022, 45, 586–594 CrossRef.
Footnote |
| † Electronic supplementary information (ESI) available: Experimental section; energy band diagram of the photo-cathode (Fig. S1); SEM of Cu-HHB (Fig. S2); XPS of Cu-HHB (Fig. S3); CV curves (Fig. S4); GDC curves (Fig. S4). See DOI: https://doi.org/10.1039/d3nr00257h |
| This journal is © The Royal Society of Chemistry 2023 |