Transforming exciton dynamics in perovskite nanocrystal through Mn doping†
Soumen
Mukherjee
a,
Swarnali
Ghosh
 a,
Dibyendu
Biswas
a,
Mainak
Ghosal
a,
Kheyali
De
a and
Prasun K.
Mandal
a,
Dibyendu
Biswas
a,
Mainak
Ghosal
a,
Kheyali
De
a and
Prasun K.
Mandal
 *ab
*ab
aDepartment of Chemical Sciences, Indian Institute of Science Education and Research (IISER) Kolkata, Mohanpur, West Bengal 741246, India
bCentre for Advanced Functional Materials, Indian Institute of Science Education and Research (IISER) Kolkata, Mohanpur, West Bengal 741246, India. E-mail: prasunchem@iiserkol.ac.in
First published on 8th March 2023
Abstract
Zn-alloyed CsPb(Cl/Br)3 perovskite nanocrystals (PNCs) have been synthesized and used as a model system for Mn doping in order to understand the effect of Mn doping on exciton dynamics. While keeping the PL emission maximum and PLQY of both PNC samples nearly the same, the radiative decay rate of the host band decreases ∼6.5 times and the non-radiative decay rate increases ∼2.5 times upon Mn doping. Unlike reports in the literature in which the dopant emission decreases to near-zero, in the present case we observe ∼5.5-fold enhancement of the integrated PL intensity of the dopant emission when the temperature decreases from 290 K to 190 K. Interestingly, the FWHM of the host PL emission band increases with a decrease in temperature from 290 K to 190 K. A higher value of phonon energy in PNC2 (58 ± 2 meV) in comparison to CsPbBr3 has been noted. The low magnitude of the Huang–Rhys factor indicates less electron phonon coupling for the Mn-doped PNC system. Temperature-dependent dopant PL decay exhibits biexponential decay behaviour with time constants τ1 = 450–540 μs and τ2 = 1.1–1.2 ms. With a decrease in temperature from 290 K to 190 K, the amplitude of the faster component decreases from 80% to 60%; concomitantly, the amplitude of the slower component increases from 20% to 40%. Ultrasensitive single-particle spectroscopic analyses reveal that, although the probability density distributions (PDDs) of the durations of both ON and OFF events of PNC1 could be fitted with a truncated inverse power law (TIPL), however, for PNC2, both PDDs could be fitted with an inverse power law (IPL). A comparatively lower value of the power law exponent mON indicates a higher probability of longer ON events for PNC1 than for PNC2. Truncation in the PDDs of both ON and OFF events has been observed for PNC1, but not in the PDDs of either ON or OFF events for PNC2. The presence of shallow trap states is responsible for the truncation for PNC1, whereas the presence of deep dopant states does not allow truncation in the host PL emission of PNC2. All these observations clearly demonstrate that Mn doping transforms the host PL exciton dynamics for Zn-alloyed Mn-doped CsPb(Cl/Br)3 PNCs very significantly.
Introduction
Doping a perovskite nanocrystal (PNC) with a metal ion creates both size and charge perturbation in the crystal.1 An Mn2+ ion has been the most popular ion for doping in PNCs and for this dopant, optical switching of photoluminescence (PL) emission takes place from green/blue to orange. Among the different kinds of PNC available, Mn doping has been undertaken mostly in pure-halide PNCs (e.g. CsPbCl3 or CsPbBr3).2–6 However, Mn doping in a mixed-halide (say Cl/Br) PNC has not been explored in detail. This kind of mixed-halide system has a higher bandgap than the CsPbBr3 PNC system. Therefore, a mixed-halide PNC system would be an interesting choice of perovskite material in order to investigate the effect of Mn doping on the exciton dynamics of the PNC.In recent years, Zn alloying has been utilized as a strategy towards enhancing the optical quality of different types of quantum dots (QDs) from CdSe and InP to CuInS2 based QDs7–12 and also PNCs (Table S1†).13–18
Hence in order to investigate the exciton dynamics of mixed-halide PNCs, Zn-alloyed Mn-doped CsPb(Cl/Br)3 PNCs were chosen in such a way that the band-edge PL emission is significantly higher in energy (say 150 nm or 0.7 eV) than the dopant PL emission maximum (∼600 nm).
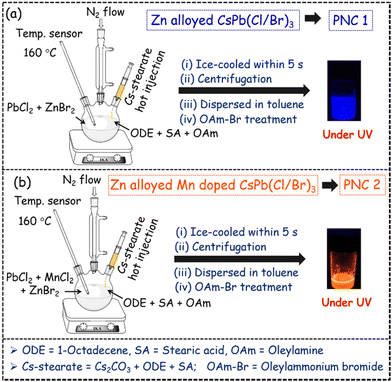
Zn-alloyed CsPb(Cl/Br)3 PNCs, without and with Mn doping (termed PNC1 and PNC2, respectively), have been synthesized following a modified procedure from the literature3 (Scheme 1). In summary, PbCl2 and ZnBr2 were taken as precursor salts for the synthesis of PNC1, whereas PbCl2, ZnBr2 and MnCl2 were taken as precursor salts for the synthesis of PNC2. Hot Cs-stearate was injected at 160 °C for both PNC syntheses and quickly cooled down to room temperature. Both PNCs were purified and dispersed in toluene. Treatment with the required amount of oleylammonium bromide yielded the desired PNC1 and PNC2, with similar host emission maxima (∼450 nm). (For the detailed synthesis procedure, see pages S3 and S4.) PNC1 and PNC2 were characterized by ICP-MS, TEM, PXRD etc. (see pages S5–S7, Fig. S1, Tables S2 and S3†).
Results and discussion
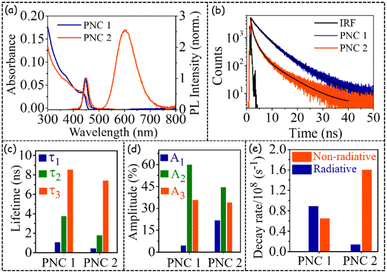
The steady-state and time-resolved optical behaviours of both PNC1 and PNC2 are depicted in Fig. 1.As can be seen from Fig. 1 and Table 1, the steady-state optical behaviours (e.g. absorption maximum, PL emission maximum (Fig. 1a), PLQY value etc.) of PNC1 and PNC2 are nearly identical, and the same have been made purposely through iterative synthesis steps, so that the effect of Mn doping on exciton dynamics can be investigated properly.
| PNCs | Spectral | Temporal | ||||||||||
|---|---|---|---|---|---|---|---|---|---|---|---|---|
| Band edge (nm) | λ maxem (nm) | FWHM (nm) | Stokes shift (nm) | PLQY | τ 1 (ns) (A1, %) | τ 2 (ns) (A2, %) | τ 3 (ns) (A3, %) | 〈τ〉 (ns) | χ 2 | k r (s−1) | k nr (s−1) | |
| PNC1 | 441 | 447 | 20 | 6 | 0.58 | 1.08 (4.4) | 3.75 (60.0) | 8.55 (35.6) | 6.46 | 1.06 | 8.9 × 10⁷ | 6.5 × 10⁷ |
| PNC2 | 440 | 450 (host) | 24 | 10 | 0.56 (total) | 0.44 (21.8) | 1.80 (44.3) | 7.41 (33.9) | 5.90 | 1.19 | 1.4 × 10⁷ | 1.6 × 10⁸ |
| 601 (dopant) | 92 | 161 | ||||||||||
Zn alloying has been shown to improve PLQY values for several QDs7–12 or PNCs13–18 (Table S1†). In the current Zn-alloyed Mn-doped CsPb(Cl/Br)3 PNC system a similar observation has also been made (Table S4†). CsPb(Cl/Br)3 PNCs with an absorption band edge at ∼440 nm and PL emission maximum at ∼450 nm (Fig. 1a and Table 1) have been shown to have a PLQY of <40%.19 However, through Zn alloying, we could achieve a PLQY of 58% for 450 nm emitting CsPb(Cl/Br)3 PNCs, confirming literature reports13–18 of enhancing the PLQY value through Zn alloying. Such a high PLQY value is necessary because Mn doping has been shown to decrease the PLQY value of host PL emission very significantly.20–25 We have observed that because of Mn doping, the PLQY value of the host band decreases from 58% to 8% (keeping the total PLQY value of 56% (Table 1)).
From Fig. 1b,c and Table 1, it is quite evident that in the presence of Mn doping, PL decay becomes quite faster (Fig. 1b and c). Such an observation has been reported for Mn-doped CsPbBr3 PNCs;20 however, detailed investigation of PL decay because of Mn doping has not been reported. Fitting the host PL decay with a triexponential decay function (see pages S4 and S5†) revealed that both the shortest lifetime (τ1) and the intermediate lifetime (τ2) decrease more than two-fold (τ1: from 1.08 ns for PNC1 to 0.44 ns for PNC2; τ2: from 3.75 ns for PNC1 to 1.80 ns for PNC2). In contrast, the longest lifetime (τ3) decreases marginally (from 8.45 ns for PNC1 to 7.45 ns for PNC2) (Fig. 1c and Table 1). Additionally, as we go from PNC1 to PNC2, the amplitude of τ1 increases from ∼4% to ∼21% and the amplitude of τ2 decreases from ∼60% to ∼44%, whereas the amplitude of τ3 remains nearly identical (Fig. 1d and Table 1). Moreover, the magnitude of the radiative decay rate decreases ∼6.5-fold (from 8.9 × 10⁷ s−1 to 1.4 × 10⁷ s−1), and the magnitude of the non-radiative decay rate increases ∼2.5-fold (from 6.5 × 10⁷ s−1 to 1.6 × 10⁸ s−1) as we go from PNC1 to PNC2 (Fig. 1e and Table 1) (for calculations of radiative and non-radiative decay rates, see ESI, page S9†). All these interesting observations point to the fact that the presence of Mn creates a very significant non-radiative pathway for the host band in Zn-alloyed Mn-doped CsPb(Cl/Br)3 PNCs.
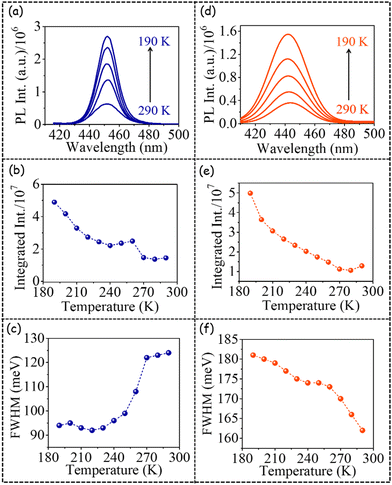
As the next step, we investigated the temperature (290 K to 190 K) dependent PL emission of the host band of both PNC1 and PNC2 (Fig. 2, Fig. S2†). The PL emission spectra, integrated PL intensity and FWHM of PL emission of PNC1 (a, b, c, respectively, in Fig. 2) and PNC2 (d, e, f, respectively, in Fig. 2) have been plotted. The PL emission maximum remained nearly invariant w.r.t. temperature variation for both PNC1 and PNC2 (Fig. S3†).
The integrated PL intensity increased ∼5-fold with decreasing temperature (from 290 K to 190 K) for both PNC1 (Fig. 2b) and PNC2 (Fig. 2e). In the literature, it has been reported that the intensity of the host band remains nearly constant with a decrease in temperature from 290 K to 190 K for both undoped and Mn-doped PNCs.21 However, in the present case we have observed a 5-fold enhancement in integrated PL intensity. Such a high degree of enhancement of host emission with a decrease in temperature from 290 K to 190 K points to the better optical quality of the Zn-alloyed CsPb(Cl/Br)3 PNCs in comparison to unalloyed ones.
Quite interestingly, the FWHM of (host) PL emission exhibited differential temperature-dependent behaviours for PNC1 (Fig. 2c) and PNC2 (Fig. 2f). At 290 K, the FWHM of the host-only PL emission of PNC1 is 124 meV and that of host PL emission of PNC2 is 162 meV. Thus, the FWHM of (host) PL emission increases upon Mn doping. For PNC1, as the temperature is decreased from 290 K to 190 K, the FWHM of host-only PL emission decreases from 124 meV to 94 meV. Thus, band-narrowing or sharpening of host-only PL emission (by 30 meV) happens with decreasing temperature.
However, for PNC2, the FWHM of host PL emission increases from 162 meV to 181 meV (i.e. band broadening by 19 meV) as the temperature decreases from 290 K to 190 K. This observation signifies that upon Mn doping not only does the PL emission of the host band become broader, but upon cooling it becomes even broader. If we compare the FWHM of (host) PL emission at 190 K, the magnitude for PNC2 becomes nearly twice that for PNC1. Thus, we can conclude that Mn doping makes the (host) PL emission significantly broader. There has been no such report for Mn-doped PNCs in the literature. In both PNC1 and PNC2, PL emission is not observed above 480 nm. Although not observed in PNC1, for PNC2, PL emission is observed below 430 nm and extends up to 410 nm. All the above-mentioned observations point to the fact that perhaps in the presence of Mn doping, host PL emission occurs from more than one state, signifying the involvement of higher energy (trap) states in the presence of Mn doping.
Although in the presence of Mn doping PL emission from low-lying trap states has been reported in the literature,21 the presence of PL emission from higher energy (trap) states has not been invoked in the literature so far.
To delve deeper we also investigated the temperature-dependent dopant emission of PNC2 (Fig. 3). The PL emission maximum has been observed to remain nearly invariant as the temperature is decreased (Fig. S3†). In all literature reports, dopant PL emission has been shown to decrease to nearly zero as the temperature is decreased from 290 K to 190 K (Table S4†).21–25 However, in the present case, the PL intensity of dopant emission in PNC2 has been shown to increase (Fig. 3a) and the integrated PL intensity has been observed to increase ∼5.5-fold with a decrease in temperature from 290 K to 190 K (Fig. 3b). Such a temperature-dependent enhancement in PL integrated intensity makes these PNCs quite interesting and different from similar systems reported earlier.
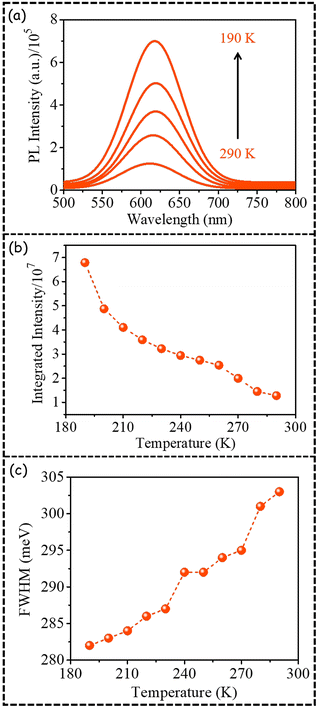 | ||
| Fig. 3 Temperature-dependent (a) PL emission, (b) integrated PL intensity, and (c) FWHM of dopant PL emission in PNC2 (the line joining the data points has been provided for visual clarity). | ||
Unlike host emission (Fig. 2f), the FWHM of dopant emission of PNC2 decreases from 303 meV to 282 meV with a decrease in temperature from 290 K to 190 K (Fig. 3c). From these values we calculated the magnitude of (a) the Huang–Rhys factor to be 4 ± 0.5 and (b) the phonon energy to be 58 ± 2 meV (Fig. S4†). Although not reported for the host band of any (Cl/Br) mixed-halide PNCs, for CsPbBr3 PNCs, the magnitudes of the Huang–Rhys factor and phonon energy have been reported to be 3.2 and 28.01 meV, respectively.26 A low magnitude of the Huang–Rhys factor indicates less electron phonon coupling for PNC systems.
Differential variation of the FWHM of host and dopant emission in the same PNC is quite rare. In the literature the FWHM values of both host and dopant PL emission have been shown to decrease as the temperature is decreased from 290 K to 190 K.21 Thermal band narrowing with decreasing temperature is the usual observation, but the FWHM of host PL emission in PNC2 increases as the temperature is decreased (Fig. 2f), which is quite unusual. Such an unusual observation hints towards the differential nature of host and dopant PL emission energy states.
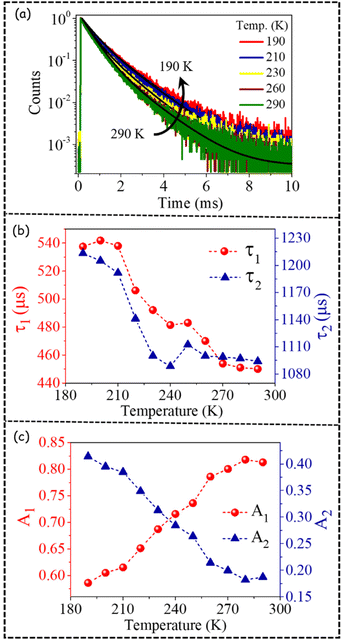
In order to gain a deeper understanding, we also investigated the temperature-dependent PL decay of the dopant emission of PNC2 (Fig. 4a, Fig. S5†). PL decay curves could be fitted with a biexponential decay equation, as depicted below:
 | (1) |
By fitting the dopant PL decay, biexponential time constants in the order of τ1 = 450–540 μs and τ2 = 1.1–1.2 ms were obtained, indicating two channels of PL decay (Fig. 4b). As the temperature decreases, the magnitude of both lifetime values increases (Fig. 4b, Table S5†). We have observed that the average excited state lifetime of dopant emission is ∼700 μs and that this value increases to ∼950 μs as the temperature decreases from 290 K to 190 K. It is important to mention here that the PL decay of dopant emission is generally fitted with a single exponential decay function with a time constant of ∼1.3 ms.21,27 This kind of differential observation points to the fact that perhaps the faster component could not be resolved in earlier investigations. Importantly, the amplitude of the faster time component is higher in magnitude than the slower time component (Fig. 4c, Table S5†). More interestingly with the change in temperature, amplitudes of these two decay channels vary significantly in a mutual manner (Fig. 4c). As the temperature is decreased from 290 K to 190 K, the amplitude of the faster component decreases from 80% to 60% (Fig. 4c). Concomitantly, the amplitude of the slower component increases from 20% to 40% as the temperature is decreased from 290 K to 190 K (Fig. 4c). Thus, not only are two channels of PL decay observed for the first time, but a temperature-dependent modulation of the amplitudes of a biexponential decay function is also clearly depicted.
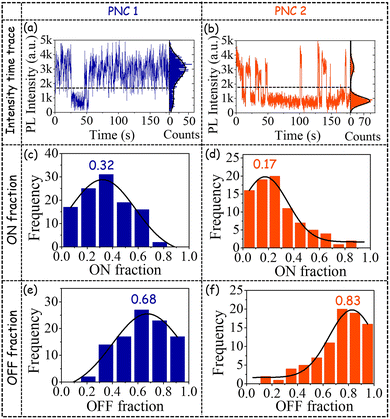
In order to gain an even deeper understanding of the optical behaviour, we performed ultrasensitive single-particle spectroscopic (SPS) investigations on both PNC1 and PNC2. SPS investigation on Mn-doped PNCs is quite rare. Typical time traces with bimodal intensity distributions of PNC1 and of the host PL emission of PNC2 are shown in Fig. 5a and b, respectively. A horizontal dashed line depicts the threshold above which any intensity is designated as ON and below which it is designated as OFF. (For details of instrumentation and analyses related to SPS, see page S13.†)
The frequency distribution of the ON fractions of the host band for PNC1 has its peak at 0.32 (Fig. 5c) and that for PNC2 has its peak at a much lower value of 0.17 (Fig. 5d). Concomitantly, the frequency distribution of the OFF fractions of the host band for PNC1 has its peak at 0.68 (Fig. 5e) and that for PNC2 has its peak at a much higher value of 0.83 (Fig. 5f).
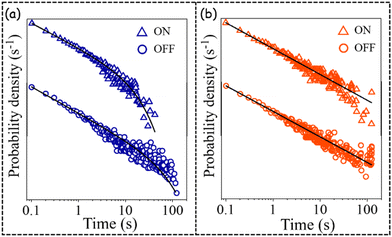
The higher peak value of the distributions of ON fraction for PNC1 in comparison to PNC2 corroborates well with the higher PLQY of the host band for PNC1.8,10,11,28–35 These SPS-based observations point to the fact that because of Mn doping (the host band of) PNC2 spends more time in the OFF state in comparison to undoped PNC, i.e. PNC1. The probability density distributions (PDDs) of the durations of ON and OFF events of PNC1 could be fitted well (Fig. 6a) with a truncated inverse power law (TIPL) equation, as depicted below:
 | (2) |
However, the PDDs of the durations of ON and OFF events of the host PL emission band of PNC2 could be fitted well with a much simpler inverse power law (IPL, eqn (3)) (Fig. 6b):
 | (3) |
A lower value of the power law exponent mON for PNC1 in comparison to PNC2 (Table 2) indicates a higher probability of longer ON events for PNC1 than for PNC2. Truncation of the PDDs of both ON and OFF events has been observed only for PNC1. The ratio of τC,ON/τC,OFF is much less than 1, signifying the electron detrapping rate is much slower than the trapping rate for PNC1. A truncation time has not been observed in the PDDs of the duration of either ON events or OFF events for PNC2.
| PNCs | Peak of ON fraction distribution | Peak of OFF fraction distribution | m ON | m OFF | τ C,ON (=1/kON) [s] | τ C,OFF (=1/kOFF) [s] |
|---|---|---|---|---|---|---|
| PNC1 | 0.32 | 0.68 | 1.39 | 1.50 | 7.14 | 35.71 |
| PNC2 | 0.17 | 0.83 | 1.59 | 1.57 | –– | –– |
In the case of PNC1, because of the presence of shallow (low-lying) trap states, truncation has been observed for the PDDs of the durations of both ON and OFF events. However, for PNC2, because of the deep (much lower lying) dopant state, the electron, instead of going to shallow trap states, prefers to go to deep ones; hence the more stabilized dopant state. Thus, because of the involvement of deep dopant states, truncation is not observed for the host PL emission of PNC2. All these observations clearly indicate that Mn doping transforms the single-particle exciton dynamics of PNCs very significantly.
Conclusions
In conclusion, for Zn-alloyed CsPb(Cl/Br)3 PNCs (i.e. PNC1) with nearly the same PL emission maximum, PLQY etc. as those of Zn-alloyed Mn-doped CsPb(Cl/Br)3 PNCs (i.e. PNC2), the radiative decay rate associated with the host band has been shown to decrease ∼6.5-fold and the non-radiative decay rate has been shown to increase ∼2.5-fold upon Mn doping. Unlike literature reports, in which dopant emission has been shown to decrease to zero, in the present case we report a 5.5-fold enhancement in the integrated PL intensity of dopant emission, when the temperature is decreased from 290 K to 190 K. Quite interestingly, the FWHM of the host PL emission band increases with a decrease in temperature from 290 K to 190 K for PNC2, perhaps hinting towards emission from a new state when the temperature is lowered. From the temperature-dependent variation in the FWHM of dopant PL emission, the magnitudes of the Huang–Rhys factor and phonon energy have been calculated to be 4 ± 0.5 and 58 ± 2 meV, respectively. The low value of the Huang–Rhys factor indicates less electron phonon coupling for the Zn-alloyed Mn-doped CsPb(Cl/Br)3 PNC system. Temperature-dependent dopant PL decay exhibited biexponential decay behaviour with the time constants τ1 = 450–540 μs and τ2 = 1.1–1.2 ms. As the temperature decreases from 290 K to 190 K: (a) the amplitude of the faster time component decreases from 80% to 60%, (b) the amplitude of the slower time component increases from 20% to 40%, (c) the average excited state lifetime increases from ∼700 μs to ∼950 μs. Ultrasensitive single-particle spectroscopic analyses revealed that although the PDDs of the durations of both ON and OFF events of PNC1 could be fitted with TIPL, for PNC2, both PDDs could be fitted with IPL. The lower value of the power law exponent mON for PNC1 in comparison to PNC2 indicates the higher probability of longer ON events for PNC1 than for PNC2. Truncation in the PDDs of both ON and OFF events has been observed for PNC1. However, the same has not been observed in the PDDs of either ON or OFF events for PNC2. The presence of shallow trap states is responsible for truncation in the PDDs of both ON and OFF events for PNC1, whereas the presence of deep dopant states does not allow truncation in the PDDs of both ON and OFF events for the host PL emission of PNC2. All these observations clearly demonstrate that Mn doping transforms the host PL exciton dynamics for Zn-alloyed Mn-doped CsPb(Cl/Br)3 PNCs very significantly.Author contributions
PKM envisaged the project. SM and DB synthesized and characterized the PNCs. SM, SG, DB, MG and KD recorded ensemble-level optical spectroscopic data. SM, SG and MG performed temperature-dependent PL measurements. SM, SG and DB performed SPS measurements and analysed the data. SM and PKM wrote the manuscript.Conflicts of interest
The authors declare no conflict of interest.Acknowledgements
PKM thanks IISER Kolkata for financial help and instrumental facilities. Financial support from the SERB-DST India, Project No. CRG/2019/003605 is gratefully acknowledged. SM, SG and KD thank DST-INSPIRE for fellowship. DB gratefully acknowledges fellowship from SERB-DST project (CRG/2019/003605). MG thanks CSIR and PMRF for fellowship.References
- N. Pradhan, J. Phys. Chem. Lett., 2019, 10, 2574–2577 CrossRef CAS PubMed.
- W. Liu, Q. Lin, H. Li, K. Wu, I. Robel, J. M. Pietryga and V. I. Klimov, J. Am. Chem. Soc., 2016, 138, 14954–14961 CrossRef CAS PubMed.
- A. De, N. Mondal and A. Samanta, Nanoscale, 2017, 9, 16722–16727 RSC.
- Y. Xinga, X. Yuan, S. Ji, M. Ikezawa, R. Zeng, H. Li, Y. Masumotob and J. Zhaoa, J. Lumin., 2018, 204, 10–15 CrossRef.
- D. Parobek, Y. Dong, T. Qiao and D. H. Son, Chem. Mater., 2018, 30, 2939–2944 CrossRef CAS.
- S. Ji, X. Yuan, J. Li, J. Hua, Y. Wang, R. Zeng, H. Li and J. Zhao, J. Phys. Chem. C, 2018, 122, 23217–23223 CrossRef CAS.
- D. Roy, T. Routh, A. V. Asaithambi, S. Mandal and P. K. Mandal, J. Phys. Chem. C, 2016, 120, 3483–3491 CrossRef CAS.
- S. Ghosh, S. Mandal, S. Mukherjee, C. K. De, T. Samanta, M. Mandal, D. Roy and P. K. Mandal, J. Phys. Chem. Lett., 2021, 12, 1426–1431 CrossRef CAS PubMed.
- C. K. De, T. Routh, D. Roy, S. Mandal and P. K. Mandal, J. Phys. Chem. C, 2018, 122, 964–973 CrossRef CAS.
- C. K. De, S. Mandal, D. Roy, S. Ghosh, A. Konar and P. K. Mandal, J. Phys. Chem. C, 2019, 123, 28502–28510 CrossRef CAS.
- D. Roy, A. Das, C. K. De, S. Mandal, P. R. Bangal and P. K. Mandal, J. Phys. Chem. C, 2019, 123, 6922–6933 CrossRef CAS.
- D. Roy, C. K. De, S. Ghosh, S. Mukherjee, S. Mandal and P. K. Mandal, Phys. Chem. Chem. Phys., 2022, 24, 8578–8590 RSC.
- X. Shen, Y. Zhang, S. V. Kershaw, T. Li, C. Wang, X. Zhang, W. Wang, D. Li, Y. Wang and M. Lu, et al. , Nano Lett., 2019, 19, 1552–1559 CrossRef CAS PubMed.
- C. Bi, X. Sun, X. Huang, S. Wang, J. Yuan, J. X. Wang, T. Pullerits and J. Tian, Chem. Mater., 2020, 32, 6105–6113 CrossRef CAS.
- Y. Guo, J. Su, L. Wang, Z. Lin, Y. Hao and J. Chang, J. Phys. Chem. Lett., 2021, 12, 3393–3400 CrossRef CAS PubMed.
- V. Naresh and N. Lee, ACS Appl. Nano Mater., 2020, 3, 7621–7632 CrossRef CAS.
- S. Thapa, G. C. Adhikari, H. Zhu, A. Grigoriev and P. Zhu, Sci. Rep., 2019, 9, 18636 CrossRef CAS PubMed.
- R. Chen, Y. Xu, S. Wang, C. Xia, Y. Liu, B. Yu, T. Xuan and H. Li, J. Alloys Compd., 2021, 866, 158969 CrossRef CAS.
- Q. A. Akkerman, V. D'Innocenzo, S. Accornero, A. Scarpellini, A. Petrozza, M. Prato and L. Manna, J. Am. Chem. Soc., 2015, 137, 10276–10281 CrossRef CAS PubMed.
- T. Cai, J. Wang, W. Li, K. Hills-Kimball, H. Yang, Y. Nagaoka, Y. Yuan, R. Zia and O. Chen, Adv. Sci., 2020, 2001317 CrossRef CAS PubMed.
- V. Pinchetti, A. Anand, Q. A. Akkerman, D. Sciacca, M. Lorenzon, F. Meinardi, M. Fanciulli, L. Manna and S. Brovelli, ACS Energy Lett., 2019, 4, 85–93 CrossRef CAS.
- X. Yuan, S. Ji, M. C. De Siena, L. Fei, Z. Zhao, Y. Wang, H. Li, J. Zhao and D. R. Gamelin, Chem. Mater., 2017, 29, 8003–8011 CrossRef CAS.
- K. Xu and A. Meijerink, Chem. Mater., 2018, 30, 5346–5352 CrossRef CAS PubMed.
- S. Ji, X. Yuan, S. Cao, W. Ji, H. Zhang, Y. Wang, H. Li, J. Zhao and B. Zou, J. Phys. Chem. Lett., 2020, 11, 2142–2149 CrossRef CAS PubMed.
- Y. Xing, X. Yuan, S. Ji, M. Ikezawa, R. Zeng, H. Li, Y. Masumoto and J. Zhao, J. Lumin., 2018, 204, 10–15 CrossRef CAS.
- X. Lao, Z. Yang, Z. Su, Z. Wang, H. Ye, M. Wang, X. Yao and S. Xu, Nanoscale, 2018, 10, 9949–9956 RSC.
- A. K. Guria, S. K. Dutta, S. D. Adhikari and N. Pradhan, ACS Energy Lett., 2017, 2, 1014–1021 CrossRef CAS.
- S. Mandal, S. Mukherjee, C. K. De, D. Roy, S. Ghosh and P. K. Mandal, J. Phys. Chem. Lett., 2020, 11, 1702–1707 CrossRef CAS PubMed.
- S. Mandal, S. Ghosh, S. Mukherjee, C. K. De, D. Roy, T. Samanta and P. K. Mandal, Nanoscale, 2021, 13, 3654–3661 RSC.
- C. K. De, D. Roy, S. Mandal and P. K. Mandal, J. Phys. Chem. Lett., 2019, 10, 4330–4338 CrossRef CAS PubMed.
- D. Roy, S. Ghosh, C. K. De, S. Mukherjee, S. Mandal and P. K. Mandal, J. Phys. Chem. Lett., 2022, 13, 2404–2417 CrossRef CAS PubMed.
- S. Ghosh, S. Mukherjee, S. Mandal, C. K. De, S. Mardanya, A. Saha and P. K. Mandal, J. Phys. Chem. Lett., 2023, 14, 260–266 CrossRef CAS PubMed.
- S. Mandal, S. Ghosh, S. Mukherjee, D. Roy, C. K. De, K. Mukhuti and P. K. Mandal, J. Phys. Chem. Lett., 2021, 12, 10169–10174 CrossRef CAS PubMed.
- S. Mandal, D. Roy, C. K. De, S. Ghosh, M. Mandal, A. Das and P. K. Mandal, Nanoscale Adv., 2019, 1, 3506–3513 RSC.
- D. Roy, S. Mandal, C. K. De, K. Kumar and P. K. Mandal, Phys. Chem. Chem. Phys., 2018, 20, 10332–10344 RSC.
Footnote |
| † Electronic supplementary information (ESI) available. See DOI: https://doi.org/10.1039/d3nr00241a |
| This journal is © The Royal Society of Chemistry 2023 |

