
Highly luminescent dual-phase CsPbBr3/Cs4PbBr6 microcrystals for a wide color gamut for backlight displays†
V.
Naresh
*a,
Taehyung
Jang
b,
Yoonsoo
Pang
 b and
Nohyun
Lee
*a
b and
Nohyun
Lee
*a
aSchool of Advanced Materials Engineering, Kookmin University, Seoul 02707, Republic of Korea. E-mail: naresh17@kookmin.ac.kr; nohyunlee@kookmin.ac.kr
bDepartment of Chemistry, Gwangju Institute of Science and Technology, 123 Cheomdangwagi-ro, Gwangju 61005, Republic of Korea
First published on 16th November 2022
Abstract
Cesium lead bromide perovskite nanocrystals (NCs) embedded in Cs4PbBr6 or CsPb2Br5 matrices forming core/shell structures are promising luminescent materials that exhibit remarkable photoluminescence properties meeting the need in a wide range of applications while overcoming stability challenges. Here, we report the large-scale, ligand-free synthesis of dual-phase Cs4PbBr6/CsPbBr3 microcrystals (MCs) using ultrasonication at room temperature, exhibiting a high photoluminescence quantum yield (PLQY) of 82.7% and good stability. High-resolution transmission electron microscopy and X-ray photoelectron characterization confirm that CsPbBr3 NCs are embedded in the Cs4PbBr6 matrix-forming CsPbBr3/Cs4PbBr6 dual-phase structure. The evolution of the luminescence properties with temperature suggests that the strong green emission results from direct exciton recombination in the isolated [PbBr6]4− octahedra, which possess a large exciton binding energy of 283.6 meV. As revealed from their emission intensities, the dual-phase CsPbBr3/Cs4PbBr6 MCs demonstrate excellent stability against ultraviolet irradiation (76%), good moisture resistance (42.7%), and good thermal tolerance (51%). It is understood that such excellent PLQY and stability are due to the surface passivation of the CsPbBr3 NCs attributed to the large bandgap as well as the isolated [PbBr6]4− octahedra separated by Cs+ ions in the Cs4PbBr6 crystal lattice. Finally, the suitability of the green-emitting CsPbBr3/Cs4PbBr6 material for achieving white-light emission and a wide color gamut is evaluated by constructing a prototype white light-emitting diode (w-LED) using CsPbBr3/Cs4PbBr6 and red-emitting K2SiF6:Mn4+ materials taken in different weight ratios and combined with a blue light-emitting InGaN LED chip (λ = 455 nm). The constructed w-LED device exhibits the color coordinates (0.3315, 0.3289), an efficacy of 68 lm W−1, a color rendering index of 87%, a color temperature of 5564 K, and a wide color gamut of ∼118.78% (NTSC) and ∼88.69% (Rec. 2020) with RGB color filters in the CIE 1931 color space. Therefore, based on our present findings, we strongly believe that the dual-phase CsPbBr3/Cs4PbBr6 material is a promising green-emitting phosphor for use in w-LEDs as the backlight of display systems.
Introduction
All-inorganic PNCs (CsPbX3, X = Cl, Br, and I) have gained considerable attention due to their narrow emission bandwidth and tunable bandgap, high-defect tolerance, large absorption cross-section, and near-unity photoluminescence quantum yield (PLQY),1–3 which have enabled them to be used in a variety of promising applications, including color conversion and electroluminescent materials in light-emitting and display devices,4 photovoltaics,5 laser gain media, and X-ray scintillating materials,6 and for anti-counterfeiting applications.7 Despite their unique optical and photophysical properties, CsPbX3 materials suffer from structural instability when exposed to ultraviolet (UV) radiation, moisture, and heat. They are affected by their inherent phase transformation when directly used in practical applications, such as white light-emitting devices. Additionally, their unsuitability for large-scale industrial synthesis requirements is another setback. To circumvent these challenges, several approaches have been proposed, such as encapsulation in inorganic shells, including ZnS,8 CdS,9 TiO2,10 Al2O3,11 PbSO4,12 and mesoporous silica,13 and embedding in polymer14 and glass15 matrices as well as heteroepitaxial structures, including CsPbBr3/Cs4PbBr6![[thin space (1/6-em)]](https://www.rsc.org/images/entities/char_2009.gif) 16 and CsPbBr3/CsPb2Br5 core/shell structures.17 Nevertheless, since these integration and incorporation methods are expensive, labor-intensive, and complex, they can only be performed in the laboratory and are difficult for synthesis and optimization for large-scale production. Therefore, these challenges have triggered an extensive exploration for highly luminescent CsPbX3-related structures that are structurally stable in different environments, such as two-dimensional (2D; CsPb2X5) and zero-dimensional (0D; Cs4PbX6) perovskites.18–20
16 and CsPbBr3/CsPb2Br5 core/shell structures.17 Nevertheless, since these integration and incorporation methods are expensive, labor-intensive, and complex, they can only be performed in the laboratory and are difficult for synthesis and optimization for large-scale production. Therefore, these challenges have triggered an extensive exploration for highly luminescent CsPbX3-related structures that are structurally stable in different environments, such as two-dimensional (2D; CsPb2X5) and zero-dimensional (0D; Cs4PbX6) perovskites.18–20
CsPbBr3 has a three-dimensional (3D) structure characterized by corner-sharing [PbBr6]4−octahedra with Cs+ cations filling the spaces created by four neighboring [PbBr6]4− octahedra.21 Although the CsPbBr3 material has been extensively explored from an application perspective, its structural instability has been a hindrance. Unlike the 3D CsPbBr3 structure, the [PbBr6]4− octahedra are decoupled from the halide ions, without sharing any corners or edges and are surrounded by isolated Cs+ cations in the 0D Cs4PbBr6 structure.21,22 The unique 0D structure characterized by decoupled [PbBr6]4− octahedra displays significant quantum confinement and exciton–phonon interactions, which lead to exciton localization, self-trapping, polaron generation, and intrinsic Pb2+ ion emission.22,23 Due to their stability and photoluminescence (PL) capabilities, 0D Cs4PbBr6 perovskite materials have attracted exceptional interest from the scientific community over the last decade as green phosphors for realizing white-light emission.20,21 However, the origin of the strong green luminescence remains a subject of debate. Several research groups have demonstrated possible luminescence mechanisms for the intense green PL from Cs4PbBr6, which include (i) emission from CsPbBr3 NCs (as impurities, inclusions, or CsPbBr3/Cs4PbBr6 interfaces) and (ii) defect-induced emission (such as Br vacancies, interstitial hydroxyl, polybromide, and self-trapped excitation).22–30 The absence of traces related to CsPbBr3 NC impurities in the X-ray diffraction (XRD) pattern, transmission electron microscopy (TEM) images, and scanning electron microscopy (SEM) images has prompted concerns regarding the accuracy of the former theory. Although the latter theory is supported by density functional theory (DFT) simulations, it faces the problem of reproducing the calculated deep-level defect states through other DFT simulations and rarely agrees with the experimental results obtained for lead halide perovskites.30 However, many research groups have provided credible and compelling evidence for the green luminescence being caused by the presence of CsPbBr3 NCs as an impurity in the Cs4PbBr6 structure. Zou et al. conducted high-pressure experiments and DFT calculations to demonstrate that the green luminescence in Cs4PbBr6 originates from the CsPbBr3 impurities embedded in it.31 Bao et al. identified the presence of CsPbBr3 NCs in emissive Cs4PbBr6 using correlated Raman–PL measurements as a passive structure–property method.32 Riesen et al. employed a cathodoluminescence imaging technique to demonstrate the presence of low impurity levels of CsPbBr3 in Cs4PbBr6 synthesized mechanochemically through ball milling.33 Zhong et al. reported that centimeter-sized Cs4PbBr6 crystals with embedded CsPbBr3 NCs exhibited superior green luminescence.34
To date, all-inorganic PNCs have been synthesized using chemical vapor deposition (CVD) and solution-based synthesis methods like hot-injection, solvothermal methods, room temperature-based ligand-mediated precipitation and supersaturated recrystallization.35 The hot-injection method has been widely used to synthesize PNCs; however, it is expensive and time-consuming, and requires certain reaction conditions to synthesize PNCs, such as high temperature, vacuum, inert atmospheres, and pre-synthesized precursors, resulting in limited yield and repeatability. To synthesize PNCs using room temperature-based approaches, the precursors must be mixed with large quantities of polar solvents, such as dimethyl sulfoxide (DMSO) and N,N-dimethylformamide (DMF), followed by treatment with nonpolar solvents, such as toluene or hexane. Despite the high yield of PNCs obtained using these approaches, they are sensitive to polar solvents, resulting in the formation of defects.35,36 Therefore, considering these above shortcomings to produce PNCs with high quality and excellent stability, ultrasonication-assisted synthesis is considered to be a promising method due to factors such as a rapid reaction rate, controllable reaction conditions, quality and quantity of the yield, less labor-intensive synthesis processes, optimization for large-scale production, low cost and safety.34,37,38 The ultrasonication method is widely used to synthesize high-quality nano- and micro-sized particles on a large scale. In contrast to the hot-injection method,1 precursors do not have to be pre-treated or degassed before the reaction occurs. Instead, ultrasonication allows the reaction to occur in an ambient environment. Additionally, it accelerates the nucleation and growth of NCs and can reduce the reaction time.
Herein, we present a facile and eco-friendly ultrasonication approach for the large-scale synthesis of ligand-free lead halide perovskite (LHP) MCs at room temperature. We demonstrated that this approach could generate both single-phase (CsPbBr3, Cs4PbBr6) and dual-phase (CsPbBr3/Cs4PbBr6) MCs at a rapid pace by varying the precursor (CsBr, PbBr2) content in mixed solvents of DMF and DMSO taken in low quantities (Fig. 1). Our investigation sheds light on the phase transitions between the Cs–Pb–Br compounds, their formation kinetics at different stages, and microstructure. DMF and DMSO have an effect on the solubility of CsBr and PbBr2 in the solvent as they can control the growth of dual-phase CsPbBr3/Cs4PbBr6 MCs precisely. We also discussed the role of the dual-phase formation in generating green emission, which is caused by the presence of CsPbBr3 NCs as an impurity in the Cs4PbBr6 structure. Additionally, this facile synthesis method reduces the reaction time and production cost. The MCs synthesized through this approach exhibit a high PLQY without using antisolvents, such as toluene and chloroform. Considering the high PLQY and stability of green-emitting dual-phase CsPbBr3/Cs4PbBr6 microcrystals (MCs), we developed a prototype white LED (w-LED) using optimized contents of the as-synthesized dual-phase CsPbBr3/Cs4PbBr6 MCs with K2SiF6:Mn4+ (λ = 628 nm) phosphors coupled to a blue light-emitting InGaN LED chip (λ = 455 nm).
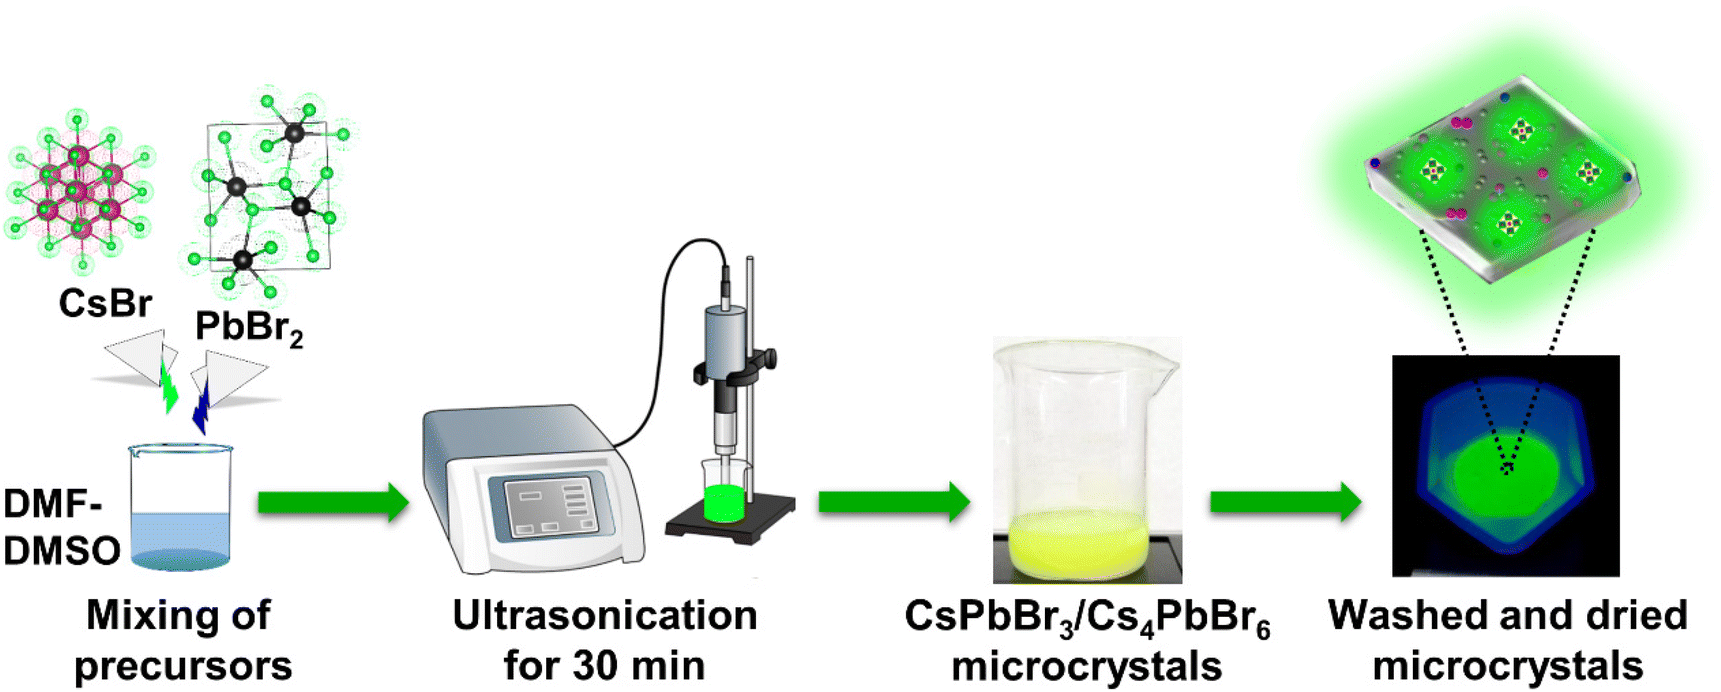 | ||
| Fig. 1 Scheme for the synthesis of dual-phase CsPbBr3/Cs4PbBr6 MCs using ultrasonication process. | ||
Results and discussion
As shown in Fig. 1, the synthesis of the dual-phase CsPbBr3/Cs4PbBr6 MCs involves a single step at room temperature. CsBr:PbBr2 was taken in various molar ratios and ultrasonicated in a 1:1 ratio of DMF and DMSO to synthesize the dual-phase MCs. Due to the different solubilities of precursors in DMF and DMSO, initially CsPbBr3, then Cs4PbBr6, and finally, dual-phase CsPbBr3/Cs4PbBr6 MCs with a lemon-yellow color are formed at different reaction times. The sample was centrifuged, and the precipitate was dried at 70 °C to obtain the dual-phase CsPbBr3/Cs4PbBr6 MCs. The details of the synthesis methodology of the dual-phase CsPbBr3/Cs4PbBr6 MCs depending on the ultrasonication time are described in the Experimental section provided in the ESI.†
The XRD pattern of the Cs4PbBr6 microcrystals (MCs) synthesized with the assistance of ultrasonication for 30 min, shown in Fig. 2a, exhibits strong diffraction peaks, which can be well indexed to the rhombohedral crystal structure (JCPDS# 73-2478) with the R![[3 with combining macron]](https://www.rsc.org/images/entities/char_0033_0304.gif) c (167) phase group, lattice parameters a = b = 13.73 Å and c = 17.31 Å, and corresponding angles α = β = 90° and γ = 120°. In addition, no diffraction peaks attributed to CsPbBr3 are noticed in the XRD pattern of the synthesized powder. Transmission electron microscopy (TEM) images of the samples synthesized at 3, 10 and 30 min are shown in Fig. S1a, b† and Fig. 2b, to understand the evolution of morphology based on time. The sample synthesized at 3 min exhibited micrometer sized cube-like CsPbBr3 structure seen in Fig. S1a,† and on further increasing the reaction time to 10 min, the particle shape was transformed to soft edges exhibiting the CsPbBr3/Cs4PbBr6 matrix shown in Fig. S1b† (inset shows the corresponding high-resolution TEM (HR-TEM) images). Further increasing of the reaction time to 30 min resulted in rhombohedral particles with sharp edges as shown in Fig. 2b. As shown in Fig. 2c, a large number of small particles with an average diameter of 10.28 nm are embedded on the edges and outer surface of the Cs4PbBr6 material. This suggests the formation of the dual-phase CsPbBr3/Cs4PbBr6 MC structure, which is similar to the previously reported TEM results for the Cs4PbBr6 material.39–41 The crystal lattice of Cs4PbBr6 comprises closely packed anions with cations fixed at the interstitial positions; the smaller ionic radius of Pb2+ (119 pm) compared with those of Cs+ (169 pm) and Br− (195 pm), as well as the existence of ionic dislocation and displacement, is beneficial for the embedding of the CsPbBr3 NCs into the Cs4PbBr6 MCs. Therefore, a high-resolution TEM (HR-TEM) image was acquired to identify the coexistence of these phases. Fig. 2d shows a HR-TEM image exhibiting two different sets of lattice fringes, which can be attributed to the CsPbBr3 and Cs4PbBr6 phases. The region circled in green in Fig. 2d exhibited a lattice spacing of 0.29 nm, which is consistent with the (002) crystal plane, confirming the monoclinic CsPbBr3 structure. The region inside the yellow square in Fig. 2d exhibits a lattice spacing of 0.39 nm, corresponding to the (113) crystal plane, confirming the rhombohedral Cs4PbBr6 structure. Therefore, the HR-TEM results demonstrate that CsPbBr3 NCs are incorporated into the solid-rhombohedral prism of the Cs4PbBr6 structure, forming dual-phase CsPbBr3/Cs4PbBr6 MCs. The dual-phase CsPbBr3/Cs4PbBr6 MCs have a rhombohedral shape with a smooth outer surface and almost sharp edges, as shown in the low- and high-magnification field-emission scanning electron microscopy (FE-SEM) images (Fig. S2a and b†). The element mapping (cesium (Cs) in green, lead (Pb) in blue, and bromide (Br) in yellow) (Fig. S2c–f†) and energy-dispersive spectroscopy (EDS) profiles (Fig. S2g†) confirm the presence of Cs, Pb, and Br elements in the dual-phase MCs, with atomic percentages of 35.45%, 9.68%, and 54.87%, respectively. The molar ratio of CsPbBr3 to Cs4PbBr6 is determined to be approximately 1:8. Moreover, the EDS maps provide the homogeneous distribution of the elements in the dual-phase MCs, represented by colored dots.
c (167) phase group, lattice parameters a = b = 13.73 Å and c = 17.31 Å, and corresponding angles α = β = 90° and γ = 120°. In addition, no diffraction peaks attributed to CsPbBr3 are noticed in the XRD pattern of the synthesized powder. Transmission electron microscopy (TEM) images of the samples synthesized at 3, 10 and 30 min are shown in Fig. S1a, b† and Fig. 2b, to understand the evolution of morphology based on time. The sample synthesized at 3 min exhibited micrometer sized cube-like CsPbBr3 structure seen in Fig. S1a,† and on further increasing the reaction time to 10 min, the particle shape was transformed to soft edges exhibiting the CsPbBr3/Cs4PbBr6 matrix shown in Fig. S1b† (inset shows the corresponding high-resolution TEM (HR-TEM) images). Further increasing of the reaction time to 30 min resulted in rhombohedral particles with sharp edges as shown in Fig. 2b. As shown in Fig. 2c, a large number of small particles with an average diameter of 10.28 nm are embedded on the edges and outer surface of the Cs4PbBr6 material. This suggests the formation of the dual-phase CsPbBr3/Cs4PbBr6 MC structure, which is similar to the previously reported TEM results for the Cs4PbBr6 material.39–41 The crystal lattice of Cs4PbBr6 comprises closely packed anions with cations fixed at the interstitial positions; the smaller ionic radius of Pb2+ (119 pm) compared with those of Cs+ (169 pm) and Br− (195 pm), as well as the existence of ionic dislocation and displacement, is beneficial for the embedding of the CsPbBr3 NCs into the Cs4PbBr6 MCs. Therefore, a high-resolution TEM (HR-TEM) image was acquired to identify the coexistence of these phases. Fig. 2d shows a HR-TEM image exhibiting two different sets of lattice fringes, which can be attributed to the CsPbBr3 and Cs4PbBr6 phases. The region circled in green in Fig. 2d exhibited a lattice spacing of 0.29 nm, which is consistent with the (002) crystal plane, confirming the monoclinic CsPbBr3 structure. The region inside the yellow square in Fig. 2d exhibits a lattice spacing of 0.39 nm, corresponding to the (113) crystal plane, confirming the rhombohedral Cs4PbBr6 structure. Therefore, the HR-TEM results demonstrate that CsPbBr3 NCs are incorporated into the solid-rhombohedral prism of the Cs4PbBr6 structure, forming dual-phase CsPbBr3/Cs4PbBr6 MCs. The dual-phase CsPbBr3/Cs4PbBr6 MCs have a rhombohedral shape with a smooth outer surface and almost sharp edges, as shown in the low- and high-magnification field-emission scanning electron microscopy (FE-SEM) images (Fig. S2a and b†). The element mapping (cesium (Cs) in green, lead (Pb) in blue, and bromide (Br) in yellow) (Fig. S2c–f†) and energy-dispersive spectroscopy (EDS) profiles (Fig. S2g†) confirm the presence of Cs, Pb, and Br elements in the dual-phase MCs, with atomic percentages of 35.45%, 9.68%, and 54.87%, respectively. The molar ratio of CsPbBr3 to Cs4PbBr6 is determined to be approximately 1:8. Moreover, the EDS maps provide the homogeneous distribution of the elements in the dual-phase MCs, represented by colored dots.
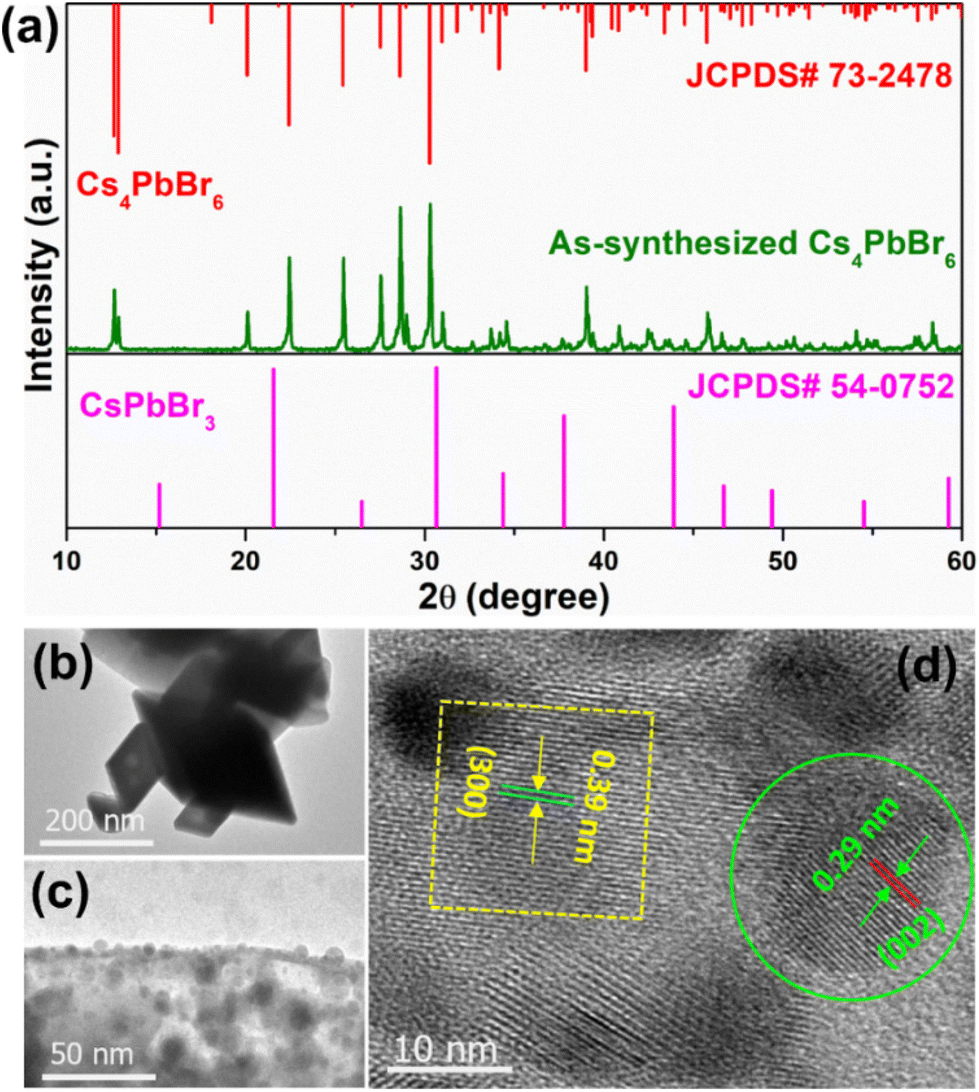 | ||
| Fig. 2 (a) Powder XRD pattern of the Cs4PbBr6 microcrystals (MCs), (b and c) TEM and (d) HR-TEM images of the Cs4PbBr6 MCs embedded with CsPbBr3 nanocrystals (NCs). | ||
The X-ray photoelectron spectroscopy (XPS) measurement was performed for the pure CsPbBr3, dual-phase CsPbBr3/Cs4PbBr6, and pure Cs4PbBr6 MCs to quantify the number of elements as well as characterize their chemical states, chemical shifts, and the bonding between them. Fig. 3a shows the wide-scan XPS profiles of the emissive CsPbBr3, dual-phase CsPbBr3/Cs4PbBr6, and non-emissive Cs4PbBr6 MCs exhibiting the presence of Cs 3d, Pb 4f, and Br 3d peaks in the synthesized materials.
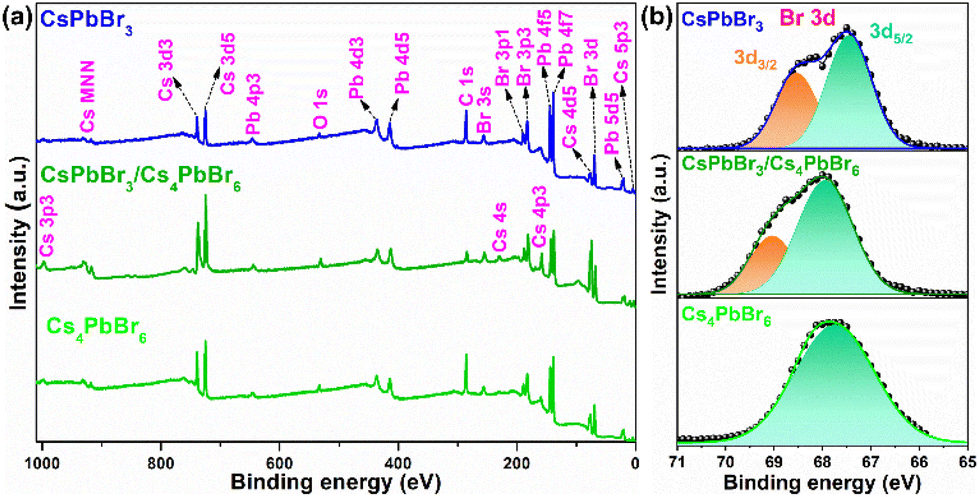 | ||
| Fig. 3 (a) Wide-scan X-ray photoelectron spectrum of emissive CsPbBr3, dual-phase CsPbBr3/Cs4PbBr6 and non-emissive Cs4PbBr6. (b) High-resolution X-ray photoelectron spectra of Br (3d). | ||
The high-resolution (HR) core-level spectra of the Cs 3d, Pb 4f, and Br 3d orbitals are shown in Fig. S3a, b,† and Fig. 3b. The HR-XPS spectra of the Cs 3d and Pb 4f orbitals of the three materials displayed two distinct peaks assigned to 3d5/2, 3d3/2, and 4f5/2, 4f7/2, respectively, due to the spin–orbit splitting. The CsPbBr3/Cs4PbBr6 XPS peaks are shifted to the higher binding energies (BEs) compared to CsPbBr3 and Cs4PbBr6, indicating lower electron density (Fig. S3a and b†). Fig. 3b shows the deconvoluted Gaussian fitting of the HR-XPS profiles of Br 3d orbitals for emissive CsPbBr3, dual-phase CsPbBr3/Cs4PbBr6, and non-emissive Cs4PbBr6. The Br 3d peak of Cs4PbBr6 exhibited a single broad peak with a BE of 67.86 eV, which is consistent with a previous report,34 while the Br 3d peaks of CsPbBr3 and CsPbBr3/Cs4PbBr6 exhibited two peaks, which are assigned to the 3d5/2 and 3d3/2 doublets due to the spin–orbit splitting. The doublets with BEs of 67.43 and 68.54 eV for CsPbBr3 and 67.93 and 69.03 eV for CsPbBr3/Cs4PbBr6 are attributed to the 3d5/2 and 3d3/2 components, respectively, of the Br atoms in the interior and on the outer surface. Interestingly, from Fig. 3b, we noticed that the Gaussian peak with a BE of 67.93 eV of CsPbBr3/Cs4PbBr6 lies very much close to 67.86 eV of Cs4PbBr6 corresponding to the Br atoms in the isolated [PbBr6]4− units of Cs4PbBr6 MCs.42 The Gaussian peak at 69.03 eV of CsPbBr3/Cs4PbBr6, which is close to 68.54 eV of CsPbBr3, corresponds to the Br atoms of the CsBr impurities or corner-sharing [PbBr6]4− octahedra of CsPbBr3 when the CsPbBr3 NCs are present in the green color-emitting MCs.34,43 Therefore, the XPS analysis supports the existence of a small quantity of CsPbBr3 impurities in the Cs4PbBr6 MCs. The Cs:Pb:Br compositional ratio determined from the XPS measurements is consistent with the EDS result. Therefore, based on the HR-TEM and XPS results, it is evident that small impurities of CsPbBr3 NCs are present in Cs4PbBr6 forming a dual-phase CsPbBr3/Cs4PbBr6 microstructure.
Considering the structural results, we initially explored the effect of the CsBr:PbBr2 molar ratio on the structure and optical properties of the dual-phase CsPbBr3/Cs4PbBr6 MCs by performing XRD, absorption, and PL measurements for different CsBr:PbBr2 molar ratios (1:1, 2:1, 4:1, and 6:1) in a mixed solution of DMF–DMSO. For a CsBr:PbBr2 ratio of 1:1, the CsPbBr3 peaks observed in the XRD pattern (Fig. S4a†) can be well indexed to the JCPDS# 18-0364 standard card (monoclinic CsPbBr3), and the strong absorption onset in the green region (Fig. S4b†) suggests the formation of the CsPbBr3 structure. However, no emission is observed under UV excitation (Fig. S4c†), indicating the bulk nature of the formed compound.7,44 Therefore, as the CsBr:PbBr2 molar ratio is increased to 2:1, diffraction peaks attributed to Cs4PbBr6 are noticed alongside the CsPbBr3 diffraction peaks, suggesting CsPbBr3 phase transformation to Cs4PbBr6 with excess CsBr. Furthermore, the sample displays a moderately strong band at 315 nm in the UV region and a strong onset absorption at 528 nm with weak green luminescence under UV light. As the CsBr:PbBr2 molar ratio is increased to 4:1, no traces of CsPbBr3 are noticed in the XRD pattern (Fig. S4a†). Moreover, the appearance of a strong band at 315 nm and a weak onset at 528 nm in the absorption spectrum suggests the presence of small traces of CsPbBr3 in the Cs4PbBr6 structure (Fig. S4b†). The appearance of intense green luminescence under UV excitation (Fig. S4c†) confirms the formation of the dual-phase CsPbBr3/Cs4PbBr6 MCs. Therefore, considering this outcome, the CsBr:PbBr2 molar ratio was further increased to 6:1. In this case, the XRD pattern (Fig. S4a†) shows no impurity peaks related to CsPbBr3; however, an impurity peak attributable to CsBr (JCPDS# 05-0588) is noticed at θ = 29.5°, which could be due to the excessive CsBr loading. The absorption spectrum displays a strong band at 315 nm and a further weakened onset at 528 nm in the absorption spectrum, suggesting that small traces of CsPbBr3 are still present in the Cs4PbBr6 structure (Fig. S4b†). The PL spectrum displays a slightly less intense green emission spectrum than that observed for the 4:1 molar ratio (Fig. S4c†). The emission intensity increases until the CsBr:PbBr2 molar ratio is 4:1, above which a slight decrease in the emission intensity is noticed in the PL spectrum, which could be attributed to the low Pb2+ concentration. The photographs of the sample synthesized at different CsBr:PbBr2 molar ratios (=1:1, 2:1, 4:1, and 6:1) under day and UV light are shown in Fig. S4d.†
Furthermore, to better understand the formation of the dual-phase CsPbBr3/Cs4PbBr6 MCs, CsBr and PbBr2 in a molar ratio of 0.4:0.1 were placed in a vial, and DMF (0.5 ml) and DMSO (0.5 ml) solutions were added for the ultrasonication treatment. Fig. 4a shows the photographs of the ultrasonication process and the as-synthesized samples under daylight and UV light. CsBr is insoluble in DMF, whereas the solubility of PbBr2 is higher even at room temperature; as a result, the formation of CsPbBr3 is accelerated. Since CsBr dissolves easily in DMSO, it induces a higher concentration of Cs+ ions, which is beneficial for accelerating the phase transformation from CsPbBr3 to Cs4PbBr6 during the synthesis of the dual-phase CsPbBr3/Cs4PbBr6 MCs.44,45 Here, we investigated the different intermediate steps involved in the formation of the dual-phase CsPbBr3/Cs4PbBr6 MCs because the color change in the precursor salts depends on the ultrasonication time. The formation of the dual-phase CsPbBr3/Cs4PbBr6 MCs with the assistance of ultrasonication occurs in four stages: (i) interfacial conversion, (ii) formation of orange-colored CsPbBr3 MCs, (iii) formation of white-colored Cs4PbBr6 MCs, and (iv) formation of lemon-yellow colored dual-phase CsPbBr3/Cs4PbBr6 MCs. The photographs of the products exhibiting different colors at different stages (time intervals t = 0, 3, 10, and 30 min) during ultrasonication are shown in Fig. 4b–e, and changes in their structure are identified from the corresponding XRD patterns (Fig. 4f). In the first stage (Fig. 4b), when the DMF–DMSO solution is added to the CsBr and PbBr2 precursor salts, a CsPbBr3 (orange color) layer is immediately formed through the interfacial conversion of the undissolved salts on the surface. In the second stage (Fig. 4c), when the salts are ultrasonicated for 3 min, the reactants form an intermediate compound, i.e., a Pb-rich phase of CsPbBr3 (orange color) in the clear DMF–DMSO solution. The spontaneous nucleation and growth of CsPbBr3 occur because of the higher concentration of Pb2+ than Cs+ in the solution due to the low solubility of CsBr in DMF. Cs+ + Pb2+ + 3Br− → CsPbBr3 is the crystallization reaction. The XRD analysis of the orange product shows that the diffraction peaks agree well with the JCPDS# 18-0364 standard card. This shows that the structure of the orange product is monoclinic CsPbBr3 (Fig. 4f). However, an impurity peak at around 29.5° that can be attributed to CsBr (JCPDS# 05-0588) is noticed due to the undissolved CsBr. The third stage (Fig. 4d) is governed by the dissolution–crystallization mechanism; when the reactants are ultrasonicated for 10 min, with the depletion of Pb2+ (i.e., PbBr2), the gradual dissolution of Cs+ (CsBr) occurs in the DMF–DMSO solution. During this crystallization process, the reactive amount of Cs+ is larger than that of Pb2+, which contributes to the Cs+-rich reaction condition. Due to the high solubility of the CsPbBr3 crystals in DMSO, they begin to dissolve and react with CsBr, resulting in the Cs4PbBr6 MCs (white). The crystallization and dissolution processes are described by the following equations: 4Cs+ + Pb2+ + 6Br− → Cs4PbBr6, and CsPbBr3 → Cs+ + Pb2+ + 3Br−, respectively. The XRD pattern of the white-colored product obtained after ultrasonication for 30 min is in good agreement with the JCPDS# 73-2478 standard card, which corresponds to the Cs4PbBr6 structure. However, small impurity peaks attributed to CsBr and CsPbBr3 are present in the XRD pattern of the white product (Fig. 4f). In the fourth stage (10–30 min ultrasonication) (Fig. 4e), the Cs4PbBr6 matrix grows on the surface of the CsPbBr3 NCs, which are produced at this stage. The XRD pattern of the product with lemon yellow color obtained after ultrasonication for 30 min matches well with the JCPDS# 73-2478 standard card, which corresponds to the rhombohedral Cs4PbBr6 structure. However, no peaks attributable to CsPbBr3 are present in the XRD pattern of the final product (Fig. 4f). The dual-phase CsPbBr3/Cs4PbBr6 MCs are generated by the ripening of the CsPbBr3/Cs4PbBr6 matrix (lemon-yellow color). The PL trends were also recorded for the products at time intervals of t = 3, 10, and 30 min (Fig. 4f), and their photographs under UV light are shown in Fig. 4g. After 3 min of the ultrasonication process, the products do not show emission under UV excitation. After 10 min, the products exhibit very weak emission under UV excitation, which indicates the initial stage of the formation of CsPbBr3 within the Cs4PbBr6 microstructure. After 30 min of ultrasonication, the products yield an intense green emission under UV light, suggesting the formation of a stable dual-phase CsPbBr3/Cs4PbBr6 microstructure.
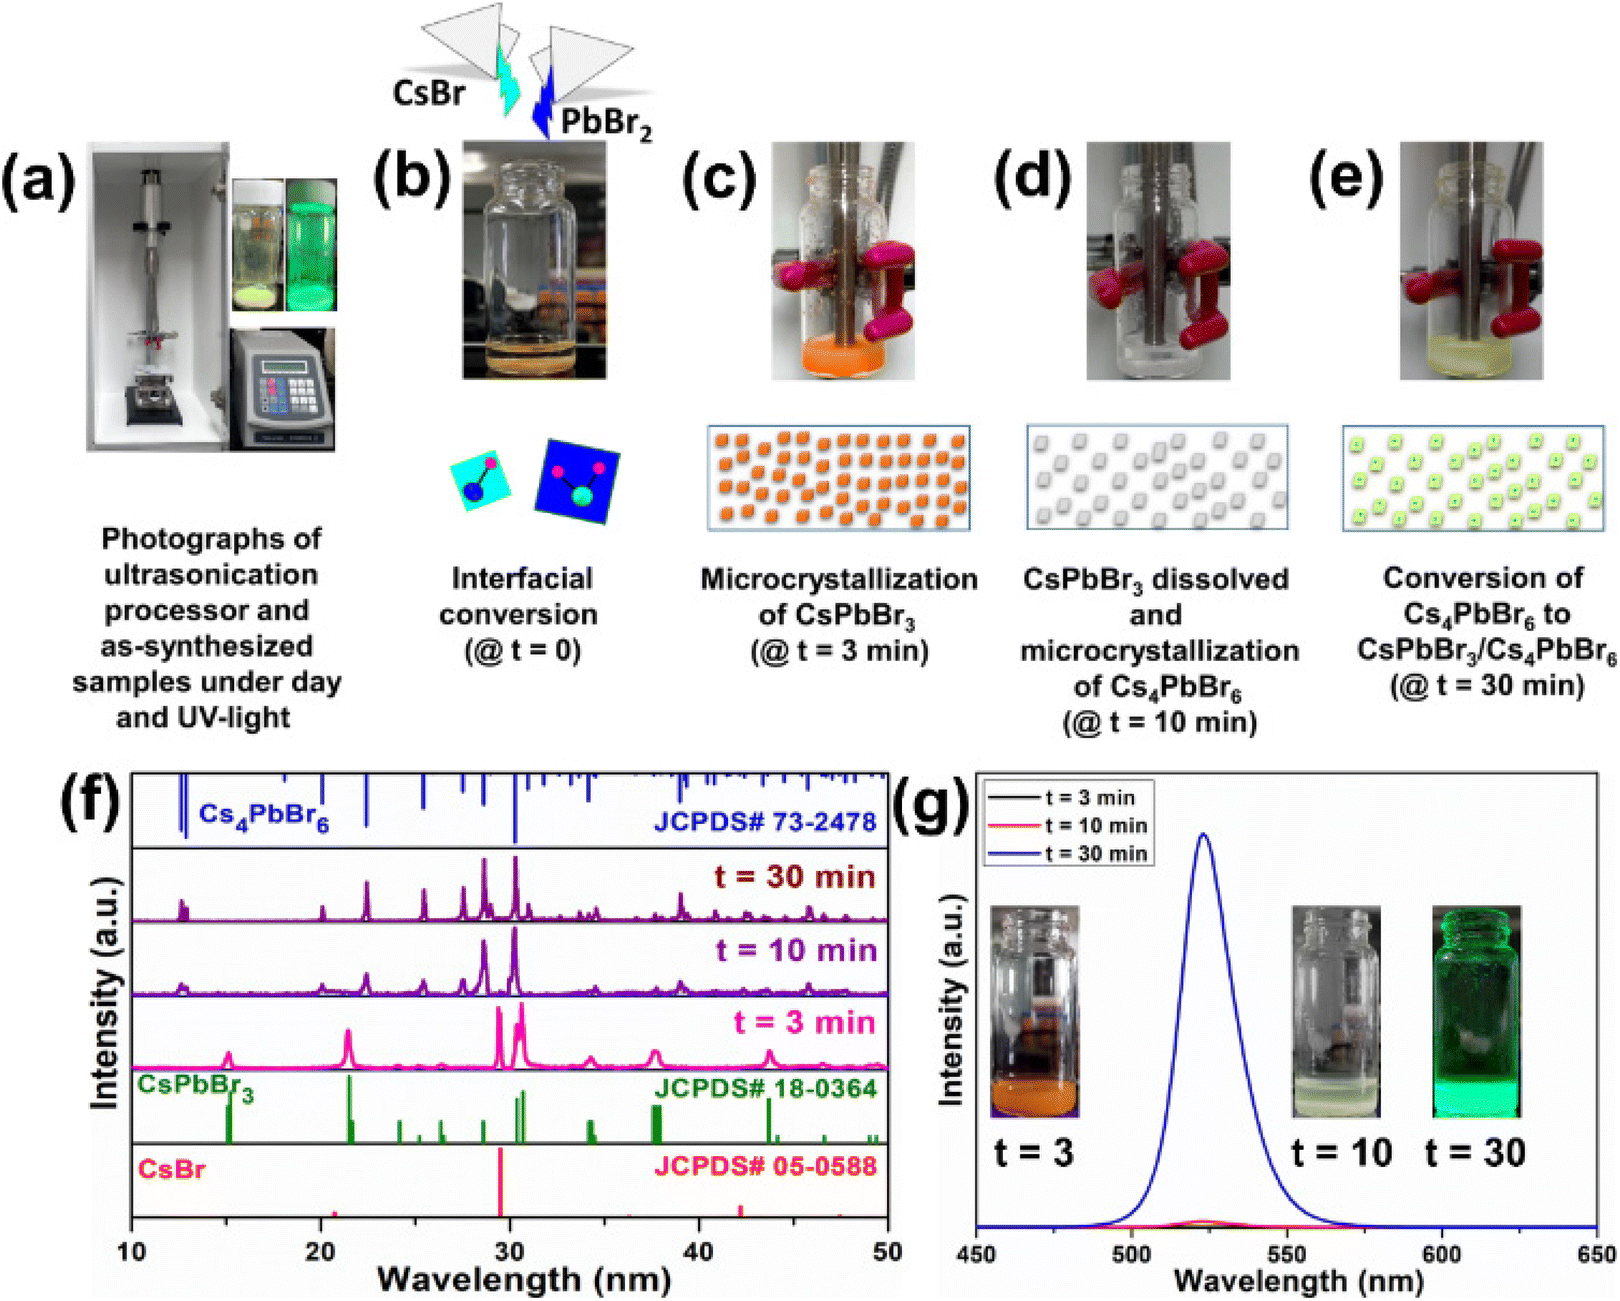 | ||
| Fig. 4 (a) The photographs of the ultrasonication processor and as-synthesized samples taken during day and under UV light. Time-dependent changes in the precursors (CsBr, and PbBr2) during the ultrasonication process and the formation mechanism of dual-phase CsPbBr3/Cs4PbBr6 microcrystals at different reaction time intervals (b) t = 0 min, (c) t = 3 min, (d) t = 10 min, and (e) t = 30 min, (f) XRD profiles of the final products at different reaction time intervals t = 3, 10, and 30 min indexed to JCPDS# 05-0588 (CsBr), JCPDS# 18-0364 (CsPbBr3), and JCPDS# 73-2478 (Cs4PbBr6), and (g) PL profiles of the obtained products at t = 3, 10, and 30 min (inset photographs of their luminescence under UV light). | ||
To gain a clear insight into the photophysical properties of the dual-phase CsPbBr3/Cs4PbBr6 MCs prepared using the ultrasonication process, the photophysical properties of the CsPbBr3/Cs4PbBr6 were compared with those of the pure Cs4PbBr6 and CsPbBr3 NCs (Fig. 5a–c) synthesized via the hot-injection method. The pure Cs4PbBr6 NCs display a strong absorption peak in the deep-UV region at around 315 nm, which is assigned to the 1S0 → 3P1 transition, and the PL spectrum exhibits a broad band in the range of 350–520 nm, with a peak maximum at around 372 nm, which is assigned to the Pb2+:3P1 → 1S0 transition in the isolated [PbBr6]4− octahedral units in Cs4PbBr6.46 However, no emission occurs in the green region (Fig. 5a). The CsPbBr3 NCs exhibits an absorption band edge at 505 nm with an optical bandgap of 3.44 eV and a strong PL band at 514 nm (Fig. 5b). The optical absorption, PL excitation (PLE), and PL bands of the emissive Cs4PbBr6 MCs are shown in Fig. 5c. The optical absorption spectrum is composed of a couple of absorption bands, one at 315 nm in the UV region (which corresponds to the absorption band of pure Cs4PbBr6) and the other one located at 510 nm in the green region (which corresponds to the absorption band of pure CsPbBr3). The strong peak at 315 nm is due to the optical transitions between the localized states within the decoupled [PbBr6]4− octahedral units of Cs4PbBr6 (i.e., it arises from the 1S0 → 3P1 transition of the Pb2+ centers).40,46 The other band at 510 nm matches the band at 505 nm of CsPbBr3. Additionally, a strong PL band is observed at around 522 nm, which is similar to that of CsPbBr3 (@514 nm) and is absent in the case of pure Cs4PbBr6. The small red-shift in the absorption and PL spectra of dual-phase CsPbBr3/Cs4PbBr6 MCs but not in those of CsPbBr3 is attributed to the quantum size effect caused by the increase of the particle size.47,48 It is noteworthy to mention that, shell growth reduces the amount of surface dangling bonds, which enhances fluorescence intensity; however, this does not always result in a blue shift of the luminescence.49,50 Furthermore, the overlap between the absorption spectrum of the pure Cs4PbBr6 and the PL spectrum of CsPbBr3 provides evidence for the possibility of energy transfer from Cs4PbBr6 to CsPbBr3 in the dual-phase CsPbBr3/Cs4PbBr6 MCs (Fig. S5a†). Therefore, upon monitoring the CsPbBr3/Cs4PbBr6 with CsPbBr3 emission, the resultant PLE spectrum exhibits excitation features of pure Cs4PbBr6 and Pb2+ ions. This indicates that the green PL observed in the dual-phase CsPbBr3/Cs4PbBr6 MCs is due to the embedded CsPbBr3 NCs (Fig. S5b†). The above results show that the green PL and absorption bands observed in the dual-phase CsPbBr3/Cs4PbBr6 MCs originate from the coexistence of the Cs4PbBr6 and CsPbBr3 structures.
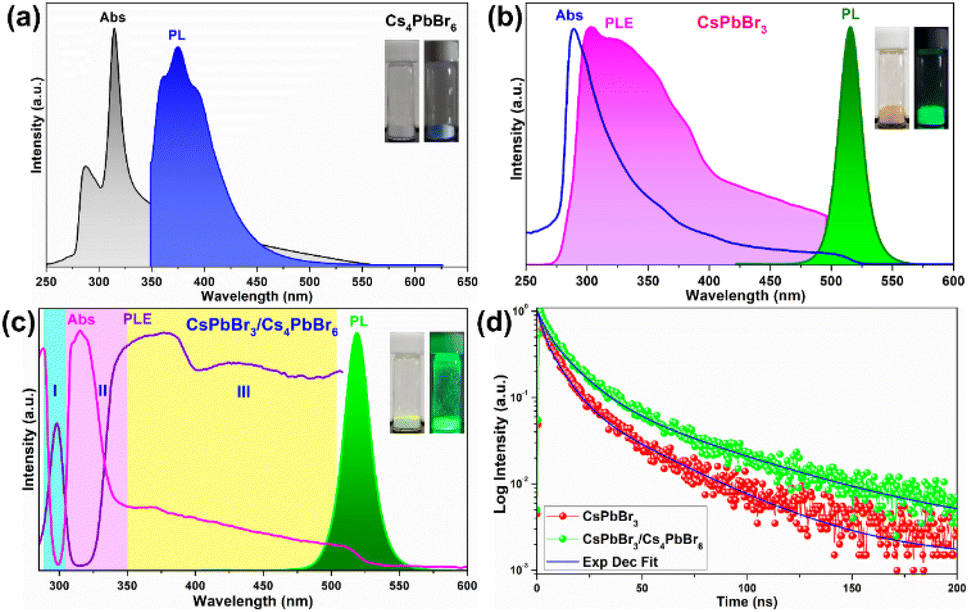 | ||
| Fig. 5 (a) Absorption and photoluminescence spectra of pure Cs4PbBr6, (b) absorption, photoluminescence, and excitation spectra of pure CsPbBr3, (c) absorption, photoluminescence, and excitation spectra of dual-phase CsPbBr3/Cs4PbBr6, and (d) time-resolved photoluminescence decay curves of CsPbBr3, and CsPbBr3/Cs4PbBr6 at λexci = 365 nm. | ||
The above speculation is further supported by analyzing the absorption and PLE spectra of CsPbBr3/Cs4PbBr6 (Fig. 5c). For this purpose, the absorption spectrum is classified into three regions labelled as I, II, and III. In the absorption spectrum, regions I and II represent the intrinsic absorption of Cs4PbBr6 in the absorption spectrum, while region III necessitates further clarification because it deviates from the Urbach tail.51,52 However, the steep absorption in region II suggests that the mid-bandgap states are suppressed in Cs4PbBr6. Despite this, the sample still exhibits a noticeable absorption onset in the green region, which appears too strong to be caused by the suppressed intraband states, as shown in the figure (Fig. 5c). Based on this finding, the origin of the bright green luminescence can be decoupled from the intraband defect states. Furthermore, the absorption and emission spectra trends are consistent with each other in region III; they display enhanced absorption, which leads to an intensified PLE signal. In contrast to region III, the absorption and PLE signals in regions I and II are symmetric approximately at the same wavelengths (∼297 nm and ∼315 nm), displaying a weakened absorption, which results in an enhanced PLE signal. The dip in the absorption signals indicates the absence of states to accommodate electrons in Cs4PbBr6. Therefore, when Cs4PbBr6 is excited with photons in this region, the PL intensity remains the same due to weak absorption; however, a sharp green PL is observed in the green region, contradicting the above conjecture. Furthermore, the characteristic sharp absorption onset at around 510 nm in the dual-phase CsPbBr3/Cs4PbBr6 MCs (Fig. 5c) contradicts the long Urbach tail reported by Wang et al., ruling out the possibility that the green PL originates from intraband defect-states of the Br vacancies.23 Moreover, the band edge located at 510 nm in CsPbBr3/Cs4PbBr6 suggests a direct exciton recombination PL. If defect-related states exist in the gap between the valence and conduction bands, they will capture the electrons from the conduction band and generate defect-related emissions. The fact that the emission band measured in the range of 450–650 nm under different excitation wavelengths in the range of 350–500 nm (Fig. S6†) is independent of position and shape implies the absence of defect-related emitting states in the synthesized MCs. Therefore, the absorption and PLE analyses support the theory of the green PL originating from small CsPbBr3 impurities embedded in Cs4PbBr6. These photophysical properties confirm that CsPbBr3 NCs impurities are present in the Cs4PbBr6 MCs, enabling them to exhibit a strong green luminescence. Fig. 5d shows the time-resolved PL spectra of the CsPbBr3 and fits the time-resolved PL profiles:
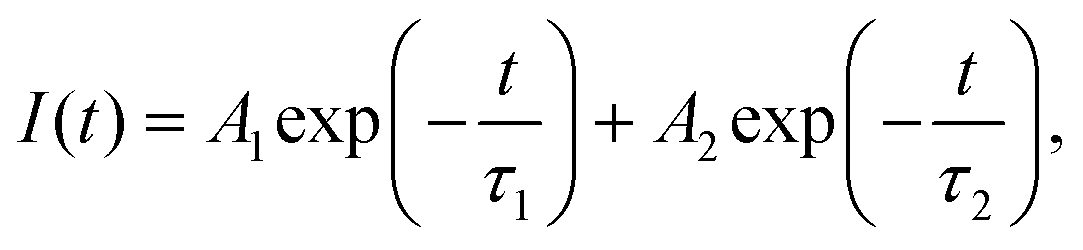
Femtosecond transient absorption spectroscopy (fs-TAS) was carried out for the CsPbBr3 and CsPbBr3/Cs4PbBr6 QDs to study the ultrafast exciton relaxation and recombination kinetics. Fig. 6a and b show the TA spectra of CsPbBr3 and CsPbBr3/Cs4PbBr6 that were measured in the range of 430–600 nm at a pump wavelength of 403 nm and energy of ∼4 nJ per pulse at different pump–probe delay times. TA spectra recorded for CsPbBr3 and CsPbBr3/Cs4PbBr6 in the range of 430–600 nm spectral window featured (i) a broad positive photoinduced absorption band (PA1, ΔA > 0, where ΔA is change in absorption) in the range of 440–495 nm which is attributed to the forbidden exciton transition activated by the band-edge excitons in strongly quantum confined QDs,54–56 (ii) different from the PA1, the short lived absorption band (PA2) in the region of 521–560 nm which is assigned to the Stark effect produced by the coulombic interaction between hot carriers and band-edge excitons,54,56,57 and (iii) a ground state bleach signal (GSB, ΔA < 0), which is sandwiched between two positive absorption bands of two samples at 506 nm for CsPbBr3 and 513 nm for CsPbBr3/Cs4PbBr6, matching with the steady state absorption onset, and corresponding to the first exciton absorption peak, which is attributed to the state filling effect of the band edge excitons (depicting the depopulation of ground state) and also a minor contribution from the stimulated emission to GSB signal that cannot be completely ignored.54,57,58 The negative GBS signals display narrow peaks for two samples due to the localization of the charge carriers, which is also the embodiment of the size uniformity of nanocrystals. The carrier density on the bandgap is explained by the ΔA intensity at the GSB signal. From the TA profiles of two samples, it is also observed that during the initial time delay, the negative GSB signals become increasingly broadened extending over a large range of wavelengths and reaches the maximum at around 2 picoseconds (ps) due to state filling; thereafter with the further increase of delay time, signals gradually narrow down to a symmetric nature displaying a gradual recovery. Therefore, the time required to reach a quasi-thermal distribution of charge carriers in line with the difference between the carrier temperature and lattice temperature (under darkness conditions) causes the bleach signals to broaden during the initial rise in delay time. As can be seen from Fig. 6a and b, the intensity of the bleach signals for CsPbBr3/Cs4PbBr6 is higher than that of CsPbBr3 under similar experimental conditions including laser intensity, excitation wavelength and delay time. This indicates that Cs4PbBr6 can passivate surface states of CsPbBr3 nanocrystals to eliminate trap fillings.59 The increase in the intensity of the bleach signal of CsPbBr3/Cs4PbBr6 in contrast to that of CsPbBr3 is due to the increase in the number of charge carriers in CsPbBr3 of the CsPbBr3/Cs4PbBr6 core–shell like system.60 Considering the previous report of J. Xu et al., it is assumed that the CsPbBr3/Cs4PbBr6 dual phase system possesses enhanced oscillator strength in comparison to the pure CsPbBr3, which favors to achieve intense bleach signal.61 The GSB trends observed for the CsPbBr3 and CsPbBr3/Cs4PbBr6 in TA profiles coincide with the previously reported core–shell materials.59,62–65 The GSB signals in the TA profiles of two samples, exhibited a red shift with an increase of delay time demonstrating that there exist multiple relaxation paths from the initial excited state after laser excitation.66–68 The positive absorption bands PA1 and PA2 show a slight red shift in the first few ps due to the exciton–exciton interaction,66 and the two absorption bands vanish as the delay time increases. Such a trend is because, soon after the completion of intraband cooling, the band edges are populated by the charge carriers, state filling induced bleach dominates the spectra and the carrier-produced stark effect vanishes.57 The absorption bands PA1 and PA2 reach the maximum at 20 ps and 0.5 ps, respectively, and then gradually decrease. Fig. 6c and d illustrates the TA kinetic curves of PA1, PA2, and GSB at 480, 526, and 507 nm for CsPbBr3 and 485, 530, and 513 nm for CsPbBr3/Cs4PbBr6 respectively in the delay time range of 0–1300 ps. The decay curves of two samples exhibited a single rise component along with two decay components. The bleach recovery dynamics of the two samples are fitted triexponentially with time constants τ1 (shorter), τ2 (longer), and τ3 (ultra-longer), which contributes to the process of hot-exciton intraband cooling time i.e., intraband relaxation, exciton trapping to the bandgap trap states, and exciton recombination, respectively.69τ1 = 0.35 ps, τ2 = 67.5 ps, and τ3 = 1.36 ns for CsPbBr3 and τ1 = 0.33 ps, τ2 = 101.4 ps, and τ3 = 1.57 ns for CsPbBr3/Cs4PbBr6. The longer exciton lifetimes (ns) for CsPbBr3/Cs4PbBr6 demonstrates that effective passivation of CsPbBr3 by Cs4PbBr6 was accomplished as a result of the reduced surface trap states. Notably, for CsPbBr3/Cs4PbBr6 resembling a core/shell system, hot charge carriers produced by excitation at 403 nm can be delocalized in the conduction band and valence band of both CsPbBr3 core and Cs4PbBr6 shell; as a result both the electrons and holes are depopulated in the CsPbBr3/Cs4PbBr6 system as compared to the pure CsPbBr3 and finally concentrate into the core, taking extra time. As a result the carrier cooling time in the CsPbBr3/Cs4PbBr6 system was observed to be longer. Due to the difference in the TA kinetic curves, the origin of PA2 is observed to be notably distinct from that of GSB. It is assumed that the formation of polarons by pump excitons could be the origin for PA2.55,58
 | ||
| Fig. 6 Femtosecond transient absorption (fs-TA) spectra of (a) CsPbBr3, (b) CsPbBr3/Cs4PbBr6 measured for various pump–probe delay times at 400 nm excitation, excited-state kinetic curves for the PA1, GSB, and PA2 of (c) CsPbBr3, (d) CsPbBr3/Cs4PbBr6. | ||
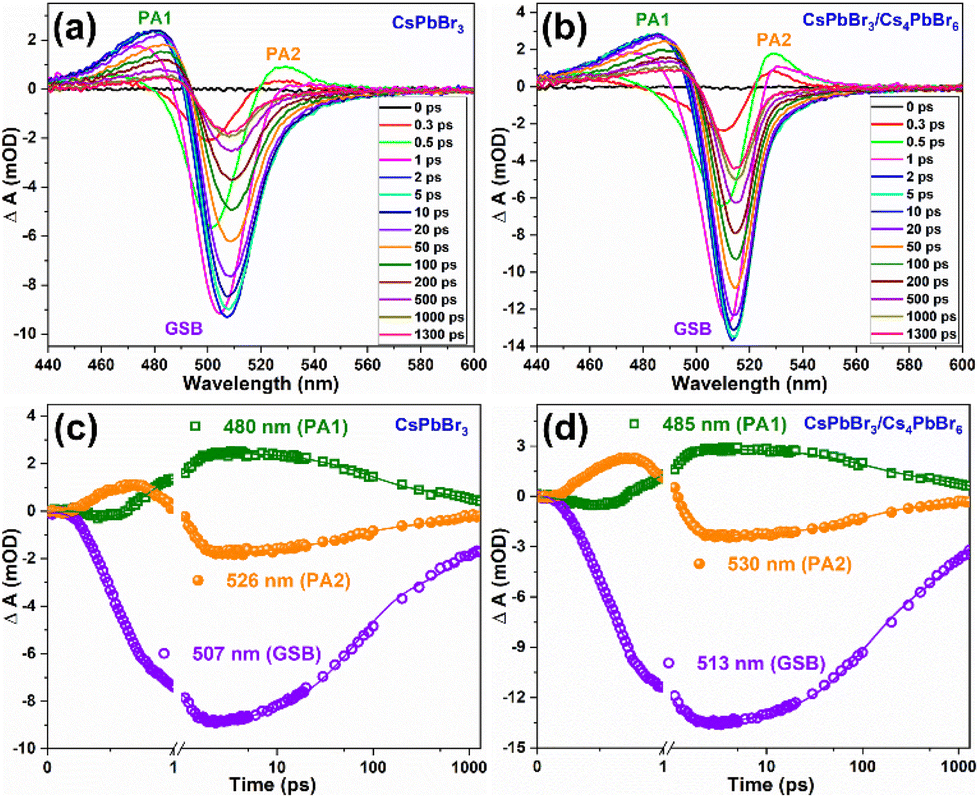
Furthermore, the optical performance of the CsPbBr3/Cs4PbBr6 MCs was explored by measuring the temperature dependence of the steady-state PL spectroscopy measured in the range of 77–300 K. Fig. 7a shows the temperature-dependent PL spectra of the CsPbBr3/Cs4PbBr6 MCs, which display two emission bands at 375 and 528 nm in the UV and green regions, respectively, under 315 nm excitation. The emission band at 375 nm is attributed to the 3P1 → 1S0 transition of the Pb2+ centers in the decoupled [PbBr6]4− octahedral units in Cs4PbBr6.46,70 The intense band in the green region at 528 nm is identical to the green emission of CsPbBr3, suggesting that the green emission of the Cs4PbBr6 MCs is associated with the emission of CsPbBr3 embedded in the Cs4PbBr6 crystal lattice. The position of the green peak at around 528 nm undergoes a blue shift, and its full-width at half-maximum (FWHM) increases with increasing temperature (Fig. S7†). Notably, at low temperatures, the excitons occupy discrete lower-energy levels; as the temperature increases, due to the phonon assistance, the electrons transition from these lower-energy levels to higher ones, which results in the blue shift of the green PL band. The PL intensity of both UV and green bands is quenched with increasing temperature because of the enhanced nonradiative relaxation at a higher temperature. Therefore, to understand the luminescence performance, the nonradiative relaxation process of the CsPbBr3/Cs4PbBr6 MCs was investigated by fitting the integrated luminescence of the green emission peak at around 528 nm using the Arrhenius relation:46,70–72IT = I0/[1 + Aexp(−Ea/kT)], where I0 is the integrated PL intensity at 0 K, Ea reflects the thermal quenching activation energy, k is the Boltzmann constant, and A is the strength of the thermal quenching process. The integrated PL intensity of CsPbBr3/Cs4PbBr6 is plotted as a function of temperature (77–300 K) in Fig. 7b and is well fitted by the above equation. The curve between the integrated PL intensity and the inverse of the temperature evolves to be constant at low temperatures and decreased monotonically with increasing temperature at elevated temperatures. The fit yields an exciton binding energy (BE) of 283.6 ± 32 meV, suggesting that exciton recombination contributes to the intense green emission. The exciton BE of the dual-phase CsPbBr3/Cs4PbBr6 MCs (283.6 ± 32 meV) in the present study is higher than previously reported for 3D CsPbBr3 NCs (37–47 meV).70,73 Due to the lower exciton BE in CsPbBr3, the excitons dissociate into free carriers and travel across the corner-sharing octahedra. In contrast, despite a higher BE, tightly bonded excitons are unlikely to spread through the crystal lattice but are confined in a single unit cell. The higher exciton BE of CsPbBr3/Cs4PbBr6 MCs is due to the exciton confinement in the 0D structure within the isolated [PbBr6]4− octahedral units. Therefore, it is contemplated that the excitons in the CsPbBr3/Cs4PbBr6 MCs can be Frenkel excitons rather than Wannier–Mott excitons, and the luminescence process proceeds through exciton recombination in the isolated octahedra.71,72,74 Under high-energy excitation, the high BE of the green emission suggests that a thermally triggered energy transfer occurs between the Pb2+ ions and [PbBr6]4− octahedra to the green emission centers. We further measured the photoluminescence quantum yield (PLQY) of the CsPbBr3 NCs and dual-phase CsPbBr3/Cs4PbBr6 MCs (Fig. S8a and b†). From the PLQY measurements, we realized that the CsPbBr3/Cs4PbBr6 MCs exhibit a remarkable PLQY of 82.7%, which is higher than that of the CsPbBr3 NCs (46.2%). It is speculated that the variation in the PLQY values of both materials can be attributed to the structural arrangement of their [PbBr6]4− octahedra and Cs+ cations. It is noteworthy that CsPbBr3 is characterized by corner-sharing [PbBr6]4− octahedra with Cs+ cations filling the voids, whereas Cs4PbBr6 is characterized by isolated [PbBr6]4− octahedra, which do not share any corners with Br ions. In the Cs4PbBr6 structure, each [PbBr6]4− octahedron is surrounded by a large number of Cs+ cations as compared to the CsPbBr3 structure. As a result, Cs4PbBr6 is unlikely to be affected by external conditions in the achievement of an efficient exciton PL.75,76 Moreover, the higher BE and the resulting confined character of the excitons in the isolated octahedra of the Cs4PbBr6 matrix are likely to be the reason for the higher PLQY in maintaining structural stability.
 | ||
| Fig. 7 (a) Temperature-dependent photoluminescence spectra of dual-phase CsPbBr3/Cs4PbBr6 MCs measured in the temperature range of 77–300 K under λexci = 315 nm, and (b) integrated photoluminescence intensity of the green peak as a function of temperature. | ||
Due to such remarkable luminescence properties, dual-phase CsPbBr3/Cs4PbBr6 MCs are promising candidates for application in solid-state lighting and display devices. However, their stability against various conditions, including UV light illumination, moisture, and heat, still needs to be explored before they can be used in w-LEDs. The stability of the CsPbBr3/Cs4PbBr6 MCs under different conditions was comparably analyzed with that of CsPbBr3 by monitoring their PL intensities at 365 nm excitation. The PL intensities of the dual-phase CsPbBr3/Cs4PbBr6 MCs and CsPbBr3 NCs dispersed in toluene as a function of the UV illumination time are compared for a time period of 120 h (Fig. 8a). Under UV illumination, the PL intensities of both samples in toluene exhibited a decreasing trend. The rate at which the PL intensity of CsPbBr3/Cs4PbBr6 decreases slowed down after 20 h, whereas the PL intensity of CsPbBr3 NCs gradually decreases at a constant rate. The remnant PL intensities were determined to be 76% for CsPbBr3/Cs4PbBr6 and 23% for CsPbBr3. Moisture resistance tests were conducted by storing the pellets of the CsPbBr3/Cs4PbBr6 MCs and CsPbBr3 NCs in an unsealed vial under ambient conditions (at 25 °C, relative humidity of 70%) for a period of time (150 min) (Fig. 8b). The PL intensities of both samples decrease, but the intensity of CsPbBr3 NCs decreases more than that of CsPbBr3/Cs4PbBr6 MCs. After 150 min of exposure, the percentage drop in the PL intensities are 42.7% for CsPbBr3/Cs4PbBr6 and 12.3% for CsPbBr3. It is well known that perovskite NCs are temperature-sensitive and exhibit relatively poor stability and luminescence quenching, which hinders their practical application. Therefore, thermal tolerance tests were conducted by heating the CsPbBr3/Cs4PbBr6 MCs and CsPbBr3 NCs at 120 °C under a 33% ambient condition for 24 hours (Fig. 8c). The PL intensities of both samples decrease slightly during the initial 5 min, but a sudden drop in the intensity of CsPbBr3 is observed afterwards. Meanwhile, a gradual decrease in the PL intensity of CsPbBr3/Cs4PbBr6 is observed with increasing heating time. The PL intensity drops faster for CsPbBr3 than for CsPbBr3/Cs4PbBr6 under the heat treatment. CsPbBr3/Cs4PbBr6 retains 51% of its initial PL intensity after 24 h, whereas the CsPbBr3 retains 8% (Fig. 8c). Subsequently, thermal recovery (luminescence quenching and recovery) tests were conducted by alternating heating and cooling under ambient conditions. The thermal recovery tests involved 10 heating–cooling cycles at two temperatures, 30 °C and 120 °C (Fig. S9a†). The test results reveal that the PL intensity of CsPbBr3/Cs4PbBr6 does not decrease after 10 heating–cooling cycles, exhibiting good reversibility. The PL spectra measured between the two temperature points exhibit no change in peak intensity, position, and shape, indicating that the emission from CsPbBr3/Cs4PbBr6 is fully reversible (Fig. S9b†).
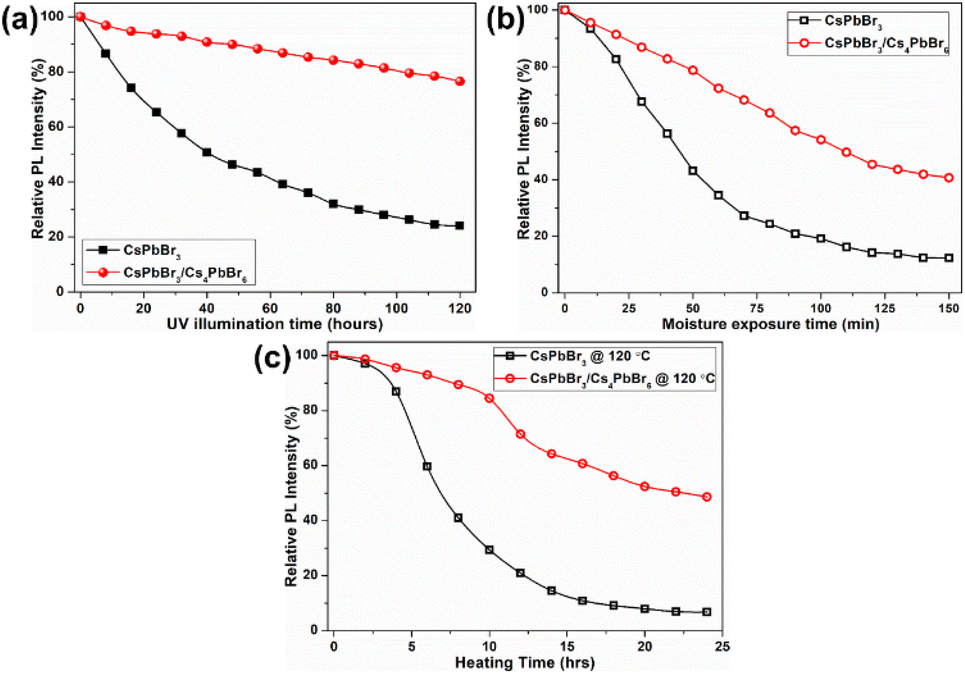 | ||
| Fig. 8 (a) UV irradiation test, (b) moisture resistance test, and (c) thermal tolerance test for CsPbBr3 NCs and dual-phase CsPbBr3/Cs4PbBr6 MCs conducted by monitoring their emission trends at 365 nm excitation. | ||
Based on the excellent optical properties and stability of the as-synthesized green-emitting CsPbBr3/Cs4PbBr6 MCs in different environments, their potential application in perovskite-converted w-LEDs for LCD backlighting is demonstrated. As a proof-of-concept experiment, a prototype w-LED was fabricated using a green-emitting CsPbBr3/Cs4PbBr6 MCs and a red-emitting K2SiF6:Mn4+ phosphor (λemi = 628 nm) combined with a blue-emitting InGaN LED chip (λemi = 455 nm) as the excitation source to realize white-light emission and achieve a wide color gamut. The K2SiF6:Mn4+ and CsPbBr3/Cs4PbBr6 powders were weighed in different weight ratios (0.05:1, 0.3:1, 0.6:1 and 0.9:1) and homogeneously dispersed in polystyrene solution, later drop-cast on a glass slide and then integrated onto the blue-emitting InGaN LED chip (details are provided in the ESI†). The LED devices with the K2SiF6:Mn4+-to-CsPbBr3/Cs4PbBr6 ratios (in wt%) of 0.05:1, 0.3:1, 0.6:1 and 0.9:1 are named LED-1, LED-2, LED-3, and LED-4, respectively. Fig. 9a shows the electroluminescence spectra of the fabricated LEDs (LED 1–4) under a 20 mA forward-bias current (2.56 V). The EL spectra of the composite ratio-dependent LEDs (LED 1–4) exhibit three discrete emission bands at 455, 532, and 628 nm, which are attributed to the blue LED chip, green-emitting CsPbBr3/Cs4PbBr6, and red-emitting K2SiF6:Mn4+ powders, respectively. Upon increasing the wt% of the red-emitting component in the composite, the color coordinates shift from the cool white-light region to the warm white-light region, corresponding to the correlated color temperature (CCT) decreasing from 12771 to 1815 K (Fig. 9b and Table S2†). The luminescence efficacy (LE) decreases from 101 lm W−1 to 42 lm W−1, and the color rendering index (CRI) tends to increase from 74 to 95 with an increase in the K2SiF6:Mn4+ ratio in the composite (Table S2†). The reason for such a trend could be that the blue light emitted from the InGaN chip is eventually absorbed by the gradually increasing wt% of the K2SiF6:Mn4+ phosphor, resulting in a much more intense red emission. The inset images are photographs of the working LEDs (LED 1–4). In the present study, the RGB spectra and wide color gamut space of the LED-2 device were explored by filtering its white-light spectrum using commercial red (R), green (G), and blue (B) color filters (CFs). Using RGB CFs, the color of the displayed objects on the screen is controlled by the transmitted light from the backlight.77 By varying the ratio between each transmitted RGB CFs, any color of a full-color LCD can be rendered within the color gamut.78 The transmittance spectra of commercial RGB CFs for LCDs are shown in Fig. 10a. The photographs of unfiltered white light and the RGB filtered white light of the LED-2 device are shown in Fig. 10b. The filtered RGB tricolor spectra of the white-light spectrum emitted from the LED-2 device fabricated using the composite (K2SiF6:Mn4+:CsPbBr3/Cs4PbBr6 in 0.3:1 wt% ratio) and blue LED chip are shown in Fig. 10c. The white and RGB color coordinates of the white-light emitting LED-2 device with CFs under 20 mA operating current are (0.3315, 0.3289), (0.6983, 0.3037), (0.1846, 0.7698), and (0.1442, 0.0749). The obtained white color coordinates (0.3315, 0.3289) are close to those of the standard illumination point D65 (0.3127, 0.3289) and equal energy point (0.333, 0.333) with efficacy of 68 lm W−1, CRI of 87%, and CCT of 5564 K. These results show that this device is a promising candidate for its potential application in solid-state lighting and display devices. Based on the filtered RGB color spectra, the LED-2 device achieves a wide color gamut that covers ∼118.78% of the National Television Standards Committee (NTSC) and ∼88.69% of ITU-R Recommendation BT.2020 (Rec. 2020) triangular spaces in the 1931 CIE diagram, indicated by the red-colored triangle in Fig. 10d. The wide color gamut achieved in this study is very encouraging and considerably better than that of recently reported perovskite-based w-LEDs.77,78 The details of the photometric and chromaticity parameters of the LED devices under 20 mA forward-bias current are listed in Table S2.† The CIE color coordinates and color gamut of the unfiltered EL spectrum of the white-light emitting LED-2 device are shown in Fig. S10.†
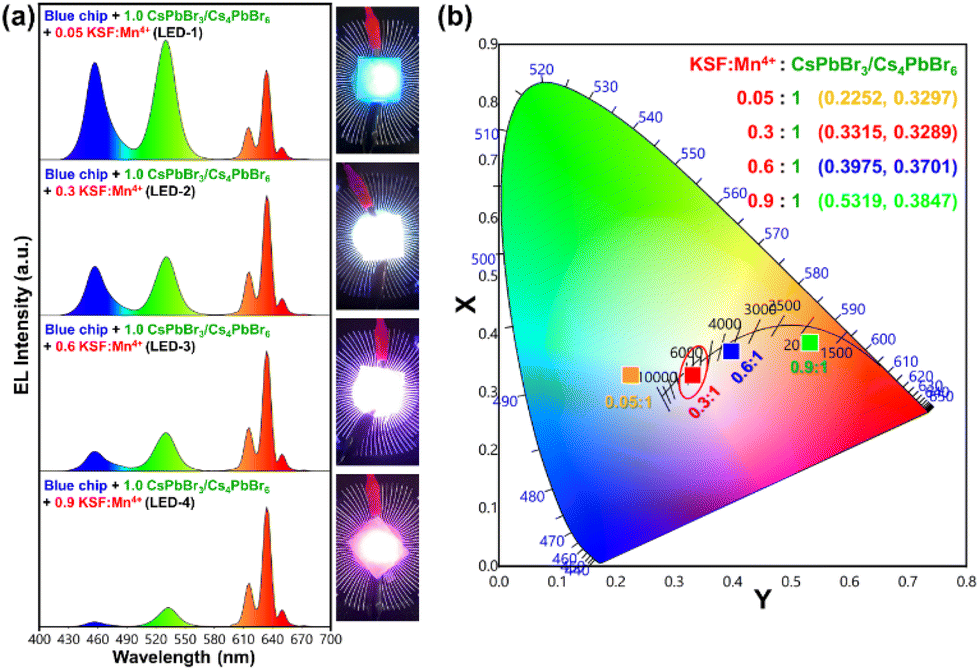 | ||
| Fig. 9 (a) The electroluminescence spectra of the designed LED devices by varying the K2SiF6:Mn4+ to CsPbBr3/Cs4PbBr6 ratio in the wt% of 0.05:1, 0.3:1, 0.6:1, and 0.9:1 under forward-bias current of 20 mA (inset images are photographs of the working LEDs (LED 1–4), (b) the CIE chromaticity coordinates corresponding to the constructed LED devices using different composite wt% ratios. | ||
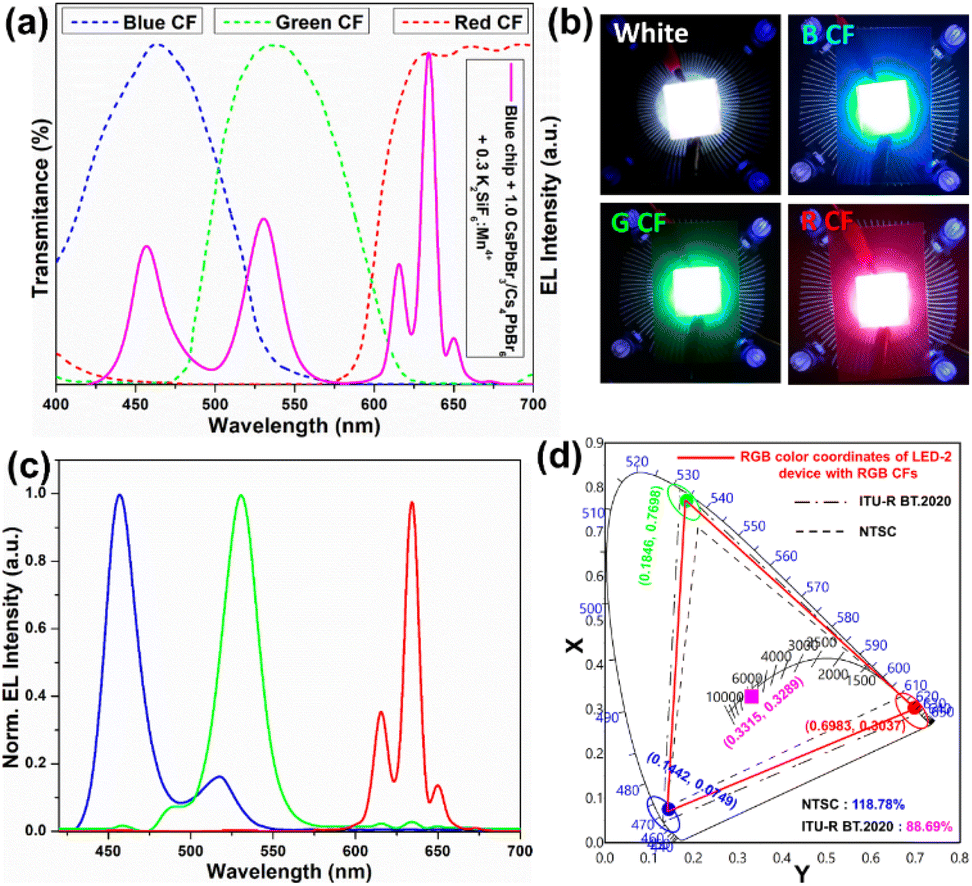 | ||
| Fig. 10 (a) The transmittance spectra of commercial RGB color filters and unfiltered EL spectrum of a white-light-emitting LED-2 device (K2SiF6:Mn4+:CsPbBr3/Cs4PbBr6 in 0.3:1 wt% ratio), (b) photographs of an unfiltered white-light emitting LED-2 device without CFs and with RGB CFs, (c) filtered RGB EL spectra from white-light emitting LED-2 device (normalized) and (d) CIE color coordinates of filtered RGB EL spectra from a white-light emitting LED-2 device and comparison of the wide color gamut of blue chip + green-emitting CsPbBr3/Cs4PbBr6 + red-emitting K2SiF6:Mn4+ indicated with NTSC standard triangle (––), and ITU-R BT.2020 triangle (–·–·–). | ||
Furthermore, we measured the EL spectra of the optimized LED-2 device at different forward-bias currents (20–200 mA), shown in Fig. S11a,† and it was found that the corresponding color coordinates depend on the operating current. With the increase in the forward-bias current from 20 to 200 mA, the EL intensity enhances, but no change in the shape of the output spectrum occurs, which indicates that the blue light does not saturate the CsPbBr3/Cs4PbBr6 luminescence. Additionally, the color coordinates shift from (0.3315, 0.3289) to (0.3047, 0.3611) with an increase in the CCT from 5986 to 6674 K. The LE decreases from 68.2 lm W−1 at 20 mA to 14.7 lm W−1 at 200 mA. Additionally, the EL spectra were recorded for different operating time intervals under ambient conditions to examine the stability of the fabricated w-LED operating at 20 mA of current for 10 h under a relative humidity of 70% (Fig. S11b†). No significant change in the shape of the spectra or shift is identified after 10 h. However, with increasing operating time under these conditions, the intensity of the green-emitting CsPbBr3/Cs4PbBr6 in the LED-2 device decreases, whereas the blue and red EL bands, which are attributed to the blue LED chip and K2SiF6:Mn4+, decrease only slightly. Due to their large-scale production, environmental friendliness, excellent photophysical properties, and strong stability under various environments, the dual-phase CsPbBr3/Cs4PbBr6 (core/shell structure) MCs can be a promising green-emitting material in optoelectronic devices.
Conclusions
To summarize, we have successfully synthesized large-scale and ligand-free dual-phase CsPbBr3/Cs4PbBr6 rhombohedral MCs using an ultrasonication approach at room temperature. The formation kinetics of the dual-phase CsPbBr3/Cs4PbBr6 was investigated at different reaction time intervals (t = 0–30 min). During the synthesis of the dual-phase composite, the CsPbBr3 phase is initially formed in a Pb-rich environment, followed by conversion into the Cs4PbBr6 phase when the solution is Cs-rich. Finally, with CsPbBr3 dissolution and Cs4PbBr6 crystallization, a dual-phase CsPbBr3/Cs4PbBr6 composite is formed exhibiting a high PLQY of 82.7%. The experimental characterization (HR-TEM and PL) provides conclusive evidence for the existence of a small quantity of CsPbBr3 impurities in the Cs4PbBr6 MCs, forming a dual-phase CsPbBr3/Cs4PbBr6 microstructure, producing strong green emission. The prototype w-LED device fabricated by combining CsPbBr3/Cs4PbBr6 and red-emitting K2SiF6:Mn4+ phosphors onto a blue-emitting InGaN LED chip exhibited a wide color gamut of ∼118.78% of the NTSC and ∼88.69% of the Rec. 2020. These findings strongly demonstrate that the dual-phase CsPbBr3/Cs4PbBr6 (core/shell structure) material can become a green light-emitting material for next-generation solid-state lighting and display applications.Author contributions
V. Naresh: conceptualization, investigation, methodology, data curation, formal analysis, writing – original draft; Taehyung Jang: transient absorption data curation and analysis; Yoonsoo Pang: resources, writing – review and editing. Nohyun Lee: conceptualization, supervision, project administration, funding acquisition, writing – review and editing.Conflicts of interest
There are no conflicts to declare.Acknowledgements
This research was supported by grants from the National Research Foundation of Korea (NRF), funded by the Korean government (2017M3A9G5082642 and 2019R1A2C1008021).References
- L. Protesescu, S. Yakunin, M. I. Bodnarchuk, F. Krieg, R. Caputo, C. H. Hendon, R. X. Yang, A. Walsh and M. V. Kovalenko, Nano Lett., 2015, 15, 3692–3696 CrossRef CAS.
- F. Chen, M. Imran, L. Pasquale, M. Salerno and M. Prato, Mater. Res. Bull., 2021, 134, 111107 CrossRef CAS.
- J. Maes, L. Balcaen, E. Drijvers, Q. Zhao, J. D. Roo, A. Vantomme, F. Vanhaecke, P. Geiregat and Z. Hens, J. Phys. Chem. Lett., 2018, 9, 3093–3097 CrossRef CAS PubMed.
- W. Zheng, Q. Wan, M. Liu, Q. Zhang, C. Zhang, R. Yan, X. Feng, L. Kong and L. Li, J. Phys. Chem. C, 2021, 125, 3110–3118 CrossRef CAS.
- S. Ullah, J. Wang, P. Yang, L. Liu, S. E. Yang, T. Xia, H. Guo and Y. Chen, Mater. Adv., 2021, 2, 646–683 RSC.
- Y. Zhang, R. Sun, X. Ou, K. Fu, Q. Chen, Y. Ding, L. J. Xu, L. Liu, Y. Han, A. V. Malko, X. Liu, H. Yang, O. M. Bakr, H. Liu and O. F. Mohammed, ACS Nano, 2019, 13, 2520–2525 CrossRef CAS.
- V. Naresh, V. N. K. B. Adusumalli, Y. I. Park and N. Lee, Mater. Today Chem., 2022, 23, 100752 CrossRef.
- V. K. Ravi, S. Saikia, S. Yadav, V. V. Nawale and A. Nag, ACS Energy Lett., 2020, 5, 1794–1796 CrossRef.
- J. Shi, W. Ge, J. Zhu, M. Saruyama and T. Teranishi, ACS Appl. Nano Mater., 2020, 3, 7563–7571 CrossRef.
- H. Chen, R. Li, A. Guo and Y. Xia, SN Appl. Sci., 2021, 3, 654 CrossRef.
- X. Liu, X. Zhang, L. Li, J. Xu, S. Yu, X. Gong, J. Zhang and H. Yin, ACS Appl. Mater. Interfaces, 2019, 11, 40923–40931 CrossRef CAS.
- Q. Zhong, J. Liu, S. Chen, P. Li, J. Chen, W. Guan, Y. Qiu, Y. Xu, M. Cao and Q. Zhang, Adv. Opt. Mater., 2021, 9, 2001763 CrossRef CAS.
- P. Kumar, M. Patel, C. Park, H. Han, B. Jeong, H. Kang, R. Patel, W. G. Koh and C. Park, J. Mater. Chem. B, 2020, 8, 10337–10345 RSC.
- V. Naresh, B. H. Kim and N. Lee, Nano Res., 2021, 14, 1187–1194 CrossRef CAS.
- X. Pang, S. Si, L. Xie, X. Zhang, H. Huang, S. Liu, W. Xiao, S. Wang, T. Xuan, J. Zhuang, C. Hu, Y. Liu, B. Lei and H. Zhang, J. Mater. Chem. C, 2020, 8, 17374–17382 RSC.
- Q. Wang, W. Wu, R. Wu, S. Yang, Y. Wang, J. Wang, Z. Chai and Q. Han, J. Colloid Interface Sci., 2019, 554, 133–141 CrossRef.
- T. Liang, W. Liu, X. Liu, Y. Li, W. Wu and J. Fan, Chem. Mater., 2021, 33, 4948–4959 CrossRef.
- J. Zhu, Q. Di, X. Zhao, X. Wu, X. Fan, Q. Li, W. Song and Z. Quan, Inorg. Chem., 2018, 57, 6206–6209 CrossRef.
- M. Li, X. Zhang, T. Dong, P. Wang, K. Matras-Postolek and P. Yang, J. Phys. Chem. C, 2018, 122, 28968–28976 CrossRef.
- Y. Jiang, B. Li, T. Zhang, Y. Shi and Q. H. Xu, ChemNanoMat, 2020, 6, 327–335 CrossRef.
- J. Shamsi, A. S. Urban, M. Imran, L. De Trizio and L. Manna, Chem. Rev., 2019, 119, 3296–3348 CrossRef.
- J. Yin, H. Yang, K. Song, A. M. El-Zohry, Y. Han, O. M. Bakr, J. L. Bredas and O. F. Mohammed, J. Phys. Chem. Lett., 2018, 9, 5490–5495 CrossRef.
- L. Wang, H. Liu, Y. Zhang and O. F. Mohammed, ACS Energy Lett., 2020, 5, 87–99 CrossRef.
- Q. A. Akkerman, S. Park, E. Radicchi, F. Nunzi, E. Mosconi, F. De Angelis, R. Brescia, P. Rastogi, M. Prato and L. Manna, Nano Lett., 2017, 17, 1924–1930 CrossRef PubMed.
- L. N. Quan, R. Quintero-Bermudez, O. Voznyy, G. Walters, A. Jain, J. Z. Fan, X. Zheng, Z. Yang and E. H. Sargent, Adv. Mater., 2017, 29, 1605945 CrossRef.
- X. Xiong, H. Liu, W. Wang, J. Gong, X. Chen, Y. Zhao, T. Tian and L. Wang, Luminescence, 2021, 36, 631–641 CrossRef PubMed.
- Y. K. Jung, J. Calbo, J. S. Park, L. D. Whalley, S. Kim and A. Walsh, J. Mater. Chem. A, 2019, 7, 20254–20261 RSC.
- M. Hu, C. Ge, J. Yu and J. Feng, J. Phys. Chem. C, 2017, 121, 27053–27058 CrossRef.
- M. De Bastiani, I. Dursun, Y. Zhang, B. A. Alshankiti, X. H. Miao, J. Yin, E. Yengel, E. Alarousu, B. Turedi, J. M. Almutlaq, M. I. Saidaminov, S. Mitra, I. Gereige, A. AlSaggaf, Y. Zhu, Y. Han, I. S. Roqan, J. L. Bredas, O. F. Mohammed and O. M. Bakr, Chem. Mater., 2017, 29, 7108–7113 CrossRef.
- D. Han, H. Shi, W. Ming, C. Zhou, B. Ma, B. Saparov, Y. Z. Ma, S. Chen and M. H. Du, J. Mater. Chem. C, 2018, 6, 6398–6405 RSC.
- Z. Ma, F. Li, D. Zhao, G. Xiao and B. Zou, CCS Chem., 2020, 2, 71–80 CrossRef.
- Z. Qin, S. Dai, V. G. Hadjiev, C. Wang, L. Xie, Y. Ni, C. Wu, G. Yang, S. Chen, L. Deng, Q. Yu, G. Feng, Z. M. Wang and J. Bao, Chem. Mater., 2019, 31, 9098–9104 CrossRef.
- N. Riesen, M. Lockrey, K. Badek and H. Riesen, Nanoscale, 2019, 11, 3925–3932 RSC.
- X. Chen, F. Zhang, Y. Ge, L. Shi, S. Huang, J. Tang, Z. Lv, L. Zhang, B. Zou and H. Zhong, Adv. Funct. Mater., 2018, 28, 1706567 CrossRef.
- L. Rao, Y. Tang, C. Song, K. Xu, E. T. Vickers, S. B. Naghadeh, X. Ding, Z. Li and J. Z. Zhang, Chem. Mater., 2019, 31, 365–375 CrossRef.
- J. Shamsi, A. S. Urban, M. Imran, L. De Trizio and L. Manna, Chem. Rev., 2019, 119, 3296–3348 CrossRef.
- L. Rao, X. Ding, X. Du, G. Liang, Y. Tang, K. Tang and J. Z. Zhang, J. Nanotechnol., 2019, 10, 666–676 Search PubMed.
- A. Moghtada and R. Ashiri, Ultrason. Sonochem., 2016, 33, 141–149 CrossRef CAS.
- G. Hu, W. Qin, M. Liu, X. Ren, X. Wu, L. Yang and S. Yin, J. Mater. Chem. C, 2019, 7, 4733 RSC.
- T. Xuan, S. Lou, J. Huang, L. Cao, X. Yang, H. Li and J. Wang, Nanoscale, 2018, 10, 9840 RSC.
- S. Cho and S. H. Yun, Commun. Chem., 2020, 3, 15 CrossRef.
- Y. Li, W. Shao, L. Chen, J. Wang, J. Nie, H. Zhang, S. Zhang, R. Gao, X. Ouyang, X. Ouyang and Q. Xu, NPG Asia Mater., 2021, 13, 40 CrossRef.
- Q. Xu, J. Wang, W. Shao, X. Ouyang, X. Wang, X. Zhang, Y. Guo and X. Ouyang, Nanoscale, 2020, 12, 9727–9732 RSC.
- W. Wang, Y. Wu, D. Wang and T. Zhang, ACS Omega, 2019, 4, 19641–19646 CrossRef CAS PubMed.
- W. Wang, D. Wang, F. Fang, S. Wang, G. Xu and T. Zhang, Cryst. Growth Des., 2018, 18, 6133–6141 CrossRef CAS.
- J. Yin, Y. Zhang, A. Bruno, C. Soci, O. M. Bakr, J. L. Bredas and O. F. Mohammed, ACS Energy Lett., 2017, 2, 2805–2811 CrossRef CAS.
- Z.-P. Huang, B. Ma, H. WanFg, N. Li, R.-T. Liu, Z.-Q. Zhang, X.-D. Zhang, J.-H. Zhao, P.-Z. Zheng, Q. Wang and H.-L. Zhang, J. Phys. Chem. Lett., 2020, 11, 6007–6015 CrossRef CAS.
- Y. Li, X. Yang and A. Xie, J. Lumin., 2021, 236, 118154 CrossRef CAS.
- T. Liang, W. Liu, X. Liu, Y. Li, W. Wu and J. Fan, Chem. Mater., 2021, 33, 4948–4959 CrossRef.
- P. Reiss, M. Protiere and L. Li, Small, 2009, 5, 154–168 CrossRef.
- Q. A. Akkerman, A. L. Abdelhady and L. Manna, J. Phys. Chem. Lett., 2018, 9, 2326–2337 CrossRef PubMed.
- F. Cao, D. Yu, X. Xu, Z. Han and H. Zeng, J. Phys. Chem. C, 2021, 125, 3–19 CrossRef.
- X. Li, Y. Wu, S. Zhang, B. Cai, Y. Gu, J. Song and H. Zeng, Adv. Funct. Mater., 2016, 26, 2435–2445 CrossRef CAS.
- N. Mondal, A. De, S. Das, S. Paul and A. Samanta, Nanoscale, 2019, 11, 9796–9818 RSC.
- N. Mondal and A. Samanta, Nanoscale, 2017, 9, 1878–1885 RSC.
- B. R. C. Vale, E. Socie, A. B. Caminal, J. Bettini, M. A. Schiavon and J.-E. Moser, J. Phys. Chem. Lett., 2020, 11, 387–394 CrossRef CAS.
- G. Kaur, K. J. Babu, N. Ghorai, T. Goswami, S. Maiti and H. N. Ghosh, J. Phys. Chem. Lett., 2019, 10, 5302–5311 CrossRef CAS PubMed.
- C. Qin, Z. Jiang, Z. Zhou, Y. Liu and Y. Jiang, Nanotechnology, 2021, 32, 455702 CrossRef CAS.
- J.-F. Liao, Y.-F. Xu, X.-D. Wang, H.-Y. Chen and D.-B. Kuang, ACS Appl. Mater. Interfaces, 2018, 10, 42301–42309 CrossRef PubMed.
- J. Dana, P. Maity, B. Jana, S. Maiti and H. N. Ghosh, ACS Omega, 2018, 3, 2706–2714 CrossRef PubMed.
- J. Xu, W. Huang, P. Li, D. R. Onken, C. Dun, Y. Guo, K. B. Ucer, C. Lu, H. Wang, S. M. Geyer, R. T. Williams and D. L. Carroll, Adv. Mater., 2017, 29, 1703703 CrossRef PubMed.
- G. Kaur, K. J. Babu, N. Ghorai, T. Goswami, S. Maiti and H. N. Ghosh, J. Phys. Chem. Lett., 2019, 10, 5302–5311 CrossRef.
- J. Yin, P. Maity, M. De Bastiani, I. Dursun, O. M. Bakr, J. L. Bredas and O. F. Mohammed, Sci. Adv., 2017, 3(12), e1701793 CrossRef PubMed.
- V. Gray, P. Xia, Z. Huang, E. Moses, A. Fast, D. A. Fishman, V. I. Vullev, M. Abrahamsson, K. M. Poulsen and M. L. Tang, Chem. Sci., 2017, 8, 5488–5496 RSC.
- Y. Wu, C. Wei, X. Li, Y. Li, S. Qiu, W. Shen, B. Cai, Z. Sun, D. Yang, Z. Deng and H. Zeng, ACS Energy Lett., 2018, 3, 2030–2037 CrossRef CAS.
- J. Xu, L. Zhu, J. Chen, S. Riaz, L. Sun, Y. Wang, W. Wang and J. Dai, Phys. Status Solidi RRL, 2021, 15, 2000498 CrossRef CAS.
- X. Shen, S. Wang, C. Geng, L. Li, E. Zhao, J. Sun, W. Wu, L. An and K. Pan, J. Phys. Chem. C, 2021, 125, 5278–5287 CrossRef.
- L. Wu, M. Zhang, S. Yang, R. Wu, S. Gong, Q. Han and W. Wu, J. Alloys Compd., 2021, 889, 161721 CrossRef.
- J.-S. Yao, J. Ge, B.-N. Han, K.-H. Wang, H.-B. Yao, H.-L. Yu, J.-H. Li, B.-S. Zhu, J.- Z. Song, C. Chen, Q. Zhang, H.-B. Zeng, Y. Luo and S.-H. Yu, J. Am. Chem. Soc., 2018, 140, 3626–3634 CrossRef PubMed.
- Z. Bao, Y. J. Tseng, W. You, W. Zheng, X. Chen, S. Mahlik, A. Lazarowska, T. Lesniewski, M. Grinberg, C. Ma, W. Sun, W. Zhou, R. S. Liu and J. P. Attfield, J. Phys. Chem. Lett., 2020, 11, 7637–7642 CrossRef.
- Y. Zhang, M. I. Saidaminov, I. Dursun, H. Yang, B. Murali, E. Alarousu, E. Yengel, B. A. Alshankiti, O. M. Bakr and O. F. Mohammed, J. Phys. Chem. Lett., 2017, 8, 961–965 CrossRef.
- H. Yang, Y. Zhang, J. Pan, J. Yin, O. M. Bakr and O. F. Mohammed, Chem. Mater., 2017, 29, 8978–8982 CrossRef.
- B. T. Diroll, H. Zhou and R. D. Schaller, Adv. Funct. Mater., 2018, 28, 1800945 CrossRef.
- H. Zhang, Q. Liao, Y. Wu, J. Chen, Q. Gao and H. Fu, Phys. Chem. Chem. Phys., 2017, 19, 29092–29098 RSC.
- M. I. Saidaminov, J. Almutlaq, S. Sarmah, I. Dursun, A. A. Zhumekenov, R. Begum, J. Pan, N. Cho, O. F. Mohammed and O. M. Bakr, ACS Energy Lett., 2016, 1, 840–845 CrossRef.
- D. Chen, Z. Wan, X. Chen, Y. Yuan and J. Zhong, J. Mater. Chem. C, 2016, 4, 10646–10653 RSC.
- Z. Luo, Y. Chen and S. T. Wu, Opt. Express, 2013, 21, 26269–26284 CrossRef PubMed.
- H. C. Yoon, S. Lee, J. K. Song, H. Yang and Y. R. Do, ACS Appl. Mater. Interfaces, 2018, 10, 11756–11767 CrossRef PubMed.
Footnote |
| † Electronic supplementary information (ESI) available. See DOI: https://doi.org/10.1039/d2nr05653d |
| This journal is © The Royal Society of Chemistry 2022 |