Heterojunction MnO2-nanosheet-decorated Ag nanowires with enhanced oxidase-like activity for the sensitive dual-mode detection of glutathione†
Lin
Tian
 *ac,
Zijun
Huang
a,
Weidan
Na
a,
Yuanyuan
Liu
a,
Shuai
Wang
b,
Yu
He
b,
Wenjing
Cheng
c,
Tianzi
Huang
b,
Zhao
Li
 *a and
Tongxiang
Li
*b
aSchool of Materials and Chemical Engineering, Xuzhou University of Technology, Xuzhou 221018, PR China. E-mail: xzittl@xzit.edu.cn; xzitlz@xzit.edu.cn
bSchool of Food (Biology) Engineering, Xuzhou University of Technology, Xuzhou 221018, PR China. E-mail: litx@xzit.edu.cn
cSchool of Chemistry and Environmental Science, Yili Normal University, Yili 835000, China
First published on 26th September 2022
Abstract
The biocatalytic design of nanomaterials with enzyme-like activity is considered a reliable and promising toolkit for the generation of diagnostic agents in complex biological microenvironments. However, the preparation of nanomaterials while maintaining a high catalytic activity in tumor cells (pH 6.0–6.5) poses a prominent challenge. Herein, we constructed a biomimetic enzyme-trigged dual-mode system with colorimetry at 652 nm and photothermal biosensors to detect glutathione based on hollow MnO2-nanosheet-decorated Ag nanowires (Ag@MnO2) as an oxidase-like nanozyme. As expected, Ag@MnO2 catalyzed the oxidation of 3,3′,5,5′-tetramethylbenzidine (TMB) in the absence of H2O2, leading to a blue-colored oxidized TMB (oxTMB) that displayed oxidase-like activity in pH 6.0. Interestingly, the portable dual-mode colorimetry and photothermal method for GSH was developed based on the redox reaction between GSH and oxTMB. This detection method exhibited a wide linear range of 0.1–55 μM for GSH with a low detection limit of 0.08 μM. This work highlights a new insight into nanotechnology by taking advantage of biomimetic design in biological analysis.
1. Introduction
Glutathione (GSH) is one of the main reactive sulfur species in biological systems and is known to regulate oxidative stress processes by adjusting the expression levels of oxidized glutathione (GSSG).1–3 Upon oxidation, GSH can be converted into the GSSG form.4,5 As an antioxidant, GSH participates in a variety of cellular processes including intracellular signal transduction, maintenance of protein structure, gene transcription regulation, and immune response.6,7 However, an abnormal level of GSH or the GSH/GSSG ratio is closely related with some diseases, such as tumors, and neurological, metabolism, and blood diseases.8 The level of GSH has been shown to be an important indicator to reflect the physiological or pathological states. Therefore, the quantitative and accurate determination of GSH is vital in the diagnosis of the aforementioned diseases. Currently, electrochemical, fluorescence, colorimetry, chromatography, and chemiluminescence methods are the mainstream techniques for performing GSH assays in the clinical laboratory.9–12 Among these methods, colorimetry has attracted great attention as a portable method for GSH detection due to its low cost and simple procedure without the requirement of professional operation.As described in the literature, the mechanism of colorimetry for GSH detection is initiated by reactive oxygen species (ROS), which then oxidizes 3,3′,5,5′-tetramethylbenzidine (TMB) to form blue-colored oxidized TMB (oxTMB), while the addition of GSH causes the color to fade.13,14 However, most of these approaches face problems, such as the requirement of high H2O2 concentrations as a substrate to generate ROS. Since H2O2 is susceptible to thermal decomposition, it is important to design oxidase-like enzymes whose catalytic activity does not rely on H2O2. Recently, synthetic biology strategies have led to the construction and engineering of nanomaterials with oxidase-like catalytic activities (so-called nanoenzymes) that offer powerful toolkits for biomarker determination.15,16 Compared with natural enzymes, nanozymes have advantageous properties, such as low cost, easy mass production, robustness, and tunable catalytic activity. Hence, they are suitable alternatives for detecting GSH concentrations utilizing a colorimetry method. In general, oxidase-like nanozymes should work efficiently under physiological conditions, but this is not always the case. Most oxidase-like nanozymes use chromogenic TMB as substrates, but they cannot be oxidized efficiently at neutral pH, thus restricting the biomarker detection of nanozymes. Nanoenzymes with oxidase-like activity could only react in a strongly acidic environment, which a neutral condition may not promote. More critically, most currently designed nanoenzymes for ROS generation cannot work efficiently in the tumor microenvironment (pH 6.0–6.5). To obtain better oxidase-like nanozymes, efforts have been made to improve the oxidase-like nanozyme activity at neutral pH, but with limited success to date as oxidation by oxidase-like MnO2 nanozymes at neutral pH was either non-existent or very slow due to its poor catalytic performance. In particular, interface engineering is considered to be one of the most potential methods to accelerate catalytic kinetics. Thus, the introduction of appropriate metals into MnO2 can improve the intrinsic catalytic activity by heterostructure engineering. On the one hand, an appropriate interface engineering can promote the electron transfer and redistribution. On the other hand, the distinctive atomic coordination at the interface will greatly enhance the catalytic activity.17–24 In addition, the partial delocalization of the spin status at the interface is a synergistic effect of the heterogeneous interface.25–27 This provides the possibility to break the scaling relationship, which is an important factor for promoting the catalytic performance. It is well known that the splitting of 3d orbitals and the corresponding electronic coupling will lead to an electron imbalance and consequently partial electron transfer. Ag with a similar electron arrangement state to and higher electronegativity than Mn has the ability to transfer electrons to Mn, which will stimulate the redox ability of Mn elements to enhance the catalytic activity. Moreover, Ag doping significantly enhances the intrinsic activity of the active site by enabling a redistribution of the charge density and interaction with the Mn metal elements. Besides, the rapid electron transfer of Mn-based nanocomposites exists due to their metal properties and well adjustable microstructure. In this regard, the rational design of oxidase-like nanoenzymes for efficient ROS generation independent of the need for strongly acidic conditions could bring new perspectives for GSH detection.
The “bottom-up” assembly of functionally living building materials into highly ordered nanostructures to form advanced nanomaterials offers a powerful toolkit to help them exert their catalytic activity in a wide pH range.28–31 In this work, we present the design and construction of a heterojunction Ag@MnO2 nanoenzyme for ROS generation with high efficiency. The nanoenzyme was prepared with Ag nanowires as the starting template, which allowed atomically loading MnO2 nanosheets via a typical hydrothermal method. The Ag@MnO2 nanoenzyme exhibited excellent activity in comparison with the control sample for O2˙− and hole generation. This was further investigated for O2˙− and hole generation in a wide pH range. It is worth noting that the effective oxidation of TMB could be triggered by Ag@MnO2 with high oxidase-like activity, leading to a transition from colorless (TMB) to blue (oxTMB). In addition, oxTMB is an outstanding photothermal agent. Based on this, a portable and sensitive dual-mode colorimetric and photothermal method utilizing MnO2@Ag as a probe for GSH detection is proposed. An excellent selectivity toward interference substrates was obtained because of the specific biochemical reaction between GSH and oxTMB. Moreover, according to the relatively independent signal transduction pathways, the two different detection methods could be verified by each other; thereby improving the accuracy of the detection results. Finally, practical application in tumor cells was investigated.
2. Experimental
2.1 Reagents and chemicals
Silver nitrate (AgNO3) and potassium permanganate (KMnO4) were purchased from Sinopharm Chemical Reagent Co., Ltd. Sodium citrate tribasic dihydrate (C6H5Na3O7·2H2O, 99%), 3,3′,5,5′-tetramethylbenzidine (TMB, 98%), sodium azide (NaN3), 2-propanol (IPA), benzoquinone (BQ), ethylenediaminetetraacetic acid disodium salt (EDTA-2Na), glutathione (GSH), Na2HPO4·2H2O, and KH2PO4 were purchased from Aladdin (Shanghai, China).2.2 Apparatus and measurements
The morphology and structure of the obtained Ag@MnO2 were characterized by field-emission scanning electron microscopy (FESEM; JEOL-6700F) and transmission electron microscopy (TEM; JEOL, JEM-2010). Elemental mapping images were performed using a TEM (JEOL, JEM-2100F) equipped with energy dispersive X-ray (EDX) spectroscopy. The composition was collected by an EDX spectroscopy unit attached to the FESEM instrument. The crystal phases of the Ag/MnO2 were measured by X-ray diffraction (XRD) on a Bruker D2 Phaser X-ray diffractometer with Ni-filtered Cu Kα radiation (λ = 1.5406 Å). The chemical states of the elements on the surface of the Ag/MnO2 were investigated by X-ray photoelectron spectrometry (XPS; ESCALAB 250).2.3 Synthesis of hollow Ag@MnO2 nanowires
![[thin space (1/6-em)]](https://www.rsc.org/images/entities/char_2009.gif) 000 rpm, 5 min). Finally, the purified Ag@MnO2 nanowires were stored at 4 °C.
000 rpm, 5 min). Finally, the purified Ag@MnO2 nanowires were stored at 4 °C.
2.4 Investigation of the oxidase-like activity of Ag@MnO2
The oxidase-like activity of the Ag@MnO2 nanoenzyme was studied by a color reaction using TMB as the substrate. Typically, 10 μL of Ag/MnO2 nanoenzyme (1 mg mL−1) was added in to 1000 μL PBS solution (pH 6.0, 0.1 M) containing 0.3 mM TMB and reacted at 25 °C for 3 min. The absorption spectra in the wavelength range of 300–800 nm were recorded by a TU-1900 UV-Vis spectrophotometer at 652 nm. In addition, the relative activity of the Ag@MnO2 nanoenzyme was studied under different pH values from 4.5 to 8.0.2.5 Kinetics and photothermal analysis
The kinetic parameters of the Ag@MnO2 nanoenzyme were determined based on the Michaelis kinetics model in this work.32–34 The reaction systems were conducted in 0.1 M PBS solution (pH 6.0) containing a series of TMB concentration (0.125–1.25 mM) in a 96-well microplate. Upon the addition of 10 μL of Ag@MnO2 nanoenzyme (1 mg mL−1), the absorbance value of the oxTMB at 652 nm was monitored by a microplate reader every 30 s. Then, the initial velocity u at different TMB concentrations was calculated based on the changes in absorbance over time. Finally, the Michaelis constant Km and maximal reaction velocity Vmax of the Ag@MnO2 nanoenzyme-oxidized TMB were fitted with the Michaelis–Menten equation by Origin 9.0, respectively.where u and Vmax are the initial and the maximum initial reaction rates, respectively, and [S] and Km are the substrate concentration and Michaelis constant, respectively.
2.6 Mechanism of the oxidase-like activity
To assess the effect of dissolved oxygen in the reaction system, the mixed solution of Ag@MnO2 nanoenzyme and TMB was bubbled with N2 for 30 min to remove oxygen and then reacted at 25 °C. After incubation for 3 min, the absorption signal intensity was monitored with a TU-1900 UV-Vis spectrophotometer.For natural free radicals detection, different free radical scavengers were used as probes to indicate the production of ROS during the experiments. Three reactive oxygen free radicals (˙OH, 1O2, O2˙−) were monitored by free radical scavengers, including NaN3, IPA, BQ, and EDTA-2Na.35 Briefly, the 0.1 M PBS solutions were exposed to the reaction solution of Ag@MnO2 nanoenzyme/TMB and different capture agents with different concentrations (0.5, 3, and 5 mM). Then, the absorption signal intensity was recorded by a microplate reader.
2.7 Dual-mode colorimetry and photothermal detection of GSH based on Ag@MnO2
For the colorimetry detection of GSH at 652 nm, in the reaction solution, 50 μL Ag@MnO2 nanoenzyme (1 mg mL−1) and 1000 μL TMB (0.8 mM) were added in to 1950 μL PBS solution (pH 6.0, 0.1 M) and reacted at 25 °C for 2 min. Then, different GSH concentrations were added for further reacting for 3 min. The color of the reaction solution was measured by the TU-1900 UV-Vis spectrophotometer to obtain the absorption spectrum in the wavelength range of 300–800 nm.For the photothermal detection of GSH, the temperature of the [Ag@MnO2 + TMB] reaction solution in a 96-well microplate was measured after 5 min of irradiation by a 808 nm laser. Then, different GSH concentrations were added into the above reaction solution. After incubation for 3 min, the temperature of every reaction solution was measured by a pen-type digital thermometer under 808 nm laser irradiation.
2.8 Real application in tumor cells
To prove the practical application of Ag@MnO2 in GSH detection, tumor cells were chosen for testing the system. The tumor cells solution was diluted with 0.1 M PBS solution. Then, the tumor cells solution was added to the reaction system [MnO2@Ag + TMB], and the GSH concentration was measured by the above-developed dual-mode detection method.3. Results and discussion
3.1 Characterization of Ag@MnO2
The preparation process of hollow Ag@MnO2 nanowires is illustrated in Scheme 1. First, Ag nanowires synthesized through a facile solvothermal method were used as the starting template. The TEM image displayed that the as-synthesized Ag nanowires were uniform with an average diameter of about 3 μm (Fig. S2†). Then, the as-synthesized Ag nanowires were converted to hollow Ag@MnO2 heterojunction nanowires through a typical hydrothermal method. The FESEM image showed that Ag@MnO2 still maintained the wire-like morphology, but the surface became rough (Fig. 1a–c). The TEM image further verified the well-defined hollow structure with a shell thickness of about 20 nm (Fig. 1d–f). The XRD pattern displayed the characteristic peak of Ag (Fig. 1g). The EDX analysis verified the presence of Ag, Mn, and O elements with a Ag to Mn atomic ratio of about 1![[thin space (1/6-em)]](https://www.rsc.org/images/entities/char_2009.gif) :
:![[thin space (1/6-em)]](https://www.rsc.org/images/entities/char_2009.gif) 1.48 (Fig. 1h). All the diffraction peaks of Ag@MnO2 could be indexed to the monoclinic phase of Ag (JCPDS no. 04-0783) and MnO2 (JCPDS no. 39-0375).35–39 Compared with Ag nanowires, the characteristic diffraction peaks of Ag on the Ag@MnO2 were shifted, illustrating that the Ag nanowires were converted into Ag@MnO2. The survey spectrum of XPS further revealed that Ag@MnO2 contained Ag, Mn, and O elements (Fig. 1i), which was consistent with the EDX results.
1.48 (Fig. 1h). All the diffraction peaks of Ag@MnO2 could be indexed to the monoclinic phase of Ag (JCPDS no. 04-0783) and MnO2 (JCPDS no. 39-0375).35–39 Compared with Ag nanowires, the characteristic diffraction peaks of Ag on the Ag@MnO2 were shifted, illustrating that the Ag nanowires were converted into Ag@MnO2. The survey spectrum of XPS further revealed that Ag@MnO2 contained Ag, Mn, and O elements (Fig. 1i), which was consistent with the EDX results.
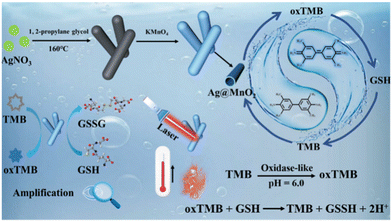 | ||
| Scheme 1 Schematic illustration of the synthesis of Ag@MnO2 nanowires and the process of dual-mode colorimetric and photothermal detection for GSH. | ||
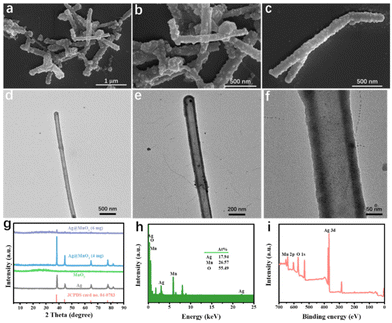 | ||
| Fig. 1 Characterizations of Ag@MnO2 (a–c) FESEM images; (d–f) low-magnification TEM images; (g) XRD patterns; (h) EDX spectrum; (i) XPS survey spectrum. | ||
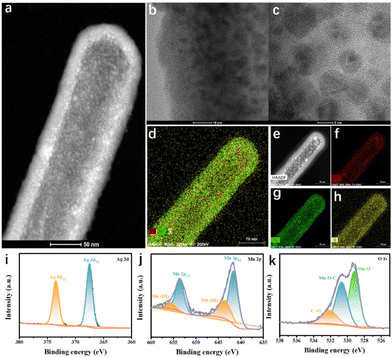
To further identify the heterostructure formation of Ag@MnO2, HRTEM characterization and high-resolution XPS spectroscopy were performed. In the HRTEM images, it could be observed that the delicately designed Ag@MnO2 had a hollow nanowire-like structure with a thick shell (Fig. 2a and d). Meanwhile, two distinct lattice fringes with interplanar spacings of 0.24 nm and 0.25 nm could be obviously seen, which were ascribed to cubic Ag(111) and a birnessite structure (101), respectively (Fig. 2b and c). Elemental mapping images of Ag@MnO2 in different regions further suggested that the Ag, Mn, and O elements were uniformly distributed (Fig. 2e–h). XPS is another powerful toolkit for exploring the surface chemical states of Ag@MnO2. As shown in Fig. 2i, the high-resolution XPS spectrum of Ag 3d displayed two peaks at 367.9 and 373.5 eV, representing the characteristic Ag 2d5/2 and Ag 3d3/2 peaks, respectively.40,41 The Mn 2p spectrum could be well deconvoluted into two pairs of peaks ascribed to Mn4+ and Mn3+, implying the existence of both Mn4+ and Mn3+ in Ag@MnO2 (Fig. 2j). The O 1s spectrum could be well deconvoluted into three peaks attributed to Mn–O, Mn–O–C, and C![[double bond, length as m-dash]](https://www.rsc.org/images/entities/char_e001.gif) O, respectively (Fig. 2k).42
O, respectively (Fig. 2k).42
3.2 Oxidase-like activity of Ag@MnO2
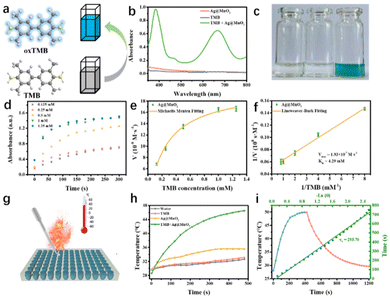
We next sought to investigate whether Ag@MnO2 was used as an oxidase-like nanoenzyme generator for catalyzing the common chromogenic substrate TMB in the absence of H2O2 and for subsequently producing the blue oxidation product oxTMB (Fig. 3a). Meanwhile, reactive oxygen species (ROS, such as ˙OH, O2˙−, H2O2, and 1O2) catalyzed by the dissolved oxygen were the main source of neutralizing intracellular strong reducing agent GSH. Surprisingly, [Ag@MnO2 + TMB], unlike pure TMB and Ag@MnO2 utilized as the control, exhibited a high oxidase-like activity, generating an obvious colorimetric signal compared to the control group (Fig. 3b and c). This result indicated the oxidase-like activity of Ag@MnO2.3.3 Steady-state kinetics and photothermal analysis
To further verify the oxidase-like activity, the steady-state kinetics of Ag@MnO2 was investigated. To this end, the change in the absorbance peak of TMB at 652 nm was recorded in time-scan mode by UV-Vis absorption spectroscopy in a reaction system containing Ag@MnO2 and TMB with a series of concentrations (0.125–1.25 mM). The characteristic absorbance signal increased with increasing the concentration of TMB, suggesting an increased content of ROS. In addition, Ag@MnO2 displayed typical Michaelis–Menten kinetics (a model of enzymatic dynamics) toward TMB in the absence of H2O2, which was then used to fit Lineweaver–Burk plots to measure the Michaelis–Menten constant Km and the Vmax. The manifested Km value and Vmax of Ag@MnO2 for TMB were 4.79 mM and 1.93 × 10⁻⁷ M s−1, respectively, confirming again the outstanding oxidase-like activity and that the high affinity of Ag@MnO2 toward TMB was obviously increased after the introduction of Ag in MnO2 and compared with the reported MnO2 nanoenzyme.Benefiting from the excellent oxidase-catalytic performance of Ag@MnO2, the pro-photothermal agent TMB could be effectively activated through the formation of oxTMB. To explore the oxidase-like activity for enabling the “switch-on” photothermal performance of Ag@MnO2, Ag@MnO2 without H2O2 stimulation was exposed to irradiation by an 808 nm laser (1.0 W cm−2, 480 s) at pH 6.0 (Fig. 3g). In the absence of TMB or Ag@MnO2, there was no obvious increase in the temperature of the PBS solution after 480 s of laser irradiation under a weak acidic condition (Fig. 3h). In contrast, after being activated by Ag@MnO2, the temperature of TMB solution was significantly elevated, suggesting that the absorbance signal of TMB was distinctly enhanced under a weakly acidic environment. Furthermore, according to the heat-transfer time constant and the maximum steady-state temperature, the photothermal-conversion efficiency of Ag@MnO2 was calculated to be 25.38% (Fig. 3i). These results consistently suggested that TMB, as a distinct pro-photothermal agent, is capable of exerting satisfactory photothermal performance under the stimulation of Ag@MnO2, which lays a solid foundation to monitor the GSH concentration through the activation of the photothermal property of TMB by the oxidase-like activity of Ag@MnO2.
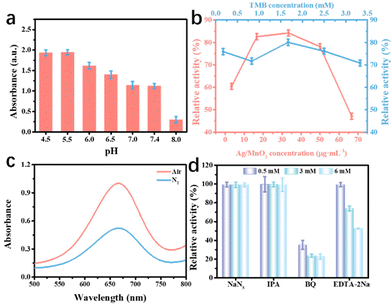
The oxidase-like activity of Ag@MnO2 closely depended on the pH values of reaction solution and its concentration. Thus, these influencing factors were evaluated. As seen in Fig. 4a, the oxidase-like activity was also pH dependent based on the optimal reactive speed under the acid conditions. More importantly, the synthesized Ag@MnO2 nanoenzyme showed strong catalytic activity under a weakly acid condition compared to the values of the reported nanoenzyme. In addition, we tested the concentration-dependent catalytic activity of Ag@MnO2 at pH 6.0 from 0 to 70 μg mL−1 (Fig. 4b). The optimal concentrations for Ag@MnO2 and TMB were 33.33 and 1.67 μg mL−1, respectively.
3.4 Mechanism for the oxidase-like activity of Ag@MnO2
According to reports, dissolved oxygen conversion into ROS was related to the catalytic performance of the oxidase-like activity. To investigate the effect of dissolved oxygen on the oxidase-like activity of Ag@MnO2, TMB oxidation tests were implemented under different atmospheric conditions (air and N2). As shown in Fig. 4c, the absorbance signal of [Ag@MnO2 + TMB] at 652 nm in the N2-purged solution treatment was 0.43 times that of the value collected in air, implying that dissolved oxygen participated in the oxidation of TMB. Then, diverse concentrations of ROS scavengers, including NaN3, IPA, BQ, and EDTA-2Na, were utilized to evaluate the ROS formation in the process of TMB oxidation. As displayed in Fig. 4d, there was a weak effect of the oxidase-like activity of Ag@MnO2 after the addition of NaN3 and IPA, suggesting that no 1O2 and ˙OH were produced in the TMB oxidation process. In contrast, the oxidase-like activities were obviously inhibited in the presence of BQ or EDTA-2Na, showing O2˙− and holes played a pivotal role in the TMB oxidation process. Therefore, Ag@MnO2 likely catalyzes the transformation of dissolved oxygen to O2˙− and holes, which further oxidize colorless TMB into blue oxTMB.3.5 Dual-mode detection for GSH
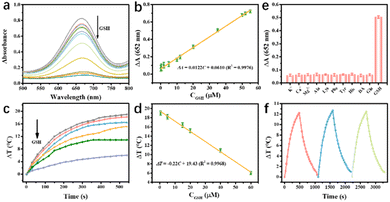
TMB is one of the most attractive oxidase-like substrates due to its good biocompatibility. TMB itself is colorless, and it can be converted into blue oxTMB by oxidants under acid conditions. Inspired by this, the oxidase-like activity of the prepared Ag@MnO2 motivated us to further explore its application in constructing a Ag@MnO2-based biosensing platform. Interestingly, GSH has a strong ability to reduce oxTMB to TMB, thus resulting in an obvious color and temperature change. GSH is naturally distributed in the human body, and its metabolism is closely related to various diseases, such as tumors and cardiovascular diseases. Therefore, there is an urgent need to design a portable and reliable method to detect GSH in tumor cells.Through determining the changes of absorbance intensity and temperature, GSH testing can be achieved with excellent performance (Fig. S1†). As seen in Fig. 5a, a gradual decrease in absorbance intensity at 652 nm was observed with increasing GSH Ag@MnO2 to 55 μM at pH 6.0. It was found that there was an excellent linear relationship between the absorbance intensity change (ΔA) and GSH concentration, expressed as ΔA = 0.0122C + 0.0610 (R2 = 0.9976). The limit of detection (LOD) was calculated to be 0.08 μM (3Sn/K, where Sn stands for the standard deviation (n = 4) in the blank sample, and K is the slope of the linear regression equation). In order to make the detection more accurate, a photothermal test was constructed due to the high photothermal conversion of oxTMB. As shown in Fig. 5c, as the GSH concentration increased, the temperature of the reaction system decreased dramatically under 808 nm laser irradiation for 540 s. Then the corresponding temperature of the Ag@MnO2–TMB–GSH reaction solutions under 808 nm laser irradiation was obtained and its relationship with the GSH concentration was determined, as exhibited in Fig. 5d. The linear relationship was ΔT = −0.22C + 19.43 (R2 = 0.9968). Compared with other reported nanoenzymes with oxidase-like performance for GSH detection (Table S1†), Ag@MnO2 displayed a wider linear range and lower LOD.
3.6 Selectivity and stability of Ag@MnO2
Given the complexity of the biological microenvironment in actual sample analysis applications, several amino acids and various inorganic ions as potential interfering substances were used to study the specificity of the constructed GSH biosensing platform. As seen in Fig. 5e, the absorbance changes of the interfering substances (1 mM) were almost the same as those of the control group, while GSH significantly inhibited the color reaction of TMB, suggesting that Ag@MnO2 as an oxidase-like nanoenzyme, possessed a highly specific recognition performance for GSH detection. Furthermore, the stability of the established biosensing platform was investigated through three heating/cooling cycles of 808 nm laser irradiation with thee photothermal biosensor toward GSH detection. As displayed in Fig. 5f, the reaction solution showed stable photothermal ability with consistent temperature rising for three cycles, demonstrating that the designed biosensor had satisfactory stability.3.7 Real-sample analysis
Real-sample analysis was conducted by monitoring GSH in tumor cells lysates and food-grade GSH. For calibration curve matching, the obtained real samples were diluted several times with PBS solution (pH 6.0) and used as a stock solution.43,44 For three spiked GSH concentrations, the recovery of the constructed dual-mode colorimetry and photothermal biosensor ranged from 94.38% to 105.49% with an RSD below 5% (Table S2†). All these results implied that this [Ag@MnO2 + TMB]-based dual-readout mode has the potential for application for GSH detection in actual samples.4. Conclusions
In summary, an innovative oxidase-like Ag@MnO2 nanozyme was rationally designed for accurate GSH detection under weakly acid conditions. As predicted, the synthesized Ag@MnO2 displayed considerable oxidase-like activity under near-neutral conditions in the absence of H2O2. The mechanism of the [Ag@MnO2 + TMB] reaction system came from the transformation of dissolved oxygen to O2˙− and holes. Based on the excellent oxidase-like activity of Ag@MnO2, a portable and sensitivity dual-mode biosensing platform for GSH detection was established, which exhibited a wide linear relationship ranging from 0.1 to 55 μM with the detection limit of 0.8 μM. Benefiting from the relatively independent signal transduction pathway, the constructed dual-mode biosensing platform avoided the false signals associated with mutual authentication. As the proof of principle, the constructed biosensor was successfully utilized for the detection of GSH with high sensitivity, selectivity, and stability, providing a new insight for catalysis and biological analysis.Conflicts of interest
There are no conflicts to declare.Acknowledgements
This work was financed by the Xuzhou Science and Technology Plan Project of China (KC21294, KC20186), Natural Science Foundation of the Jiangsu Higher Education Institutions of China (20KJB150043).Notes and references
- K. Umezawa, M. Yoshida, M. Kamiya, T. Yamasoba and Y. Urano, Nat. Chem., 2017, 9, 279–286 CrossRef PubMed.
- W. J. Zhang, F. J. Huo, F. Q. Cheng and C. X. Yin, J. Am. Chem. Soc., 2020, 142, 6324–6331 CrossRef PubMed.
- Q. Y. Cai, J. Li, J. Ge, L. Zhang, Y. L. Hu, Z. H. Li and L. B. Qu, Biosens. Bioelectron., 2015, 72, 31–36 CrossRef PubMed.
- Y. J. Zhu, J. F. Wu, K. Wang, H. Xu, M. M. Qu, Z. C. Gao, L. Guo and J. W. Xie, Talanta, 2021, 224, 121852 CrossRef PubMed.
- L. Qu, J. S. Li, Y. Du, L. Yang, X. Ren, L. Liu, X. J. Liu, Y. Y. Li and Q. Wei, ACS Appl. Mater. Interfaces, 2022, 14, 26271–26278 CrossRef PubMed.
- S. Lee, J. Li, X. Zhou, J. Yin and J. Yoon, Coord. Chem. Rev., 2018, 366, 29–68 CrossRef CAS.
- C. Y. Chen, W. Liu, C. Xu and W. S. Liu, Biosens. Bioelectron., 2015, 71, 68–74 CrossRef CAS PubMed.
- L. Jia, L. Y. Niu and Q. Z. Yang, Anal. Chem., 2020, 92, 10800–10806 CrossRef CAS PubMed.
- Z. N. Huang, S. X. Yu, M. L. Jian, Z. M. Weng, H. H. Deng, H. P. Peng and W. Chen, Anal. Chem., 2022, 94, 2341–2347 CrossRef CAS PubMed.
- X. Y. Sun, C. Wang, P. Li, Z. Y. Shao, J. Xia, Q. Liu, F. Shen and Y. Fang, Food Chem., 2022, 372, 131142 CrossRef CAS.
- J. W. Xie, D. Cheng, P. P. Li, Z. J. Xu, X. H. Zhu, Y. Y. Zhang, H. T. Li, X. Y. Liu, M. L. Liu and S. Z. Yao, ACS Appl. Nano Mater., 2021, 4, 4853–4862 CrossRef CAS.
- Y. Li, W. M. Liu, P. P. Zhang, H. Y. Zhang, J. S. Wu, J. C. Ge and P. F. Wang, Biosens. Bioelectron., 2017, 90, 117–124 CrossRef CAS PubMed.
- X. Y. Xu, Q. J. Sun, Y. M. Ma, X. X. Jiang, N. Niu and L. G. Chen, Sens. Actuators, B, 2022, 364, 131881 CrossRef CAS.
- Y. Huang, Y. Q. Gu, X. Y. Liu, T. T. Deng, S. Dai, J. F. Qu, G. H. Yang and L. L. Qu, Biosens. Bioelectron., 2022, 209, 114253 CrossRef CAS PubMed.
- Y. Gu, C. X. Fan, X. J. Hao, F. X. Hu, C. M. Zhang, H. B. Yang, C. M. Li and C. X. Guo, Adv. Funct. Mater., 2022, 32, 2110192 CrossRef CAS.
- Z. J. Chen, Z. C. Huang, Y. M. Sun, Z. L. Xu and J. W. Liu, Chem. – Eur. J., 2021, 27, 9597–9604 CrossRef CAS PubMed.
- Z. Li, X. Xu, X. Lu, C. He, J. Huang, W. Sun and L. Tian, J. Colloid Interface Sci., 2022, 615, 273–281 CrossRef CAS PubMed.
- Z. Li, C. Li, J. Huang, W. Sun, W. Cheng, C. He and L. Tian, Int. J. Hydrogen Energy, 2022, 47, 15189–15197 CrossRef CAS.
- L. Tian, H. Chen, X. Lu, D. Liu, W. Cheng, Y. Liu, J. Li and Z. Li, J. Colloid Interface Sci., 2022, 628, 663–672 CrossRef CAS PubMed.
- S. Tang, Y. Zhou, X. Lu, Z. Chen, Z. Huang, Z. Li and L. Tian, J. Alloys Compd., 2022, 924, 166415 CrossRef.
- Q. Zhang, M. Zhang, T. Chen, L. Li, S. Shi and R. Jiang, J. Electroanal. Chem., 2022, 916, 116363 CrossRef.
- Q. Zhang, K. Wang, M. Zhang, T. Chen, L. Li, S. Shi and R. Jiang, CrystEngComm, 2022, 24, 5580–5587 RSC.
- H. Xu, Y. Zhao, Q. Wang, G. He and H. Chen, Coord. Chem. Rev., 2022, 451, 214261 CrossRef.
- H. Xu, Y. Zhao, G. He and H. Chen, Int. J. Hydrogen Energy, 2022, 47, 14257–14279 CrossRef.
- H. Xu, B. Huang, Y. Zhao, G. He and H. Chen, Inorg. Chem., 2022, 61, 4533–4540 CrossRef.
- H. Xu, C. Wang, G. He, H. Chen and Y. Du, Inorg. Chem., 2022, 61, 14224–14232 CrossRef PubMed.
- W. Zhuang, Z. Li, M. Song, W. Zhu and L. Tian, Ionics, 2022, 28, 1359–1366 CrossRef CAS.
- Y. Chen, L. P. Mei, J. J. Feng, P. X. Yuan, X. L. Luo and A. J. Wang, Biosens. Bioelectron., 2019, 145, 111638 CrossRef CAS PubMed.
- M. Song, X. Lu, M. Du, Z. Chen, C. Zhu, H. Xu, W. Cheng, W. Zhuang, Z. Li and L. Tian, CrystEngComm, 2022, 24, 5995–6000 RSC.
- Q. X. Zhang, G. C. Fan, W. Chen, Q. Liu, X. Zhang, X. X. Zhang and Q. Y. Liu, Biosens. Bioelectron., 2020, 150, 111846 CrossRef CAS PubMed.
- Y. M. Sun, Z. Q. Xue, Q. L. Liu, Y. L. Jia, Y. L. Li, K. Liu, Y. Y. Lin, M. Liu, G. Q. Li and C. Y. Su, Nat. Commun., 2021, 12, 1369 CrossRef CAS PubMed.
- Z. Zhou and G. Roelfes, Nat. Catal., 2020, 3, 289–294 CrossRef CAS.
- Y. T. Su, F. Wu, Q. X. Song, M. J. Wu, M. Mohammadniaei, T. W. Zhang, B. L. Liu, S. S. Wu, M. Zhang, A. Li and J. Shen, Biomaterials, 2022, 281, 121325 CrossRef CAS PubMed.
- M. Liu, L. Huang, X. Y. Xu, X. M. Wei, X. F. Yang, X. L. Li, B. N. Wang, Y. Xu, L. H. Li and Z. M. Yang, ACS Nano, 2022, 16, 9479–9497 CrossRef CAS PubMed.
- H. H. Ren, F. H. Huang, J. M. Jiang, L. Wang and J. L. Zhang, Chem. Eng. J., 2022, 427, 132023 CrossRef CAS.
- T. Kim, Q. Z. Zhang, J. Li, L. F. Zhang and J. V. Jokerst, ACS Nano, 2018, 12, 5615–5625 CrossRef CAS PubMed.
- Y. Yuan, Q. Zhang, Y. L. Li, L. Y. Lv, Y. Hou, G. Li, J. Fu, L. Yang and Z. Y. Bai, Carbon Energy, 2022, 1–11 Search PubMed.
- W. J. Zhang, X. X. Yuan, X. H. Yan, M. Y. You, H. Jiang, J. Y. Miao, Y. L. Li, W. D. Zhou, Y. H. Zhu and X. N. Cheng, Front. Chem. Sci. Eng., 2022, 16, 420–432 CrossRef.
- N. Sohal, B. Maity, N. P. Shetti and S. Basu, ACS Appl. Nano Mater., 2021, 4, 2285–2302 CrossRef.
- R. T. Li, X. Y. Xu, B. E. Zhu, X. Y. Li, Y. X. Ning, R. T. Mu, P. F. Du, M. W. Li, H. K. Wang, J. J. Liang, Y. S. Chen, Y. Gao, B. Yang, Q. Fu and X. H. Bao, Nat. Commun., 2021, 12, 1406 CrossRef PubMed.
- Y. Zhao, X. J. Wang, S. Z. Yang, E. Kuttner, A. A. Taylor, R. Salemmilani, X. Liu, M. Moskovits, B. H. Wu, A. Dehestani, J. F. Li, M. F. Chisholm, Z. Q. Tian, F. R. Fan, J. Jiang and G. D. Stucky, J. Am. Chem. Soc., 2019, 141, 13977–13986 CrossRef PubMed.
- M. Fang, D. Han, W. B. Xu, Y. Shen, Y. M. Lu, P. J. Cao, S. Han, W. Y. Xu, D. L. Zhu, W. J. Liu and J. C. Ho, Adv. Energy Mater., 2020, 10, 2001059 CrossRef.
- M. P. Gamcsik, M. S. Kasibhatla, S. D. Teeter and O. Michael Colvin, Biomarkers, 2012, 17, 671–691 Search PubMed.
- R. N. Butler, W. J. Butler, Z. Moraby, M. J. Fettman, K. K. Khoo and I. C. Roberts-Thomson, J. Gastroenterol. Hepatol., 1994, 9, 60–63 CrossRef PubMed.
Footnote |
| † Electronic supplementary information (ESI) available. See DOI: https://doi.org/10.1039/d2nr04294k |
| This journal is © The Royal Society of Chemistry 2022 |


