
 Open Access Article
 This Open Access Article is licensed under a Creative Commons Attribution-Non Commercial 3.0 Unported Licence
Precursor chemistry of metal nitride nanocrystals
Mahsa
Parvizian
 and
Jonathan
De Roo
*
and
Jonathan
De Roo
*
Department of Chemistry, University of Basel, Basel, Switzerland. E-mail: Jonathan.DeRoo@unibas.ch; Tel: +41 61 207 10 46
First published on 15th November 2021
Abstract
Metal nitride nanocrystals are a versatile class of nanomaterials. Depending on their chemical composition, the optical properties vary from those of traditional semiconductor nanocrystals (called quantum dots) to more metallic character (featuring a plasmon resonance). However, the synthesis of colloidal metal nitride nanocrystals is challenging since the underlying precursor chemistry is much less developed compared to the chemistry of metal, metal chalcogenide or metal phosphide nanocrystals. Here, we review chemical approaches that lead (or could lead) to the formation of colloidally stable metal nitride nanocrystals. By systematically comparing different synthetic approaches, we uncover trends and gain insight into the chemistry of these challenging materials. We also discuss and critically evaluate the plausibility of certain suggested mechanisms. This review is meant as a guide for the further development of colloidal nitride nanocrystals.
 Mahsa Parvizian | Mahsa Parvizian completed her Bachelor and Master in chemistry at the University of Paris. In 2020 she started her PhD under the supervision of Prof. De Roo at the University of Basel. Her research focuses on the synthesis of metal nitride nanocrystals and their reaction mechanism. |
 Jonathan De Roo | Dr Jonathan De Roo studied chemistry at Ghent University and obtained his PhD on the surface chemistry of metal oxide nanocrystals in 2016. During his PhD, he was also three months at ETH Zurich to study the surface of CsPbBr3 nanocrystals. He completed a postdoc at Columbia University, working on crystallization mechanisms and the design of new ligands. In 2019, he joined the University of Basel as Tenure Track Assistant Professor. His research team focuses on mechanistic aspects in the synthesis of ceramic nanocrystals and atomically precise oxo-clusters. Both precursor conversion and crystallization mechanism are studied. |
1. Introduction
Various nanomaterials show size-dependent properties, e.g., magnetic, electrical, and optical properties that cannot be achieved in the bulk material. Therefore, the synthesis of uniform nanocrystals (NC) with controlled size and shape has been attracting a lot of attention.1 While atomic precision is still more an aspiration than a reality in nanocrystal science,2 it is imperative to produce colloids with narrow size distributions (low polydispersity) to allow the study of size dependent properties.3 One of the most well-known phenomena is the tunable luminescence of quantum dots (QDs), covering the entire UV-VIS-NIR spectrum depending on the QD size and chemical composition.4Ligand-assisted, wet chemical synthesis has provided the necessary control over nanocrystal size and shape.5 However, it is a complex process, combining metal–organic chemistry, inorganic crystallization and surface chemistry to yield an organic/inorganic hybrid object that is colloidally stable. The precursor conversion mechanism of many metals, metal chalcogenide, metal phosphide and metal halide NCs has been elucidated.6–9 and also their surface chemistry is increasingly better understood.10–16 The crystallization mechanism (i.e., nucleation and growth) causes more discussion in the literature.17,18 Approaches based on classical nucleation theory are at odds with the Finke–Watzky based mechanisms.19,20 Recent evidence shows that many NCs do not nucleate via a burst nucleation event, but rather that nucleation is a continuous process.21–23 Continuous nucleation does not necessarily lead to polydisperse ensembles because small NCs grow faster than larger NCs, allowing the newly formed NCs to catch up with the growing NC population.22–25 Even without a comprehensive framework for NC crystallization, chemists have been able to adjust the final NCs size by controlling the precursor conversion rate.26 The three aspects of colloidal synthesis (precursor conversion, crystallization and surface chemistry) are interdependent. An additional, often neglected parameter is the solvent. During high temperature nanocrystal synthesis, certain popular solvents decompose or polymerize, forming products that compromise the purity of the final NCs.27,28 Moreover, the purity of the ligand can considerably influence the solubility of the starting precursors and provide a better capping of the final NCs.29
While metal, metal chalcogenide and metal halide NCs are well studied, the metal pnictides have received less attention, with the exception of metal phosphides.9,30–33 Metal nitrides in particular are a versatile class of nanomaterials but their synthesis is not well developed. One difficulty is the higher thermodynamic stability of the oxides, compared to the nitrides (see Table 1). One can rationalize the lower standard formation free energy for nitrides because of the high bond enthalpy of dinitrogen (941 kJ mol−1) versus dioxygen (500 kJ mol−1).34,35 Another factor is the lower ionic character of metal nitrides since the enthalpy of formation of N3− is much higher than for O2− (2300 kJ mol−1versus 700 kJ mol−1).36 Only AlN and alkali(ne earth) metal nitrides are regarded as saline nitrides and they react quickly with water, releasing ammonia.37 On the other hand, boron and silicon nitride are almost purely covalent compounds with high stability.37 Transition metals like titanium form interstitial nitrides with extremely high chemical, thermal and mechanical stability.37 TiN has the fcc structure of metallic titanium with interstitial nitrogen atoms in the octahedral holes (Fig. 1). Given the above considerations, it is no surprise that metal nitride synthesis is generally carried out at a high temperature and with nitrogen precursors that are more reactive than molecular nitrogen.
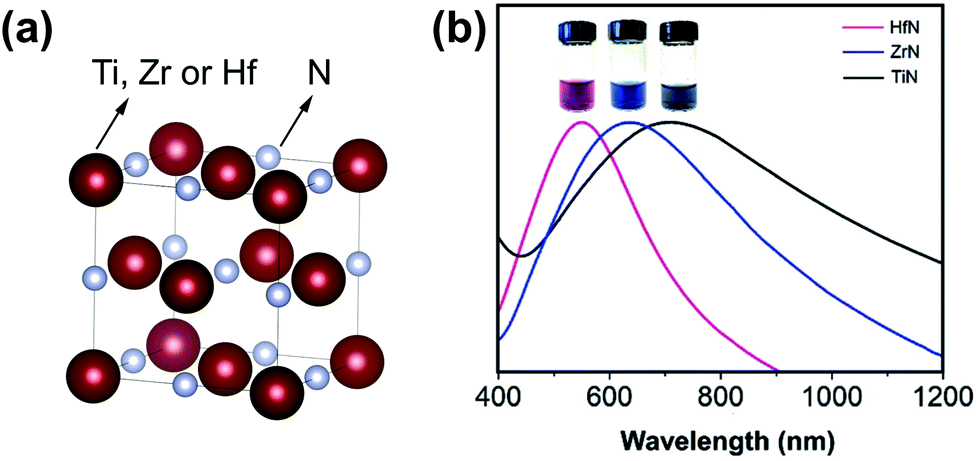 | ||
| Fig. 1 (a) Crystal structure of group 4 metal nitride. The metal is represented in purple and the nitrogen atom in grey. Structures plotted using VESTA.48 Cif file obtained from ref. 49–51 (b) Absorption spectra of aqueous dispersions of TiN, ZrN, and HfN NCs. The inset shows a photograph of the NCs dispersed in water. Reprinted from ref. 40 with permission from John Wiley and Sons, Copyright 2019. | ||
| Oxides |
|
Nitrides |
|
|---|---|---|---|
| TiO2 | −891.2 | TiN | −309.2 |
| ZrO2 | −1042 | ZrN | −336.8 |
| MnO2 | −464.4 | Mn3N2 | −146.4 |
| Fe2O3 | −744.8 | Fe2N | +12.6 |
| CoO | −213.8 | Co3N | +8.4 |
| CuO | −128.4 | Cu3N | +74.5 |
| ZnO2 | −318.4 | Zn3N2 | −20.9 |

Here, we review the existing synthetic strategies that lead to metal nitride NCs, with a focus on the chemical conversion reactions. A broader review on nitride nanomaterials, including porous and 2D materials can be found elsewhere.39 We target predominantly wet chemical syntheses and colloidally stable nanocrystal products. Other methods such as gas phase or solid state synthesis are only included when informative. We do not discuss nitride NCs of the alkali metals or alkaline earth metals since there are no synthetic procedures for nanocrystals available and they are extremely sensitive towards humidity, rendering them less technologically interesting. We will go systematically through the periodic system and discuss the nitrides per group, starting with group 4 and ending with group 13.
2. Group 4 metal nitrides
Group 4 transition metal nitrides have a high melting point, a high chemical stability and excellent corrosion resistance. TiN, ZrN and HfN have a cubic crystal structure (Fm![[3 with combining macron]](https://www.rsc.org/images/entities/char_0033_0304.gif) m space group) with a lattice constant of 4.239 Å, 4.585 Å, and 4.510 Å respectively, see Fig. 1. Their NCs exhibit a localized surface plasmon resonance (LSPR) in the visible region (HfN and ZrN) or in the near infrared regime (TiN), see Fig. 1.40 The plasmonic response translates in a highly efficient conversion of sunlight into heat, an effect that has been used for water evaporation and desalination.41–44 The position of the LSPR of TiN in the infrared region makes it suitable for photothermal therapies or plasmon-induced photocatalysis.45 Given the optical properties of the group 4 metal nitrides, they are an attractive alternative for gold NCs. Furthermore, they exhibit interesting catalytic properties. ZrN NCs possess excellent activity and long-term stability (superior to platinum) as catalysts for the electrochemical oxygen reduction reaction (ORR).46 Also HfN NPs are catalytically active for the oxygen evolution reaction (OER).47
m space group) with a lattice constant of 4.239 Å, 4.585 Å, and 4.510 Å respectively, see Fig. 1. Their NCs exhibit a localized surface plasmon resonance (LSPR) in the visible region (HfN and ZrN) or in the near infrared regime (TiN), see Fig. 1.40 The plasmonic response translates in a highly efficient conversion of sunlight into heat, an effect that has been used for water evaporation and desalination.41–44 The position of the LSPR of TiN in the infrared region makes it suitable for photothermal therapies or plasmon-induced photocatalysis.45 Given the optical properties of the group 4 metal nitrides, they are an attractive alternative for gold NCs. Furthermore, they exhibit interesting catalytic properties. ZrN NCs possess excellent activity and long-term stability (superior to platinum) as catalysts for the electrochemical oxygen reduction reaction (ORR).46 Also HfN NPs are catalytically active for the oxygen evolution reaction (OER).47
In 1988, TiN films were prepared using atomic layer epitaxy at 500 °C; TiCl4 precursor was pulsed into a reactor with gaseous ammonia.52 The colour depends on the stoichiometry of the film. For 40% N a golden yellow color is observed while for 50% a dark violet is obtained. Alternatively, Ti(NMe2)4 is reacted with ammonia. Similar strategies apply to ZrN and HfN. An extensive account of customized precursors for Chemical Vapour Deposition (CVD) of the group 4 nitrides is reviewed elsewhere.53
2.1. Non-thermal plasma synthesis
In 2017, powders of TiN were synthesized in a non-thermal plasma reactor (Fig. 2) from gaseous TiCl4 and ammonia.54| 6TiCl4 + 8NH3 → 6TiN + N2 + 24HCl | (1) |
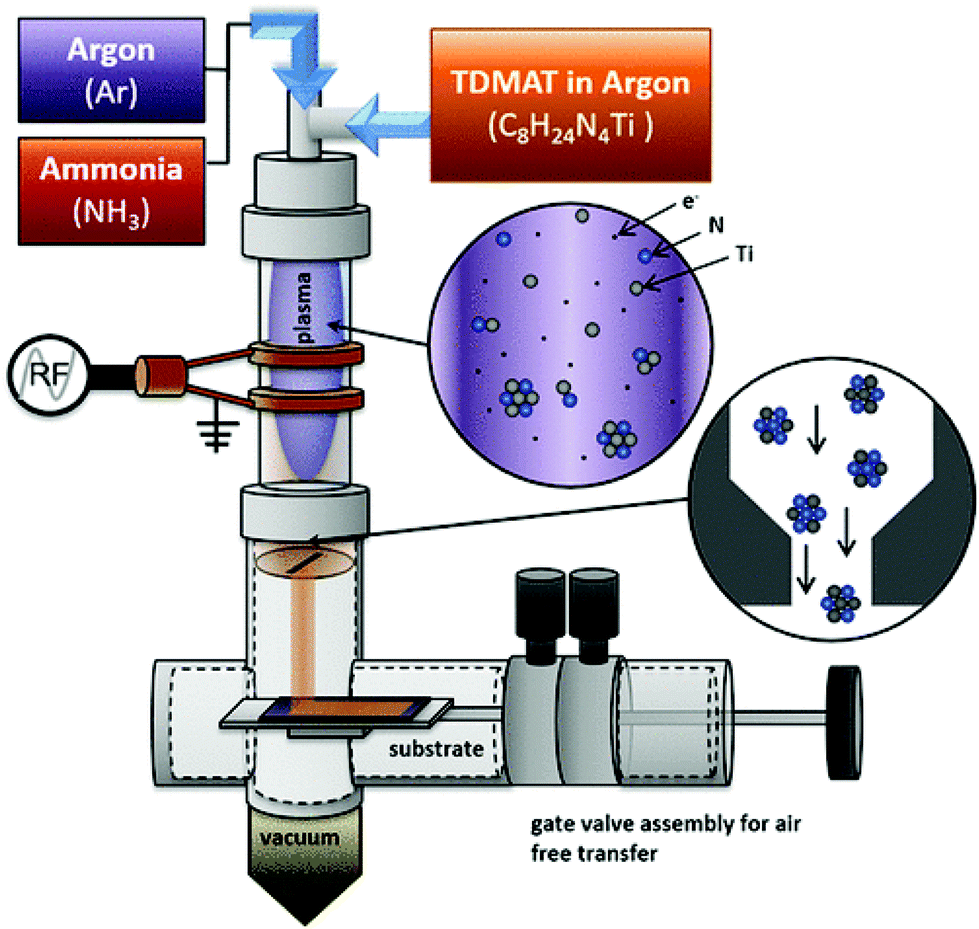 | ||
| Fig. 2 Diagram of the nonthermal plasma apparatus for TiN NCs synthesis. Reprinted with permission from ref. 55. Copyright 2018 American Chemical Society. | ||
The particle size is tuned from 3 to 8 nm by decreasing the flow rate of ammonia. The smaller particles are more oxidized than the bigger particles, but all show a plasmon resonance between 800 and 1000 nm. One can obtain ZrN nanocrystals in a similar fashion using ZrCl4 and NH3 as the precursors.56 After synthesis, the powders need to be heated at 200 °C in an Ar atmosphere to remove the ammonium salt by-products. To avoid this last step, TiCl4 was later replaced with tetrakis(dimethylamido) titanium (Ti(NMe2)4).55
| 6Ti(NMe2)4 + 8NH3 → 6TiN + N2 + 24HNMe2 | (2) |
Also here, the particles are 6–8 nm in size (Fig. 3) and have a well-defined plasmon resonance (around 800 nm). However, the particles are not monocrystalline (consisting of 2–3 nm crystallites) and contain a considerable amount of carbon.
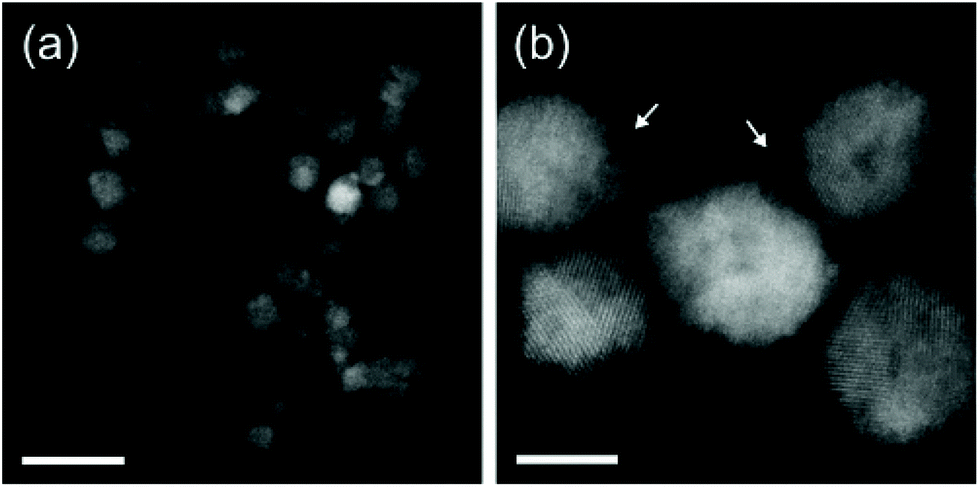 | ||
| Fig. 3 High-angle annular dark-field scanning transmission electron microscopy (HAADF-STEM) images of the obtained TiN NCs via non-thermal plasma synthesis. Scale bars are (a) 20 nm and (b) 5 nm. Reprinted with permission from ref. 55. Copyright 2018 American Chemical Society. | ||
2.2. Solution chemistry of titanium amido and imido complexes
In solution, TiCl4 reacts with tert-butylamine to the mixed chloro amido complex 1, see Fig. 4.571 has been used as a single source precursor for the CVD deposition of TiN. When 1 is reacted with triphenylphosphine oxide, 2 is formed (Fig. 4), which does not convert to TiN during CVD. Complex 1 is unstable at room temperature and slowly looses tert-butylamine, probably forming an imido species. This is supported by the formation of the monomeric tert-butylimido complex 3 by the addition of tert-butylpyridine as neutral Lewis base (Fig. 4).58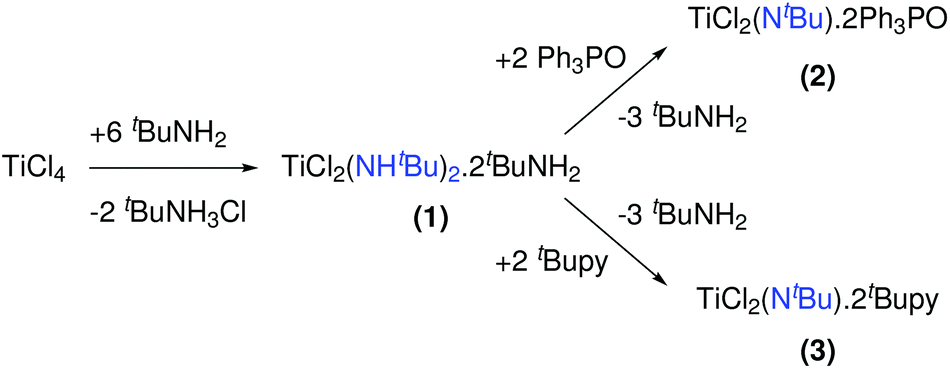 | ||
| Fig. 4 Reactions of titanium chloride with tertbutylamine and thiphenylphosphine oxide or tertbutylpyridine. | ||
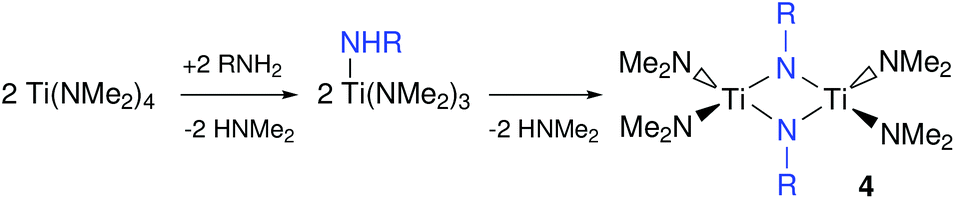
When Ti(NMe2)4 is treated with primary amines such as n-propylamine, n-octylamine or tert-butylamine, transamination occurs.59–61 Subsequently, the primary amido group self-condenses and thus forms alkylimido bridges, see Fig. 5. The rate of transamination and condensation is clearly dependent on the steric hindrance between the alkyl groups of the amine since it proceeds swiftly at room temperature for n-propylamine while tert-butylamine only forms the condensed product at 100 °C.61 When using an excess of primary amine, a polymeric, insoluble product is obtained.60 However, sols can be formed in tetrahydrofurane (THF) by controlling the amine to titanium stoichiometry. These sols were then used to coat silica via dip-coating and Ti(C,N) and TiN were obtained upon pyrolysis at high temperature (minimum 800 °C) under nitrogen or ammonia atmosphere respectively.62
 | ||
| Fig. 5 Transamination followed by self-condensation of primary metal amide group. | ||
Upon addition of one equivalent of primary amine to Ti(NMe2)4, the dimer 4 is formed, which can rearrange to a monomeric imido species by coordination of a Lewis base. Addition of two equivalents of trimethylsilylchloride to the latter complex yields the dichloroimido complex.61,63 The same product can be made by the addition of a primary amine to Ti(NMe2)2Cl2.64 Although most of the above titanium complexes have not been used so far to synthesize TiN NCs, they serve as valuable inspiration for future synthetic development and grant insight in the precursors chemistry of titanium and the rest of the group 4.
Recently, titanium chloride was reacted with potassium amide in pyridine at 300 °C.65 While the TEM image showed an isolated TiN nanocrystal of 5 nm, the XRD pattern was too broad to be consistent with a large ensemble of 5 nm crystals. Indeed, another TEM image clearly shows aggregated particles in an amorphous matrix.
2.3. Synthesis of group 4 nitride powders from the group 4 oxides
TiN NCs were obtained by Fischer et al. by using a mesoporous graphitic carbon nitride (mpg-C3N4) as both the confinement and nitrogen source.66 In this strategy, amorphous TiO2 (confined in the pores) is first prepared via a sol–gel procedure starting from TiCl4 in ethanol. In a second step, this composite product is heated to 800 °C under inert atmosphere or in sealed quartz ampoules. The confined metal oxide is transformed into pure TiN while the mpg-C3N4 is decomposed, see Fig. 6. The size of the final TiN NCs can be slightly adjusted (5.6 nm to 7.1 nm) by controlling either the pores of the starting mpg-C3N4 or changing the concentration of the initial TiCl4 precursor (filling rate). However, the resulting NCs are strongly aggregated.66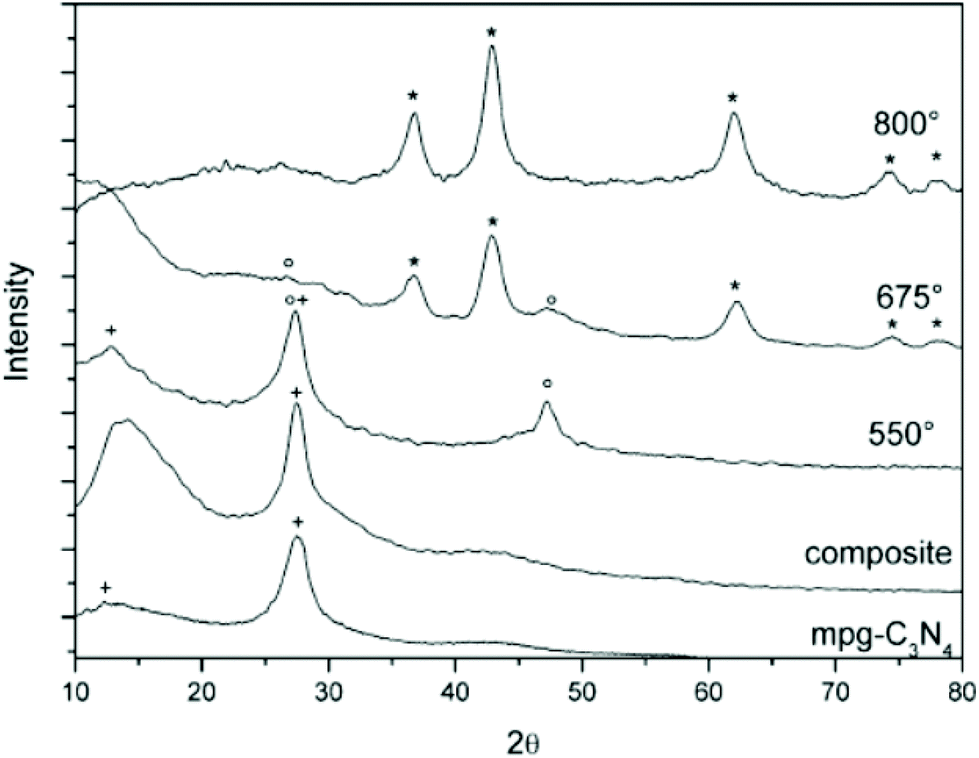 | ||
| Fig. 6 Temperature-dependent powder XRD analysis of the TiO2 precursor/mpg-C3N4 composites. (+) represents mpg-C3N4; (o), TiO2; and (*), TiN. Reprinted from ref. 66 with permission from John Wiley and Sons, Copyright 2007. | ||
In 2007, Buha et al. investigated the thermal transformation of pre-synthesized anatase TiO2 NCs into nanocrystalline TiN by using cyanamide or urea as a nitrogen source at 800 °C under nitrogen atmosphere.67 Complete transformation is achieved when starting from 5 nm titania while with 10 and 20 nm titania, anatase impurities are still present. This reflects the solid state nature of the approach. When using a high excess of cyanamide or urea, a large amount of amorphous carbon is also produced (20–25 wt%). This can be minimized to 2 wt% by reducing the cyanamide or urea amount. The resulting TiN NCs have an average crystallite size of 3 nm and are aggregated to 50 nm agglomerates, embedded in amorphous carbon. Similarly, ZrN nanocrystals were synthesized by reacting 10–15 nm ZrO2 nanocrystals with urea at 1100 °C under an ammonia flow.68 In 2009, Antonietti and coworkers presented the “urea glass route” which is a combination of sol–gel chemistry and the above strategy of Buha et al.69 First, TiCl4 is dissolved in ethanol, forming titanium ethoxide and releasing HCl as side product. Then a varying amount of solid urea is added to the solution and stirred until complete dissolution and the solvent is allowed to evaporate. The metal center is mostly coordinated to urea via the carbonyl oxygen as shown by FTIR data. The gel was then heated under N2 flow at 800 °C for 3 hours at a very slow rate of 3 °C min−1. A mechanism has been proposed based on thermal gravimetric analysis (TGA) and powder X-ray diffraction (XRD analysis. First, a glassy intermediate with nanoscale anatase and rutile titania is formed at 400 °C. Second, at 600 °C, loss of oxygen and metal reduction/nitridation is observed. Higher temperatures (800 °C) are required to obtain a complete recrystallization, see Fig. 7. A key parameter R has been defined as the ratio of urea and titanium. For R = 3, a mixture of TiN and TiO2 is obtained. Pure TiN is retrieved for R = 4, while Ti(C,N) was formed for R = 10. The higher R, the higher the carbon contamination so the optimal ratio for TiN is four. The authors expanded the procedure to many other metal nitrides (VN, NbN, GaN, CrN, Mo2N), but each metal has another optimal value for R.69 Later, the method was also applied to produce Sn3N4,70 HfN,47 and ZrN,46 as well as other nanocomposites such as graphene g-C3N4 doped with TiN.71,72 The nitride NCs obtained via this process are typically aggregated powders. Finally, other nitrogen sources were explored such as guanidine carbonate and barbituric acid. However, both features a particularly low solubility and it was not possible to achieve R > 1.69
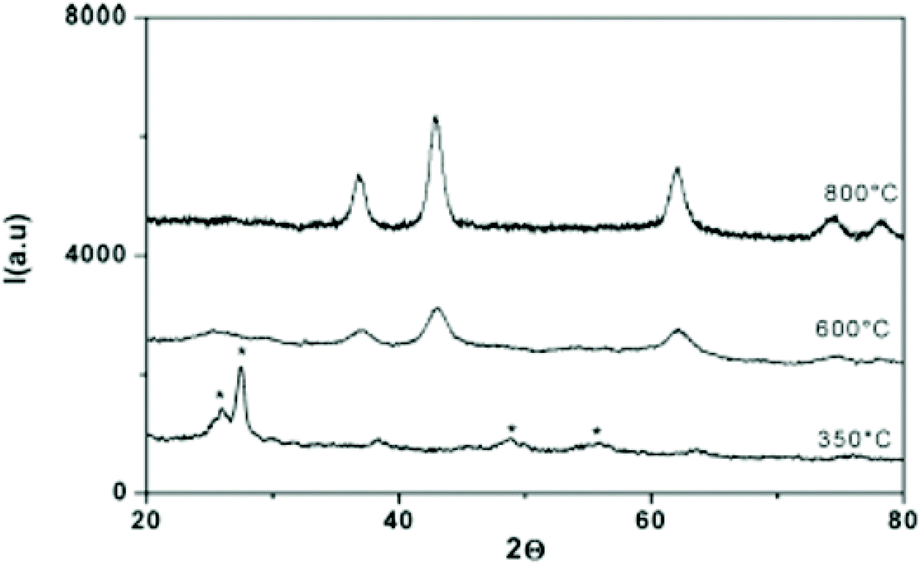 | ||
| Fig. 7 XRD pattern of titanium–urea gels (R = 10) treated at different temperatures. The * symbol refers to crystalline TiO2. Reprinted with permission from ref. 69. Copyright 2009 American Chemical Society. | ||
In 2019, Karaballi and coworkers also synthesized TiN, ZrN and HfN NCs from their parent oxide NPs.40 Their strategy consists of a high temperature (1000 °C) solid-state metathesis reaction of magnesium nitride with commercial TiO2 (17 nm), ZrO2 (19 nm), and HfO2 (43 nm).
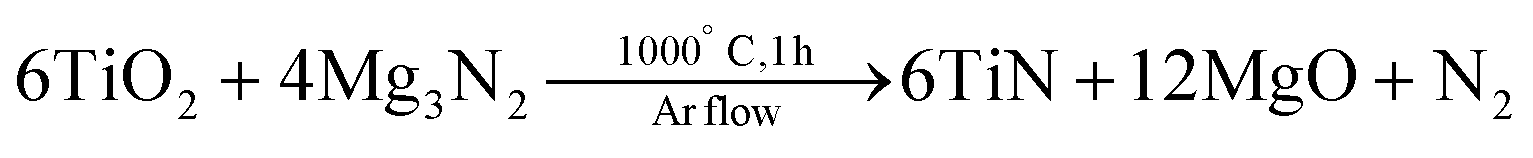 | (3) |
The final product is treated with 1 M HCl to remove MgO and unreacted Mg3N2, and could be dispersed in water.40 All compounds have the expected cubic crystal structure and the nanocrystal size is 12, 15 and 11 nm for TiN, ZrN and HfN respectively. The NCs seem aggregated on transmission electron microscopy (TEM) but it is unclear whether this occurred during the sample preparation or already in solution. The reaction could be easily scaled to 1 g of metal nitride. Efforts to significantly increase the particle size by using larger oxide NCs were unsuccessful, indicating new nucleation events of the nitride, rather than a simply anion exchange reaction. The localized surface plasmon resonance of the NCs is blue-shifted and more narrow in the series: TiN, ZrN and HfN (Fig. 1). Finally, all particles were slightly oxidized at the surface and this effect was worse for ZrN and HfN, compared to TiN. This scalable strategy of Karaballi et al. appears to produce high quality group 4 nitrides. While they are highly crystalline, their size dispersion could be improved. The method has already been adopted by other groups to produce, e.g., plasmonic HfN nanocrystals.73
In 2017, Kan et al. explored molten salts (here: a eutectic mixture of MgCl2 and NaCl) as a reaction medium for the synthesis of TiN from TiO2 and Mg powder under N2 atmosphere. The use of a higher Mg equivalent versus TiO2 (up to 4 equivalent), higher heating temperature (up to 1100 °C), or longer reaction time (up to 7 h) leads to phase pure TiN with a better crystallinity as judged by the well-defined diffraction peaks obtained by XRD. The authors obtained 5–30 nm aggregated TiN NPs by using 2.5 equivalent of Mg heated at 1100 °C for 3 h. The authors described the mechanism as being a dissolution–precipitation type based on the increase of the surface area from the starting TiO2 (9.83 m2 g−1) to the obtained TiN (93.09 m2 g−1).74
3. Group 5 metal nitrides
Group 5 metal nitrides (VN, NbN and TaN) have the same crystal structure as group 4 metal nitrides; a cubic crystal structure with a Fmm space group with a lattice constant of 4.13 Å,75 4.394 Å,49 and 4.331 Å (ref. 76) respectively. These group 5 nitrides exist as well in other oxidation states with less common crystal structures (orthorhombic, tetragonal and hexagonal), e.g., Ta3N5, Ta4N5 or Ta5N6. Vanadium nitride has attracted interest as an active material for supercapacitors (SC) due to its high specific capacitance as well as high electrical conductivity.77 Niobium nitrides (Nb2N, Nb4N3, NbN, etc.) are mainly investigated as superconductors. Furthermore, nitrogen-rich niobium nitrides are good candidates for electrochemical capacitors.78,79
VN and NbN nanopowders were synthesized via the urea glass route (see above).69 Agglomerated VN NCs with a crystallite size of 6 nm have been synthesized by Choi et al. via a two-step method. First, ammonolysis of VCl4 forms amorphous V(NH2)3Cl. Second, the amorphous precursor is crystallized at 400 °C in the presence of NH4Cl under an ammonia atmosphere.80 This method is one of the main chemical methods to form VN NCs,81 as well as NbN NCs.82
In 1972, Ta3N5 powder and thin films were obtained at 1100 K starting from ammonia and Ta2O5 powder or Ta thin films respectively.83 This strategy was recently pursued to prepare Ta3N5 nanotubes.84 In 1995, TaN films were made using the CVD method with tert-butylimidotris(diethylamido) tantalum as precursor at temperatures ranging from 450 °C to 650 °C.85 Nanocrystalline TaN with a cubic phase has been synthesized via a solid combustion synthesis using K2TaF7, NaN3, and NH4F precursors under high temperatures up to 850 to 950 °C.86
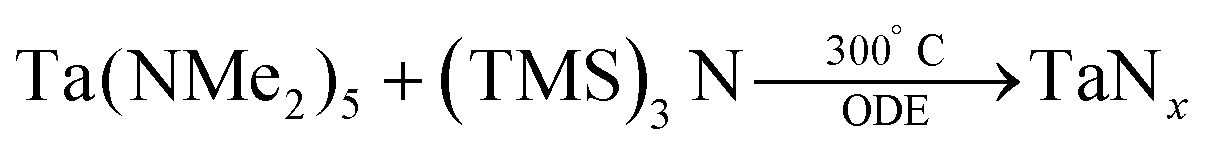
In 2011, Ho et al. have reported three methods for the synthesis of colloidal Ta3N5 NCs.87 In their first method TaCl5 is dispersed in octadecene (ODE). At 310 °C, tris(trimethylsilyl)amine ((TMS)3N, dissolved in trioctylphosphine) is injected and the particles are left to crystallize for 20 min at 300 °C.
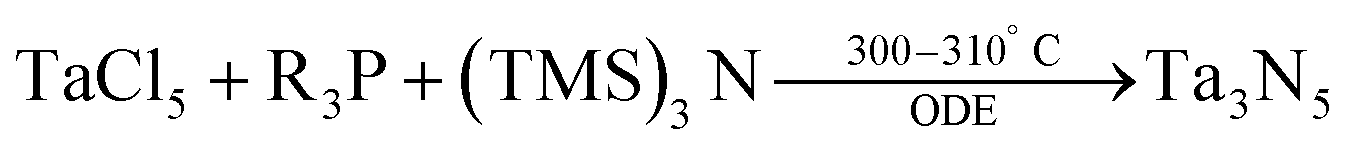 | (4) |
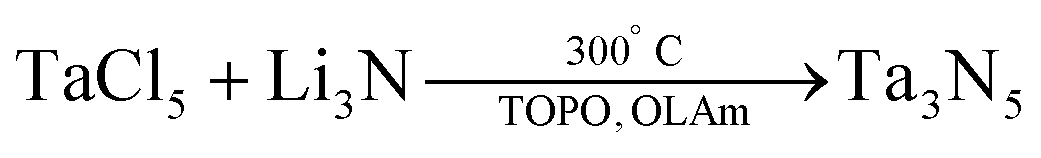
The resulting NCs (23 nm, see Fig. 8A) could not be redispersed in any solvent after precipitation due to a lack of strongly binding ligands. Smaller (10 nm) NCs were formed at a reaction temperature of 200 °C. The authors report that the synthesis is sensitive to the purity of TaCl5; at least 99.99% purity is required, and even then the yield was very low (which was attributed to the low solubility of TaCl5 in ODE). In their second method, tantalum chloride was dissolved in a mixture of oleylamine (OLAm) and trioctylphosphine oxide (TOPO). Li3N was added at 300 °C.
 | (5) |
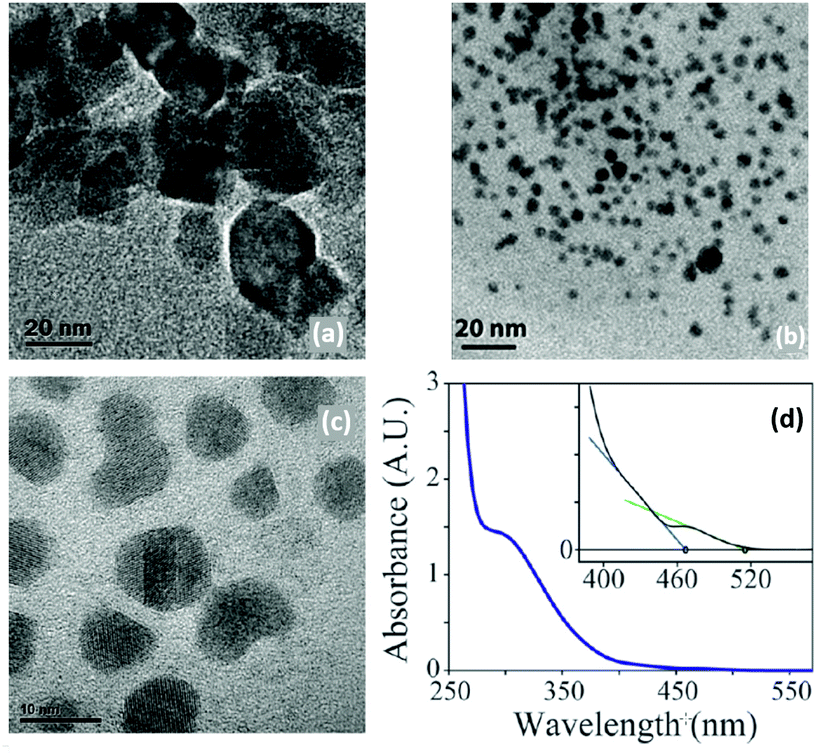 | ||
| Fig. 8 TEM images of Ta3N5 obtained by Ho et al.87 (a) NPs obtained with TaCl5 and (TMS)3N (scale 20 nm), (b) with Ta(NMe2)5 and (TMS)3N (scale 20 nm) (c) with TaCl5 and Li3N (scale 10 nm). (d) Absorption spectrum of the obtained 10 nm Ta3N5. The inset showing the two limiting regimes. Adapted with permission from ref. 87. Copyright 2010 American Chemical Society. | ||
The resulting NCs (2–8 nm after 20 min reaction, see Fig. 8B) could be redispersed in hexane after precipitation with methanol. When the reaction is left to proceed for 1 hour, 10 nm NCs are obtained. Their absorption spectrum has two absorption onsets (467 nm and 515 nm) which is explained by the absorption of Ta3N5 (515 nm) and that of a higher bandgap material, likely an oxidized shell. XPS data indeed confirm the presence of oxidic tantalum. To counter the low yields in the previous methods, the authors devised a third method. Pentakis(dimethylamido)tantalum and (TMS)3N were dissolved in ODE and injected in pure ODE at 300 °C (Fig. 8C). However, the formed particles were amorphous and highly sensitive to air.87 For all three methods, the crystallinity of the resulting particles was solely assessed by TEM and an ensemble measurement (e.g., XRD) is missing.
 | (6) |
In 2013, a sol–gel pathway was demonstrated with Ta(NMe2)5 and n-propylamine.88 Transamination occurs readily but the condensation appears to be slower than for titanium (see section on titanium nitride for details on transamination and condensation). Upon solvent evaporation a gel was formed. Solvent removal by vacuum resulted in a xerogel that converted in an ammonia atmosphere at 800 °C into Ta3N5 powder with a crystal size of 20 nm. Thin films were obtained by coating the a silica slides with the sol. Firing at 600 °C leads to TaN while heating to 800 °C yields Ta3N5.88
It is thus clear from the above that nanocrystals of the group 5 nitrides have not been convincingly obtained in colloidal form. While this is the first challenge for the future, the second challenge is to control the oxidation state and the polymorphism of these materials.
4. Nickel nitride
Nickel nitride Ni3N has a hexagonal epsilon-Fe3N-type structure with a P6(3)22 space group, see Fig. 9. The two lattice constants are 4.622 Å and 4.305 Å.89 Nickel nitride is interesting for various applications such as lithium-ion batteries,90 magnetic NPs,91,92 catalysis and electrocatalysis,93,94 including hydrogenation, hydrogen, and oxygen evolution reactions (OER).95,96 The early chemical synthetic methods to obtain Ni3N were based on the decomposition of nickel complexes at high temperatures and in presence of ammonia or hydrazine.90,92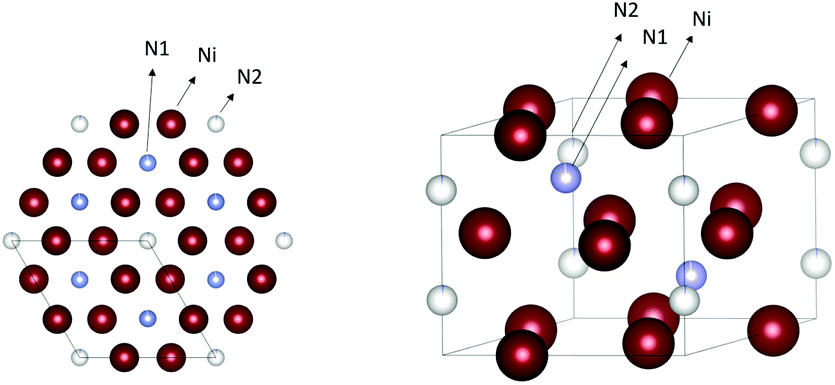 | ||
| Fig. 9 Crystal structure of Ni3N. The nickel atoms are represented in dark red and the nitrogen atoms in cyan and white. Structures plotted using VESTA.48 Cif file obtained from ref. 89. | ||
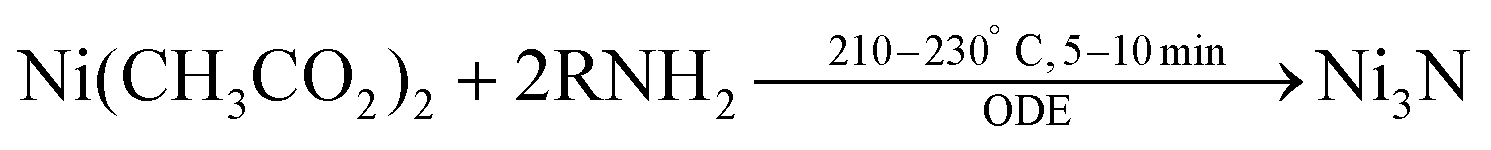
Recently a one-step synthesis of colloidally stable Ni3N NCs has been reported by Shanker et al.97 Nickel acetate is used as precursor and OLAm is chosen as ligand. Different nanocrystal sizes are obtained (5 to 80 nm) by varying the time and temperature in a narrow window, see Fig. 10. The NCs are reasonably monodisperse and colloidally stable. The authors detect ammonia during the reaction and thus infer that ammonia is the nitrogen source. However, it is unclear how ammonia is being generated since the most logical reaction would be the formation of oleylacetamide and NiO. Furthermore, the synthesis requires a specific reagent purity and supplier.
 | (7) |
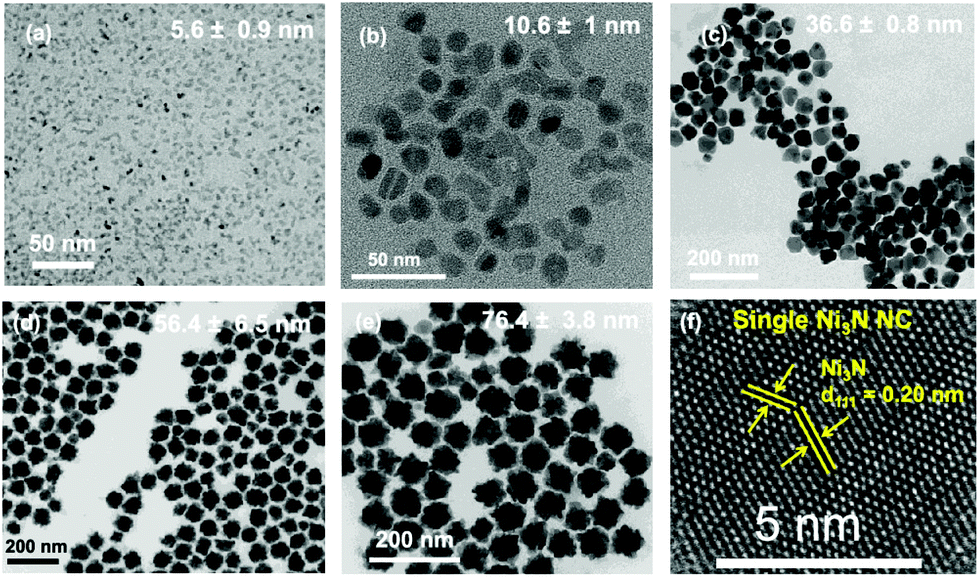 | ||
| Fig. 10 TEM images of the different Ni3N NCs obtained. (a) 5.6 ± 0.9 nm, (b) 10.6 ± 1.0 nm, (c) 36.6 ± 0.8 nm, (d) 56.4 ± 6.5 nm, and (e) 76.4 ± 3.8 nm. (f) High resolution transmission electron microscopy (HRTEM) imageof a Ni3N nanocrystal with a size of 56.4 ± 6.5 nm. Reprinted with permission from ref. 97. Copyright 2021 American Chemical Society. | ||
5. Copper nitride
Copper nitride, Cu3N, has an anti-ReO3 crystal structure with a Pm3m space group, and a lattice constant of 3.817 Å, see Fig. 11.98,99 Copper nitride is a semiconductor with a reported band-gap of 1.7 eV which could be potentially interesting for solar cells.100 Thin films of copper nitride have been used in optical storage devices,101 and resistive random access memory chips.102 Cu3N NCs were applied as catalyst in the reduction of CO2 to ethylene,103 alkaline water electrolysis,104 and the oxygen reduction reaction (ORR).105 Cu3N can be doped with other metals such as Pd to form Cu3PdxN with 0.02 < x < 1 which shows metallic behaviour.106–108 The crystal structure of the latter is similar to the Cu3N structure, with a palladium atom in the center of the unit cell (with a larger lattice constant of 3.854 Å), see Fig. 11. Cu3N forms at relatively low temperature but decomposes at higher temperature to metallic copper. Under inert atmosphere, copper nitride films decompose at 475 °C,101 and particles decompose at 300 °C.109 When heated in air, Cu3N decomposes to CuO.109 We calculated an exciton Bohr radius of 3.12 nm for copper nitride based on the effective masses of electrons and holes, as reported by Birkett et al.110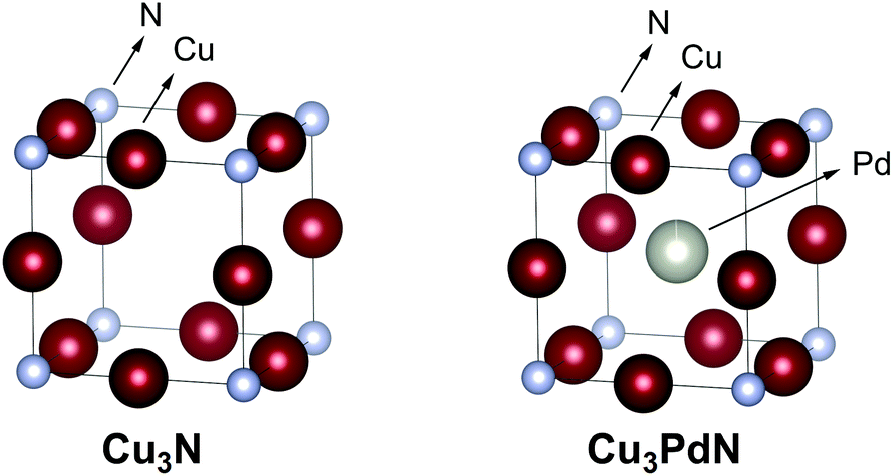 | ||
| Fig. 11 Crystal structure of Cu3N and the doped Cu3PdN. The copper is represented in dark red, the palladium in grey and the nitrogen atom in cyan. Structures plotted using VESTA.48 Cif file obtained from ref. 111 and 112. | ||
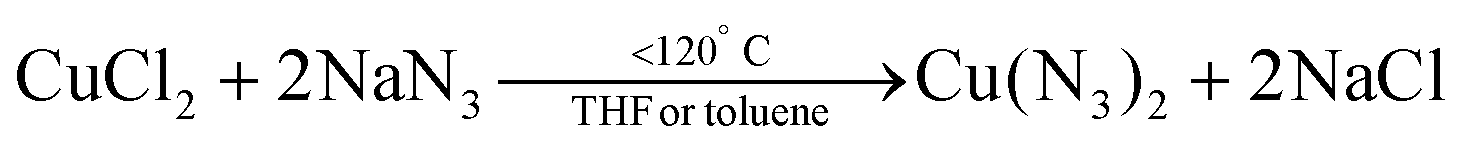
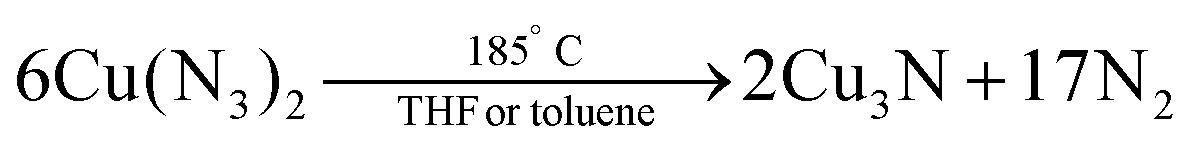
In 1939, Juza et al. synthesized Cu3N powders by reacting CuF2 with ammonia gas (aminolyis reaction).113 Phase pure copper nitride was obtained at reaction temperatures between 250 °C and 325 °C (6 hours reaction time).114 At higher temperatures, Cu(0) is formed. Alternatively, Zachweija and Jacobs synthesized Cu3N by thermal decomposition of [Cu(NH3)x](NO3).111 In 2005, Choi et al. combined copper(II) chloride and sodium azide in superheated toluene or THF.109 The intermediate copper azide decomposes to Cu3N powder at 185 °C.
 | (8) |
 | (9) |
The reaction temperature is remarkably lower than previously reported for the similar synthesis of other metal nitrides such as TiN and GaN. Unfortunately, the reaction time is very long (about three days) and metal azides are thermally unstable and shock sensitive, which limits the reaction to small scales. Finally, the obtained Cu3N is not phase-pure and some NaCl impurities remain present in the sample.
5.1. Cu3N nanocrystal synthesis from copper nitrate and primary amine
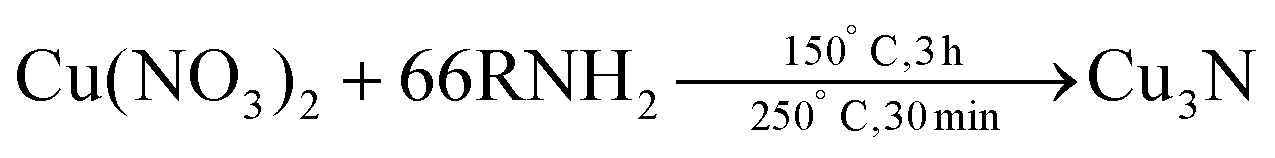
In 2011, Wang et al. obtained colloidally stable Cu3N NCs by reacting Cu(NO3)2·3H2O in octadecylamine (ODA) at 220–280 °C.115 Octadecylamine acts here both as solvent and as ligand.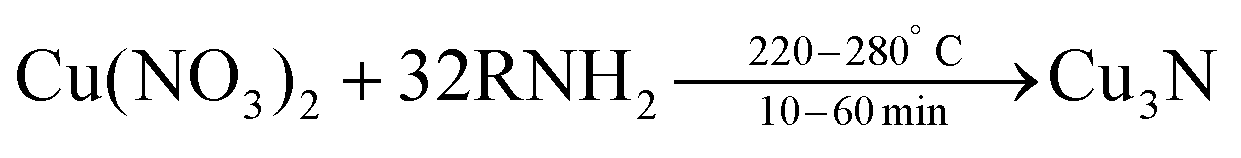 | (10) |
The authors hypothesize that NO2 and O2 are formed as side products but did not provide experimental evidence. This hypothesis was based on the solid state decomposition reaction of Cu(NO3)2·3H2O into CuO, NO2 and O2 at around 180 °C.116 The size of the NCs is tuned by using different reaction temperatures (220–280 °C) and reaction times (5–20 min). The conditions and their outcomes are also summarized in Table 2. Pure Cu3N NCs are only obtained with 32 equivalents of ODA. Cu2O is obtained with 8 equivalents, while 80 equivalents lead to Cu(0) NCs. Forty and thirteen equivalents lead to a mixture of Cu/Cu3N or Cu3N/Cu2O mixture respectively. Please note that the copper concentration also changes in these experiments since ODA is the solvent. Wang et al. argue that nitrate (NO3−) is the nitrogen source for the nitride (N3−), even though this would involve the transfer of eight electrons to N(V) in nitrate. They based their argument on the observation that copper nitrate is the only precursor that delivers copper nitride. Copper chloride does not yield any products while copper acetate yields a Cu(0)/Cu2O mixture and copper sulfate delivers copper sulfide NCs. However, no other hypotheses were tested or disproved, thereby leaving the option open that the nitride is provided by ODA, as is the case for certain syntheses of InN NCs (see below).
| Precursora | [Cu] (mM) | Solventb/ligandc | Ligand/Cu ratio | Temperature (°C) | Time (min) | Morphology | Phase | Size (nm) | Ref. |
|---|---|---|---|---|---|---|---|---|---|
| a HMT = hexamethylenetetraamine, PPC = pyrrole-2-carbaldpropyliminato Cu(II). b ODE = 1-ODE. c ODA = octadecylamine, OLAm = oleylamine, HDA = hexadecylamine. | |||||||||
| Cu(NO3)2·3H2O | 101 | ODA | 32 | 240 | 10 | Cubic | Cu3N | 15 | 115 |
| Cu(NO3)2·3H2O | 101 | ODA | 32 | 280 | 5 | Spherical | Cu3N | 10 | 115 |
| Cu(NO3)2·3H2O | 101 | ODA | 32 | 260 + 240 | 5 + 5 | Spherical | Cu3N | 15 | 115 |
| Cu(NO3)2·3H2O | 101 | ODA | 32 | 220 + 240 | 5 + 5 | Spherical | Cu3N | 15 | 115 |
| Cu(NO3)2·3H2O | 101 | ODA | 32 | 220 | 20 | Irregular | Cu3N | 50 | 115 |
| Cu(NO3)2·3H2O | ODA | 40 | 240 | 10 | Cu + Cu3N | 115 | |||
| Cu(NO3)2·3H2O | ODA | 13 | 240 | 10 | CuO + Cu3N | 115 | |||
| Cu(NO3)2·3H2O | 24 | ODE/ODA | 67 | 250 | 30 | Cubic | Cu3N | 26 | 117 |
| Cu(NO3)2·3H2O | 24 | ODE/HDA | 69 | 250 | 30 | Cubic | Cu3N | 19 | 117 |
| Cu(NO3)2·3H2O | 24 | ODE/OLAm | 63 | 250 | 30 | Cubic | Cu3N | 11 | 117 |
| Cu(NO3)2·3H2O | 24 | OLAm | 250 | 30 | Irregular | Cu3N | 117 | ||
| Cu(NO3)2·3H2O | 25 | ODE/OLAm | 31 | 240 | 15 | Cubic | Cu3N | 118 | |
| Cu(NO3)2·3H2O + Pd(acac)2 | 25 | ODE/OLAm | 31 | 240 | 15 | Cubic | Cu3PdN | 16 | 118 |
| Cu(NO3)2·3H2O + Pd(acac)2 | 25 | ODE/OLAm | 31 | 190 | 30 | Cubic | Cu3PdN | 119 | |
| Cu(NO3)2·3H2O | 25 | ODE/OLAm | 31 | 210 | 30 | Cubic | Cu3N | 119 | |
| Cu(NO3)2·3H2O | 75 | ODA/OLAm | 45 | 240 | 20 | Cubic | Cu3N | 25 | 105 |
| Cu(NO3)2·3H2O | 88 | ODA/OLAm | 41 | 240 | 30 | Cubic | Cu3N | 25 | 103 |
| Cu(NO3)2·3H2O | 88 | ODA/OLAm | 41 | 250 | 30 | Cubic | Cu3N | 20 | 103 |
| Cu(NO3)2·3H2O | 88 | ODA/OLAm | 41 | 260 | 30 | Cubic | Cu3N | 10 | 103 |
| Cu(NO3)2·3H2O | 88 | ODA/OLAm | 41 | 230 | 30 | Spherical | Cu3N | 20 | 103 |
| Cu(NO3)2·5H2O + HMT | 50 | Hexanol | — | 200 | 60 | Spherical | Cu3N | 80 | 122 |
| Cu(acetate)2·H2O + NH3 | 10 | Nonanol | — | 190 | 60 | Spherical | Cu3N | 200 | 123 |
| PPC | 50 | ODA | 74 | 260 | 5 | Spherical | Cu3N | 3 | 124 |
| Cu(NO3)2·3H2O | 50 | ODA | 74 | 260 | 5 | Cubic | Cu3N | 19 | 124 |
| Cu(OMe)2 | 92 | BnNH2 | 117 | 140 | 15 | Spherical | Cu3N | 2 | 125 |
| CuI + KNH2 + NH3 | 21 | Pyridine | — | −35 + 130 | 10 + 30 | Spherical | Cu3N | 4 | 126 |
Also in 2011, Wu and co-workers described the formation of Cu3N from Cu(NO3)2·3H2O in the presence of both a primary amine (surfactant) and octadecene (ODE) (solvent), see eqn (11).117 By changing the primary amine (ODA, hexadecylamine or OLAm), the size of the final Cu3N varies from 26 ± 5.6 nm to 18 ± 2.3 nm and 10 ± 2.7 nm respectively (Fig. 12). All NCs have a cubic morphology and are phase-pure copper nitride.
 | (11) |
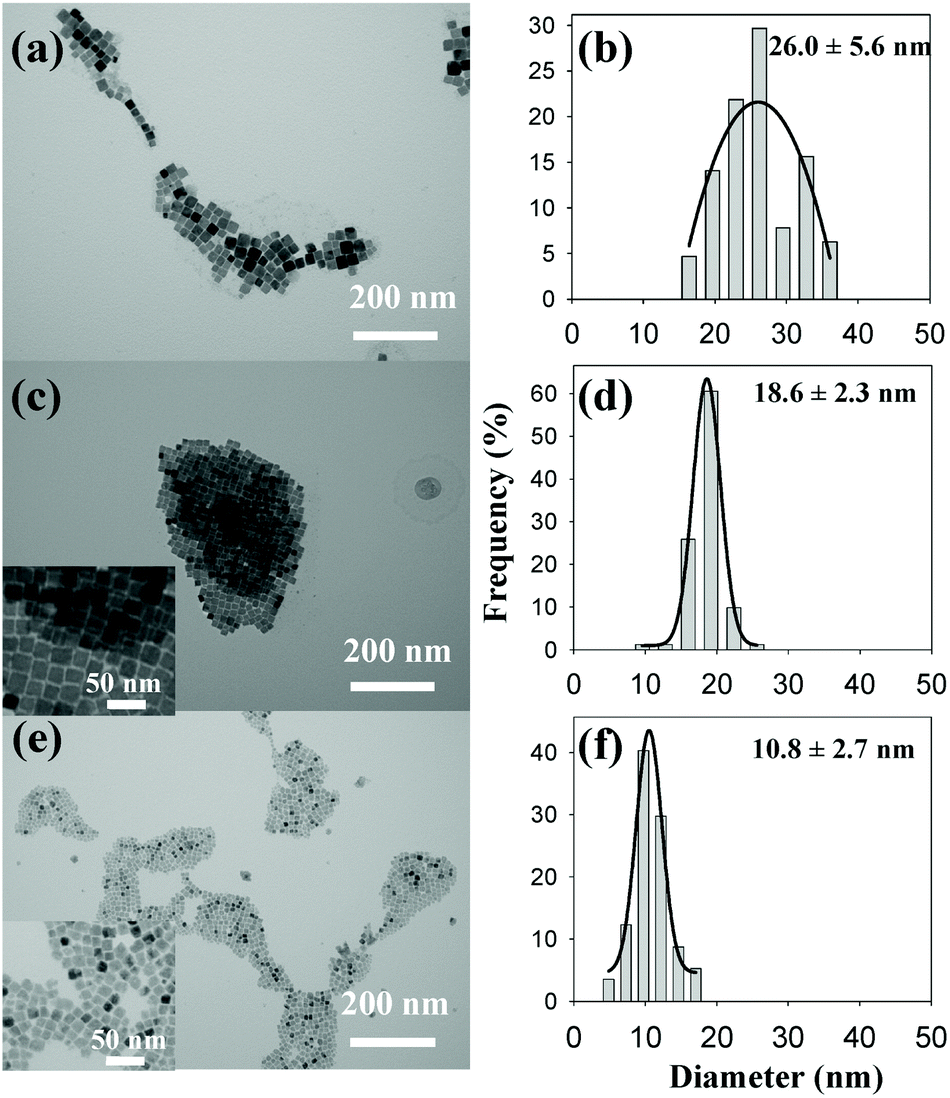 | ||
| Fig. 12 TEM images and the corresponding size histograms of Cu3N NCs synthesized from copper nitrate and various primary amines in ODE solvent, according to ref. 117. (a, b) Octadecylamine (c, d) hexadecylamine, and (e, f) oleylamine. Reprinted with permission from ref. 117. Copyright 2011 American Chemical Society. Note that the authors labelled the axis diameter. Given the cubic morphology of the nanocrystals, this is confusing and the cube edge length is a more appropriate measure for the size. | ||
In a first stage, the reaction is heated to 150 °C with a concomitant color change from dark blue to green and then yellow, indicating the reduction of Cu(II) to Cu(I).115 Subsequently, the solution is heated to 250 °C for 30 min and the solution turns brown, consistent with the formation of copper nitride. According to Wu et al. ODE is necessary as solvent to obtain well-defined nanocubes since irregular and polydisperse Cu3N NCs have been obtained using only OLAm. Most likely, other solvents would be more suitable since ODE polymerizes during nanocrystal synthesis.27 Nonetheless, this method was adopted by other groups and Vaughn II et al. used it to produce Cu3N and Cu3PdN, albeit with half the number of amine equivalents, see also Table 2.118 The reaction mixture is degassed for 10 min at 120 °C and then heated to 240 °C under argon for 15 min. To produce Cu3PdxN, Pd(acac)2 is also added at the start. The average diameter of the quasicubic Cu3PdN NCs is 16 ± 2 nm. Cu3N and Cu3PdN can also be grown on Pt and Au nanoparticle seeds to form nanoscale heterostructures at 190 °C see Fig. 13.119
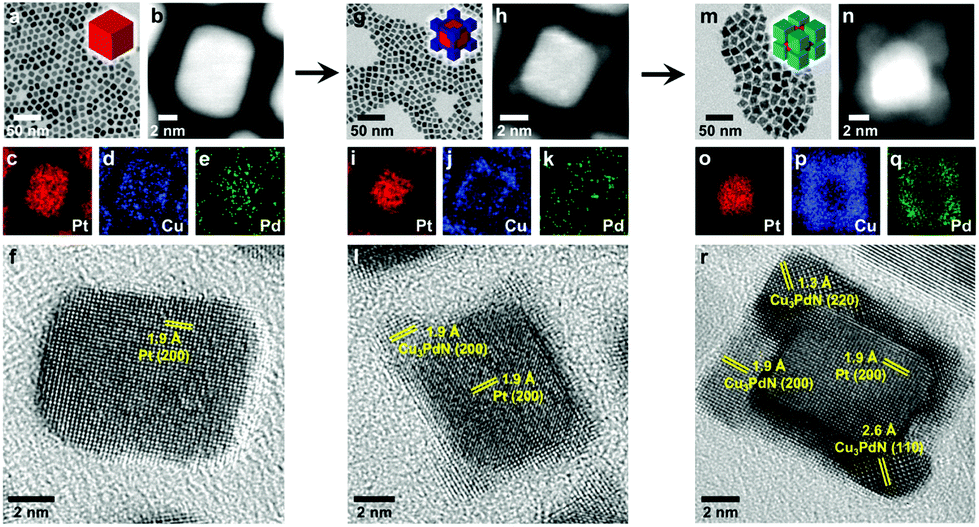 | ||
| Fig. 13 Time-dependent growth studies of Cu3PdN on Pt nanocubes at 170 °C for (a–f) 5 min, (g–l) 10 min, and (m–r) 15 min. The data for each time point include (a, g, and m) TEM images, (b, h, and n) HAADF-STEM images, (c–e, i–k, and o–q) energy dispersive X-ray spectroscopy (STEM-EDS) element maps for Pt (red), Cu (blue), and Pd (green), and (f, l, and r) HRTEM images of individual particles. Reprinted with permission from ref. 119, Copyright 2019 American Chemical Society. | ||
In 2019, Braman et al. synthesized Au decorated Cu3N NCs. First, Cu3N NCs (10 ± 5 nm) were obtained via a similar approach to the one of Vaughn et al. but with a higher amine equivalent and a lower heating temperature (210 °C). Subsequently, Au NPs were grown on top of the Cu3N cubes. The resulting heterostructure demonstrated a better catalytic activity than pure Cu3N.120
In 2014, Xi et al. performed the reaction in a mixture of ODA and OLAm.105 First the mixture is heated to 110 °C and than quickly heated to 240 °C for 10 min. They obtained uniform nanocubes of Cu3N of around 20 nm. The growth mechanism was investigated by analyzing reaction aliquots at 2, 5 and 10 min. From TEM measurements (Fig. 14), Xi et al. conclude that first small NPs are formed, which subsequently ripen into bigger nanocubes. This growth mechanism was later confirmed under slightly different conditions.121 In addition, long reaction times (at 260 °C) lead to the decomposition of the formed Cu3N to Cu(0) particles. Xi et al. also studied the magnetic properties of the Cu3N NCs and observed paramagnetic and ferromagnetic contributions. Such properties are not expected for d0 materials and are assumed to originate from surface defects.105
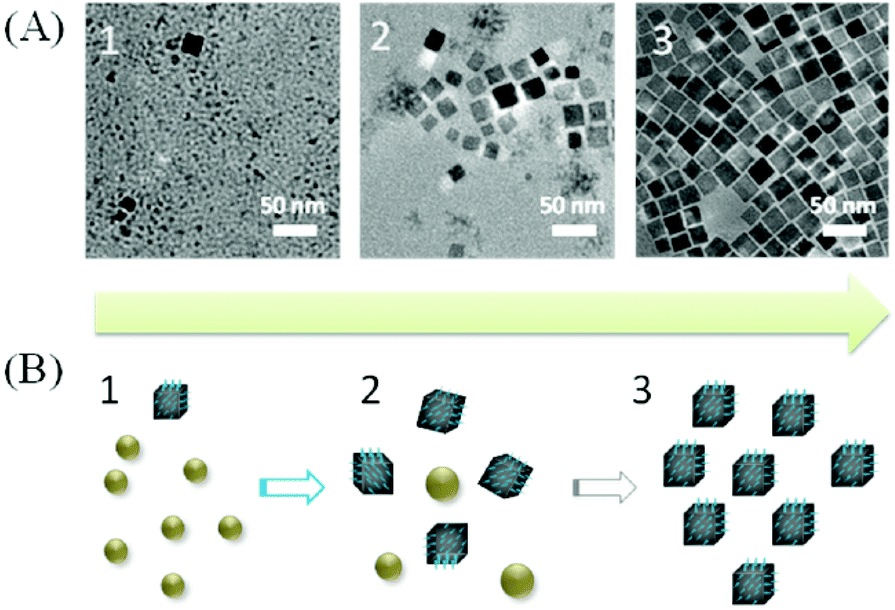 | ||
| Fig. 14 (A) TEM of the Cu3N NCs synthesized according to ref. 105, after 2, 5 and 10 min. (B) The proposed growth procedure of Cu3N nanocubes. Reproduced from ref. 105 with permission from the Royal Society of Chemistry. | ||
In 2019, Yin et al. used the same strategy of Xi et al. By tuning the heating temperature, the size and morphology of the final Cu3N is changed, see Table 2.103 Above 240 °C cubic NCs are formed while below 240 °C spherical NCs are formed. The size of the final Cu3N decreases from 25 nm to 10 nm by increasing the reaction temperature from 240 °C to 260 °C. The Cu3N NCs are stable even after 2 weeks of air exposure and no degradation is observed in the crystal structure and morphology.
5.2. Cu3N nanocrystal synthesis from Cu(OMe)2 and benzylamine
Deshmukh et al. reacted Cu(OMe)2 in benzylamine (BnNH2) and obtained very small, spherical Cu3N NCs (2.2 ± 0.5 nm).125,127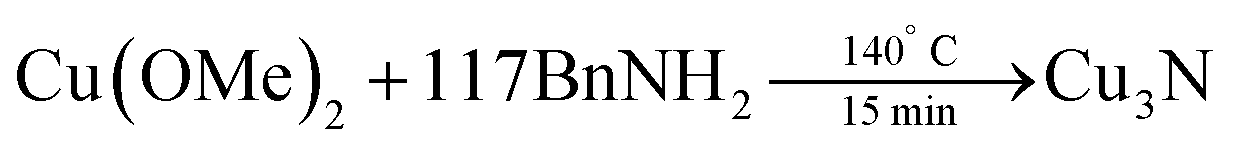 | (12) |
The standard synthesis is performed at 140 °C under inert atmosphere, in a pressure tube. Over the course of the reaction, the color changes from dark blue to red. The average crystal size (determined from XRD) is quite insensitive to the reaction conditions (80 °C–180 °C, 5–60 min) and varies from 1.8 to 2.8 nm. The authors further suggested a precursor conversion mechanism by analyzing the reaction by-products with gas chromatography–mass spectrometry (GC-MS), see Fig. 15. In the first step, copper(II) methoxide oxidizes BnNH2 to benzenemethanimine and is reduced to Cu(I). This proposal is based on the detection of methanol in GC-MS. This reactivity is special for Cu(OMe)2 since other Cu(II) salts such as Cu(II) chloride make stable complexes with amines and fail to produce Cu3N. The benzenemethanimine intermediate reacts with benzylamine, yielding N-benzylidenebenzylamine (detected by GC-MS) and ammonia. The in situ formed ammonia reacts with Cu(OMe) to form Cu3N. Traces of benzonitrile are also observed at the GC, which is justified by further oxidation of benzenemethanimine in presence of Cu(II). This synthetic strategy was adopted by Liu and co-workers, but also requires a specific reagent purity and supplier.128
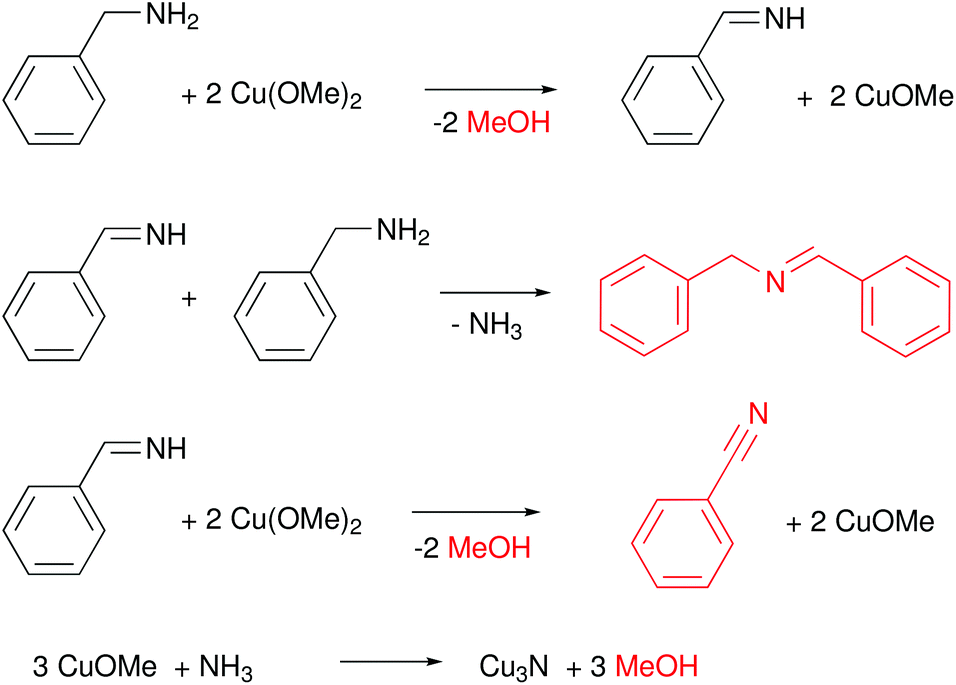 | ||
| Fig. 15 Proposed reaction mechanism of Cu(OMe)2 with BnNH2 that leads to the formation of Cu3N.125 Molecules in red are the one detected by GC-MS. | ||
5.3. Cu3N nanocrystal synthesis via sol–gel chemistry
In aqueous sol–gel chemistry, dissolved metal precursors are hydrolyzed with water and further condense in metal oxide particles and gels.129 Similarly, researchers have synthesized copper nitride NCs by aminolysis (reaction with ammonia) and condensation. In 2018, Egeberg et al. reacted CuI with ammonia under basic conditions to form Cu(NH)2.126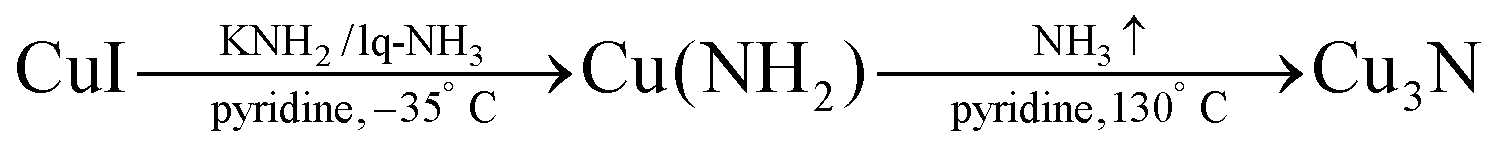 | (13) |
By condensation of the copper amide under reflux conditions, small copper nitride NCs are obtained (4.2 ± 0.7 nm), see Fig. 16. Only pyridine is observed at the surface of the NCs according to FT-IR and elemental analysis, which could explain why these NCs are air and moisture sensitive.
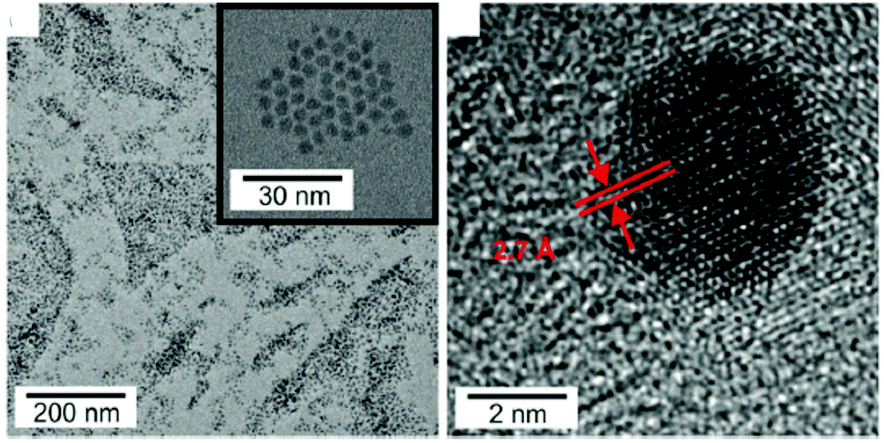 | ||
| Fig. 16 TEM images of Cu3N NCs synthesized by sol–gel chemistry according to ref. 126. Reproduced from ref. 126 with permission from the Royal Society of Chemistry. | ||
Alternatively, Nakamura et al. have formed Cu3N from copper(II) acetate in nonanol by bubbling ammonia through the mixture at 190 °C for 1 h.123 The final NCs are not colloidally stable and form aggregates of about 200 nm with crystallite sizes of 20–30 nm. The same colour changes are observed; from blue to yellow to dark brown. Single phase CuO is formed by using shorter chain alcohols such as pentanol, hexanol and heptanol at 130 °C. With increasing temperature, an increasing amount of copper nitride is obtained and from 170 °C pure copper nitride is formed. The authors propose the following mechanism. First, ammonia forms a complex with Cu(II), evidenced by a color change from green to blue. Second, the authors hypothesize Cu(II) is reduced by nonanol. The color change to yellow is consistent with a Cu(I) species but the authors do not detect the direct product, nonyl aldehyde. They do detect 9-ODEamide, of which it is unclear how it is exactly formed. Finally, the Cu(I) species reacts with ammonia to form copper nitride. In the background, there is also the esterification of acetate with nonanol to nonyl acetate. According to the mechanism, a lot of protons are released but the authors did not try to uncover the fate of these protons. Nor were alternative hypotheses considered such as the reduction of Cu(II) by ammonia itself.
5.4. Alternative precursors for Cu3N nanocrystal synthesis
In 2018, Mondal and co-workers obtained Cu3N by reacting hexamethylenetetraamine (HMT) and Cu(NO3)2·5H2O in n-hexanol at 200 °C for one hour under an inert atmosphere.122 HMT undergoes hydrolysis and forms formaldehyde and NH3. The latter is the source of nitrogen as described in Fig. 17. Copper nitrate is in this case simply the source of water and Cu and not the nitrogen source. Cu(II) is assumed to be reduced by the formaldehyde intermediate, but the authors do not show evidence for the formation of formic acid. The final NCs are around 80 nm in size, which is most likely due to the absence of a strongly coordinating ligand.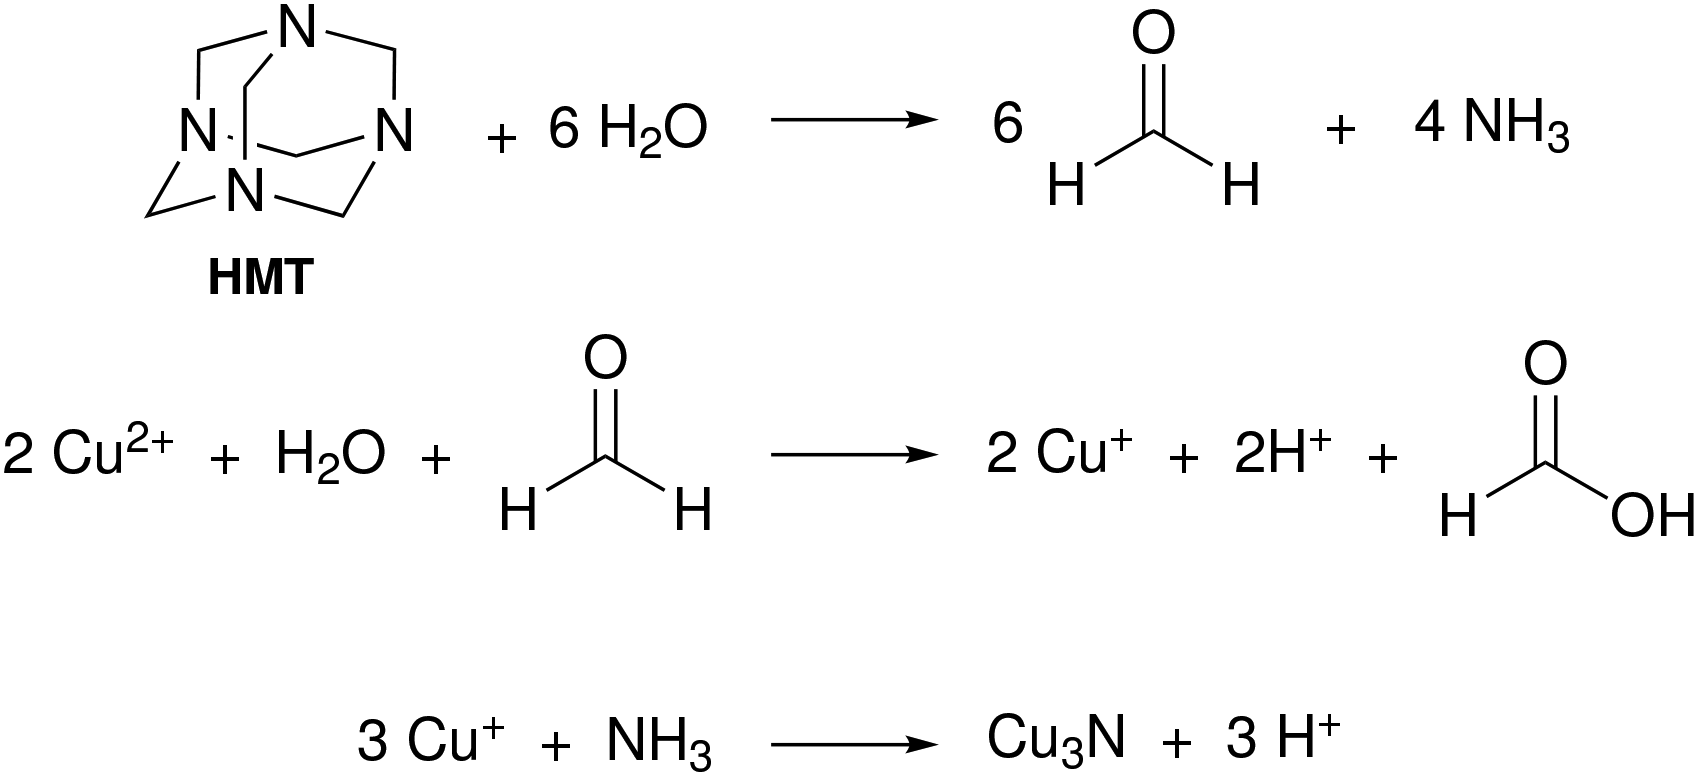 | ||
| Fig. 17 Proposed reaction mechanism for Cu3N formation from hexamethylenetetraamine and Cu(NO3)2·5H2O.122 | ||
Also in 2018, Sithole et al. synthesized a novel copper precursor: pyrrole-2-carbaldpropyliminato Cu(II) (PPC), see Fig. 18.124 PPC is synthesized from pyrrole-2-carboxaldehyde, copper acetate and propylamine in deionized water, filtered and recrystallized. In a second step, PPC is heated with ODA to form Cu3N (Fig. 18). The resulting spherical NCs are about 1.5–4 nm in diameter, in contrast to the 18 nm cubes that are obtained with copper nitrate under identical conditions. The photoluminescence of the smaller Cu3N NCs is slightly blue-shifted to the emission of the larger NCs, which could possibly be ascribed to quantum confinement. Indeed, we estimated from the calculated dielectric constant and the effective hole and electron masses, an exciton Bohr radius of about 3 nm. However, a direct relation between size and optical properties is currently missing.
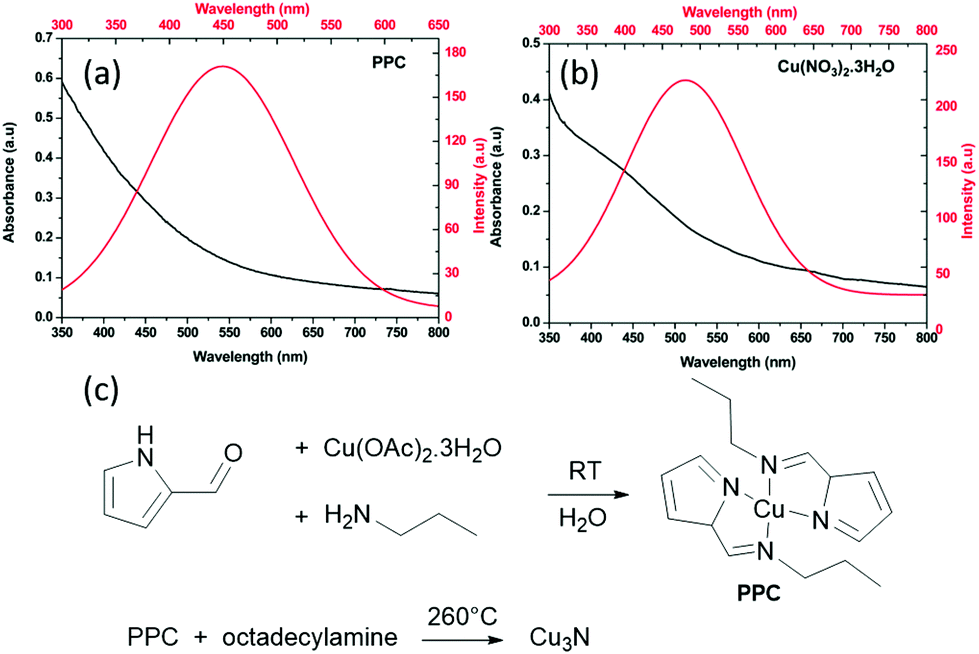 | ||
| Fig. 18 UV-Vis absorption and photoluminescence spectra of Cu3N obtained via (a) PPC and (b) Cu(NO3)2·3H2O method. Reprinted from ref. 124 with permission from the Royal Society of Chemistry. (c) Reaction mechanism proposed for Cu3N formation from the reaction of pyrrole-2-carbaldpropyliminato Cu(II) (PPC) and ODA shown below.124 | ||
6. Zinc nitride
Zn3N2 has a cubic crystal structure (Ia space group) with a lattice constant of 9.7691 Å (Fig. 19).130 It is a nontoxic, earth-abundant, and low-cost semiconductor,131 and is therefore promising for various applications. However, it has been less exploited than other nitrides due to the difficulties in preparation and its high reactivity towards water.132 As a II–V semiconductor, Zn3N2 has a high electron mobility and carrier concentration. The reported band gap for Zn3N2 varies from 1.0 to 3.3 eV depending on the preparation methods.133–135
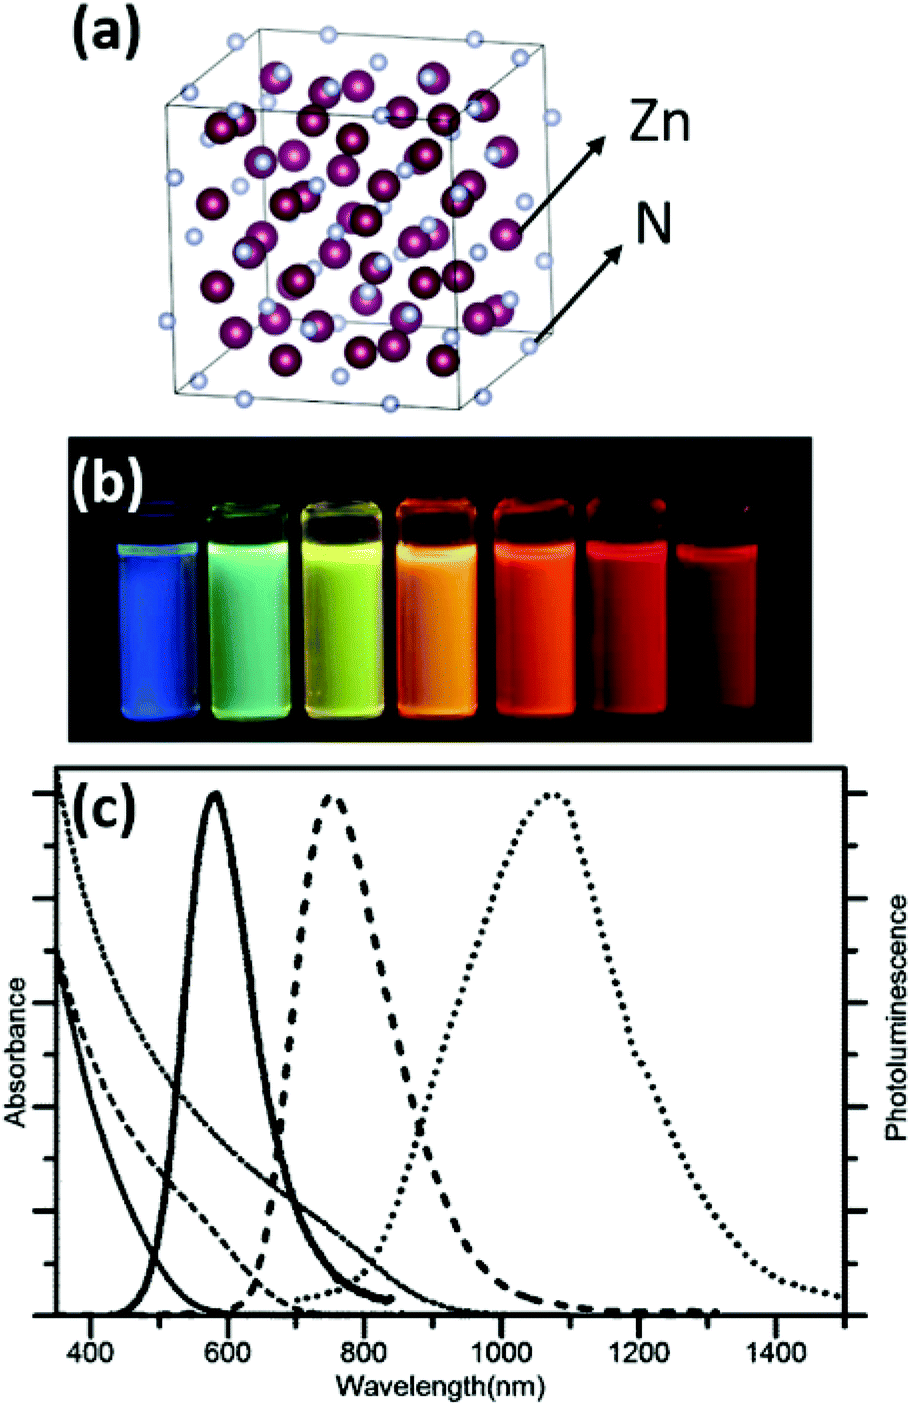 | ||
| Fig. 19 (a) Crystal structure of Zn3N2 metal nitride. The metal is represented in purple and the nitrogen atom in grey. Structures plotted using VESTA.48 Cif file obtained from ref. 130. (b) Toluene solutions of OLAm capped Zn3N2 NCs sampled at different reaction times and excited with a 365 nm lamp. (c) Absorption (thin lines) and emission (thick lines) spectra of Zn3N2 NCs with mean diameters of 2.1 ± 0.4 nm (solid lines), 4.6 ± 2.3 nm (dashed lines) and 7.1 ± 2.0 nm (dotted lines). Reproduced from ref. 136 with permission from the Royal Society of Chemistry. | ||
Various physical methods or nitridation approaches have been employed to synthesize Zn3N2 as thin films,137 powders,138 hollow balls,139 or nanowires.134 One chemical approach was reported by Taylor et al. where diethylzinc was reacted with an ammonia flow in ODE, with OLAm as the capping ligand.
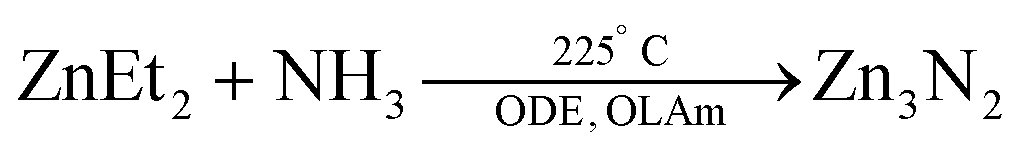 | (14) |
The size is tuned by the stepwise addition of the diethylzinc precursor. Thus, NCs emitting in the range 500–1100 nm were obtained,140 with a photoluminescence quantum yield greater than 50%. The authors further investigated the effect of the ratio between the diethylzinc to ammonia on the growth. A lower ammonia flow rate or higher diethylzinc injection promotes growth and large particles are obtained. Higher ammonia flow rates lead to smaller NCs.136
7. Group 13 nitrides
Among the group 13 nitrides, GaN has acquired most fame due to its use in blue LEDs, a feat that has been awarded with the 2014 nobel prize in Physics.141 The most stable phase of the group 13 nitrides has the wurtzite crystal structure. The bandgap of AlN, GaN and InN is 6.2 eV, 3.4 eV and 0.7 eV respectively. As discussed before AlN is the least interesting nitride of group 13 since it is considered a saline nitride and quickly reacts with water. However, aluminum nitride (AlN) has a high thermal conductivity (up to 320 W m−1 K−1), high acoustic wave velocity, and electrical resistance.142 These properties raise the potential of AlN for applications such as thermal interfaces for electronic laser, brackets for LED technology, resonators, sensors, actuators, etc.143–145 The different synthetic approaches for cubic AlN formation have been presented elsewhere.146GaN and InN nanocrystals are considered the possible next generation of QDs. While the exciton Bohr radius of gallium nitride is 3.2 nm, the exciton Bohr radius of indium nitride is 8 nm. Together with the formation of solid solutions (InxGa1−xN), this provides ample opportunity to tune the optical properties using either quantum confinement or compositional control. GaN is being investigated for high frequency and high power transistor design.147,148 InN is a promising compound for optoelectronic applications due to its low bandgap, small effective mass and efficient electron transport. InN is also considered for low-cost, high-efficiency solar cells, photomasks, laser diodes, sensors, and biological imaging.149–153 InN has a complex plasmonic behavior due to a nonparabolic dispersion of its conduction band.154,155
7.1. Synthesis of group 13 nitride powders
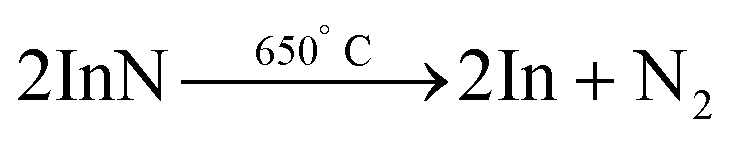
In 2004, InN was prepared by the conversion of In2O3 under ammonia flow in a temperature range of 600 °C to 730 °C. Depending on the temperature, either spherical NCs or hollow microtubes are formed. This is due to the decomposition of InN at a temperature around 650 °C into metallic In and nitrogen156| In2O3 + 2NH3 → 2InN + 3H2O |
GaN NCs in a silica matrix were synthesized by first forming an oxide gel of gallium and silicon. The gel is then annealed at 900 °C for 5 h under NH3 atmosphere.157 Variations on this strategy exist where pure GaN nanocrystalline powders are formed by annealing Ga2O3, GaO(OH), or NH4[Ga(OH)2CO3] under an NH3 atmosphere at 900–950 °C.158–161 Similar to the case of TiN, the solid state reaction between Ga2O3 (or γ-Al2O3) and cyanamide CN2H2 yields GaN (or AlN) NCs.67,162 Finally, the urea glass route was also successful in synthesizing GaN nanopowders.
7.2. Synthesis strategies based on azide or amide precursors
Colloidally stable, but poorly crystalline GaN NCs are obtained by refluxing [Et2Ga(N3)]3, (N3)2Ga[(CH2)3NMe2], or (Et3N)Ga(N3)3 in triglyme at 220 °C for 5 hours.163 Also, GaCl3 and NaN3 react to form gallium azide, which forms amorphous GaN at 220 °C or 260 °C in THF or toluene respectively. Annealing and NaCl removal are necessary in order to form crystalline powders.164 Finally, crystalline GaN NCs were formed from NaN3 and metal Ga by heating to 700 °C under nitrogen in a high-pressure apparatus.165Janik et al. formed GaN NCs via pyrolysis at 450–500 °C of a gallium imide [Ga(NH)3/2]n precursor (obtained by reaction of [Ga(NMe2)3]2 and NH3).166 In 1999, this method was improved by crystallizing the [Ga(NH)3/2]n precursor in hot trioctylamine (360 °C for 24 h) under a flow of ammonia.167 During cooldown of the reaction mixture, a solution of hexadecylamine in trioctylamine was added, which improved the colloidal stability of the final GaN NCs. These NCs have a diameter of 3 nm and feature a first exitonic emission at 3.65 eV, higher than the bulk bandgap of GaN.
β-GaN NPs of 3–8 nm in size were obtained via microwave heating of Ga(NH2)3 in ionic liquid at 300 °C for 1 h. The colorless suspension of Ga(NH2)3 was obtained by dissolving GaCl3 in liquid NH3 at −35 °C and adding KNH2. The obtained NCs show a bandgap around 3.9 eV which is 0.6 eV above the β-GaN bulk bandgap. The authors attributed this blue shift to quantum confinement. The fluorescence properties of the as-synthesized NCs are shown in Fig. 20.168
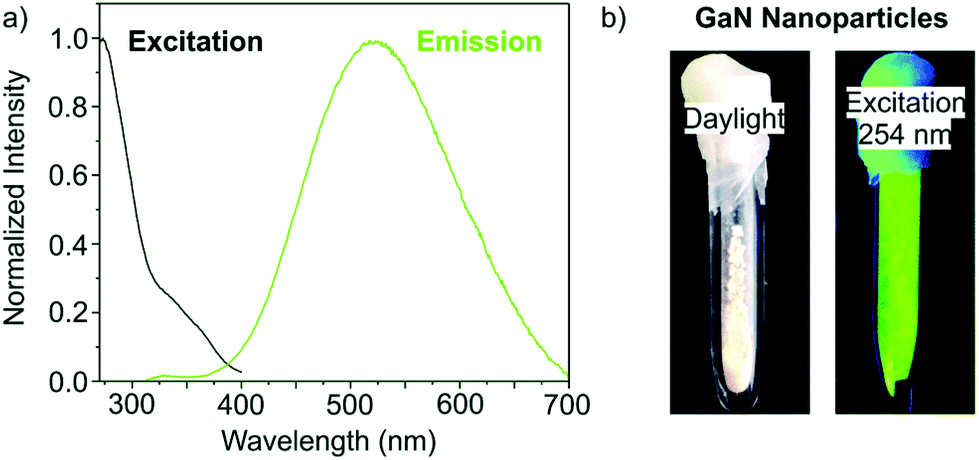 | ||
| Fig. 20 (a) Emission spectrum at 274 nm and excitation spectrum at 523 nm of the synthesized GaN. (b) Photographs of the as synthesized GaN NCs in daylight and under excitation at 254 nm. Reprinted from ref. 168 with permission from the Royal Society of Chemistry. | ||
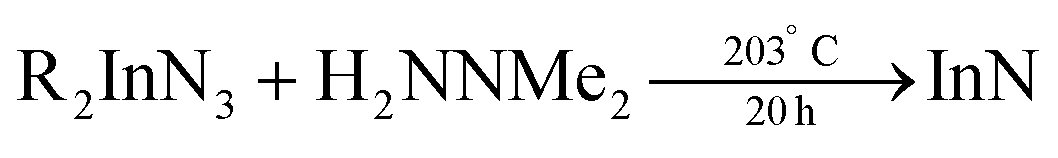
In 2006 Dingman et al. reported the synthesis of InN nanofibres at low temperatures (203 °C), catalyzed by nanometer sized droplets of In metal (also called a solution–liquid–solid (SLS) mechanism).169 The authors prepared two different indium precursors (iPr2InN3 and tBu2InN3) by reacting trialkylindium first with methanol and subsequently with trimethylsilylazide. Crystalline InN was then formed by reacting the as mentioned precursors with 1,1-dimethylhydrazine (H2NNMe2) at 203 °C for 20 h. The role of 1,1-dimethylhydrazine is to reduce part of the indium precursors to In droplets, which then catalyze the InN crystallization.
 | (15) |
 | (16) |
 | (17) |
In 2006 Choi et al. synthesized InN NCs from indium bromide and sodium azide under solvothermal conditions.170 The indium azide intermediate decomposes into InN and N2.
 | (18) |
 | (19) |
The solvent used during the solvothermal treatment determines the final properties of the NCs. While toluene delivered 10 nm aggregated wurtzite InN, hexadecane yielded poorly crystalline InN. The reaction typically takes 3–5 days during which the reaction temperature was increased step by step to avoid explosive azide decomposition. Also InxGa1−xN alloyed particles were synthesized via this strategy.170
The reaction of potassium amide (KNH2) and indium iodide in liquid ammonia yields an insoluble indium amide product. The latter is probably highly condensed, featuring imido bridges. Decomposition of this insoluble product at 400 °C under nitrogen atmosphere delivers InN, In, KNH2, and NH3.171 Alternatively, InI3 and NaNH2 were reacted in anhydrous benzene in a Teflon-lined pressure bomb.172 The crystallite size of the resulting InN NCs varies from 9.9 ± 5 nm to 35.1 ± 10 nm by increasing the reaction time or temperature. At ambient pressure, InN NCs (6.2 ± 2 nm diameter) have been synthesized using InBr3 and NaNH2 in hexadecane under an ammonia atmosphere.
 | (20) |
A post-synthetic acid treatment (to remove In(0)) and functionalization with OLAm yielded colloidally stable particles, see Fig. 21.173 This method has been further studied by Palomaki et al. where they use In2S3 instead of InBr3 and ODE as their solvent.174
 | (21) |
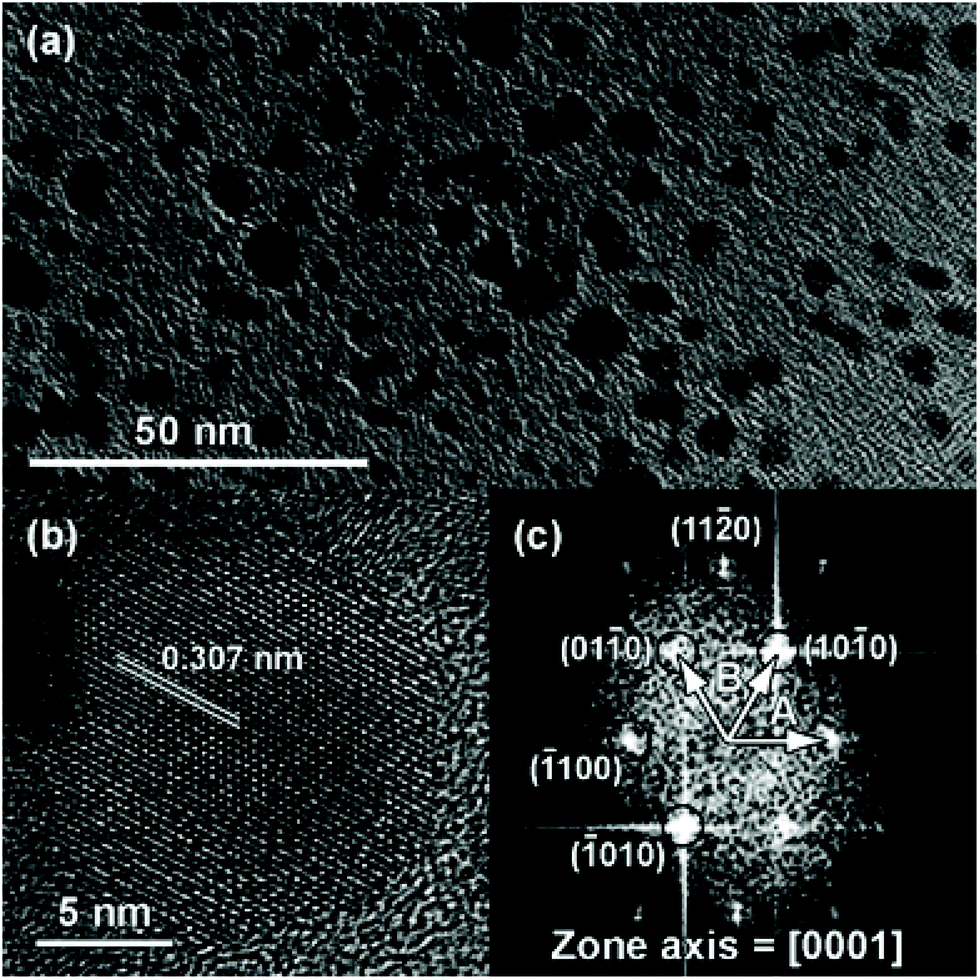 | ||
| Fig. 21 TEM images of the colloidally stable InN obtained by Hsieh et al. after acid treatment. (a) Low magnification image, (b) high resolution image and (c) diffraction pattern obtained via fast Fourier transform (FFT). Reprinted with permission from ref. 173 with permission from the Royal Society of Chemistry. | ||
To improve the size dispersion, size-selective precipitation was performed by the dropwise addition of acetonitrile to OLAm-capped InN NCs, and centrifugation. The final nanocrystal size was tuned from 4.5 to 9.9 nm by varying the reaction time from 15 min to 12 h at 220 °C. The NCs size also increases from 4.1 to 8.0 nm by increasing the reaction temperature from 175 °C to 200 °C (at a fixed reaction time of three hours). Below 175 °C no InN was formed.
When InCl3·4H2O, NaNH2, and sulfur were reacted in a pressure bomb at 160 °C for 30 h, wurtzite InN crystals (50–200 nm) were obtained.175 According to XRD, the reaction proceeds through a In2S3 intermediate. Even larger particles (500 nm) were obtained using In(NO3)3·5H2O as precursor.
7.3. Colloidal InN NCs from lithium oleylamide
Karan and coworked reported a surfactant-assisted procedure where all precursors are soluble.176 InBr3 is first dissolved in a mixture of OLAm and ODE solvent (or hexadecane). At 220 °C the authors inject lithium oleylamide, which was synthesized from OLAm, n-butyllithium (n-BuLi) and tetramethylethylenediamine (TMEDA). After 10 minutes, the reaction is stopped and the product is purified. TEM analyis shows that the obtained particles consist of a 30 nm In(0) core and InN outgrowths (Fig. 22). The mixed composition of In and InN is confirmed by XRD with sharp reflections for In and broader reflections for InN, consistent with their size difference (Fig. 22). Using the same strategy as mentioned before, In is removed by an nitric acid treatment and the InN NCs are stabilized by functionalization with OLAm.176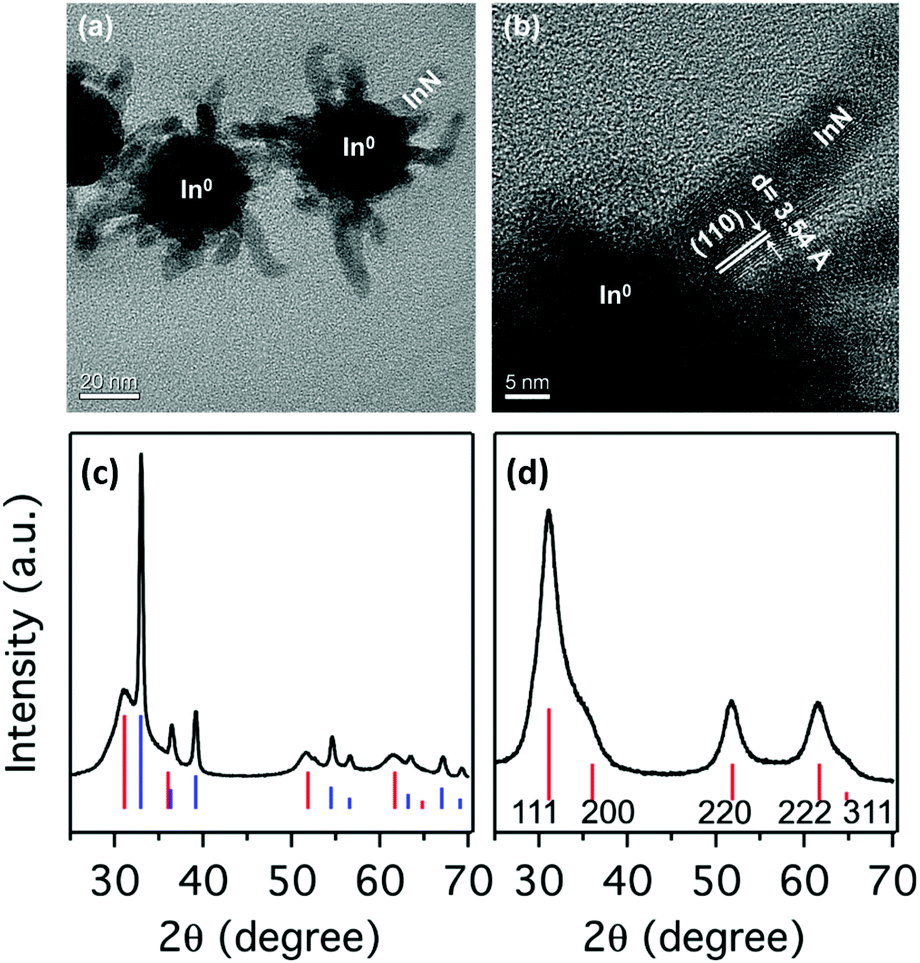 | ||
| Fig. 22 TEM images of the NPs. (a) Overview of the as prepared sample, showing the InN branches stemming out of larger In(0) NPs. (b) HRTEM image of one of the InN branches in (a) at the surface of the In(0) nanoparticle. XRD pattern for the (c) as-prepared sample and (d) acid treated sample. The vertical lines show the XRD patterns of bulk zinc blende-InN (red) and tetragonal In(0) (blue). Reprinted with permission from ref. 176. Copyright 2016 American Chemical Society. | ||
Intrigued by the high dissociation energy of C–N bonds (330 kJ mol−1), Beaulac et al. investigated the mechanism of this reaction by analyzing the by-products via1H NMR, 13C NMR, 2D COSY NMR, and mass spectrometry.177 The authors propose that oleylamide is oxidized to oleylimine, thereby reducing In(III) to In(0), see Fig. 23. A second equivalent of oleylamide performs a nucleophilic attack on the imine, yielding a secondary aldimine and releasing NH2−. The latter goes on to react with In(III) to form InN. The proposed mechanism is based on the observation of secondary aldimine, ammonia, hydrogen, InN and In as reaction products. Oleylimine is too unstable to be isolated. In(0) is always formed in larger yields than InN, meaning that not all reactive NH2− are converted to InN.
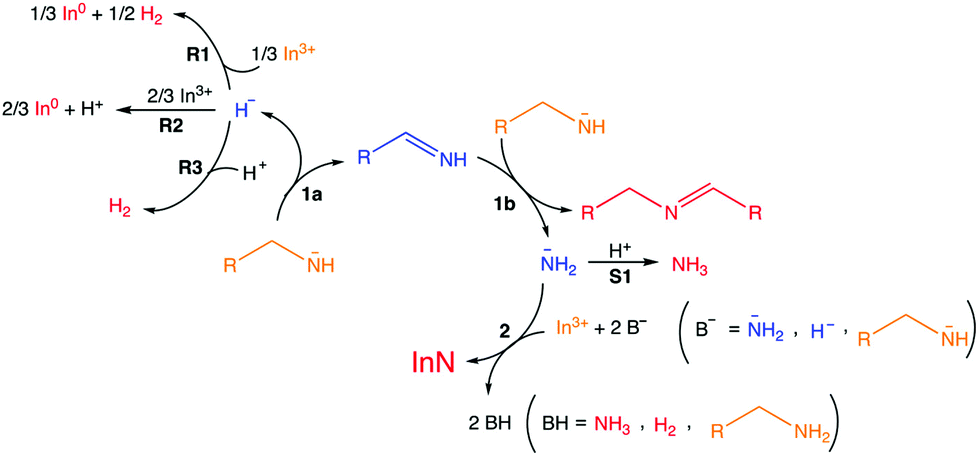 | ||
| Fig. 23 Overall reaction. Reaction 1a, alkylamide precursor oxidation; reaction 1b, formation of the secondary imine leading to NH2− production; reaction 2, nitride formation; R1, R2, R3, three hypothetical reduction processes concomitant with reaction 1a; S1, detrimental hypothetical side reaction. Orange, reactants; blue, intermediates (not isolated); red, identified products. Uncoordinated forms depicted here for simplicity. Reprinted with permission from ref. 177. Copyright 2018 American Chemical Society. | ||
7.4. Other surfactant based strategies for colloidal nitrides
AlCl3, GaCl3, and InCl3 react with urea to form the crystalline complexes: [Al(H2NCONH2)6]Cl3, [Ga(H2NCONH2)6]Cl3, and [In(H2NCONH2)3Cl3].178 In the Al and Ga complexes, six urea molecules are coordinated to the metal and the chloride is simply the counter ion of the positively charged complex. In the In complex, three urea molecules and 3 chlorides build up the first coordination sphere. Pyrolysis of the complexes under nitrogen yields AlN, GaN or a mixture of InN and In2O3. Refluxing [Ga(H2NCONH2)6]Cl3 in trioctylamine (365 °C) for 24 hours yields colloidal GaN NCs (2–3 nm). These particles show photoluminescence (PL) emission bands at 340 and 380 nm. Refluxing the Al and In complex yields AlN and InN (with a minor indium oxide impurity) respectively. Later, the authors showed that the obtained GaN NCs were amorphous and further annealing in ammonia at 450 °C for 24 h was necessary to improve their crystallinity.179In 2019, Chang Choi et al. designed a hot-injection strategy to obtain GaN QDs.180 Gallium chloride and stearic acid were dissolved in ODE and heated to 280 °C under argon. Subsequently, a solution of lithium bis(trimethylsilyl)amide in hexane was rapidly injected.
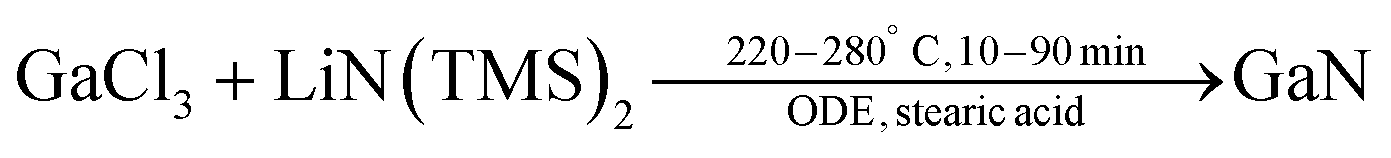 | (22) |
The nanocrystal size was hard to determine from TEM but surely below 5 nm, which is also confirmed by the very broad nature of the XRD reflections. The PL emission of the QDs could be tuned from 315–355 nm, while the bulk PL is at 365 nm. Successful doping with zinc red-shifted the PL to 330–460 nm.180
8. Summary and outlook
We have focused on precursor chemistry that allows synthesizing colloidal metal nitrides varying from plasmonic nitrides (Group 4) to semiconductors (Group 13). Approaches that lead to nanocrystal formation are described based on a systematic comparison between synthetic strategies. To date, the late transition metal and group 13 metal nitrides have been more extensively studied. While the reaction mechanism (precursor conversion) is most studied for the group 13 nitrides, the most uniform nanocrystals are obtained for Cu3N. At the same time, we were forced to conclude that there does not exist any convincing reports of a colloidal synthesis of group 4 and group 5 nitrides. Only nanopowders were succesfully obtained, of which some could be dispersed in water, albeit in aggregated form. It is striking that the ease of nitride formation seems to correlate with the valence of the elements. Whereas Cu+ and Ni+ easily crystallize as nitrides, Ga3+ and In3+ are more difficult to crystallize and the most successful approaches are based on crystallization, catalyzed by liquid nanodroplets of metal. An additional hurdle for the group 4 and 5 nitrides is the required reduction during the synthesis. For example, most common precursors for TiN and TaN are based on Ti(IV) or Ta(V), while the final nitrides contain the metal in the +III oxidation state. To avoid the reduction step, future precursors of group 4 and 5 nitrides could start from the metal in the correct oxidation state. When designing new precursors, it is also useful to keep in mind the lessons from the metal chalcogenide field. The consensus seems to be that for optimal nanocrystal formation (and control over size), the conversion of precursor (P) to monomer (M) needs to be slow, relative to the crystallization (nucleation and growth) of the monomer into the final nanocrystals.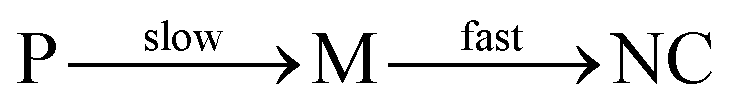 | (23) |
Since group 4 and 5 nitrides typically require high temperatures for crystallization, the logical conclusion is that their crystallization rate is low. Therefore, one should design nitride precursors that decompose even slower, or to apply strategies that enhance the rate of crystallization by lowering the barrier for bond forming and bond breaking. To move the field forward in a rational way, we need to understand the mechanism of the colloidal syntheses that do provide satisfactory results. While the precursor conversion has been studied for InN, there are many systems for which the mechanism is left unexplored. Even more problematic, the crystallization part of the mechanism has not been studied for any of the nitrides discussed here. However, the crystallization is likely the most difficult step in the whole process and thus the most critical to understand to make progress. Finally, it will be equally important that researchers treat colloidal synthesis as a true chemical reaction that has a chemical equation (which needs to be written down) and for which an accurate yield needs to be reported. By putting more rigor into writing the Experimental section, we can enhance the reproducibility of the field. Given the use of early transition metal nitrides for many applications such as catalysis, photothermal therapy, superconductors, and electrochemical capacitors, synthetic efforts should focus on providing these NCs as size-tunable colloidal particles. The field of colloidal metals nitrides is clearly challenging and still young, but adding colloidal nitrides (with synthetic control) to the portfolio of colloidal materials would open up many exciting possibilities for the future of materials science and nanotechnology.
Conflicts of interest
There are no conflicts to declare.Acknowledgements
We acknowledge the University of Basel and the NCCR Molecular Systems Engineering (project number: 182895) for financial support. We thank Ajmal Roshan for help with the Table of Content graphic.References
- S. G. Kwon and T. Hyeon, Acc. Chem. Res., 2008, 41, 1696–1709 CrossRef CAS PubMed.
- Z. Hens and J. De Roo, J. Am. Chem. Soc., 2020, 142, 15627–15637 CrossRef CAS PubMed.
- E. Matijevic, Chem. Mater., 1993, 5, 412–426 CrossRef CAS.
- Z. Hens, Science, 2015, 348, 1211–1212 CrossRef CAS PubMed.
- J. Park, J. Joo, S. Kwon, Y. Jang and T. Hyeon, Angew. Chem., Int. Ed., 2007, 46, 4630–4660 CrossRef CAS PubMed.
- I. Ojea-Jiménez, F. M. Romero, N. G. Bastús and V. Puntes, J. Phys. Chem. C, 2010, 114, 1800–1804 CrossRef.
- R. Garcia-Rodriguez, M. P. Hendricks, B. M. Cossairt, H. T. Liu and J. S. Owen, Chem. Mater., 2013, 25, 1233–1249 CrossRef CAS.
- M. Niederberger and G. Garnweitner, Chem. – Eur. J., 2006, 12, 7282–7302 CrossRef CAS PubMed.
- M. D. Tessier, K. De Nolf, D. Dupont, D. Sinnaeve, J. De Roo and Z. Hens, J. Am. Chem. Soc., 2016, 138, 5923–5929 CrossRef CAS PubMed.
- M. A. Boles, D. Ling, T. Hyeon and D. V. Talapin, Nat. Mater., 2016, 15, 141–153 CrossRef CAS PubMed.
- N. C. Anderson, M. P. Hendricks, J. J. Choi and J. S. Owen, J. Am. Chem. Soc., 2013, 135, 18536–18548 CrossRef CAS PubMed.
- J. De Roo, F. Van den Broeck, K. De Keukeleere, J. C. Martins, I. Van Driessche and Z. Hens, J. Am. Chem. Soc., 2014, 136, 9650–9657 CrossRef CAS PubMed.
- F. W. Eagle, N. Park, M. Cash and B. M. Cossairt, ACS Energy Lett., 2021, 977–984 CrossRef CAS.
- J. De Roo, K. De Keukeleere, Z. Hens and I. Van Driessche, Dalton Trans., 2016, 45, 13277–13283 RSC.
- Y. Yang, H. Qin and X. Peng, Nano Lett., 2016, 16, 2127–2132 CrossRef CAS PubMed.
- T. Kister, D. Monego, P. Mulvaney, A. Widmer-Cooper and T. Kraus, ACS Nano, 2018, 12, 5969–5977 CrossRef CAS PubMed.
- J. D. Martin, Chem. Mater., 2020, 32, 3651–3656 CrossRef CAS.
- R. G. Finke, M. A. Watzky and C. B. Whitehead, Chem. Mater., 2020, 32, 3657–3672 CrossRef CAS.
- V. K. Lamer and R. H. Dinegar, J. Am. Chem. Soc., 1950, 72, 4847–4854 CrossRef CAS.
- S. Özkar and R. G. Finke, J. Am. Chem. Soc., 2017, 139, 5444–5457 CrossRef PubMed.
- S. Mozaffari, W. Li, C. Thompson, S. Ivanov, S. Seifert, B. Lee, L. Kovarik and A. M. Karim, Nanoscale, 2017, 9, 13772–13785 RSC.
- B. M. McMurtry, K. Qian, J. K. Teglasi, A. K. Swarnakar, J. De Roo and J. S. Owen, Chem. Mater., 2020, 32, 4358–4368 CrossRef CAS.
- P. T. Prins, F. Montanarella, K. Dümbgen, Y. Justo, J. C. van der Bok, S. O. M. Hinterding, J. J. Geuchies, J. Maes, K. De Nolf, S. Deelen, H. Meijer, T. Zinn, A. V. Petukhov, F. T. Rabouw, C. De Mello Donega, D. Vanmaekelbergh and Z. Hens, Nano Lett., 2021, 21, 2487–2496 CrossRef CAS PubMed.
- S. Mozaffari, W. Li, M. Dixit, S. Seifert, B. Lee, L. Kovarik, G. Mpourmpakis and A. M. Karim, Nanoscale Adv., 2019, 1, 4052–4066 RSC.
- D. R. Handwerk, P. D. Shipman, C. B. Whitehead, S. Özkar and R. G. Finke, J. Am. Chem. Soc., 2019, 141, 15827–15839 CrossRef CAS PubMed.
- M. P. Hendricks, M. P. Campos, G. T. Cleveland, I. J.-L. Plante and J. S. Owen, Science, 2015, 348, 1226–1230 CrossRef CAS PubMed.
- E. Dhaene, J. Billet, E. Bennett, I. Van Driessche and J. De Roo, Nano Lett., 2019, 19, 7411–7417 CrossRef CAS PubMed.
- K. De Keukeleere, S. Coucke, E. De Canck, P. Van Der Voort, F. Delpech, Y. Coppel, Z. Hens, I. Van Driessche, J. S. Owen and J. De Roo, Chem. Mater., 2017, 29, 10233–10242 CrossRef CAS.
- D. Baranov, M. J. Lynch, A. C. Curtis, A. R. Carollo, C. R. Douglass, A. M. Mateo-Tejada and D. M. Jonas, Chem. Mater., 2019, 31, 1223–1230 CrossRef CAS.
- J. J. Calvin, J. K. Swabeck, A. B. Sedlak, Y. Kim, E. Jang and A. P. Alivisatos, J. Am. Chem. Soc., 2020, 142, 18897–18906 CrossRef CAS PubMed.
- M. R. Friedfeld, J. L. Stein, A. Ritchhart and B. M. Cossairt, Acc. Chem. Res., 2018, 51, 2803–2810 CrossRef CAS PubMed.
- M. E. Mundy, D. Ung, N. L. Lai, E. P. Jahrman, G. T. Seidler and B. M. Cossairt, Chem. Mater., 2018, 30, 5373–5379 CrossRef CAS.
- A. G. Rachkov and A. M. Schimpf, Chem. Mater., 2021, 33, 1394–1406 CrossRef CAS.
- D. R. Sadoway, JOM, 1991, 43, 15–19 CrossRef CAS.
- A. MIURA, J. Ceram. Soc. Jpn., 2017, 125, 552–558 CrossRef CAS.
- K. Fung and G. Mantov, J. Electroanal. Chem. Interfacial Electrochem., 1972, 35, 27–34 CrossRef CAS.
- C. Housecroft, Inorganic Chemistry, Pearson, 2018, vol. 72, pp. 650–651 Search PubMed.
- S. H. Elder, F. J. DiSalvo, L. Topor and A. Navrotsky, Chem. Mater., 1993, 5, 1545–1553 CrossRef CAS.
- Y. Ma, L. Xiong, Y. Lu, W. Zhu, H. Zhao, Y. Yang, L. Mao and L. Yang, Front. Chem., 2021, 9, 390 Search PubMed.
- R. A. Karaballi, G. Humagain, B. R. A. Fleischman and M. Dasog, Angew. Chem., Int. Ed., 2019, 58, 3147–3150 CrossRef CAS PubMed.
- S. Ishii, R. P. Sugavaneshwar and T. Nagao, J. Phys. Chem. C, 2016, 120, 2343–2348 CrossRef CAS.
- E. Traver, R. A. Karaballi, Y. E. Monfared, H. Daurie, G. A. Gagnon and M. Dasog, ACS Appl. Nano Mater., 2020, 3, 2787–2794 CrossRef CAS.
- R. A. Karaballi, Y. E. Monfared and M. Dasog, Chemistry, 2020, 26, 8499–8505 CrossRef CAS PubMed.
- R. A. Karaballi, Y. Esfahani Monfared and M. Dasog, Langmuir, 2020, 36, 5058–5064 CrossRef CAS PubMed.
- U. Guler, S. Suslov, A. V. Kildishev, A. Boltasseva and V. M. Shalaev, Nanophotonics, 2015, 4, 269–276 CAS.
- Y. Yuan, J. Wang, S. Adimi, H. Shen, T. Thomas, R. Ma, J. P. Attfield and M. Yang, Nat. Mater., 2019, 19, 282–286 CrossRef PubMed.
- C. Defilippi, D. V. Shinde, Z. Dang, L. Manna, C. Hardacre, A. J. Greer, C. D’Agostino and C. Giordano, Angew. Chem., Int. Ed., 2019, 58, 15464–15470 CrossRef CAS PubMed.
- K. Momma and F. Izumi, J. Appl. Crystallogr., 2011, 44, 1272–1276 CrossRef CAS.
- A. N. Christensen, V. Romano, R. Hesse, A. F. Andresen and P. Fischer, Acta Chem. Scand., Ser. A, 1975, 29, 563–564 CrossRef.
- F. W. Glaser, D. Moskowitz and B. Post, JOM, 1953, 5, 1119–1120 CrossRef CAS.
- K. Becker and F. Ebert, Z. Phys., 1925, 31, 268–272 CrossRef CAS.
- L. Hiltunen, M. Leskela, M. Makela, L. Niinisto, E. Nykanen and P. Soininen, Thin Solid Films, 1988, 166, 149–154 CrossRef CAS.
- A. Kafizas, C. J. Carmalt and I. P. Parkin, Coord. Chem. Rev., 2013, 257, 2073–2119 CrossRef CAS.
- A. Alvarez Barragan, N. V. Ilawe, L. Zhong, B. M. Wong and L. Mangolini, J. Phys. Chem. C, 2017, 121, 2316–2322 CrossRef CAS.
- K. S. Schramke, Y. X. Qin, J. T. Held, K. A. Mkhoyan and U. R. Kortshagen, ACS Appl. Nano Mater., 2018, 1, 2869–2876 CrossRef CAS.
- S. Exarhos, A. Alvarez-Barragan, E. Aytan, A. A. Balandin and L. Mangolini, ACS Energy Lett., 2018, 3, 2349–2356 CrossRef CAS.
- C. H. Winter, P. H. Sheridan, T. S. Lewkebandara, M. J. Heeg and J. W. Proscia, J. Am. Chem. Soc., 1992, 114, 1095–1097 CrossRef CAS.
- S. C. Dunn, A. S. Batsanov and P. Mountford, J. Chem. Soc., Chem. Commun., 1994, 2007–2008 RSC.
- D. C. Bradley and I. M. Thomas, J. Chem. Soc., 1960, 3857–3861 RSC.
- D. C. Bradley and E. G. Torrible, Can. J. Chem., 1963, 41, 134–138 CrossRef CAS.
- C. Lorber and L. Vendier, Dalton Trans., 2013, 42, 12203–12219 RSC.
- A. W. Jackson and A. L. Hector, J. Mater. Chem., 2007, 17, 1016–1022 RSC.
- C. Lorber, R. Choukroun and L. Vendier, Eur. J. Inorg. Chem., 2006, 4503–4518 CrossRef CAS.
- N. Adams, H. R. Bigmore, T. L. Blundell, C. L. Boyd, S. R. Dubberley, A. J. Sealey, A. R. Cowley, M. E. G. Skinner and P. Mountford, Inorg. Chem., 2005, 44, 2882–2894 CrossRef CAS PubMed.
- A. Egeberg, O. Wenzel, R. Popescu, D. Gerthsen and C. Feldmann, ChemistryOpen, 2020, 10, 334–339 CrossRef PubMed.
- A. Fischer, M. Antonietti and A. Thomas, Adv. Mater., 2007, 19, 264–267 CrossRef CAS.
- J. Buha, I. Djerdj, M. Antonietti and M. Niederberger, Chem. Mater., 2007, 19, 3499–3505 CrossRef CAS.
- Y. Liu, X. Zhang, L. Lu, J. Ye, J. Wang, X. Li, X. Bai and W. Wang, Chin. Chem. Lett., 2021 DOI:10.1016/j.cclet.2021.07.054.
- C. Giordano, C. Erpen, W. T. Yao, B. Milke and M. Antonietti, Chem. Mater., 2009, 21, 5136–5144 CrossRef CAS.
- F. D. Qu, Y. Yuan and M. H. Yang, Chem. Mater., 2017, 29, 969–974 CrossRef CAS.
- G. S. Shanker, R. Bhosale, S. Ogale and A. Nag, Adv. Mater. Interfaces, 2018, 5, 1801488 CrossRef.
- G. S. Shanker, G. B. Markad, M. Jagadeeswararao, U. Bansode and A. Nag, ACS Energy Lett., 2017, 2, 2251–2256 CrossRef CAS.
- D. B. O'Neill, S. K. Frehan, K. Zhu, E. Zoethout, G. Mul, E. C. Garnett, A. Huijser and S. H. C. Askes, Adv. Opt. Mater., 2021, 2100510 CrossRef.
- X. Kan, J. Ding, H. Zhu, C. Deng and C. Yu, Powder Technol., 2017, 315, 81–86 CrossRef CAS.
- S. Hosoya, T. Yamagishi and M. Tokonami, J. Phys. Soc. Jpn., 1968, 24, 363–367 CrossRef CAS.
- J. Gatterer, G. Dufek, P. Ettmayer and R. Kieffer, Monatsh. Chem., 1975, 106, 1137–1147 CrossRef CAS.
- Y. Liu, Q. Wu, L. Liu, P. Manasa, L. Kang and F. Ran, J. Mater. Chem. A, 2020, 8, 8218–8233 RSC.
- H. Cui, G. Zhu, X. Liu, F. Liu, Y. Xie, C. Yang, T. Lin, H. Gu and F. Huang, Adv. Sci., 2015, 2, 1500126 CrossRef PubMed.
- Y. Li, J. Zhang, X. Qian, Y. Zhang, Y. Wang, R. Hu, C. Yao and J. Zhu, Appl. Surf. Sci., 2018, 427, 884–889 CrossRef CAS.
- D. Choi, G. Blomgren and P. Kumta, Adv. Mater., 2006, 18, 1178–1182 CrossRef CAS.
- T. Huang, S. Mao, G. Zhou, Z. Wen, X. Huang, S. Ci and J. Chen, Nanoscale, 2014, 6, 9608 RSC.
- D. Choi and P. N. Kumta, J. Am. Ceram. Soc., 2011, 94, 2371–2378 CrossRef CAS.
- J. H. Swisher and M. H. Read, Metall. Trans., 1972, 3, 489 CAS.
- L. Wang, X. Zhou, N. T. Nguyen, I. Hwang and P. Schmuki, Adv. Mater., 2016, 28, 2432–2438 CrossRef CAS PubMed.
- M. H. Tsai, S. C. Sun, H. T. Chiu, C. E. Tsai and S. H. Chuang, Appl. Phys. Lett., 1995, 67, 1128–1130 CrossRef CAS.
- Y.-J. Lee, D.-Y. Kim, K.-H. Lee, M.-H. Han, K.-S. Kang, K.-K. Bae and J.-H. Lee, Nanoscale Res. Lett., 2013, 8, 128 CrossRef PubMed.
- C.-T. Ho, K.-B. Low, R. F. Klie, K. Maeda, K. Domen, R. J. Meyer and P. T. Snee, J. Phys. Chem. C, 2010, 115, 647–652 CrossRef.
- C. F. Mallinson, B. M. Gray, A. L. Hector, M. A. McLachlan and J. R. Owen, Inorg. Chem., 2013, 52, 9994–9999 CrossRef CAS PubMed.
- A. Leineweber, H. Jacobs and S. Hull, Inorg. Chem., 2001, 40, 5818–5822 CrossRef CAS PubMed.
- F. Gillot, J. Oró-Solé and M. R. Palacín, J. Mater. Chem., 2011, 21, 9997 RSC.
- D. C. Dunand and P. Müllner, Adv. Mater., 2010, 23, 216–232 CrossRef PubMed.
- N. Gajbhiye, R. Ningthoujam and J. Weissmller, Phys. Status Solidi A, 2002, 189, 691–695 CrossRef CAS.
- C. Bartholomew, J. Catal., 1976, 45, 41–53 CrossRef CAS.
- M. Shalom, V. Molinari, D. Esposito, G. Clavel, D. Ressnig, C. Giordano and M. Antonietti, Adv. Mater., 2013, 26, 1272–1276 CrossRef PubMed.
- K. Xu, P. Chen, X. Li, Y. Tong, H. Ding, X. Wu, W. Chu, Z. Peng, C. Wu and Y. Xie, J. Am. Chem. Soc., 2015, 137, 4119–4125 CrossRef CAS PubMed.
- D. Gao, J. Zhang, T. Wang, W. Xiao, K. Tao, D. Xue and J. Ding, J. Mater. Chem. A, 2016, 4, 17363–17369 RSC.
- G. S. Shanker and S. Ogale, ACS Appl. Energy Mater., 2021, 4, 2165–2173 CrossRef CAS.
- M. J. Winiarski, J. Solid State Chem., 2018, 266, 161–165 CrossRef CAS.
- D. Bocharov, A. Anspoks, J. Timoshenko, A. Kalinko, M. Krack and A. Kuzmin, Radiat. Phys. Chem., 2020, 175, 108100 CrossRef CAS.
- A. Zakutayev, C. M. Caskey, A. N. Fioretti, D. S. Ginley, J. Vidal, V. Stevanovic, E. Tea and S. Lany, J. Phys. Chem. Lett., 2014, 5, 1117–1125 CrossRef CAS PubMed.
- T. Maruyama and T. Morishita, Appl. Phys. Lett., 1996, 69, 890–891 CrossRef CAS.
- W. Zhu, X. Zhang, X. Fu, Y. Zhou, S. Luo and X. Wu, Phys. Status Solidi A, 2012, 209, 1996–2001 CrossRef CAS.
- Z. Yin, C. Yu, Z. Zhao, X. Guo, M. Shen, N. Li, M. Muzzio, J. Li, H. Liu, H. Lin, J. Yin, G. Lu, D. Su and S. Sun, Nano Lett., 2019, 19, 8658–8663 CrossRef CAS PubMed.
- C. Panda, P. W. Menezes, M. Zheng, S. Orthmann and M. Driess, ACS Energy Lett., 2019, 4, 747–754 CrossRef CAS.
- P. X. Xi, Z. H. Xu, D. Q. Gao, F. J. Chen, D. S. Xue, C. L. Tao and Z. N. Chen, RSC Adv., 2014, 4, 14206–14209 RSC.
- U. Hahn and W. Weber, Phys. Rev. B: Condens. Matter Mater. Phys., 1996, 53, 12684–12693 CrossRef CAS PubMed.
- F. Gulo, A. Simon, J. Kohler and R. K. Kremer, Angew. Chem., Int. Ed., 2004, 43, 2032–2034 CrossRef CAS PubMed.
- X. Y. Cui, A. Soon, A. E. Phillips, R. K. Zheng, Z. W. Liu, B. Delley, S. P. Ringer and C. Stampfl, J. Magn. Magn. Mater., 2012, 324, 3138–3143 CrossRef CAS.
- J. Choi and E. G. Gillan, Inorg. Chem., 2005, 44, 7385–7393 CrossRef CAS PubMed.
- M. Birkett, C. N. Savory, A. N. Fioretti, P. Thompson, C. A. Muryn, A. D. Weerakkody, I. Z. Mitrovic, S. Hall, R. Treharne, V. R. Dhanak, D. O. Scanlon, A. Zakutayev and T. D. Veal, Phys. Rev. B, 2017, 95, 115201 CrossRef.
- U. Zachwieja and H. Jacobs, J. Less-Common Met., 1990, 161, 175–184 CrossRef CAS.
- H. Jacobs and U. Zachwieja, J. Less-Common Met., 1991, 170, 185–190 CrossRef CAS.
- R. Juza and H. Hahn, Z. Anorg. Allg. Chem., 1939, 241, 172–178 CrossRef CAS.
- G. Paniconi, Z. Stoeva, H. Doberstein, R. I. Smith, B. L. Gallagher and D. H. Gregory, Solid State Sci., 2007, 9, 907–913 CrossRef CAS.
- D. Wang and Y. Li, Chem. Commun., 2011, 47, 3604–3606 RSC.
- D. Flaxbart, J. Am. Chem. Soc., 1999, 121, 2339–2339 CrossRef CAS.
- H. Wu and W. Chen, J. Am. Chem. Soc., 2011, 133, 15236–15239 CrossRef CAS PubMed.
- D. D. Vaughn Ii, J. Araujo, P. Meduri, J. F. Callejas, M. A. Hickner and R. E. Schaak, Chem. Mater., 2014, 26, 6226–6232 CrossRef.
- R. W. Lord, C. F. Holder, J. L. Fenton and R. E. Schaak, Chem. Mater., 2019, 31, 4605–4613 CrossRef CAS.
- D. Barman, S. Paul, S. Ghosh and S. K. De, ACS Appl. Nano Mater., 2019, 2, 5009–5019 CrossRef CAS.
- R. Kadzutu-Sithole, L. F. E. Machogo-Phao, T. Kolokoto, M. Zimuwandeyi, S. S. Gqoba, K. P. Mubiayi, M. J. Moloto, J. V. Wyk and N. Moloto, RSC Adv., 2020, 10, 34231–34246 RSC.
- S. Mondal and C. R. Raj, J. Phys. Chem. C, 2018, 122, 18468–18475 CrossRef CAS.
- T. Nakamura, H. Hayashi, T. A. Hanaoka and T. Ebina, Inorg. Chem., 2014, 53, 710–715 CrossRef CAS PubMed.
- R. K. Sithole, L. F. E. Machogo, M. A. Airo, S. S. Gqoba, M. J. Moloto, P. Shumbula, J. Van Wyk and N. Moloto, New J. Chem., 2018, 42, 3042–3049 RSC.
- R. Deshmukh, G. B. Zeng, E. Tervoort, M. Staniuk, D. Wood and M. Niederberger, Chem. Mater., 2015, 27, 8282–8288 CrossRef CAS.
- A. Egeberg, L. Warmuth, S. Riegsinger, D. Gerthsen and C. Feldmann, Chem. Commun., 2018, 54, 9957–9960 RSC.
- R. Deshmukh, E. Tervoort, J. Kach, F. Rechberger and M. Niederberger, Dalton Trans., 2016, 45, 11616–11619 RSC.
- Y. Liu, D. Lin, P. Y. Yuen, K. Liu, J. Xie, R. H. Dauskardt and Y. Cui, Adv. Mater., 2017, 29, 1605531 CrossRef PubMed.
- J. Livage, C. Sanchez, M. Henry and S. Doeuff, Solid State Ionics, 1989, 32–33, 633–638 CrossRef CAS.
- D. Partin, D. Williams and M. O'Keeffe, J. Solid State Chem., 1997, 132, 56–59 CrossRef CAS.
- N. C. Coronel, Ph.D. thesis, 2016.
- T. Yang, Z. Zhang, Y. Li, M. Lv, S. Song, Z. Wu, J. Yan and S. Han, Appl. Surf. Sci., 2009, 255, 3544–3547 CrossRef CAS.
- K. Kuriyama, Y. Takahashi and F. Sunohara, Phys. Rev. B: Condens. Matter Mater. Phys., 1993, 48, 2781–2782 CrossRef CAS PubMed.
- F. Zong, H. Ma, J. Ma, W. Du, X. Zhang, H. Xiao, F. Ji and C. Xue, Appl. Phys. Lett., 2005, 87, 233104 CrossRef.
- S. Prabha, D. Durgalakshmi, K. Subramani, P. Aruna and S. Ganesan, ACS Appl. Mater. Interfaces, 2020, 12, 19245–19257 CrossRef CAS PubMed.
- P. N. Taylor, M. A. Schreuder, T. M. Smeeton, A. J. D. Grundy, J. A. R. Dimmock, S. E. Hooper, J. Heffernan and M. Kauer, J. Mater. Chem. C, 2014, 2, 4379–4382 RSC.
- A. H. Jayatissa, T. Wen and M. Gautam, J. Phys. D: Appl. Phys., 2012, 45, 045402 CrossRef.
- G. Paniconi, Z. Stoeva, R. I. Smith, P. C. Dippo, B. L. Gallagher and D. H. Gregory, J. Solid State Chem., 2008, 181, 158–165 CrossRef CAS.
- F. Zong, H. Ma, C. Xue, W. Du, X. Zhang, H. Xiao, J. Ma and F. Ji, Mater. Lett., 2006, 60, 905–908 CrossRef CAS.
- R. Ahumada-Lazo, S. M. Fairclough, S. J. O. Hardman, P. N. Taylor, M. Green, S. J. Haigh, R. Saran, R. J. Curry and D. J. Binks, ACS Appl. Nano Mater., 2019, 2, 7214–7219 CrossRef CAS PubMed.
- H. Amano, N. Sawaki, I. Akasaki and Y. Toyoda, Appl. Phys. Lett., 1986, 48, 353–355 CrossRef CAS.
- M. Kaur, K. Singh, P. Singh, A. Kaur, R. Meena, G. P. Singh, H. Barabadi, M. Saravanan and A. Kumar, Nanomed. J., 2020, 7, 194–198 CAS.
- Y. Bian, M. Liu, G. Ke, Y. Chen, J. DiBattista, E. Chan and Y. Yang, Surf. Coat. Technol., 2015, 267, 65–69 CrossRef CAS.
- C. Li, X. Liu, L. Shu and Y. Li, Mater. Express, 2015, 5, 367–370 CrossRef CAS.
- C. Li, X.-Z. Liu, B. Peng, L. Shu and Y.-R. Li, Rare Met., 2016, 35, 408–411 CrossRef CAS.
- V. Kudyakova, R. Shishkin, A. Elagin, M. Baranov and A. Beketov, J. Eur. Ceram. Soc., 2017, 37, 1143–1156 CrossRef CAS.
- G. G. Arizaga, M. J. Oviedo and O. E. Lopez, Colloids Surf., B, 2012, 98, 63–71 CrossRef CAS PubMed.
- P. Antoniammal and D. Arivuoli, J. Nanomater., 2012, 2012, 1–11 CrossRef.
- S. Nakamura and G. Fasol, The Blue Laser Diode, Springer Berlin Heidelberg, 1997, pp. 313–315 Search PubMed.
- E. Starikov, P. Shiktorov, V. Gružinskis, L. Reggiani, L. Varani, J. Vaissière and J. H. Zhao, Phys. B, 2002, 314, 171–175 CrossRef CAS.
- H. Neff, O. Semchinova, A. Lima, A. Filimonov and G. Holzhueter, Sol. Energy Mater. Sol. Cells, 2006, 90, 982–997 CrossRef CAS.
- H. P. T. Nguyen, Y.-L. Chang, I. Shih and Z. Mi, IEEE J. Sel. Top. Quantum Electron., 2011, 17, 1062–1069 CAS.
- J. Wu, J. Appl. Phys., 2009, 106, 011101 CrossRef.
- Z. H. Liu and R. Beaulac, Chem. Mater., 2017, 29, 7507–7514 CrossRef CAS.
- Z. Liu, L. M. Janes, M. Saniepay and R. Beaulac, Chem. Mater., 2018, 30, 5435–5443 CrossRef CAS.
- B. Schwenzer, L. Loeffler, R. Seshadri, S. Keller, F. F. Lange, S. P. DenBaars and U. K. Mishra, J. Mater. Chem., 2004, 14, 637 RSC.
- G. Sinha, S. K. Panda, P. Mishra, D. Ganguli and S. Chaudhuri, J. Phys.: Condens. Matter, 2007, 19, 346209 CrossRef.
- Y. Chen, N. Jyoti and J. Kim, Appl. Phys. A, 2010, 102, 517–519 CrossRef.
- Y. Chen, M. Maniruzzaman and J. Kim, Int. J. Precis. Eng. Manuf., 2011, 12, 573–576 CrossRef.
- H. Xiao, H. Pei, J. Liu, J. Cui, B. Jiang, Q. Hou and W. Hu, Mater. Lett., 2012, 71, 145–147 CrossRef CAS.
- H. Yan, K. Liu, R. Luo, S. Chen and H. Cao, Mater. Lett., 2010, 64, 2109–2111 CrossRef CAS.
- P. G. Li, M. Lei, Y. X. Du, X. Guo and W. H. Tang, Appl. Surf. Sci., 2009, 255, 3843–3847 CrossRef CAS.
- A. Manz, A. Birkner, M. Kolbe and R. A. Fischer, Adv. Mater., 2000, 12, 569–573 CrossRef CAS.
- L. Grocholl, J. J. Wang and E. G. Gillan, Chem. Mater., 2001, 13, 4290–4296 CrossRef CAS.
- F. Kawamura, K. Watanabe, T. Takeda and T. Taniguchi, J. Cryst. Growth, 2011, 321, 100–105 CrossRef CAS.
- J. F. Janik and R. L. Wells, Chem. Mater., 1996, 8, 2708–2711 CrossRef CAS.
- O. I. Micic, S. P. Ahrenkiel, D. Bertram and A. J. Nozik, Appl. Phys. Lett., 1999, 75, 478–480 CrossRef CAS.
- H. F. Gaiser, R. Popescu, D. Gerthsen and C. Feldmann, Chem. Commun., 2020, 56, 2312–2315 RSC.
- S. D. Dingman, N. P. Rath, P. D. Markowitz, P. C. Gibbons and W. E. Buhro, Angew. Chem., Int. Ed., 2000, 39, 1470–1472 CrossRef CAS PubMed.
- J. Choi and E. G. Gillan, J. Mater. Chem., 2006, 16, 3774–3784 RSC.
- A. P. Purdy, Inorg. Chem., 1994, 33, 282–286 CrossRef CAS.
- C. Wu, T. Li, L. Lei, S. Hu, Y. Liu and Y. Xie, New J. Chem., 2005, 29, 1610 RSC.
- J. C. Hsieh, D. S. Yun, E. Hu and A. M. Belcher, J. Mater. Chem., 2010, 20, 1435 RSC.
- P. K. Palomaki, E. M. Miller and N. R. Neale, J. Am. Chem. Soc., 2013, 135, 14142–14150 CrossRef CAS PubMed.
- L. Wang, Q. Shen, D. Zhao, J. Lu, W. Liu, J. Zhang, K. Bao and Q. Zhou, J. Cryst. Growth, 2017, 471, 62–65 CrossRef CAS.
- N. S. Karan, Y. Chen, Z. Liu and R. Beaulac, Chem. Mater., 2016, 28, 5601–5605 CrossRef CAS.
- Y. Chen, N. T. Landes, D. J. Little and R. Beaulac, J. Am. Chem. Soc., 2018, 140, 10421–10424 CrossRef CAS PubMed.
- K. Sardar, M. Dan, B. Schwenzer and C. N. R. Rao, J. Mater. Chem., 2005, 15, 2175–2177 RSC.
- B. Chitara, D. J. Late, S. B. Krupanidhi and C. N. R. Rao, Solid State Commun., 2010, 150, 2053–2056 CrossRef CAS.
- Y. C. Choi, H. Kim, C. Lee, J. Son, H. Baik, S. Park, J. Kim and K. S. Jeong, Chem. Mater., 2019, 31, 5370–5375 CrossRef CAS.
| This journal is © The Royal Society of Chemistry 2021 |