
 Open Access Article
 This Open Access Article is licensed under a Creative Commons Attribution-Non Commercial 3.0 Unported Licence
Surface enhanced Raman scattering of extracellular vesicles for cancer diagnostics despite isolation dependent lipoprotein contamination†
Hanna J.
Koster
 a,
Tatu
Rojalin
a,
Alyssa
Powell
a,
Dina
Pham
a,
Rachel R.
Mizenko
a,
Andrew C.
Birkeland
b and
Randy P.
Carney
*a
a,
Tatu
Rojalin
a,
Alyssa
Powell
a,
Dina
Pham
a,
Rachel R.
Mizenko
a,
Andrew C.
Birkeland
b and
Randy P.
Carney
*a
aDepartment of Biomedical Engineering, University of California, Davis, Davis, CA 95616, USA. E-mail: rcarney@ucdavis.edu
bDepartment of Otolaryngology – Head and Neck Surgery, University of California, Davis, Sacramento, CA 95817, USA
First published on 26th August 2021
Abstract
Given the emerging diagnostic utility of extracellular vesicles (EVs), it is important to account for non-EV contaminants. Lipoprotein present in EV-enriched isolates may inflate particle counts and decrease sensitivity to biomarkers of interest, skewing chemical analyses and perpetuating downstream issues in labeling or functional analysis. Using label free surface enhanced Raman scattering (SERS), we confirm that three common EV isolation methods (differential ultracentrifugation, density gradient ultracentrifugation, and size exclusion chromatography) yield variable lipoprotein content. We demonstrate that a dual-isolation method is necessary to isolate EVs from the major classes of lipoprotein. However, combining SERS analysis with machine learning assisted classification, we show that the disease state is the main driver of distinction between EV samples, and largely unaffected by choice of isolation. Ultimately, this study describes a convenient SERS assay to retain accurate diagnostic information from clinical samples by overcoming differences in lipoprotein contamination according to isolation method.
 Randy P. Carney | Randy Carney is an Assistant Professor of Biomedical Engineering at the University of California, Davis. He received his B.S. in Chemistry in 2008 from University of Arkansas, M.S. from MIT in 2010, and PhD in Materials Science and Engineering from EPFL in 2013. He continued his studies as a postdoctoral fellow at UC Davis focusing on soft nanomaterials, especially exosomes and related extracellular vesicles (EVs). Dr Carney now leads a young and diverse group of engineers to build platforms that examine the use of EVs as next-generation cancer biomarkers and therapeutics. |
Introduction
Extracellular vesicles (EVs) are nanoscale biomolecular packages of variable size and composition readily found in all biofluids and shed by every cell type measured to date.1 EVs play important roles in cellular communication via the directed shuttling of functional proteins, lipids, small molecules, and small non-coding nucleic acids.1,2 EVs are generally subdivided into categories, including exosomes, microvesicles, ectosomes, oncosomes, apoptotic bodies, and more, typically based on molecular features (i.e., size, morphology, composition) or biogenesis pathway.3 There has yet to be unanimous agreement on the appropriate terminology for a given subpopulation, so in this study we refer to the isolated vesicular particles across all methods using the more generic term of EVs,2 though these isolates also contain contaminating non-vesicular species as demonstrated in this study.Given that released EVs exhibit composition reflective of their parent cells in response to local external stimuli, they represent a rich source of potential biomarkers with great potential for clinical application.1,4–11 Yet many challenges remain before that potential can be reached, especially in the choice of EV isolation methodology, which has a known effect on the quality and content of the isolated product.2 In addition to vesicles, isolates may contain a variety of additional nanoscale biomolecular assemblies, including ribonucleoprotein particles,12 protein aggregates, small cellular debris, viruses,13 and many types of lipoprotein.14–19 There is no consensus on the expected concentration range of each particle type present in a given biofluid, since abundance is not predictable and influenced by a number of parameters, such as age,20 sleep,21 exercise,22 diet,23 and disease burden.
This study focuses on quantifying extent of contamination in EV isolates by lipoprotein, which represent a major fluctuating source of nanoscale particles in human biofluids. In plasma isolates, lipoprotein particles can be present up to 100-fold more than EVs.18 Lipoprotein manifest in many classes that vary in size and density. Chylomicrons serve as lipid and cholesterol transporters abundant in the blood with wide variation in size, ranging from ∼75 to 1200 nm.24 Smaller very low-density lipoprotein (VLDL), with nominal dimensions between 30–80 nm,25 can further be converted into even smaller types of lipoprotein, including intermediate-density lipoprotein (IDL, 25–35 nm) and low-density lipoprotein (LDL, 18–25 nm), though IDL is a transient species not readily isolated on its own.24 Chylomicrons, VLDL, and some LDL share nominal size overlap with EVs (∼30–150 nm). High-density lipoprotein (HDL, 5–15 nm) is the smallest in nominal size and below the lower threshold for EVs, yet does overlap with EVs in density (∼1.05–1.20 g mL−1).24 Because of these features, isolation methods based on separation according to size or density can co-purify lipoprotein to various extent (Fig. 1).
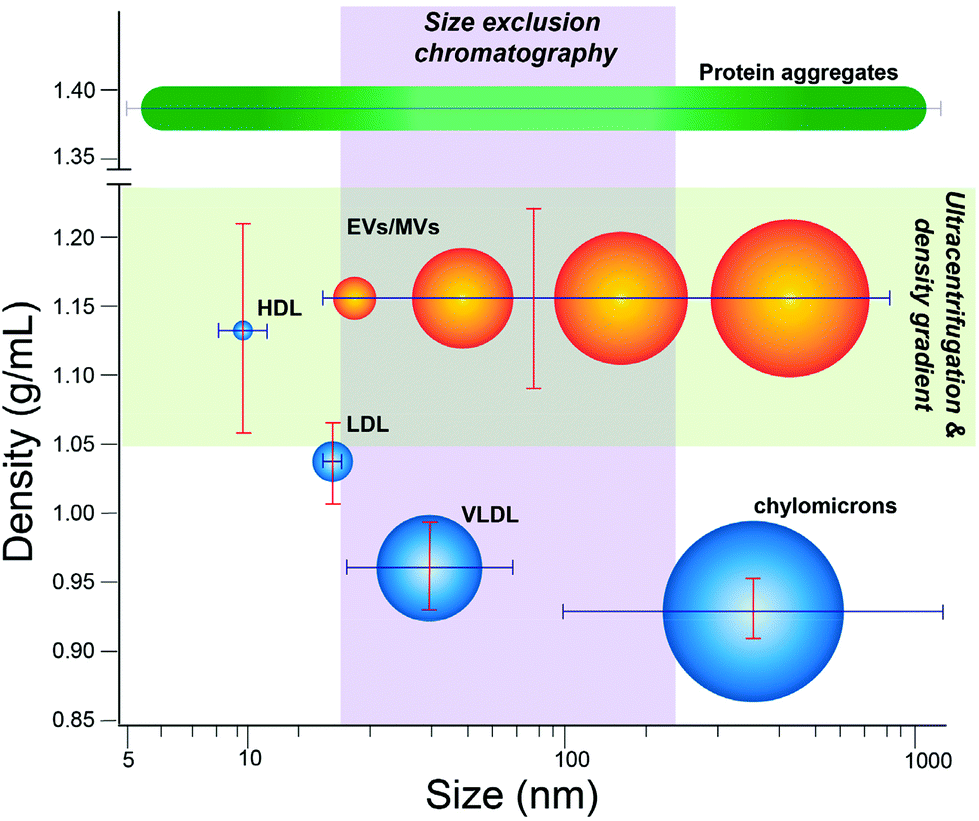 | ||
| Fig. 1 EVs and lipoprotein subtypes overlap depending on isolation method. Lipoproteins (blue) and EVs (orange) plotted according to respective size and densities, with various methods of isolation overlaid to show the relevant populations isolated by a given technique. EVs represent a heterogenous grouping of vesicular particles, including nanoscale exosomes, ectosomes, and other small EVs, but also larger microvesicles. EVs are thus spread over a large continuous range of sizes and densities. While more discrete in size and density per subtype, certain lipoproteins (HDL, LDL, VLDL, or chylomicrons) share significant overlap with EVs in size and/or density, thus are co-isolated to various extent depending on the particular isolation method. | ||
The most appropriate EV isolation method depends on the biofluid source and desired purity or downstream application, since isolation methods greatly influence yield and purity of EVs.25,26 Differential ultracentrifugation (UC) remains the most commonly used gold standard method.25–28 UC separates components according to relative density with additional influence from the size of the particles present. For a given rotor type and speed29 sedimentation rate is proportional to (i) the difference between the density of the medium and the density of the particle and (ii) the square root of the particle radius.15 HDL particles co-isolate with EVs when employing UC.19 Although EVs are larger than HDL particles and thus sediment faster, prolonged UC spins typical for EV isolation permit a significant amount of HDL lipoprotein to pellet as well.15 Still, the percentage of EV to HDL vesicles remains unclear, as current methods struggle to efficiently distinguish them post isolation.19
Related to UC is density gradient (DG) (or density cushion) ultracentrifugation. Also based on density, DG relies on chemical gradients to separate particles during an extended (∼18 h) spin.27 In DG, plasma components move through the gradient until they reach their respective isopycnic point (equilibrium condition). Banded fractions can be collected, and the gradient material removed to enrich EVs. Given their similar density ranges, EVs and HDL elute to the same locations and are co-isolated.19 Thus, for both UC and DG, HDL is the primary lipoprotein contaminant.
Size exclusion chromatography (SEC) is an emerging alternative to high-speed centrifugation techniques.26,30–32 In SEC, gel matrices with defined pore sizes provide a mechanism for smaller contaminants to travel through, while larger particles cannot enter the pores and elute more quickly. Eluted fractions can be pooled and concentrated to enrich EVs from biofluids. Yet, since chylomicrons, LDL, and VLDL all overlap in size with EVs, they each are co-isolated in the EV-rich fractions.
Some work has been performed to assess the purity of different bulk isolation methods using biochemical techniques of western blotting or ELISA, yet they are either not quantitative or require high volumes of sample input or expensive reagents, and neither are amenable for rapid analysis.18 A promising approach to improve on these limitations is surface-enhanced Raman scattering (SERS). SERS is a spectroscopic technique that provides valuable chemical information through the plasmonic amplification of inelastically-scattered photons following sample irradiation. It is an appealing technique for bio-analysis given that it is inherently label-free, non-destructive, and ultrasensitive, and can provide multiplexed chemical fingerprinting at the nanoscale with a single laser.33–39 The application of SERS to identify EVs in a label-free manner has been recently reviewed.40 Besides diagnostic evaluation of EVs, spontaneous Raman spectroscopy has been reported to be able to assess purity, yet that study did not consider the effects of lipoprotein contamination, analyze combinations of methods, nor evaluate clinically significant samples acquired from patients.41
In this study we utilized SERS to quantify the extent of lipoprotein contamination (accounting for each of the major subtypes) in a representative clinical dataset of EV isolates purified from plasma of head and neck cancer patients and healthy controls. We varied isolation methods between UC, DG, SEC, and a combination of UC + SEC to assess the effect on lipoprotein vs. EV content. By fitting resulting spectra of purified isolates to spectra of analytical standards of chylomicrons, VLDL, LDL, and HDL, we could accurately recapitulate the type and extent of lipoprotein co-isolated across each method. Notably, due to the multiplexed nature of SERS chemical analysis (spectra also contain molecular differences between samples not due to lipoprotein contamination), we found that cancer patient samples could be readily distinguished from non-cancer controls regardless of chosen isolation methodology and extent of lipoprotein contamination. This renders SERS a powerful tool, capable of both assessing lipoprotein content and concentration, but also seeing through such chemical contamination to reveal underlying disease-associated features relevant to diagnostic application.
Results
EV and lipoprotein isolation and characterization
We analyzed a focused dataset of whole blood samples isolated from patients undergoing head and neck surgery at UC Davis Health. Patients were consented prior to surgical tumor resection using an IRB-approved protocol and samples were provided to our lab stripped of identifying information. Our sample cohort contained in total 25 patients with squamous cell carcinoma and 11 non-malignant controls, according to histopathological analysis.After pre-clearing large aggregates up to 10![[thin space (1/6-em)]](https://www.rsc.org/images/entities/char_2009.gif) 000g, samples were evenly divided by volume and subject to either UC, DG, or SEC isolation protocols. In later experiments, sequential isolation methods were employed (i.e., UC followed by SEC on the same sample). Following a particular isolation method, EV-enriched isolates were analyzed for size and number concentration by nanoparticle tracking analysis (NTA). Across isolation techniques, samples consistently contained from 1 × 10¹¹ to 2.5 × 10¹² particles per mL with diameters apparently ranging from ∼50–300 nm and modes between 65–165 nm (Fig. 2a). There are some caveats to NTA, given its practical lower detection limit of ∼70 nm for typical refractive index measures of organic material,42,43 though it is known large numbers of EVs are present down to 30 nm.44,45 Transmission electron microscopy (TEM), for example, reveals many sub-70 nm particles (Fig. 2b). For both NTA and TEM, due to the overlapping sizes of EVs with chylomicrons, VLDL, and LDL, particle count interpretation is difficult, thus we are careful not to overinterpret any slight differences between EVs from various preps across these methods. Isolates were further characterized by single particle interferometric reflectance imaging sensing (SP-IRIS) using the ExoView R100 (NanoView Biosciences, Boston) platform and antibody coated spots of anti-CD9, anti-CD63, anti-CD81, and control mouse anti-IgG, and the same antibody types for sandwich detection.46 While TEM and NTA cannot easily determine if particles are lipoprotein or EV in nature, SP-IRIS helps confirm the presence of common EV sequestered tetraspanins (Fig. 2c and d). In the Fig. 2c plot, the y-axis represents the number of single particles captured on the chip (capture antibody is noted on the category x-axis) that express the detection antibody, either anti-CD9 (blue), anti-CD63 (red), or anti-CD81 (yellow). We found recently that EVs isolated from various sources (e.g., human biofluids, cell culture supernatant) exhibit characteristic expression patterns that are highly repeatable over time and independent of isolation method.47 When expression levels for capture/detection pairs are normalized to each sample's total particle count, (Fig. 2d) trends in expression of those three tetraspanins are relatively consistent across several clinical samples over a mix of isolation methods. As noted by the grouping of each set of points for a particular capture/detection pair. this indicates that we are isolating the same general population of EVs across isolation methods.
000g, samples were evenly divided by volume and subject to either UC, DG, or SEC isolation protocols. In later experiments, sequential isolation methods were employed (i.e., UC followed by SEC on the same sample). Following a particular isolation method, EV-enriched isolates were analyzed for size and number concentration by nanoparticle tracking analysis (NTA). Across isolation techniques, samples consistently contained from 1 × 10¹¹ to 2.5 × 10¹² particles per mL with diameters apparently ranging from ∼50–300 nm and modes between 65–165 nm (Fig. 2a). There are some caveats to NTA, given its practical lower detection limit of ∼70 nm for typical refractive index measures of organic material,42,43 though it is known large numbers of EVs are present down to 30 nm.44,45 Transmission electron microscopy (TEM), for example, reveals many sub-70 nm particles (Fig. 2b). For both NTA and TEM, due to the overlapping sizes of EVs with chylomicrons, VLDL, and LDL, particle count interpretation is difficult, thus we are careful not to overinterpret any slight differences between EVs from various preps across these methods. Isolates were further characterized by single particle interferometric reflectance imaging sensing (SP-IRIS) using the ExoView R100 (NanoView Biosciences, Boston) platform and antibody coated spots of anti-CD9, anti-CD63, anti-CD81, and control mouse anti-IgG, and the same antibody types for sandwich detection.46 While TEM and NTA cannot easily determine if particles are lipoprotein or EV in nature, SP-IRIS helps confirm the presence of common EV sequestered tetraspanins (Fig. 2c and d). In the Fig. 2c plot, the y-axis represents the number of single particles captured on the chip (capture antibody is noted on the category x-axis) that express the detection antibody, either anti-CD9 (blue), anti-CD63 (red), or anti-CD81 (yellow). We found recently that EVs isolated from various sources (e.g., human biofluids, cell culture supernatant) exhibit characteristic expression patterns that are highly repeatable over time and independent of isolation method.47 When expression levels for capture/detection pairs are normalized to each sample's total particle count, (Fig. 2d) trends in expression of those three tetraspanins are relatively consistent across several clinical samples over a mix of isolation methods. As noted by the grouping of each set of points for a particular capture/detection pair. this indicates that we are isolating the same general population of EVs across isolation methods.
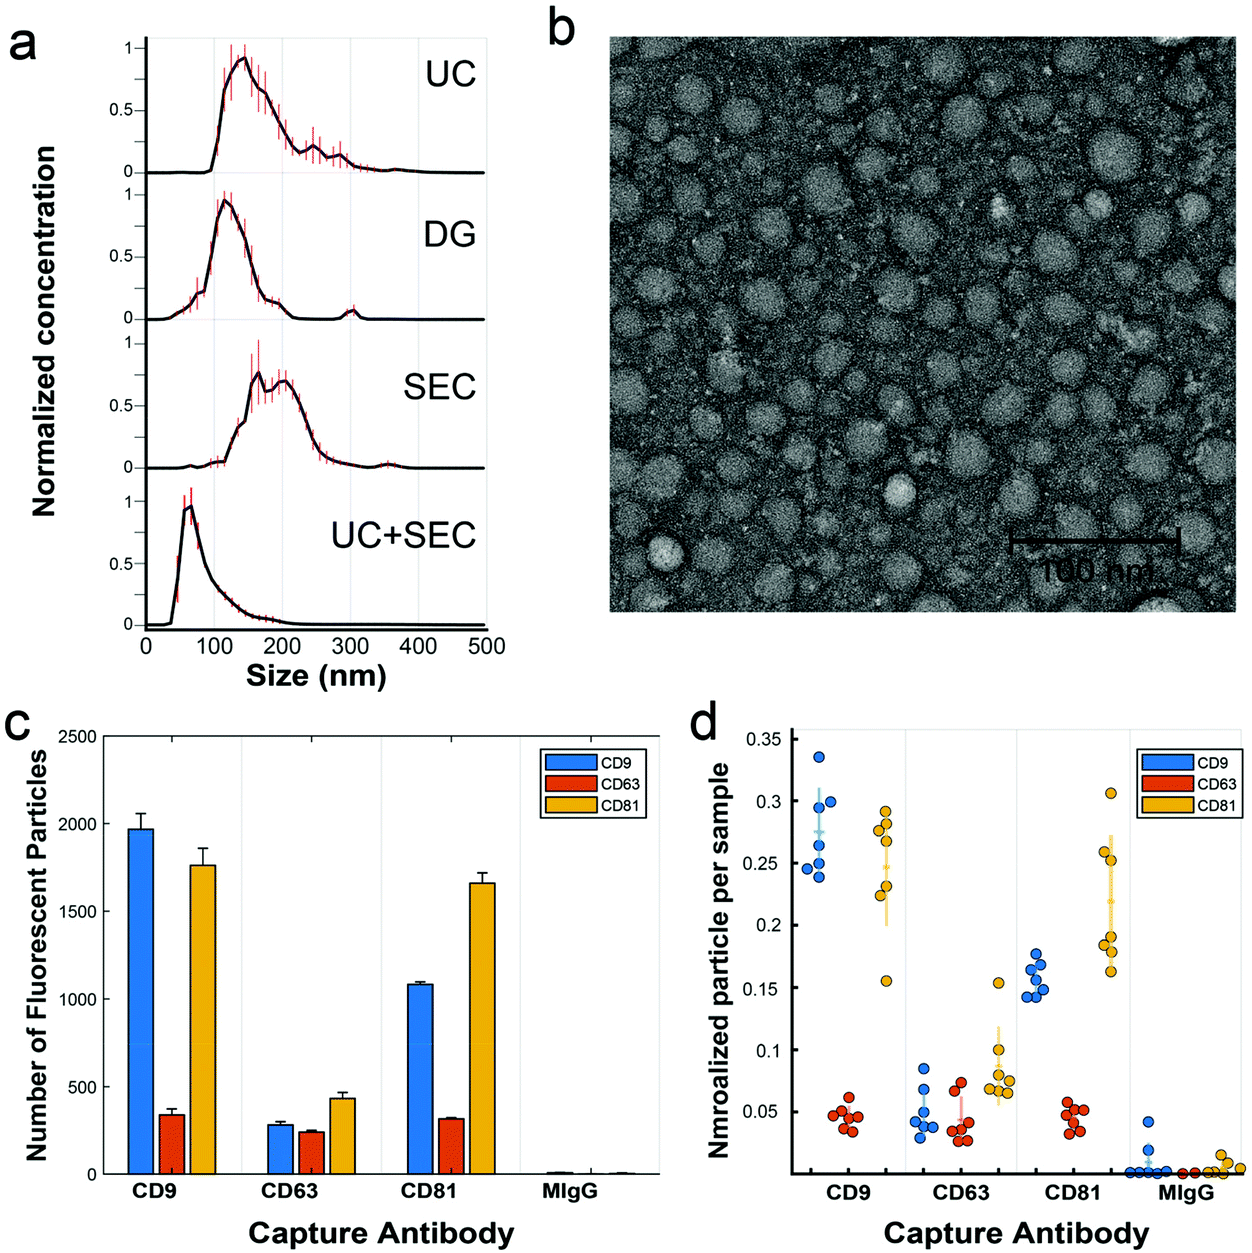 | ||
| Fig. 2 Characterization of EVs. (a) NTA is used to measure size distribution and particle concentration for the isolation methods UC, DG, SEC, and UC + SEC performed on a representative clinical sample. (b) A negative-stained TEM micrograph illustrates the size and morphology of particles isolated by SEC. (c) Representative data of an antibody sandwich assay using SP-IRIS, which demonstrates the presence of EVs captured against tetraspanins CD9, CD63, and CD81, alongside control mouse-IgG (MIgG). Particle counts from fluorescently labeled detection antibodies are displayed, e.g., the first orange column from the left represents detected particles both captured by anti-CD9 and also labeled with anti-CD63. (d) Column scatter plot of SP-IRIS data from 7 representative clinical samples, each sample normalized to its total particle count for ease of comparison. Each circle represents the average expression value for a given clinical sample, with horizontal dashes representing the group mean and vertical lines one standard deviation from the mean. | ||
Functionalization of SERS substrates to non-specifically capture anionic EVs and lipoprotein
For SERS measurement, we employed a commercially available substrate comprised of a quartz microfiber matrix embedded with gold nanoparticle clusters, grafted to a borosilicate glass microscope slide, optimized for 785 nm excitation wavelength (Ocean Insight). The nanoparticles are solid gold spheres with an approximate diameter of 40–60 nm. Image analysis was performed on the SEM images using FIJI software, by utilizing the high contrast of the gold via the ABS detector to estimate the density of gold on the substrates, which was found to be ∼2–4% surface coverage. EVs distributed throughout this matrix (schematized in Fig. 3) and localized near the plasmonic gold experience the high electromagnetic fields generated by coupling between the excitation laser and localized surface plasmons on the matrix. This surface enhancement gives rise to immense amplification of otherwise weak Raman scattering signals, which can be detected via our custom-built confocal scanning Raman microscope. In preliminary testing,48 we dried out a concentrated drop of EV-rich isolate onto the SERS substrate, but noted that this resulted in a dense impenetrable monolayer of dried biomass that masked any detectable EV-specific signal and largely prevented EV diffusion into the 3D nanowire mesh. On the other hand, simply dropping a small volume of EVs onto the SERS substrate, followed by washing, only resulted in modest EV retention in the mesh. To improve this, we developed a method of surface functionalization by cysteamine prior to EV sample addition. Cysteamine is a useful biofunctionalization linker,49,50 with a terminal thiol group on one end that binds to the gold substrate and a free amine on the other end, effectively priming the surface with positive charge for non-specific capture of inherently anionic EVs and lipoprotein. Of note, cysteamine is a very small chemical entity (MW = 77.15 g mol−1) used at 20 mM concentration in the surface functionalization phase. Based on our previous study48 where the potential effects of surface treatment with cysteamine are addressed, and the overall physicochemical properties of cysteamine, the structure of quartz matrix and the SERS performance are unchanged by cysteamine functionalization. The major spectral features of cysteamine are distinct from the ones noted to distinguish cancer vs. control, thus do not play a role in our diagnostic interpretation. The interaction mechanism between the gold nanoparticle clusters embedded in the SERS substrate and EVs and lipoprotein that are being laid atop of the substrate is based on electrostatic pull-down between the positively charged amine groups on the surface of gold nanoparticles and the EVs and lipoprotein that are negatively charged in aqueous solutions.51–54 Based on these interactions, we recently showed that cysteamine functionalization allows for excellent retention of EV-rich material even after several rounds of washing.48 Following cysteamine-mediated EV adsorption, we imaged the substrate morphology with SEM (Fig. 3b), which shows EVs localized to the surface of the nanowires, demonstrating their effective retention and proximity to plasmonic substructures for subsequent SERS measurement. Notably, anionic lipoprotein co-isolated with EVs from clinical biofluids would also be pulled down to the cysteamine-functionalized surface and potentially subjected to plasmonic enhancement as well.53,54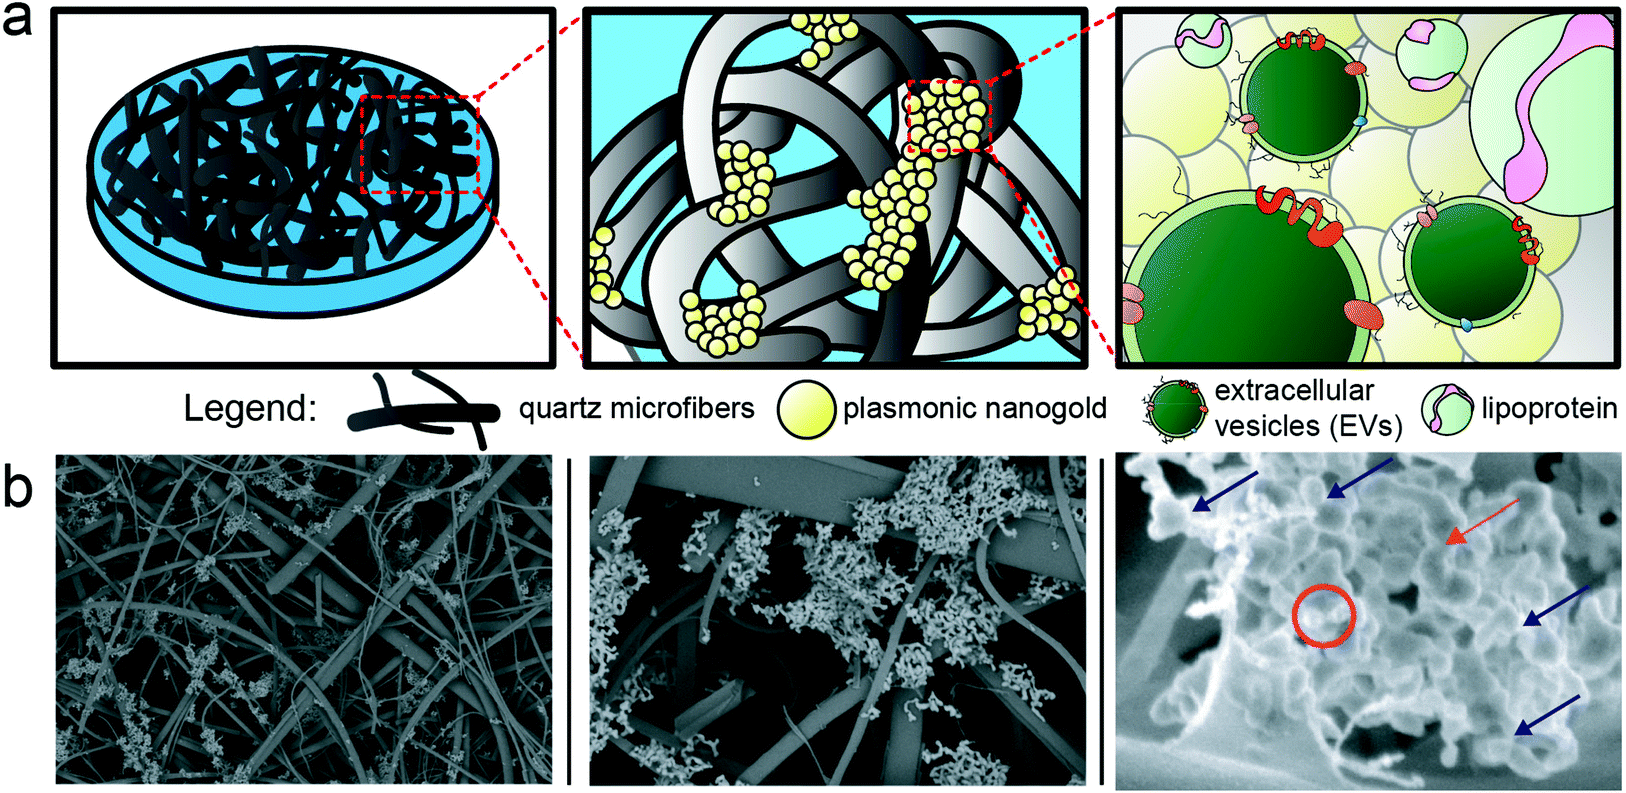 | ||
| Fig. 3 Porous plasmonic SERS substrates are used for label-free analysis of EVs and lipoprotein. We utilized a commercial SERS substrate based on plasmonic nanogold clusters embedded throughout a quartz microfiber matrix. As schematized by cartoon in (a) with corresponding images captured by SEM in (b), EVs and lipoprotein particles can traverse the quartz network structure and localize to the plasmonic nanogold for subsequent enhancement. The substrate is pre-treated with cysteamine to increase efficiency of pull down of anionic EVs and lipoprotein to the surface. The red circle and arrow annotate potential bioparticles adsorbed to the surface, while the rest of the features seen can be attributed to the nanogold itself (blue arrows). | ||
During typical SERS analysis, the laser was swept across the substrate to randomly sample plasmonically active spots throughout. Across many randomly selected spots in the substrate, several subsequent sets consisting of twenty consecutive 1 s spectra were captured at each selected spot. Therefore, for a given sample condition across a single substrate, dozens of spectra were captured and analyzed.
Prior to EV analysis, lipoprotein analytical standards were measured from stock solutions using the SERS substrates (Fig. 4a). Raman spectroscopy has been previously used to sensitively distinguish lipoprotein variants.55 Here, samples are compared throughout using principal component analysis (PCA), which we have previously reported for reducing dimensionality of Raman spectral datasets.56,57 PCA generates an intuitive visualization of multivariate data, capturing as much variability as possible and conserving the pertinent information responsible for the major sources of data variability.58 The analysis yields two commonly interpreted outputs; a principal component (PC) score plot and PC loading spectra. The PC score plots aid visual comprehension of the variance and groupings within the analyzed data, and the magnitude of differences (Fig. 4b). The PC loading spectra (Fig. 4c) report on the contribution of each independent variable (i.e., spectral region) to the observed differences, and thus can be used to pinpoint the prominent spectral features that can further be assigned to encompass different chemical bonds, structures, and functional groups. Notably, each of the four classes of lipoprotein (chylomicrons, VLDL, LDL, and HDL) could be distinguished from one another in PC space following their interrogation by SERS substrate, as observed by the distinct clustering in Fig. 4b along the PC axes represented by the spectral loadings in Fig. 4c.
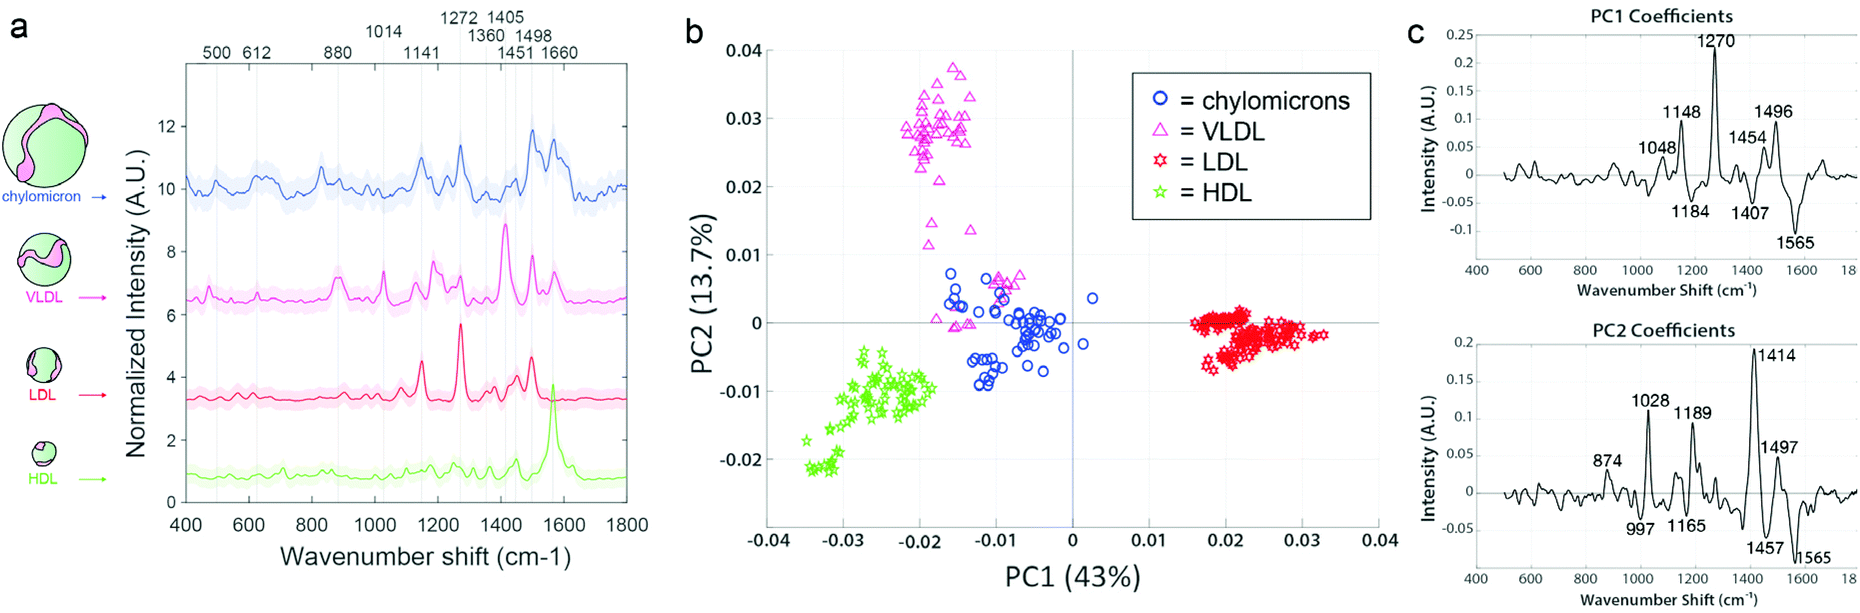 | ||
| Fig. 4 Lipoprotein analytical standards are readily distinguished by Raman scattering. (a) SERS spectra of lipoprotein analytical standards, offset for clarity. SERS peaks are readily distinguished from each other. (b) Principal component analysis using PC1 and PC2 (together representing more than 56% of the total variability in the dataset), with loadings (c), shows distinct separation of the lipoprotein subtypes according to spectral differences. | ||
We have made efforts to fully assign the vibrational peaks driving variability across the datasets (annotated throughout this study's figures, e.g., in Fig. 4c), but caution against overinterpretation of single spectral peaks, particularly for SERS spectra which are often very dynamic in time during even a short measurement. While our full assignments for each peak of interest, according to literature references,33,59–67 can be found in ESI Table 1,† we comment throughout in the main text on the possible significance of certain major groupings of feature types (e.g., when multiple peaks are indicative of lipids, nucleic acids, proteins, etc. for a given spectral loading).
For example, in the lipoprotein dataset, 43% of the sample variability is accounted for in PC1, which splits LDL from the other lipoprotein variants. The main peaks responsible for the variation in PC1 are an increase in 1048 cm−1, 1148 cm−1, 1270 cm−1, and 1454 cm−1, previously noted to correspond to carotenoid compounds that can associate with LDL (but to a lesser degree with HDL), as well as aliphatic chains of LDL-contained lipid species.64,68 PC2 further stratified the remaining lipoprotein types, driven primarily by phospholipid type features. VLDL and chylomicrons displayed the most similarities to each other, as indicated by their proximity and slight overlap. This is somewhat anticipated, as VLDL is the first type of lipoprotein produced as chylomicrons get broken down by the liver.24 Although these lipoproteins are all derivative of each other and chemically similar, it is clear that they each maintain unique differences and are distinguishable according to their SERS spectra.
EVs isolated from clinical biofluids using various methods show key compositional differences
We next analyzed EV isolates using the SERS assay. EVs were isolated from each patient sample using either UC, DG, or SEC techniques and analyzed by PCA, with representative spectra shown in Fig. 5a. We chose patient C-1, diagnosed with nasal cavity squamous cell carcinoma as a representative data set to test whether the various isolation methods are primarily responsible for driving the chemical differences across samples, as evident by their clear separation in PC space. On this note, caution should be exercised generalizing these initial analyses to broader context. Nevertheless, it is evident in Fig. 5b using a representative PC score plot for patient C-1, that discernible spectral regions stand out indicating clear impact of the isolation method used on the chemical composition of the sample. For example, the band regions 926 cm−1, 1005 cm−1, 1323 cm−1, and 1521 cm−1 seen in PC1 are related to nucleic acids signatures and are positive for all of the DG spectra (red) while the same regions are negative for SEC (pink) and UC (blue), implying that additional nucleic acid material is traveling to the same isopycnic spot as our EV preps. The accompanying negative PC1 loading regions of 1144 cm−1, 1275 cm−1, and 1485 cm−1 all relate to various lipid and protein signatures. This analysis implies that these lipid and protein signatures are more present in UC and SEC samples than in DG samples. This is a clear indication that each method co-isolates specific patterns of nucleic acids, lipids, and proteins in various amounts, and the chemical composition of these patterns differs depending on some extent to the isolation method.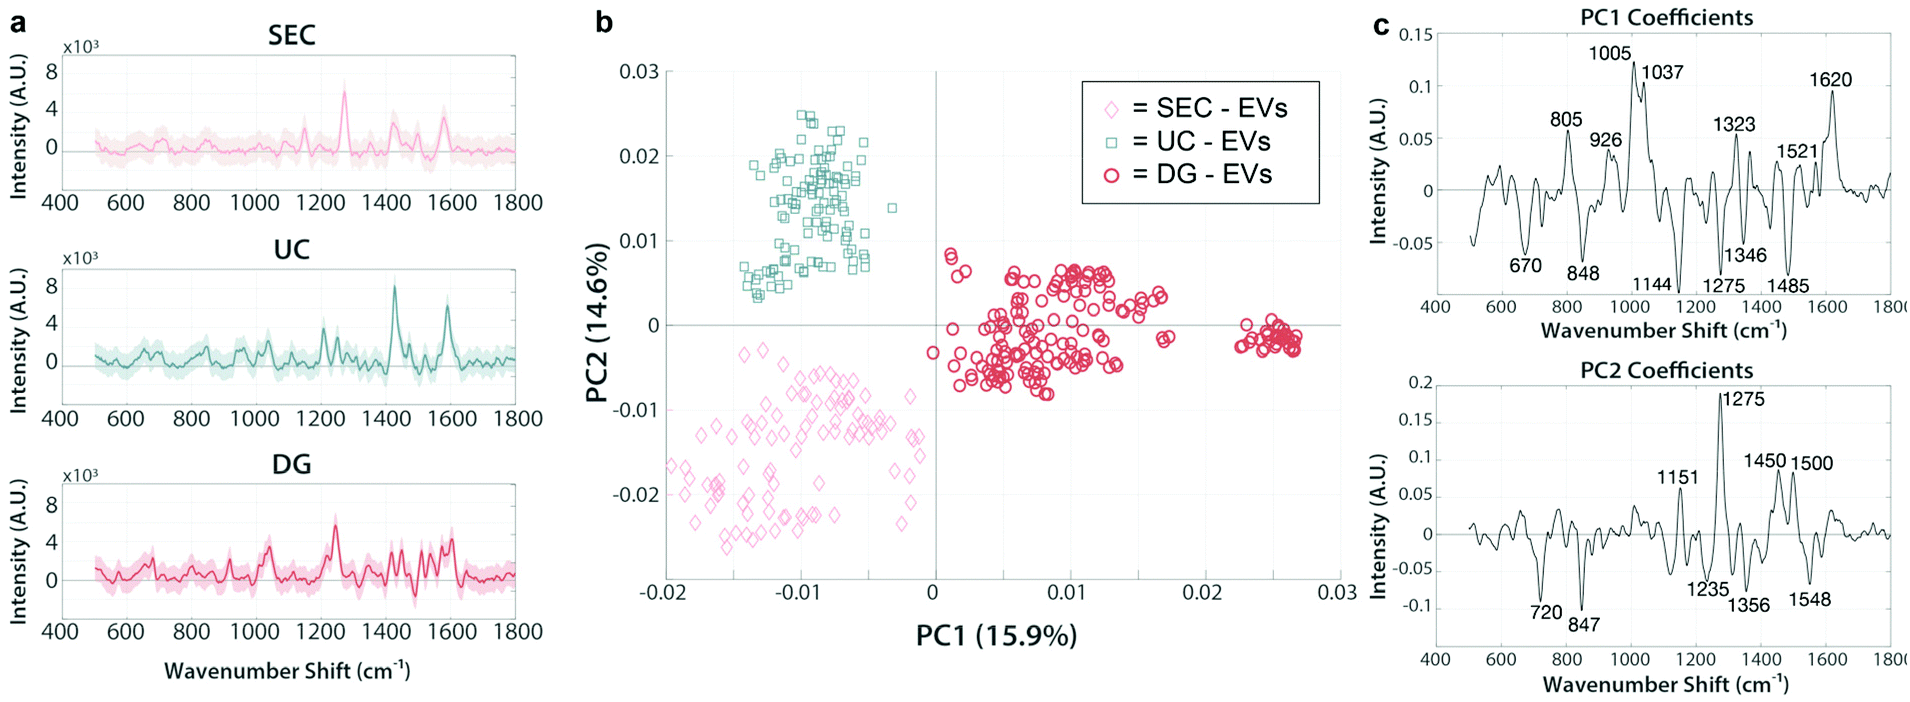 | ||
| Fig. 5 PCA of SERS spectra from EVs isolated by various methods are chemically distinct. Principal component analysis of SERS spectra from EVs isolated from patient C-1 (diagnosed with nasal cavity squamous cell carcinoma). Isolation methods of the same sample produce chemically different clusters (a) Representative SERS spectra from SEC, UC, and DG samples. (b) 2D principal component score plot (PC1–PC2) containing measurements from EVs isolated by either SEC (pink), UC (blue), or DG (red). Each marker represents a single measurement sampled across the SERS substrate after incubation with EV isolates. (c) PC1 and PC2 loading spectra reveal the chemical attributes responsible for the driving variation between populations. | ||
Stratification along PC2 represents an increase in peaks 1151 cm−1, 1275 cm−1, 1450 cm−1, and 1500 cm−1, notable lipid and protein signatures. It is not clear whether these differences are due to varying extent of contamination by lipoprotein, so as an initial negative control we compared EVs isolated from an ovarian cancer cell line (SKOV-3). We measured the SERS spectra for SKOV-3 EVs isolated by both UC and SEC and plotted them against each other. Given that the cell lines are grown in culture media without lipoprotein, their released EVs should be free of the chemical signatures we gathered from the standards which makes them an appealing negative control. In fact, there was no separation from these two populations (ESI Fig. 1a†), indicating that no major differential accumulation of contaminants is taking place depending on the technique used. When plotted with the lipoprotein standards, the SKOV-3 EV SERS measurements revealed clear separation from all the different types of lipoproteins (ESI Fig. 1b†). The lack of overlap with the signals indicates that there is no lipoprotein co-isolated with the in vitro derived SKOV-3 EVs, regardless of isolation method.
EV preparations spectrally cluster with lipoprotein standards based on isolation method
To assess the extent and type of lipoprotein signatures conceivably present in our clinical EV isolations, we analyzed the lipoprotein standards and EV isolations together. Fig. 6a shows a representative figure for the patient sample C-1, which was chosen as a test data set like the analyses carried out in the previous section. In fact, the spectral features identified in PC1 (1270 cm−1, 1454 cm−1, 1497 cm−1) are highly reflective of the overall chemical content of VLDL and LDL. EVs isolated by SEC (pink diamonds) shared similar protein and lipid signatures that were seen in the VLDL and chylomicron spectra (magenta triangles and red stars, respectively). VLDL and chylomicrons exhibit a high degree of overlap with EVs in the size range of particles purified by SEC, supporting our finding of similar spectra and interpretation that this means SEC-isolated EV preps co-isolate those lipoproteins. EVs isolated using either UC or DG (blue squares and orange circles in Fig. 6a, respectively) have a much greater association with the HDL spectra (green stars). The position of the UC and DG in combination with the PC2 axis shows that they still have a higher enrichment of distinguishable lipid features (1180 cm−1, 1376 cm−1, and 1436 cm−1; all report on lipid vibrations as shown in ESI Table 1†) as compared to the HDL standard. Taken together we can determine that there is a correlation with the co-isolation of HDL when employing DG, a density-based isolation method, i.e., specimen that have resembling densities co-locate in the same fraction(s) of the gradient solution. In all the clinical EV samples we tested, similar trends for grouping were followed. We expected to see lipoproteins in the same size range as the EVs (chylomicrons, VLDL, and LDL) to group more consistently with EVs from SEC while those with the same density (HDL) would share higher proximity to the density-based EV isolation methods of UC and DG. The PC analysis supported this hypothesis and showed a strong correlation of the grouping based on both size and density. Taken together, these findings indicate that different types of lipoproteins are present in varying amounts depending on which EV isolation technique is used.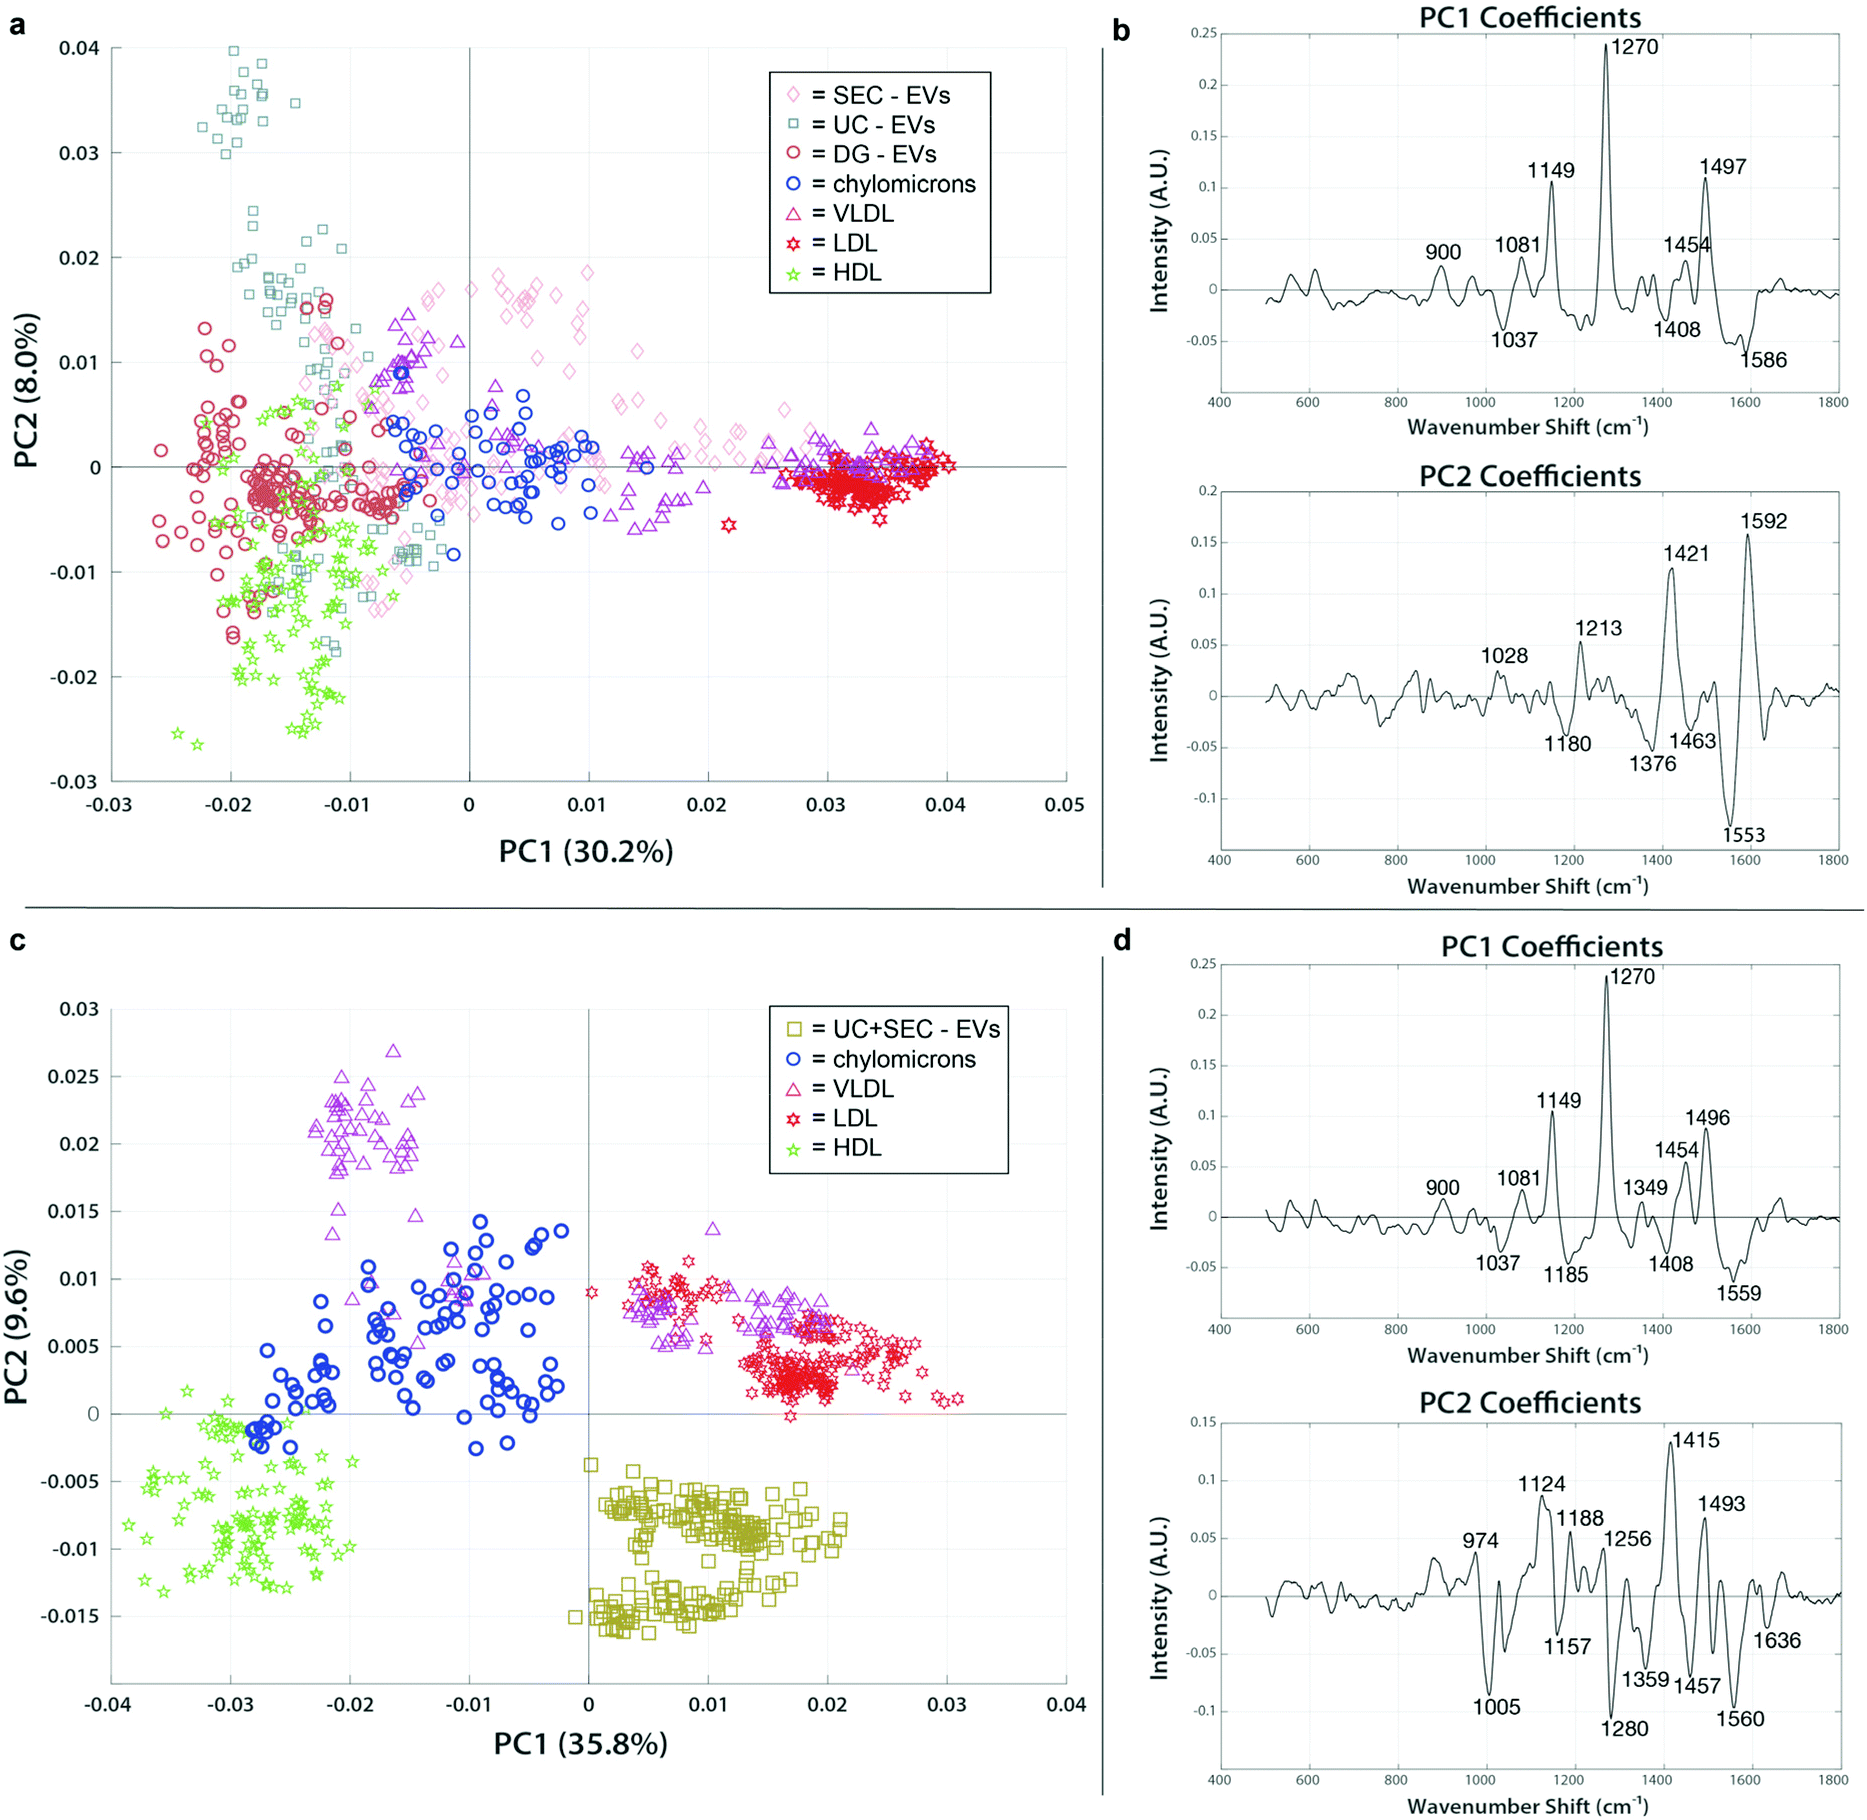 | ||
| Fig. 6 PCA of SERS spectra from clinical EVs isolated across various methods compared to lipoprotein standards reveals extent of contamination. PCA score plots and loading spectra for EVs isolated by different methods and lipoprotein standards. EVs group with lipoprotein populations to which they are more chemically similar. (a) Single isolation methods for EVs using either SEC (pink diamonds), UC (blue squares), or DG (orange circles) group differently with chylomicrons (blue circles), VLDL (magenta triangles), LDL (red stars), and HDL (green stars). (b) PC1 and PC2 loadings indicate the chemical peaks responsible for the greatest amount of variation between samples in panel (a). (c) Dual isolation strategy of EVs using UC followed by SEC (brown squares) has no overlap with the lipoprotein standards. (d) PC1 and PC2 loadings representing the spectral areas responsible for the majority of variation between samples in panel (c). | ||
Combination of isolation techniques leads to less lipoprotein contamination of the samples
To examine whether a multi-step isolation approach could remove all types of lipoproteins, EV samples that were first isolated by UC were further purified by subsequent SEC. Samples were concentrated and measured using the SERS assay, then mapped with the same lipoprotein standards in PC space for evaluation. The resulting plot showed a clean separation of the dually isolated sample from all the lipoprotein present (Fig. 6c and d). From the positive spectral features of PC2 we can note that the VLDL, chylomicrons, and LDL exhibit a very different lipid and protein chemical profile from both HDL (as previously noted) and the dually isolated EV sample. The PC2 loading peaks at 1005 cm−1 (phenylalanine), 1280 (CH2, CH3 deformation/C–N stretching), 1560 cm−1 (tryptophan), and 1636 (amide I) are pronouncedly present in HDL and UC + SEC compared to VLDL, chylomicrons, and LDL, which points to the protein-enriched chemical contents in HDL and UC + SEC samples. On the other hand, the peaks at 1124 cm−1 (C–C and C–N stretching of proteins and lipids), 1188 (C–C or C–O e.g., phospholipids), 1415 cm−1 (CH rocking in lipids), and 1493 cm−1 (conjugated C![[double bond, length as m-dash]](https://www.rsc.org/images/entities/char_e001.gif) C vibrations) could evidence the abundance of lipid-related components in VLDL, chylomicrons, and LDL, simultaneously less represented in HDL and UC + SEC samples. Of note, even though the PC1 analysis first implied that there might had been VLDL/LDL signatures in the UC + SEC EV isolate, the PC2 analysis showed that the EV isolate can be distinguished from these lipoproteins. Hence, the observed SERS peak similarities in PC1 analysis highly likely stem from the fact that the peaks can represent multiple chemical entities (e.g., the peak at 1271 cm−1 can be assigned to amide III bond vibrations in EV proteins in the UC + SEC sample, in unison representing CC bonds in fatty acids and aliphatic chains of LDL-contained lipid species). The capability to project the data in PC space containing multiple directions is the strength of our multivariate analysis approach. Thus, SERS analysis is a viable tool to validate the purity of the isolate. To our knowledge, this is the first direct indication that dual isolation using UC and SEC in tandem is more capable of purifying EVs from lipoprotein.
C vibrations) could evidence the abundance of lipid-related components in VLDL, chylomicrons, and LDL, simultaneously less represented in HDL and UC + SEC samples. Of note, even though the PC1 analysis first implied that there might had been VLDL/LDL signatures in the UC + SEC EV isolate, the PC2 analysis showed that the EV isolate can be distinguished from these lipoproteins. Hence, the observed SERS peak similarities in PC1 analysis highly likely stem from the fact that the peaks can represent multiple chemical entities (e.g., the peak at 1271 cm−1 can be assigned to amide III bond vibrations in EV proteins in the UC + SEC sample, in unison representing CC bonds in fatty acids and aliphatic chains of LDL-contained lipid species). The capability to project the data in PC space containing multiple directions is the strength of our multivariate analysis approach. Thus, SERS analysis is a viable tool to validate the purity of the isolate. To our knowledge, this is the first direct indication that dual isolation using UC and SEC in tandem is more capable of purifying EVs from lipoprotein.
Cancer diagnostic performance of the SERS platform is consistent across EV isolation method
Although we saw evidence that the type of isolation method used changes the chemical signature of the EV samples, we were interested in evaluating and quantifying the capabilities of our SERS platform to distinguish cancer from non-cancer, regardless of the technique used. Following variable reduction by PCA we applied a straightforward machine learning (ML) approach using either supervised linear discriminant analysis (LDA) or quadratic discriminant analysis (QDA), which have attained notable interest in vibrational spectroscopy applications.69–71 We refer to the methods as PCA-LDA and PCA-QDA, respectively. In essence, LDA and QDA are relatively simple boundary discriminant methods that separate sample classes or groups. LDA presumes a single variance-covariance matrix across classes, resulting in linear boundaries that are straight lines or hyperplanes dividing the variable space into categorized regions. QDA, in turn, assumes that the variance-covariance matrices are different for each class, yielding quadratic boundaries that are quadratic curves or hyperplanes dividing the variable space. Thus, QDA represents a potentially more flexible modeling approach since it allows for discriminating classes wherein the class-specific covariance matrices are significantly different. Although QDA is considered to perform well for normally or multi-normally distributed data, requiring minimal optimization, and being comparably immune to overfitting,71 the superiority of LDA versus QDA is rarely known a priori.Therefore, we tested PCA-LDA and PCA-QDA for UC, DG, SEC, and UC + SEC isolated samples in the context of cancer detection and diagnostics (Fig. 7). The PC scores were used as input data for LDA/QDA, and to avoid overfitting,72 we chose to use either the first two or three PCs (PC1–PC2 or PC1–PC3, respectively) as input features for the classifiers. To effectively compare these models, we established quality performance metrics consisting of accuracy (i.e., error rate), sensitivity, and specificity to discriminate cancerous samples from non-cancerous controls. The full metrics for each approach is shown in ESI Table 2.† The best performing model (i.e., most accurate) for each isolation method is plotted in Fig. 7. Panels a, d, g, and j show the 2D or 3D PC space with the linear or hyperplane decision boundary drawn in dark grey, cancerous samples in red, non-cancerous control samples in blue, and misclassified data points as yellow circles. Corresponding PC loadings for the first two PCs are shown in panels b, e, h, and k, along with annotated peaks color coded according to their presence in the raw cancer or non-cancer spectra. ESI Fig. 2† displays the global mean and standard deviation for the processed SERS spectra for each isolation methodology, along with annotated wavenumber regions corresponding to the numbers shown in the Fig. 7 loadings. The panels c, f, I, and l display the confusion matrix accompanied with the performance metrics table for sensitivity and specificity.
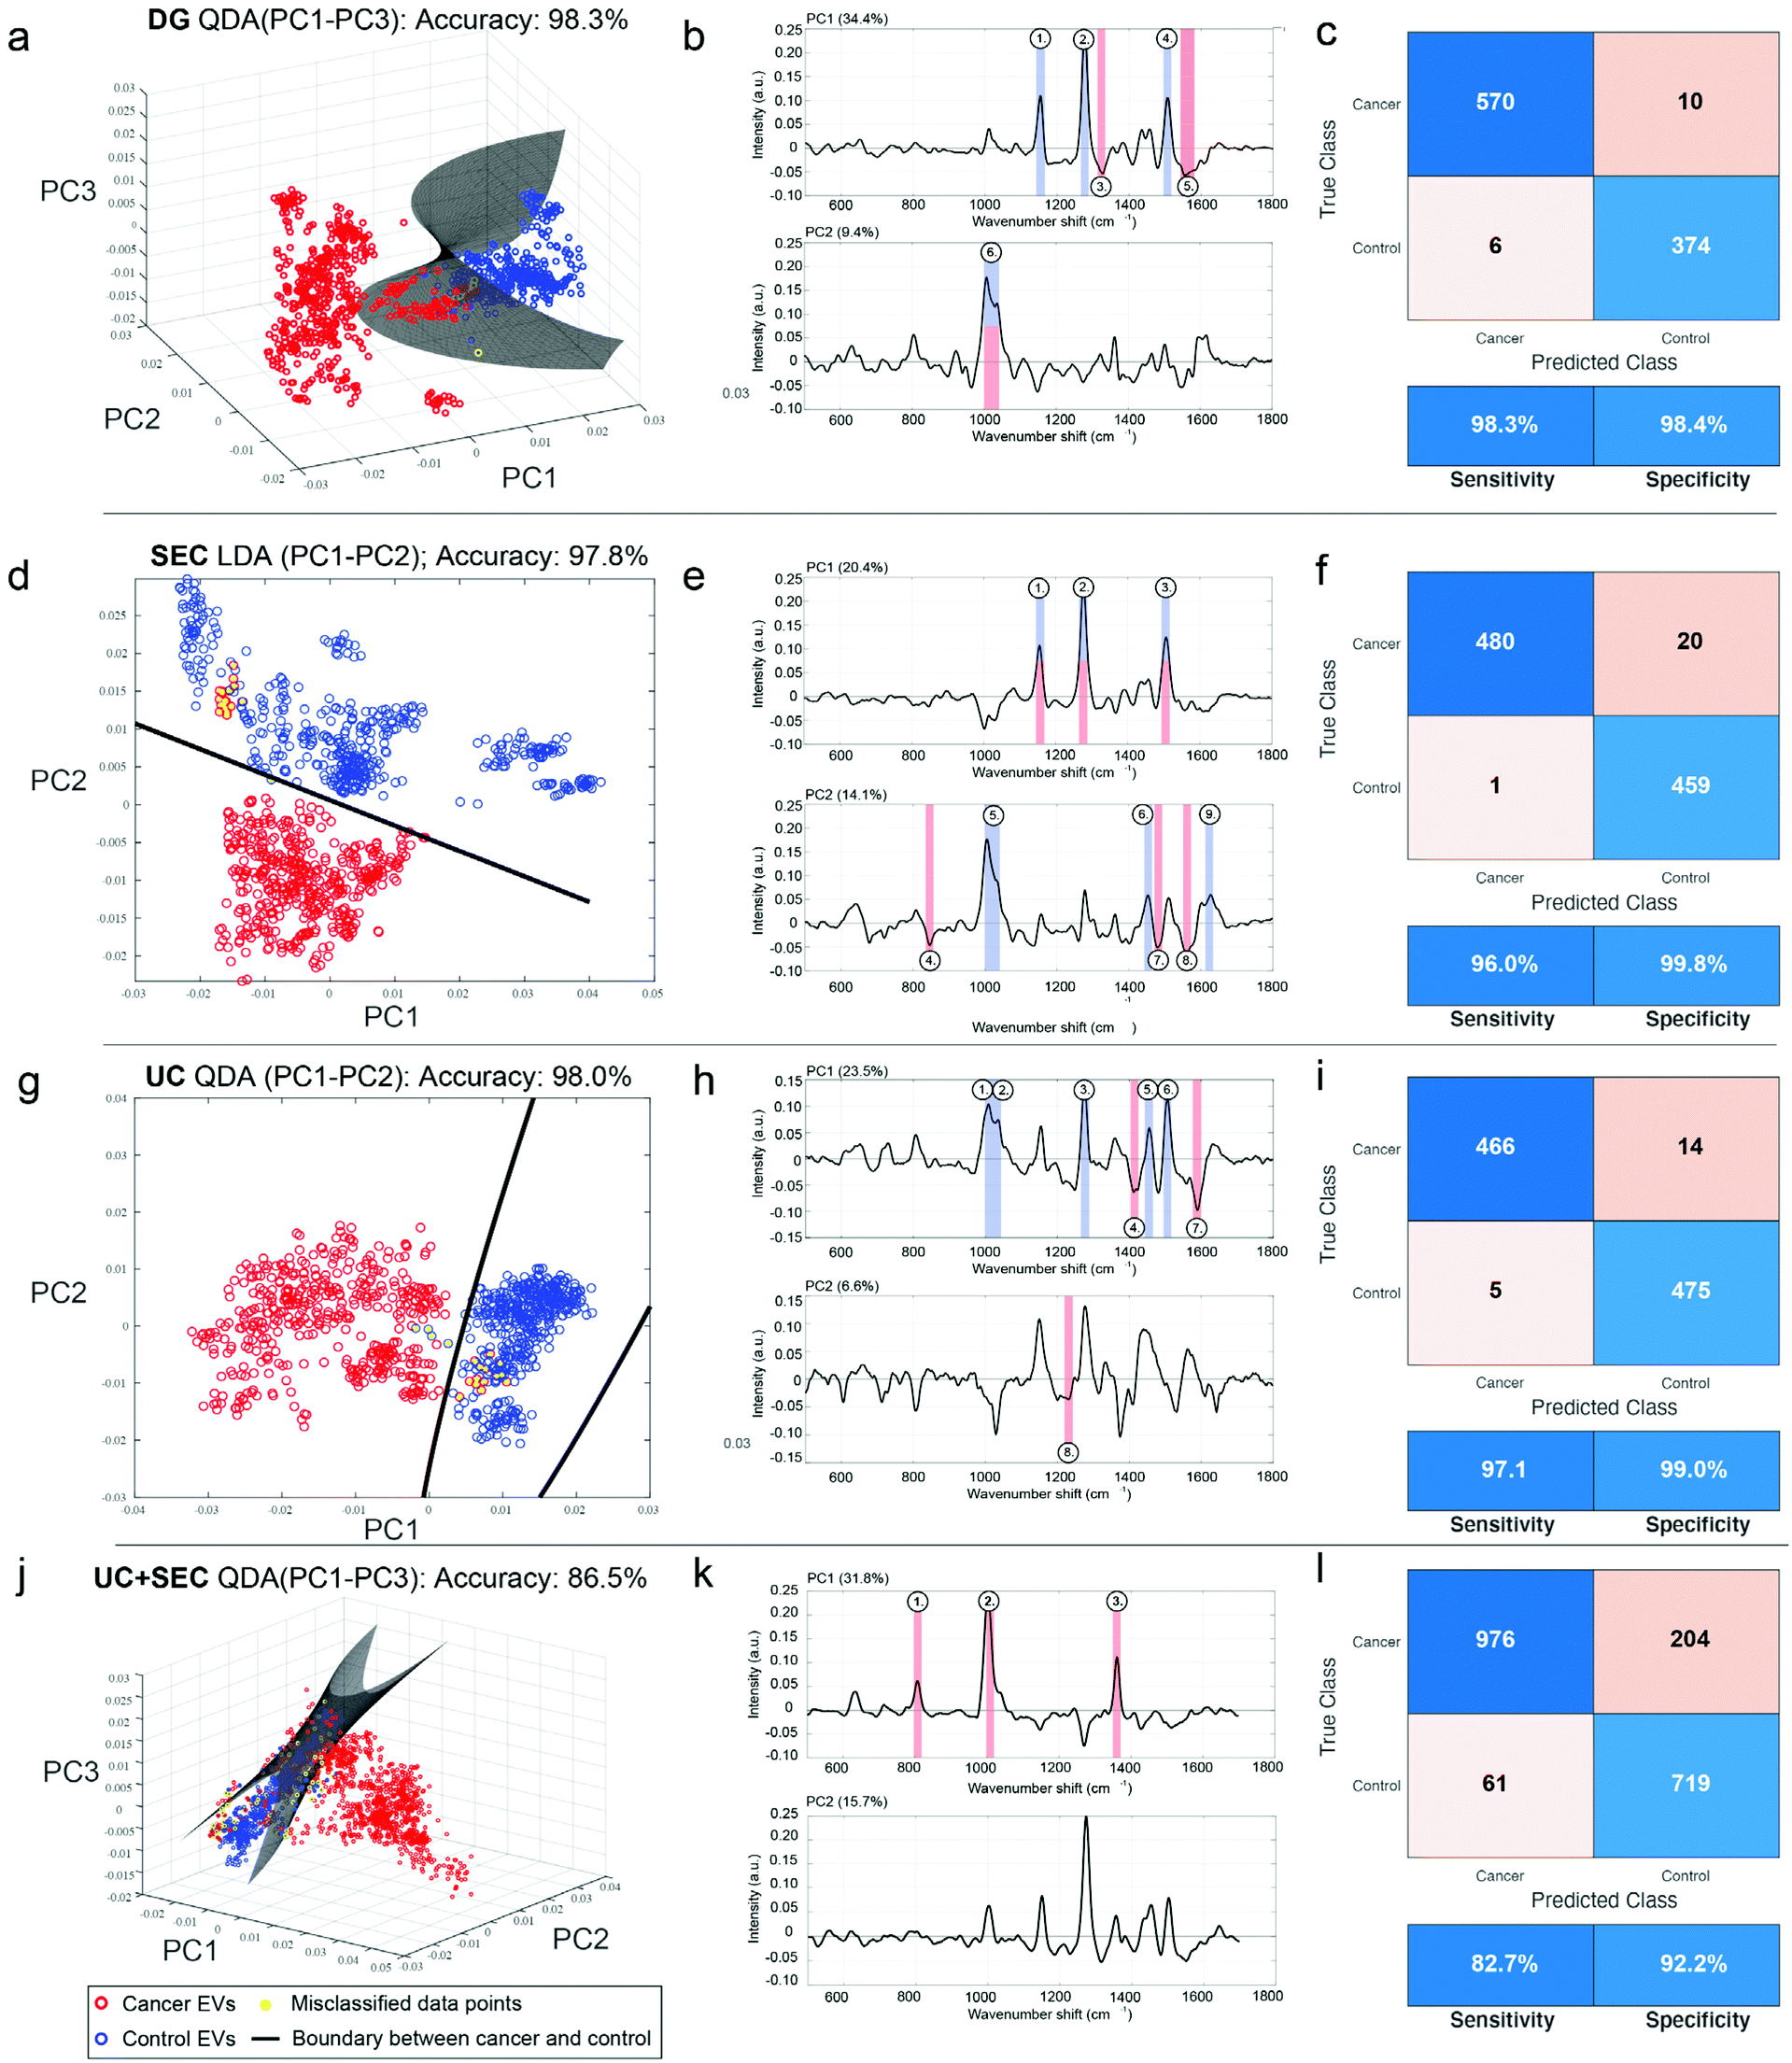 | ||
| Fig. 7 ML classification of SERS spectra shows accuracy is largely unaffected by EV isolation methodology. EVs isolated from head and neck cancer patients (red circles) and non-cancerous control patients (blue circles) either by DG (a–c), SEC (d–f), UC (g–i), or UC + SEC (j–l) were measured using the developed SERS assay. (a, d, g and j) Following PC analysis, various machine learning classification approaches were tested; shown is the best performing classifier for each isolation type in terms of overall accuracy, either using LDA or QDA, and testing over the first two or three PCs. Decision boundaries are shown as lines (a and b) or as a hyperplane (c and d) depending on the dimensions of best fit. (b, e, h and k) Loadings for the first two PCs, including annotated peaks corresponding to ESI Fig. 2,† highlighting the driving factors for discriminating cancer features. (c, f, I and l) Confusion matrices and performance metrics derived from the ML analysis, including sensitivity and specificity. | ||
DG, SEC, and UC single isolations all resulted in practically equivalent accuracies of 98.3%, 97.8%, and 98.0%, respectively. Yet the same model was not used for each. DG and UC were most successful with a QDA model, while SEC performed better with an LDA model. In each of the isolation methods, the inclusion of a third PC made only a slight difference (ESI Table 2†). Notably, the combination of UC + SEC, which in principle would result in a more highly purified sample, performed much worse than either of the individual methods, with accuracies ranging from 85%–86.5% across the model classifiers. For the three individual isolation methods, each of the tested four models (PCA-LDA with PC1–PC2, PC-LDA with PC1–PC3, PCA-QDA with PC1–PC2, and PCA-QDA with PC1–PC3) demonstrated robustness to detect cancer and diagnose various types of head and neck cancers adequately. According to our analyses, the DG method using PCA-QDA with PC1–PC3 stood out as the most accurate (98.3%) and sensitive (98.3%) isolation procedure. DGA with PCA-LDA using either the first two or three PCs had 100% specificity (ESI Table 2†).
ESI Fig. 2† provides additional insight into the chemical groups driving the separation of cancer and non-cancer samples. In those spectra, particular chemical features are annotated that distinguish between the two cohorts, while virtually equal peaks/band regions between cancer and non-cancer samples were excluded. The band in the 1000–1040 cm−1 area is very active across all the isolation methods; this specifically stands out among the non-cancer control samples. As this region can be associated to e.g., symmetric ring breathing in phenylalanine and/or CH2CH3 bending in lipids, it is conceivable that these chemical features are diminished in EVs originating from cancerous cells. Another possibility is that the total vesiculome in a cancer burdened system may undergo metabolic changes resulting in discernible EV representation. In UC + SEC isolation approach, however, the control samples have less of the 1000–1040 cm−1 properties and are correspondingly weaker at discerning between cancer and non-cancer samples. While the explicit interpretation for this observation remains unclear, this example highlights the benefits of the developed SERS method being relatively consistent across single isolation methods, and dropping slightly for combined UC + SEC.
The 1500–1515 cm−1 region is also prominent in all control samples isolated by DG, SEC, and UC, but absent in both control and cancerous UC + SEC samples. Predominantly attributed to the vibrational modes from CC conjugations, we foresee similar tendency to the 1000–1040 cm−1 region, the chemical composition of EVs experiences changes in the diseased state. This may suggest that the unsaturated double bonds in various chemical structures become decimated by the acidic and hypoxic microenvironments of tumor cells. On the other hand, cancerous samples isolated by DG, SEC and UC share chemical features reported by the region 1540–1580 cm−1. Within this region, there exists majorly protein-related signatures such as tryptophan and amide II vibrations. Again, it is a persistent finding regardless across the single isolation methods and possibly reports on the altered protein content of cancerous EVs.
DG (control) and SEC (control and cancerous) samples are mutually characterized by the region 1140–1160 cm−1 that can be assigned to multiple plausible structures: C–C vibrations in lipids, C–N amide bonds in proteins, or carotenoids. Similarly, control samples isolated by SEC and UC have mutual spectral features at 1445–1465 cm−1, which is an established marker area for CH rocking in lipids and CH2/CH3 vibrations in lipids and proteins. These represent further examples whereby chemical changes between cancerous and control samples can be observed over different isolation platforms.
The most unique spectral feature that differentiates cancerous DG samples from the controls is the region at 1540–1580 cm−1 mainly reporting on proteins such as tryptophan and amide II vibrations. For SEC, the ranges 840–855 cm−1 (nucleic acids and e.g., ring deformation in tyrosine) and 1550–1570 cm−1 (tryptophan, amide II) discern cancerous samples from the controls. The SEC isolated samples have the most spectral areas in common. For UC, the regions 1405–1415 cm−1 (CH rocking in lipids) and 1580–1600 cm−1 (amide II and nucleic acids) separate cancerous samples from the non-cancer controls. Taken together, overall diagnostic performance is largely very high across single isolation methods, the chemical differences driving each separation are not the same.
Given the success of the performance for SEC isolation, we wished to test the reproducibility of this method in a new patient cohort collected at a later time. We collected plasma from 23 new subjects, including 16 from head and neck cancer and 7 controls. We repeated the SEC isolation and SERS assay (Fig. 8). With PCA-QDA on the first 4 PCs, we measured an accuracy of 87%, specificity of 70%, and sensitivity of 100%. Of the 23 new patients, only 3 were misclassified using this approach. While the performance decreased some amount compared to the training set above, it remains encouraging that the assay could perform well in a different dataset of new patients collected a different time but subjected to the same procedures.
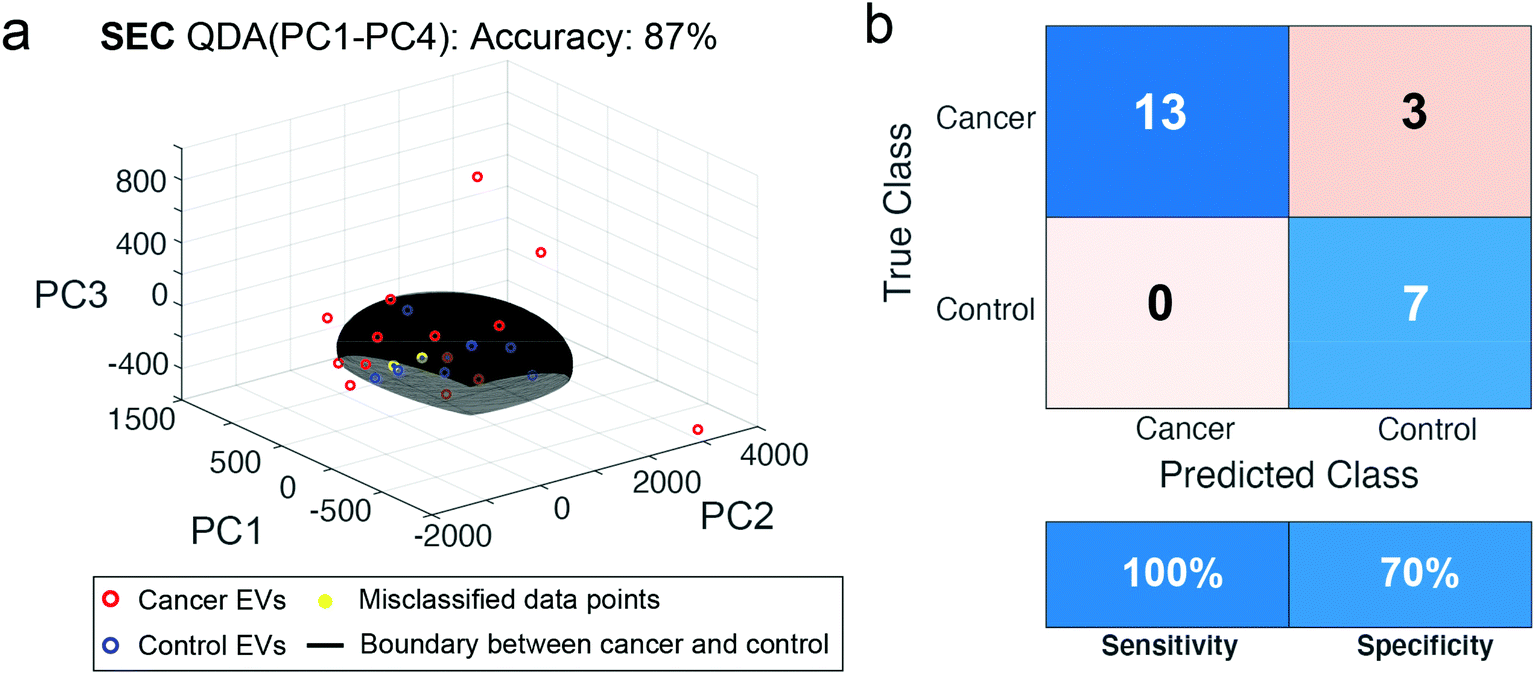 | ||
| Fig. 8 ML classification of SEC isolated samples from a test training cohort of HNC patients. In a new, larger patient cohort of 23 samples, EVs were isolated from 16 head and neck cancer patients (red circles) and 7 non-cancerous control patients (blue circles) by SEC and measured using the developed SERS assay. (a) The best classifier with 87% accuracy was the PCA-QDA with decision boundary shown as a hyperplane. (b) Confusion matrix and performance metrics derived from the ML analysis indicate a sensitivity of 100% and specificity of 70%. | ||
Discussion
Many studies employing EVs isolated from cell culture supernatant lack the additional biomolecules that exist within complex biofluids. The influence of these additional molecules and their assemblies could have important consequences in therapeutic and diagnostic EV research. Particularly when it comes to dosing studies, it is vital to know how many EVs are present versus other co-isolated biomolecules. Moreover, the diagnostic capabilities of an EV-based assay might even benefit from the additional information the co-isolated specimen can provide. Yet in many basic research settings, having a pure EV sample is the most beneficial for better understanding the fundamental biological functions and chemical structures of EVs. Moreover, modern drug discovery endeavors are increasingly aimed towards developing safe and effective EV nanoformulations for targeted therapies. Robustly producing highly pure EV preparations and assessing their level of purity, e.g., by SERS, are the cornerstones of such developmental steps. We show here that lipoprotein is co-isolated with EVs to various extent based on isolation methodology, which can be assessed using a label-free spectroscopic approach. The use of a combination of both density and sized-based isolation techniques would logically provide a purer EV population, but we found that in that case, diagnostic sensitivity is decreased in this cohort of patients. The main originality of this work is of interest to the EV community, for which a central problem is to address the extent of lipoprotein contamination in a given EV prep. We show for the first time that a plasmonic label-free SERS assay can in fact be used to assess specific lipoprotein subspecies contamination amongst EVs, and found supporting evidence that various lipoproteins are contaminating various preps. To the best of our knowledge, no such study has compared across EV isolation methods and lipoprotein contamination to discuss diagnostic accuracy of a SERS based assay.Notably, the ML classifiers used here are minimally prone to observer-dependencies, inter- and intra-observer variabilities, and are operator-friendly for various types of classification schemes involving large spectral data sets. Overall, the performance of different ML strategies is predominantly dependent on the data structure. Methods such as support vector machines (SVM) or learning vector quantization (LVQ) can be susceptible to overfitting for normally or multi-normally distributed data whilst conceivably performing better for more complex data structures. Signal analysis by PCA followed by LDA has been successfully applied to discriminate EVs in previous work.73,74 In this limited dataset, LDA and QDA each performed better in some cases, and worse in others, suggesting that there is not a one-size-fits-all solution. Ultimately, while the first two PCs are the ones plotted here for ease of data presentation, we used the information for the first several PCs even beyond those two in the downstream LDA/QDA analysis. For example, in determining the accuracy and other descriptive statistics for the clinical studies, we tested models for every combination of the first 5 PCs, which taken together typically represented more than 85% of the total sample variance in each clinical dataset. Yet it was often some combination of the first 3 to 4 PCs that gave the highest degree of accuracy in binary classification between cancer and control, thus were presented as such herein. In summary, we present only the portion of variance in the total data that drove the clinical differences, regardless of the specific percentage. Our future emphasis will be integrating several ML approaches into one overarching evaluation and comparing their capabilities in real clinical settings.
One notable feature of this study is the ability to carry out such an extensive comparison between isolation methods on reasonable volumes of clinical biofluids. The sample input volumes for many contemporary EV characterization methods, including proteomics and genomics analysis, electron microscopy, and western blot, preclude its use in testing multiple isolation methods on a single clinical sample for downstream characterization. Therefore, many studies focus solely on EV samples derived from cell culture supernatant, limiting their clinical relevance. SERS, on the other hand, requires less than a few microliters of sample volume per measurement, permitting its applicability in such a comparison study and in clinical diagnostics platforms at large.
However, some limitations and caveats for these results remain. A shortcoming of this study is the lack of comparison across multiple types of SERS substrates, primarily due to the low yields of precious clinical sample materials obtained for the experiments. It is widely accepted that SERS signals are dependent on the surface material and topography, with different combinations materials and geometries yielding differently enhanced vibrational modes.75 Also, the laser wavelength and power used can affect the acquired spectra. All of these can contribute to the acquired signals either alone or in combination. Comparative cross-substrate SERS studies have been implemented to shed light onto the feasibility and generalizability of SERS over several types of substrates,76–78 clearly demonstrating that there are differences in analytical performance between SERS substrates. Future studies exploring complex biological samples instead of single analytes are clearly warranted to unveil whether any given SERS sensor type can be used for EV-based cancer diagnostics. It is likely that our choice of substrate material and geometry are affecting the overall results. Furthermore, we analyzed a small and focused dataset from a specific family of cancers (head and neck), and it is not clear how generalizable our finds are to other cancers and disease types. Since there does not exist a general cancer biomarker for EVs or head and neck cancer, we could not verify the diagnostic sensitivity of our test via standard EV assays like western blotting or ELISA. Yet we perceive this as a major advantage of SERS, which provides rich chemical information via a label-free assay, thus SERS spectrum itself can be considered as a viable biomarker. Also, there are many other types of contaminants besides lipoprotein in human biofluids that can pollute SERS spectra, whose influence will need to be investigated in future studies. We showed that a dual isolation method can successfully remove lipoprotein present in the clinical samples, but in some case, lipoproteins can contribute to diagnostic information about an individual's disease state, thus are not always undesirable. In any case, the SERS platform provides enough accuracy to not be majorly influenced by contamination of differential combinations of lipoprotein, indicating that clinical samples may not need to be subjected to rigorous isolation procedures for input into diagnostic platforms. Yet for such application, it is true that challenges remain, given that the SERS process itself if is inherently highly variable, with noted reproducibility issues and a high degree of user experience needed to analyze data. Beyond that, scaling up production of SERS substrates is challenging, often requiring expensive lithography equipment to ensure consistent signal acquisition. Future projects will focus on expanding to greater numbers of clinical samples and variety of cancers, examining the diagnostic influence of additional biomolecules beyond lipoproteins present in EV preps, and automating the SERS measurement process for successful implementation in a clinical setting.
Conclusion
Here we have conducted a study using label-free and non-destructive SERS measurements to assess the level of lipoprotein contamination across clinical samples isolated in several ways. We found that the type of lipoproteins co-isolated with a given EV preparation varied depending upon the technique that was used. EVs isolated by SEC grouped more consistently at the same locations as chylomicrons and VLDL/LDL, while EVs isolated by UC and DG shared more overlap with each other and HDL, indicative of their relative extent of contamination by those lipoprotein types. A protocol of subsequent UC and SEC largely eliminated lipoprotein contamination as shown by PC analysis of SERS spectra. Therefore, if striving for purer EV samples to use in research experiments, a dual isolation method may be the most effective at removing these distinct contaminating components. We also devised four different ML approaches to evaluate the cancer detection and diagnostics capabilities of the studied SERS platform. In terms of cancer detection, neither the isolation method used, nor the ML model greatly affected the sensitivity and specificity to distinguish between cancerous and noncancerous samples, which in most cases was greater than 97%. In terms of cancer diagnostics, the best overall performance (accuracy = 98.3%) was achieved using the DG isolation method and a PCA-QDA discriminant classifier with PC1–PC3 scores as input features. However, SEC and UC isolations also achieved accuracies of 97.8% and 98%, respectively. Taken together, our SERS platform was sensitive enough to tease out cancer-specific signatures that remained unaffected by the presence of additional co-isolated biomolecules, showing that the label free diagnostic ability was effective across many different sample preparations.Materials and methods
Materials
All chemicals and reagents were purchased from Millipore Sigma and used as-is unless otherwise noted. Analytical standards of chylomicrons, VLDL, LDL, and HDL isolated from human plasma were obtained as lyophilized powders and resuspended in ultrapure water (Elga) at concentrations of 10 mg mL−1.Cell culture
SKOV-3 cells were seeded at low passage numbers and expanded in McCoy's 5A media + 10% FBS + 1% Penicillin–streptomycin. Approximately 2.5 × 10⁷ live cells were passaged and seeded into the cell compartment of a CELLine AD 1000 Bioreactor in 15 mL of the previously described media. 1 L of McCoy's 5A media + 1% penicillin–streptomycin was added to the media compartment. After 48, the cell compartment media was replaced with 15 mL of EV depleted media, which was centrifuged in advance at 120000g overnight to remove bovine EVs from FBS. Conditioned media from the cell compartment was then collected and the media in both compartments was replaced every 7 days.
Clinical biofluid collection and processing
Patients were consented to blood draws during scheduled head and neck cancer surgeries in the University of California, Davis Department of Otolaryngology [IRB #: 930499-8]. Within a few hours following blood collection in EDTA-coated lavender-topped tubes, samples were spun at 2000g for 5 min to separate plasma from red blood cells and platelets. For each patient sample, ∼2 mL of plasma was pipetted out of the collection tube and spun at 300g for 10 min to pellet additional large cellular debris. Supernatant was collected and spun at 2000g for 15 min to clear larger aggregates. Supernatant was again collected and spun an additional time at 10000g for 30 min to clear out the remaining cell debris. The resulting supernatant, referred to hereafter as “pre-cleared plasma” was collected and aliquoted for subsequent EV isolation.
Isolation and preparation of EVs
For UC isolation, 1 mL of pre-cleared plasma was centrifuged at 120000g for 70 min at 4 °C using a TLS 55 rotor and Optima TLX Ultracentrifuge (Beckman Coulter). Supernatant was discarded, and the pellet was resuspended in 1 mL ultrapure water and ultracentrifuged again using the same parameters. Supernatant was once again discarded, and the pellet resuspended to a final volume of 100 μL of ultrapure water. These reconstituted pellets were stored at −80 °C for up to 3 months or until needed for downstream experiments.
For DG isolation, 200 μL of pre-cleared plasma was layered on to a 5%–40% discontinuous iodixanol (OptiPrep, or OP) gradient. The OP layers were prepared by diluting 60% OP in varying volumes of a stock solution containing 850 g of 0.25 M Sucrose, 200 μL of 1 mM EDTA, and 500 μL of 10 mM Tris-HCL (pH-7.4). Gradients were prepared in layers in Thinwall Polypropylene Tubes (Beckman Coulter) using 3 mL syringes with 26-gauge stainless steel needles. Each layer was filled from the bottom of the tube, starting from light to heavy, 3 mL of 5% OP, 3 mL of 10% OP, 3 mL of 20% OP, 3 mL of 40% OP, and 1 mL of sample for a total of 13 mL. Following sample loading, gradients were spun at 100000g at 4 °C for 24 h using an SW 41 Ti Swinging-Bucket Rotor and an Optima LE-80 K ultracentrifuge (Beckman Coulter). The samples were manually fractionated from the bottom, with a total of thirteen 1 mL fractions collected per tube. Each fraction was additionally centrifuged to remove the remaining iodixanol. For this, 500 μL of each fraction was pipetted into an Amicon Ultra-0.5 mL centrifugal filter with 100 K MWCO and spun at 14000g at 4 °C for 5 min using a Microfuge 20R (Beckman Coulter). 400 μL of PBS was added to each filter and then spun again for 5 min (this washing repeated 3 times in total). The filters were then inverted inside fresh tubes and spun 1000g at 4 °C for 2 min. Collected solutions of ∼60 μL were stored at −80 °C.
For SEC isolation, we used an Automatic Fraction Collector (AFC) and pre-formed size exclusion columns (qEV70, Izon Science). Thirteen 1.5 mL Eppendorf tubes were loaded into the AFC carousel and a single qEV70 column was inserted into the mount. The column was flushed with 4 mL of filtered PBS buffer at room temperature. After the column was flushed, excess buffer was removed from the top of the column using a 10 μL pipette. 150 μL of the pre-cleared plasma was loaded on the column and fraction collection started. Once the sample reached the upper frit of the column, it was topped off with 4 mL of PBS buffer. After the void collection was complete, the machine collected 200 μL of each fraction. Fractions 1–3 were pooled, and the resulting solution was concentrated using Amicon Ultra 0.5 mL centrifugal filters to a final volume of 100 μL and stored at −80 °C for maximally 5 days before following experiments were run.
Nanoparticle tracking analysis (NTA)
Sample particle concentrations and size distributions were measured using a NanoSight LM10 (Malvern Panalytical) equipped with a 405 nm blue laser and sCMOS camera. 1000-fold dilutions of EV isolates prepared as described above where thawed. Ultrapure water used to prepare dilutions was filtered through pre-wet 0.1 μm Nylon syringe filters (Whatman) immediately prior to measurement. Filtered ultrapure water was also used to flush the NTA chamber and tubing before sample addition to ensure contamination was minimized during measurement. 1 mL of each diluted sample was loaded into a syringe and placed on an automatic syringe pump for injection. Data was recorded as three 30 s videos containing a minimum of 200 particle tracks per video, recorded at camera level 12. NTA 3.1 software was used to analyze the data and track the Brownian motion of the individual particles recorded. Subsequently the software calculated hydrodynamic diameters (nm) of the tracked particles using the Einstein-Stokes relation, and the count-based concentrations (particles per mL) are simultaneously obtained as the number of particles and volume of the sample chamber are known.Protein concentration measurement
Total protein concentration for each sample was measured with a BCA assay (Pierce BCA Protein Assay Kit, ThermoFisher Scientific) following the manufacturer's instructions. 15 μL of EV stock was mixed with 8 μL of RIPA buffer and 57 μL ultrapure water then vortexed briefly and incubated on ice for 30 min prior to starting on the assay instructions.SERS acquisition and processing
SERS nanogold substrates (Ocean Insight) were first prepared by pipetting 10 μL of 20 mM cysteamine in 95% ethanol onto the surface. After 1 h incubation, substrates were washed by dipping into an Eppendorf tube containing ultrapure water and 100-fold dilutions of EV samples in ultrapure water were prepared. 40 μL of this solution were pipetted onto the substrates and incubated at room temperature for 2 h. The substrates were then washed three times by briefly dipping into Eppendorf tubes containing ultrapure water. Washed substrates were inverted onto #1.5 glass coverslips for SERS measurements.Spectra were acquired using a custom-built inverted Raman scanning confocal microscope with excitation wavelength of 785 nm and a 60×, 1.2 NA water immersion objective on an inverted IX73 Olympus microscope. An Andor Kymera-3281-C spectrophotometer and Newton DU920P-BR-DD CCD camera were used for Raman spectra capture and Solis v4.31.30005.0 software was used for initial processing. For measurements, exposure time was 1 s per scan with laser power of 5 mW. Substrates were randomly sampled across 5–10 SERS-active regions, with at least 100 spectra collected at each spot.
Analysis of the spectral data was performed using MATLAB v2020a (MathWorks, MA, USA) via a custom script. Cropping, penalized least-squares (PLS) background correction,79 smoothing,80 and unit normalization were applied for spectral pre-processing. Spectra were subjected to PCA and LDA/QDA based on the corresponding MATLAB built-in functions applied to a custom script.
Electron microscopy
For transmission electron microscopy (TEM) of EV isolates, negative staining was carried out as previously described without modification.52 Scanning electron microscopy (SEM) micrographs of SERS substrates before and after incubation with EVs were acquired using a ThermoFisher Quattro S (ThermoFisher Scientific, Waltham, MA, USA). Secondary electron scattering from the surface was detected using an Everhart–Thornley detector (ETD), and the backscattered electrons were detected with an annular backscattered (ABS) detector. Before imaging, the substrates were treated with EVs as described above. For the SEM sample preparation, the pre-treated substrates were first placed in a 12-well plate the SERS active surface facing up, simultaneously avoiding drying. The substrates were then washed thoroughly 2 times with sodium phosphate buffered solution (PBS), sequentially submerged for 15 min in glutaraldehyde, and finally in osmium tetroxide for in 15 min (no washing between the steps). Consequently, a graded series of ethanol (EtOH) solutions were used to dehydrate the samples as follows: 30% (5 min), 50% (5 min), 70% (5 min), 95% (2 × 5 min), and 100% (2 × 5 min). As the last step of sample preparation, the substrates were allowed to dry overnight in a fume hood. For imaging, the substrates were mounted on metal studs using two-sided carbon tape. The typical imaging parameters were working distance 10.0–13.5 mm, spot size 3.0, accelerating voltage 10.00 kV, chamber pressure 100 Pa.Live subject statement
Patients were consented to blood draws during scheduled head and neck cancer surgeries in the University of California, Davis Department of Otolaryngology. All experiments were performed in accordance with a protocol approved by the UC Davis IRB committee (IRB #: 930499-8). Informed consent was obtained for all patients.Data availability
The datasets generated during and/or analyzed during the current study are available in a Zenodo repository with the identifier doi:10.5281/zenodo.5250044. MATLAB code used to process datasets generated and/or analyzed during the current study are available from the corresponding author on request.Author contributions
H. J. K. contributed to the design of the study, the bulk of the data acquisition and analysis, and drafted the work. T. R. contributed to the substantial revisions to the document and analysis and interpretation of data. A. P. contributed EV sample isolation and analysis. D. P. contributed creation of MATLAB software to analyze the data. R. R. M. contributed EV characterization and data analysis. A. B. contributed collection and annotation of clinical samples. R. P. C. contributed to the conception and design of the work, software developed used in the work, and made substantial revisions to the text.Conflicts of interest
The authors declare no competing interests.Acknowledgements
This work was supported by funds from the UC Davis Comprehensive Cancer Center, the UC Davis Center for Data Science and Artificial Intelligence Research (CeDAR), the Ovarian Cancer Education and Research Network, Inc. (OCERN), and the NIH NCI (R01CA241666). A. B. acknowledges support from the NIH K12 (5K12CA138464-10). R. P. C. was supported by a Research Scholar Grant, RSG-19-116-01-CDD, from the American Cancer Society. T. R. gratefully acknowledges The Sigrid Juselius Foundation, Helsinki, Finland. Specimens were provided by the UC Davis Pathology Biorepository which is jointly funded by the UC Davis Comprehensive Cancer Center Support Grant (CCSG) awarded by the National Cancer Institute (NCI P30CA093373) and the UC Davis Department of Pathology and Laboratory Medicine. The ThermoFisher Quattro ESEM was funded through the US National Science Foundation under award DMR-1725618.References
- M. Mathieu, L. Martin-Jaular, G. Lavieu and C. Théry, Specificities of secretion and uptake of exosomes and other extracellular vesicles for cell-to-cell communication, Nat. Cell Biol., 2019, 21, 9–17 CrossRef CAS PubMed.
- C. Théry, et al., Minimal information for studies of extracellular vesicles 2018 (MISEV2018): a position statement of the International Society for Extracellular Vesicles and update of the MISEV2014 guidelines, J. Extracell. Vesicles, 2018, 7, 1535750 CrossRef PubMed.
- T. Vagner, et al., Protein Composition Reflects Extracellular Vesicle Heterogeneity, Proteomics, 2019, 19, 1800167 CrossRef PubMed.
- M. Salih, R. Zietse and E. J. Hoorn, Urinary extracellular vesicles and the kidney: biomarkers and beyond, Am. J. Physiol. Renal Physiol., 2014, 306, F1251–F1259 CrossRef CAS PubMed.
- S. Klein-Scory, et al., New insights in the composition of extracellular vesicles from pancreatic cancer cells: implications for biomarkers and functions, Proteome Sci., 2014, 12, 50 CrossRef PubMed.
- L. Sadovska, J. Eglitis and A. Line, Extracellular vesicles as biomarkers and therapeutic targets in breast cancer, Anticancer Res., 2015, 35, 6379–6390 CAS.
- M. Nawaz, et al., Extracellular vesicles in ovarian cancer: applications to tumor biology, immunotherapy and biomarker discovery, Expert Rev. Proteomics, 2016, 13, 395–409 CrossRef CAS PubMed.
- P. G. Moon, et al., Identification of developmental endothelial locus-1 on circulating extracellular vesicles as a novel biomarker for early breast cancer detection, Clin. Cancer Res., 2016, 22, 1757–1766 CrossRef CAS PubMed.
- L. Vella, A. Hill and L. Cheng, Focus on Extracellular Vesicles: Exosomes and Their Role in Protein Trafficking and Biomarker Potential in Alzheimer's and Parkinson's Disease, Int. J. Mol. Sci., 2016, 17, 173 CrossRef PubMed.
- G. Szabo and F. Momen-Heravi, Extracellular vesicles in liver disease and potential as biomarkers and therapeutic targets, Nat. Rev. Gastroenterol. Hepatol., 2017, 14, 455–466 CrossRef CAS PubMed.
- A. Gámez-Valero, S. I. Lozano-Ramos, I. Bancu, R. Lauzurica-Valdemoros and F. E. Borràs, Urinary extracellular vesicles as source of biomarkers in kidney diseases, Front. Immunol., 2015, 6, 6 Search PubMed.
- T. A. P. Driedonks and E. N. M. Nolte-T'Hoen, Circulating Y-RNAs in extracellular vesicles and ribonucleoprotein complexes; Implications for the immune system, Front. Immunol., 2019, 9, 3164 CrossRef PubMed.
- E. N. Hoen, T. Cremer, R. C. Gallo and L. B. Margolis, Extracellular vesicles and viruses: Are they close relatives?, Proc. Natl. Acad. Sci. U. S. A., 2016, 113, 9155–9161 CrossRef PubMed.
- Z. Onódi, et al., Isolation of High-Purity Extracellular Vesicles by the Combination of Iodixanol Density Gradient Ultracentrifugation and Bind-Elute Chromatography From Blood Plasma, Front. Physiol., 2018, 9, 1479 CrossRef PubMed.
- J. B. Simonsen, What are we looking at? Extracellular vesicles, lipoproteins, or both?, Circ. Res., 2017, 121, 920–922 CrossRef CAS PubMed.
- B. W. Sódar, et al., Low-density lipoprotein mimics blood plasma-derived exosomes and microvesicles during isolation and detection, Sci. Rep., 2016, 6, 24316 CrossRef PubMed.
- J. Webber and A. Clayton, How pure are your vesicles?, J. Extracell. Vesicles, 2013, 2, 19861 CrossRef PubMed.
- N. Karimi, et al., Detailed analysis of the plasma extracellular vesicle proteome after separation from lipoproteins, Cell. Mol. Life Sci., 2018, 75, 2873–2886 CrossRef CAS PubMed.
- Y. Yuana, J. Levels, A. Grootemaat, A. Sturk and R. Nieuwland, Co-isolation of extracellular vesicles and high-density lipoproteins using density gradient ultracentrifugation, J. Extracell. Vesicles, 2014, 3, 23262 CrossRef PubMed.
- P. D. Robbins, Extracellular vesicles and aging, Stem Cell Invest., 2017, 4, 98–98 CrossRef.
- E. H. Koritzinsky, et al., Circadian variation in the release of small extracellular vesicles can be normalized by vesicle number or TSG101, Am. J. Physiol. Renal Physiol., 2019, 317, F1098–F1110 CrossRef PubMed.
- C. Frühbeis, S. Helmig, S. Tug, P. Simon and E.-M. Krämer-Albers, Physical exercise induces rapid release of small extracellular vesicles into the circulation, J. Extracell. Vesicles, 2015, 4, 28239 CrossRef PubMed.
- Q. Fu, et al., Hepatocytes derived extracellular vesicles from high-fat diet induced obese mice modulate genes expression and proliferation of islet β cells, Biochem. Biophys. Res. Commun., 2019, 516, 1159–1166 CrossRef CAS PubMed.
- K. R. Feingold and C. Grunfeld, Introduction to Lipids and Lipoproteins, Endotext, 2000 Search PubMed.
- T. Baranyai, et al., Isolation of exosomes from blood plasma: Qualitative and quantitative comparison of ultracentrifugation and size exclusion chromatography methods, PLoS One, 2015, 10(12), e0145686 CrossRef PubMed.
- R. J. Lobb, et al., Optimized exosome isolation protocol for cell culture supernatant and human plasma, J. Extracell. Vesicles, 2015, 4, 27031 CrossRef PubMed.
- A. Bobrie, M. Colombo, S. Krumeich, G. Raposo and C. Théry, Diverse subpopulations of vesicles secreted by different intracellular mechanisms are present in exosome preparations obtained by differential ultracentrifugation, J. Extracell. Vesicles, 2012, 1, 18397 CrossRef CAS PubMed.
- M. I. Zonneveld, et al., Recovery of extracellular vesicles from human breast milk is influenced by sample collection and vesicle isolation procedures, J. Extracell. Vesicles, 2014, 3, 24215 CrossRef.
- A. Cvjetkovic, J. Lötvall and C. Lässer, The influence of rotor type and centrifugation time on the yield and purity of extracellular vesicles, J. Extracell. Vesicles, 2014, 3, 23111 CrossRef PubMed.
- A. N. Böing, et al., Single-step isolation of extracellular vesicles by size-exclusion chromatography, J. Extracell. Vesicles, 2014, 3, 23430 CrossRef PubMed.
- A. Gámez-Valero, et al., Size-Exclusion Chromatography-based isolation minimally alters Extracellular Vesicles’ characteristics compared to precipitating agents, Sci. Rep., 2016, 6, 33641 CrossRef PubMed.
- E. A. Mol, M.-J. Goumans, P. A. Doevendans, J. P. G. Sluijter and P. Vader, Higher functionality of extracellular vesicles isolated using size-exclusion chromatography compared to ultracentrifugation, Nanomedicine, 2017, 13, 2061–2065 CrossRef CAS PubMed.
- J. W. Chan, D. Motton, J. C. Rutledge, N. L. Keim and T. Huser, Raman Spectroscopic Analysis of Biochemical Changes in Individual Triglyceride-Rich Lipoproteins in the Pre- and Postprandial State, Anal. Chem., 2005, 77, 5870–5876 CrossRef CAS PubMed.
- X. Li, Spectral analysis of human saliva for detection of lung cancer using surface-enhanced Raman spectroscopy, J. Biomed. Opt., 2012, 17, 037003 CrossRef PubMed.
- M. Y. Sha, H. Xu, M. J. Natan and R. Cromer, Surface-Enhanced Raman Scattering Tags for Rapid and Homogeneous Detection of Circulating Tumor Cells in the Presence of Human Whole Blood, J. Am. Chem. Soc., 2008, 130, 17214–17215 CrossRef CAS PubMed.
- S. Feng, et al., Nasopharyngeal cancer detection based on blood plasma surface-enhanced Raman spectroscopy and multivariate analysis, Biosens. Bioelectron., 2010, 25, 2414–2419 CrossRef CAS PubMed.
- S. Feng, et al., Blood plasma surface-enhanced Raman spectroscopy for non-invasive optical detection of cervical cancer, Analyst, 2013, 138, 3967–3974 RSC.
- S. Feng, et al., Gastric cancer detection based on blood plasma surface-enhanced Raman spectroscopy excited by polarized laser light, Biosens. Bioelectron., 2011, 26, 3167–3174 CrossRef CAS PubMed.
- K. Kneipp, et al., Surface-Enhanced Raman Spectroscopy in Single Living Cells Using Gold Nanoparticles, Appl. Spectrosc., 2002, 56, 150–154 CrossRef CAS.
- H. Shin, D. Seo and Y. Choi, Extracellular Vesicle Identification Using Label-Free Surface-Enhanced Raman Spectroscopy: Detection and Signal Analysis Strategies, Molecules, 2020, 25(21), 5209 CrossRef CAS PubMed.
- A. Gualerzi, et al., Raman spectroscopy as a quick tool to assess purity of extracellular vesicle preparations and predict their functionality, J. Extracell. Vesicles, 2019, 8, 1568780 CrossRef CAS PubMed.
- D. Mahl, J. Diendorf, W. Meyer-Zaika and M. Epple, Possibilities and limitations of different analytical methods for the size determination of a bimodal dispersion of metallic nanoparticles, Colloids Surf., A, 2011, 377, 386–392 CrossRef CAS.
- R. A. Dragovic, et al., Sizing and phenotyping of cellular vesicles using Nanoparticle Tracking Analysis, Nanomedicine, 2011, 7, 780–788 CrossRef CAS PubMed.
- N. Arraud, et al., Extracellular vesicles from blood plasma: determination of their morphology, size, phenotype and concentration, J. Thromb. Haemostasis, 2014, 12, 614–627 CrossRef CAS PubMed.
- Y. Yuana, et al., Cryo-electron microscopy of extracellular vesicles in fresh plasma, J. Extracell. Vesicles, 2013, 2, 21494 CrossRef PubMed.
- G. G. Daaboul, et al., Digital Detection of Exosomes by Interferometric Imaging, Sci. Rep., 2016, 6, 37246 CrossRef CAS PubMed.
- R. R. Mizenko, et al., Tetraspanin immunocapture phenotypes extracellular vesicles according to biofluid source but may limit identification of multiplexed cancer biomarkers, bioRxiv, 2021, DOI:10.1101/2021.03.02.433595.
- T. Rojalin, et al., Hybrid Nanoplasmonic Porous Biomaterial Scaffold for Liquid Biopsy Diagnostics Using Extracellular Vesicles, ACS Sens., 2020, 5(9), 2820–2833 CrossRef CAS PubMed.
- A. Kudelski and W. Hill, Raman study on the structure of cysteamine monolayers on silver, Langmuir, 1999, 15, 3162–3168 CrossRef CAS.
- Y. Ma, et al., Colorimetric sensing strategy for mercury(II) and melamine utilizing cysteamine-modified gold nanoparticles, Analyst, 2013, 138, 5338–5343 RSC.
- M. C. Deregibus, et al., Charge-based precipitation of extracellular vesicles, Int. J. Mol. Med., 2016, 38, 1359–1366 CrossRef CAS PubMed.
- G. Midekessa, et al., Zeta Potential of Extracellular Vesicles: Toward Understanding the Attributes that Determine Colloidal Stability, ACS Omega, 2020, 5, 16701–16710 CrossRef CAS PubMed.
- J. G. Boucher, T. Nguyen and D. L. Sparks, Lipoprotein electrostatic properties regulate hepatic lipase association and activity, Biochem. Cell Biol., 2007, 85, 696–708 CrossRef CAS PubMed.
- D. L. Sparks and M. Phillips, Quantitative measurement of lipoprotein surface charge by agarose gel electrophoresis, J. Lip. Res., 1992, 33, 123–130 CrossRef CAS.
- A. Ricciardi, et al., Raman spectroscopy characterization of the major classes of plasma lipoproteins, Vib. Spectrosc., 2020, 109, 103073 CrossRef CAS.
- Z. J. Smith, et al., Single exosome study reveals subpopulations distributed among cell lines with variability related to membrane content, J. Extracell. Vesicles, 2015, 4, 28533 CrossRef PubMed.
- R. P. Carney, et al., Targeting Tumor-Associated Exosomes with Integrin-Binding Peptides, Adv. Biosyst., 2017, 1, 1600038 CrossRef PubMed.
- H. Abdi and L. J. Williams, Principal component analysis, Wiley Interdiscip. Rev. Comput. Stat., 2010, 2, 433–459 CrossRef.
- K. Sivashanmugan, et al., Bimetallic nanoplasmonic gap-mode SERS substrate for lung normal and cancer-derived exosomes detection, J. Taiwan Inst. Chem. Eng., 2017, 80, 149–155 CrossRef CAS.
- E. Witkowska, D. Korsak, A. Kowalska, A. Janeczek and A. Kamińska, Strain-level typing and identification of bacteria – a novel approach for SERS active plasmonic nanostructures, Anal. Bioanal. Chem., 2018, 410, 5019–5031 CrossRef CAS PubMed.
- S. Mert, E. Özbek, A. Ötünçtemur and M. Çulha, Kidney tumor staging using surface-enhanced Raman scattering, J. Biomed. Opt., 2015, 20, 047002 CrossRef PubMed.
- K. A. Willets, Surface-enhanced Raman scattering (SERS) for probing internal cellular structure and dynamics, Anal. Bioanal. Chem., 2009, 394, 85–94 CrossRef CAS PubMed.
- S. Stremersch, et al., Identification of Individual Exosome-Like Vesicles by Surface Enhanced Raman Spectroscopy, Small, 2016, 12, 3292–3301 CrossRef CAS PubMed.
- G. Lajos, D. Jancura, P. Miskovsky, J. V. García-Ramos and S. Sanchez-Cortes, Interaction of the Photosensitizer Hypericin with Low-Density Lipoproteins and Phosphatidylcholine: A Surface-Enhanced Raman Scattering and Surface-Enhanced Fluorescence Study, J. Phys. Chem. C, 2009, 113, 7147–7154 CrossRef CAS.
- J. Park, et al., Exosome Classification by Pattern Analysis of Surface-Enhanced Raman Spectroscopy Data for Lung Cancer Diagnosis, Anal. Chem., 2017, 89, 6695–6701 CrossRef CAS PubMed.
- W. Lee, et al., Label-Free Prostate Cancer Detection by Characterization of Extracellular Vesicles Using Raman Spectroscopy, Anal. Chem., 2018, 90, 11290–11296 CrossRef CAS PubMed.
- H. Shin, H. Jeong, J. Park, S. Hong and Y. Choi, Correlation between Cancerous Exosomes and Protein Markers Based on Surface-Enhanced Raman Spectroscopy (SERS) and Principal Component Analysis (PCA), ACS Sens., 2018, 3, 2637–2643 CrossRef CAS.
- S. Lin, L. Quaroni, W. S. White, T. Cotton and G. Chumanov, Localization of carotenoids in plasma low-density lipoproteins studied by surface-enhanced resonance Raman spectroscopy, Biopolymers, 2000, 57, 249–256 CrossRef CAS PubMed.
- M. Tang, et al., Distinguishing Different Cancerous Human Cells by Raman Spectroscopy Based on Discriminant Analysis Methods, Appl. Sci., 2017, 7, 900 CrossRef.
- M.-J. Jeng, et al., Raman Spectroscopy Analysis for Optical Diagnosis of Oral Cancer Detection, J. Clin. Med., 2019, 8, 1313 CrossRef CAS PubMed.
- S. J. Dixon and R. G. Brereton, Comparison of performance of five common classifiers represented as boundary methods: Euclidean Distance to Centroids, Linear Discriminant Analysis, Quadratic Discriminant Analysis, Learning Vector Quantization and Support Vector Machines, as dependent on data structure, Chemom. Intell. Lab. Syst., 2009, 95, 1–17 CrossRef CAS.
- J. G. Kelly, et al., Biospectroscopy to metabolically profile biomolecular structure: A multistage approach linking computational analysis with biomarkers, J. Proteome Res., 2011, 10, 1437–1448 CrossRef CAS PubMed.
- H. Zhang, A. C. Silva, W. Zhang, H. Rutigliano and A. Zhou, Raman Spectroscopy characterization extracellular vesicles from bovine placenta and peripheral blood mononuclear cells, PLoS One, 2020, 15, e0235214 CrossRef CAS PubMed.
- A. Gualerzi, et al., Raman spectroscopy uncovers biochemical tissue-related features of extracellular vesicles from mesenchymal stromal cells, Sci. Rep., 2017, 7, 1–11 CrossRef PubMed.
- L. Ouyang, W. Ren, L. Zhu and J. Irudayaraj, Prosperity to challenges: recent approaches in SERS substrate fabrication, Rev. Anal. Chem., 2017, 36, 20160027 Search PubMed.
- R. Alder, L. Xiao and S. Fu, A Comparative Study of Gold Nanocubes, Octahedra, and Rhombic Dodecahedra as Highly Sensitive SERS Substrates | Inorganic Chemistry, Drug Test. Anal., 2021, 13, 944–952 CrossRef CAS PubMed.
- I. Rigó, et al., Comparative Analysis of SERS Substrates of Different Morphology, Procedia Eng., 2016, 168, 371–374 CrossRef.
- R. Alder, L. Xiao and S. Fu, Comparison of commercial surface-enhanced Raman spectroscopy substrates for the analysis of cocaine, Drug Test. Anal., 2021, 13, 944–952 CrossRef CAS PubMed.
- Z. M. Zhang, S. Chen and Y. Z. Liang, Baseline correction using adaptive iteratively reweighted penalized least squares, Analyst, 2010, 135, 1138–1146 RSC.
- P. H. C. Eilers, A perfect smoother, Anal. Chem., 2003, 75, 3631–3636 CrossRef CAS PubMed.
Footnote |
| † Electronic supplementary information (ESI) available: Additional Raman spectral data, Raman vibrational peak assignments table, and quality performance metrics for ML classifiers table, along with associated references (PDF). See DOI: 10.1039/d1nr03334d |
| This journal is © The Royal Society of Chemistry 2021 |