
Controlling the thermal switching in upconverting nanoparticles through surface chemistry†
Eduardo D.
Martínez
 *a,
Alí F.
García-Flores
b,
Albano N.
Carneiro Neto
c,
Carlos D. S.
Brites
c,
Luís D.
Carlos
c,
Ricardo R.
Urbano
b and
Carlos
Rettori
bd
*a,
Alí F.
García-Flores
b,
Albano N.
Carneiro Neto
c,
Carlos D. S.
Brites
c,
Luís D.
Carlos
c,
Ricardo R.
Urbano
b and
Carlos
Rettori
bd
aInstituto de Nanociencia y Nanotecnología (INN), Centro Atómico Bariloche, Comisión Nacional de Energía Atómica (CNEA), Consejo Nacional de Investigaciones Científicas y Técnicas (CONICET), Av. E. Bustillo 9500, R8402AGP, S. C. de Bariloche, Río Negro, Argentina. E-mail: eduardo.martinez@cab.cnea.gov.ar
b“Gleb Wataghin” Institute of Physics (IFGW), University of Campinas (UNICAMP), 13083-859, Campinas, SP, Brazil
cPhantom-g, CICECO-Aveiro Institute of Materials, Physics Department, University of Aveiro, 3810-193 Aveiro, Portugal
dCCNH, Federal University of ABC (UFABC), 09210-580, Santo André, SP, Brazil
First published on 31st August 2021
Abstract
Photon upconversion taking place in small rare-earth-doped nanoparticles has been recently observed to be thermally modulated in an anomalous manner, showing thermal enhancement of the emission intensity. This effect was proved to be linked to the role of adsorbed water molecules as surface quenchers. The surface capping of the particles has a direct influence on the thermal dynamics of water adsorption and desorption, and therefore on the optical properties. Here, we show that the upconversion intensity of small-size (<25 nm) nanoparticles co-doped with Yb3+ and Er3+ ions, and functionalized with different capping molecules, presents clear irreversibility patterns upon thermal cycling that strongly depend on the chemical nature of the nanoparticle surface. By performing temperature-controlled luminescence measurements we observed the formation of a thermal hysteresis loop, resembling an optical switching phenomenon, whose shape and trajectory depend on the hydrophilicity of the surface. Additionally, an intensity overshoot takes place immediately after turning off the heating source, affecting each radiative transition differently. We performed numerical modelling to understand this effect considering non-radiative energy transfer from the surface defect states to the Er3+ ions. These findings are relevant for the comprehension of nanoparticle-based luminescence and the interplay between the surface and volume effects, and more generally, for applications involving UCNPs such as nanothermometry and bioimaging, and the development of optical encoding systems.
1. Introduction
Recent reports on the upconversion luminescence (UCL) of small-size upconversion nanoparticles (UCNPs) demonstrated that temperature has an unexpected influence on their emission features.1–3 Rising temperatures lead to increased emission intensity, in contrast to what is observed for bulk upconverting materials and organic fluorophores. The conditions under which this effect occurs, and the mechanisms responsible for it, are still under discussion.4–8 The first work published on the subject by Shao and co-workers2 reported the thermal enhancement of UCL for small-size UCNPs (<27 nm) both for core-only and core–shell UCNPs, suggesting a non-direct correlation between the UCL enhancement and the nature of the surface. Therefore, the authors proposed that the phonon confinement effect, occurring exclusively in small-size particles, modifies the phonon density of states affecting the Yb3+-to-Er3+ energy transfer rates, thus favouring the enhancement of the UCL.2 Later, the same authors reconsidered their rationale by analysing the temperature-dependent emissions of UCNPs under different atmospheres.4 They concluded that the enhancement relies on the thermal desorption of water molecules, thus reducing the quenching produced by –OH groups located on the surface. Intriguingly, a core–shell system with an inert shell (thicker than the one presented in their previous work) was shown to exhibit the usual thermal quenching, supporting the importance of the nanoparticle's surface in the results. In 2018, Jin's group proposed that surface phonons, generated by the chelating ligands between Yb3+ and carboxylic moieties, favour the sensitizer-to-activator energy transfer.7 The authors showed that the thermal enhancement of the UCL could take place even in UCNPs as large as 57 nm, which ruled out the phonon confinement scenario. A few months later, Lei and co-workers9 strengthened the enhancement effect by deliberately generating surface defects through the doping of UCNPs with low-valence ions (Ca2+). The authors suggested that the electrons trapped in the surface defects with the appropriate energy may be thermally released, further populating the activator ions, and causing the thermal enhancement of the emission. More recently, the desorption and re-adsorption of water molecules upon thermal treatment were demonstrated by Meijerink's group who reported the occurrence of thermally enhanced UCL in doped NaY(WO4)2 UCNPs.10 Based on carefully designed experiments and structural characterization by thermogravimetric analysis (TGA) and Fourier-transform infrared (FTIR) spectroscopy, the authors demonstrated that the intensity variations could be ascribed to the desorption of surface moisture at high temperatures (∼470 K), observing a 0.5% weight loss or gain on heating and cooling, respectively. Nevertheless, despite the extensive work on the subject, reviewed in a series of recent papers,11–13 the real-time monitoring of emissions during heating–cooling cycles has been disregarded. Li and co-workers have only recently briefly compared the thermal-dependent UCL of oleic acid capped and uncapped UCNPs.6 This is a fundamental tool for studying the reversibility of the effect and to understand the physical mechanism underpinning the thermal enhancement of the UCL.In this work, we quantitatively studied the role of the surface coating in the regulation of the thermo-optical properties in detail, given that the fundamental mechanism of water desorption and re-adsorption has already been thoroughly studied by others. Our results show that the surface coating can be used to effectively control the quenching effect of water molecules, not only regarding its magnitude but also its dynamic behaviour. The more hydrophilic is the coating, the clearer will be the quenching action and more evident will be the emission intensity enhancement upon thermal desorption of water molecules. We investigate the correlation between the surface chemistry (including the surface defects) and the thermal UCL enhancement properties in detail by using a blended experimental and theoretical approach. As illustrative examples, small-size (<25 nm) UCNPs co-doped with Yb3+ and Er3+ were synthesized and their surface was further modified to incorporate capping molecules that are able to provide distinct chemical environments. The thermal behaviour of the UCL in all the prepared UCNPs was investigated using the luminescence of the Er3+ ion for accurate and intrinsic temperature control. We were able to explore the reversibility of the UCL and the formation of a hysteresis loop by monitoring the optical emissions under near-infrared (NIR) laser excitation (976 nm) while cycling the temperature.
By controlling the hydrophilicity of the surface capping molecule, UCNPs with specific opto-thermal behaviours can be designed. We believe that these experimental findings are key to reveal the physical mechanism behind the optical properties of UCNPs. Moreover, we rationalize the UCL response with temperature using numerical calculations on the energy transfer rates between the surface defects and the lanthanide ions, concluding that the energetic position of the surface defects depends on the nature of the UCNP surface chemistry.
2. Results and discussion
2.1. Synthesis and morphological characterization of the nanoparticles
A batch of UCNPs with a nominal composition β-NaYxF4 doped with 5 at% Yb3+ and 2 at% Er3+ (x = 0.93) was prepared.14 Transmission electron microscopy (TEM) images are presented in Fig. 1a–c. The resulting UCNPs have a mean size of (21.5 ± 1.5) nm and a narrow size distribution (Fig. 1g). The as-prepared particles are capped with oleic acid (OA) and form stable dispersions in low-polarity solvents such as cyclohexane, toluene, and chloroform. We then modified the capping ligand, first by removing the OA with HCl treatment and dispersing the UCNPs in water.15,16 Aliquots of the uncapped UCNP colloid in water were subsequently treated to form different polymeric coatings on the UCNPs. We used polyacrylic acid (PAA) and polyvinylpyrrolidone (PVP) that allowed the formation of stable water colloids. In addition, we synthesized a core–shell structure by growing a shell layer of NaGdxF4:Yb30%:Tm0.5% (x = 0.695) using the Yb3+/Er3+ co-doped OA-UCNPs as seed particles. Tm3+ ions were used in the shell layer with the purpose to study the thermal behaviour of the emissions of activator ions located in the core (Er3+) and the shell (Tm3+). For this reason, the core-UCNPs were prepared with a nominal 5 at% fraction of Yb3+ instead of the commonly employed 20 at% concentration, to intentionally reduce the quantum yield of UCL and obtain similar emission intensities for the activator ions located in the core and the shell. However, the emission of Tm3+ in the UV spectral region was hardly detected, and only the more intense emission bands at 800 nm were observed, as shown in the ESI (Fig. S2a and b†).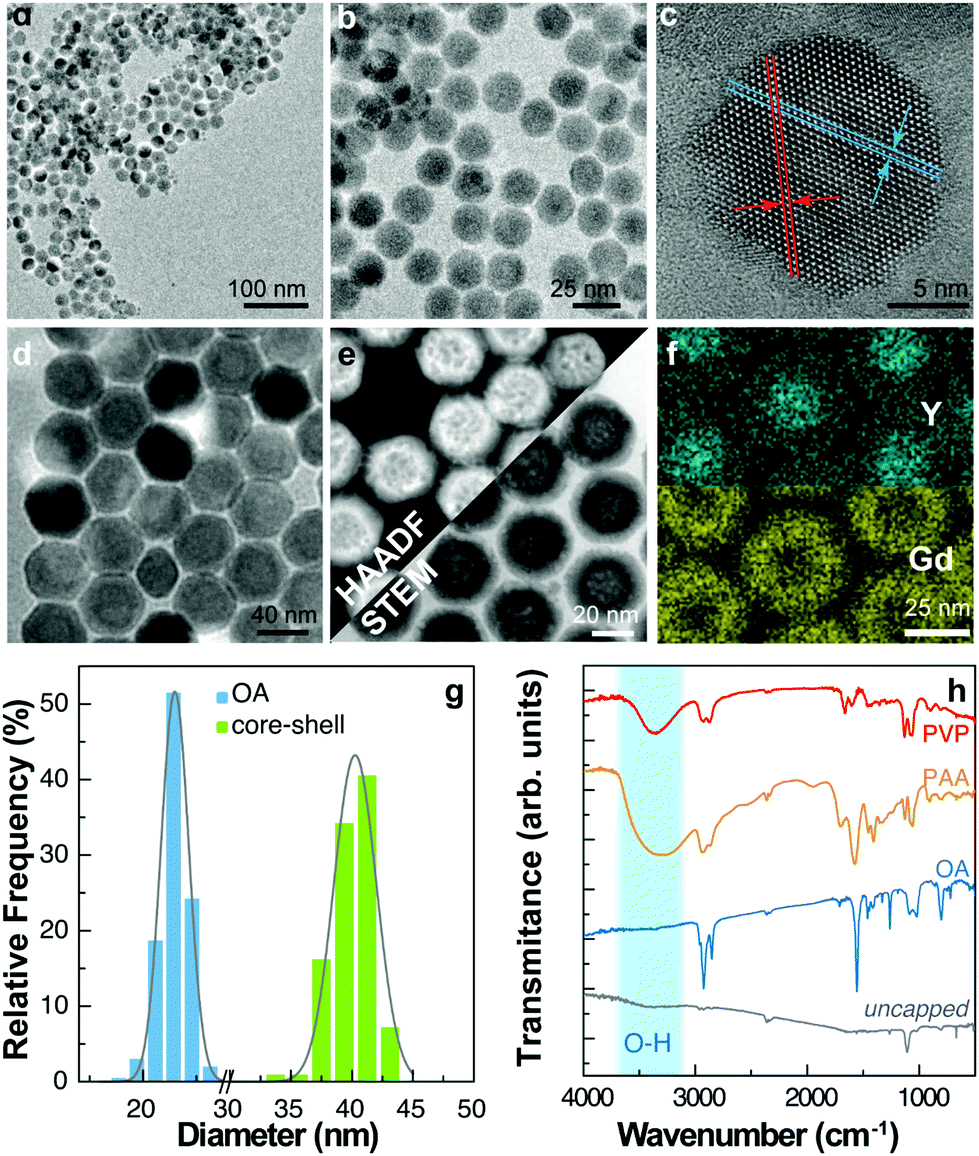 | ||
| Fig. 1 Structure and (a and b) transmission electron microscopy images of the as-synthesized UCNPs-OA. (c) High-resolution TEM image of a single UCNP. The plane separation d = 0.504 ± 0.004 nm corresponds to the (100) plane of β-NaYF4 (d) TEM and (e) combined STEM and HAADF micrographs of core–shell nanoparticles. (f) Compositional mapping by EDS showing the yttrium and gadolinium profiles corresponding to the core and shell materials, respectively. (g) Size distribution extracted from the TEM images. The solid line corresponds to the best fit to a Gaussian distribution of mean ± SD 21.5 ± 1.5 nm (OA) and 40 ± 4 nm (core–shell) (r2 > 0.97). (h) FTIR transmittance spectra of the uncapped UCNPs and UCNPs with different capping ligands. | ||
TEM images under different modes of operation are shown in Fig. 1d–f. Detailed information on the chemical synthesis and surface modification is given in the Materials and methods section. The shell was characterized by several transmission electron microscopy techniques including high-resolution TEM (Fig. 1d) and high-angle annular dark-field scanning transmission electron microscopy (HAADF-STEM) (Fig. 1e), providing images highly sensitive to variations in the atomic number of atoms, and obtaining a composition map by energy dispersive spectroscopy (EDS) as shown in Fig. 1f. The particle size analysis of TEM images shows a mean size of (40 ± 4) nm in diameter for the core–shell UCNPs, corresponding to a shell layer thickness of (9 ± 3) nm. The core–shell structure is evidenced by the distribution of Gd atoms in the EDS profiles and the brighter shell observed in HAADF-STEM images (Fig. 1g).
All the prepared nanoparticles were characterized by FTIR at room temperature (Fig. 1h). The C–H stretching bands at 2850–2950 cm−1 are present in all the samples but barely detected for the uncapped ones. Normalizing the spectra to the bands of CO2 at ∼2350 cm−1, the signal from C–H is considerably smaller for the uncapped sample. Although remnant OA could still be present, FTIR data confirm its successful removal after synthesis. On the other hand, it is observed a broad absorption band at 3200–3700 cm−1, assigned to the O–H stretching vibration of PAA and PVP capped particles that is, however, absent in the uncapped and OA capped ones. The characteristic stretching bands of the carboxylic group appear as multiple bands between 1350 and 1650 cm−1 in the PAA, PVP, and OA caped samples. The bending vibrations of O–H can be assigned to the absorption bands at 1018–1025 cm−1. The fingerprint region also contains absorption bands from C–N and C–O bonds.
2.2. Luminescence and primary thermometry using the upconverting nanoparticles
The characterization of the luminescence spectra was performed by depositing the UCNPs directly from their cyclohexane-based colloids on silicon wafers and left to dry. We measured the UCL at different temperatures by performing heating and cooling cycles on a Peltier plate (see the Materials and methods section and a scheme of the experimental set-up in Fig. S1, ESI†).The intensity of the emission spectrum of the OA-capped UCNPs is enhanced upon increasing temperatures (Fig. 2a). Also, the upconversion emissions produced by the Er3+ ions allow the optical determination of the local temperature by analysing the ratio between the integrated intensities of the 2H11/2 → 4I15/2 (IH) and 4S3/2 → 4I15/2 (IS) transitions in the green spectral region (Fig. 2b–d). The temperature dependence of the thermometric parameter is well described by:17
 | (1) |
 | (2) |
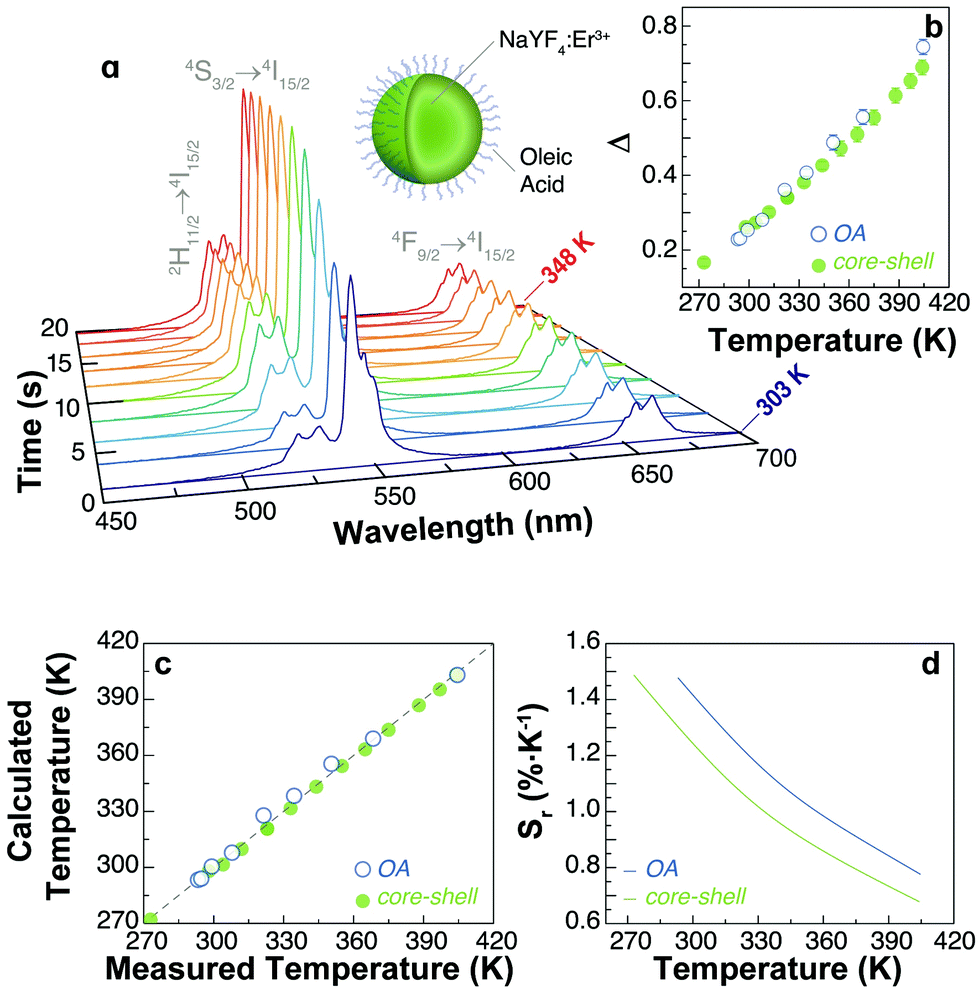 | ||
| Fig. 2 (a) Temperature dependence of the upconversion emission spectra of UCNPs-OA under 976 nm excitation (∼30 W cm−2). The Er3+ transitions are identified. (b) Calibration curve for the UCNPs-OA and core–shell NPs in the 293–405 K range. The calibration temperature is recorded using a Pt100 thermistor thermometer. (c) Comparison between the temperature values measured using an external thermometer (x-axis) and those calculated using eqn (2) (y-axis) for the UCNPs-OA and core–shell NPs. The x = y line corresponds to the perfect agreement between both employed methods. (d) Relative thermal sensitivity of the thermometers in the calibration range. | ||
2.3 Thermal cycling
We prepared a protocol for studying the heating–cooling trajectories of the emissions that consists of recording the emission of the samples (integration time of 10–15 s) upon continuous 976 nm excitation during heating and cooling cycles. The on/off cycles were automatically controlled on a Peltier heating element every 15 minutes. A scheme of the experimental set-up is presented in Fig. S1 (ESI).† The temperature was cycled from room temperature (298–303 K) to a maximum temperature of 373–393 K. We analysed the integrated intensities of each emission line and the overall integrated spectra separately. In each acquisition, the thermometric parameter Δ is calculated, providing information on the instantaneous temperature in real-time.The intensity profiles during thermal cycling recorded for the UCNPs with different capping and core–shell UCNPs are presented in Fig. 3 for the first 2 heating–cooling cycles. The integrated intensities of the IH and IS emission lines, the intensity of the 4F9/2 → 4I15/2 transition (IF) and the total intensity (Itotal = IH + IS + IF) are shown. Many important observations can be extracted from these figures. First, the apparent thermal enhancement effect is observed in all systems without a shell layer irrespective of the molecular capping. Nevertheless, the thermal enhancement in all samples is notoriously different both in terms of magnitude and temperature dependence. Second, important differences occur when the heating source is powered off. In addition to the gradual decrease and recovery of the emission intensity at room temperature, a sudden increase (overshoot) at the beginning of the cooling branch was observed in some cases (e.g., PVP and PAA capped UCNPs). This unexpected effect will be discussed in detail in the following section. A comparison of the overall integrated intensity trends for the first two cycles of all samples is shown in Fig. 3d for clarity.
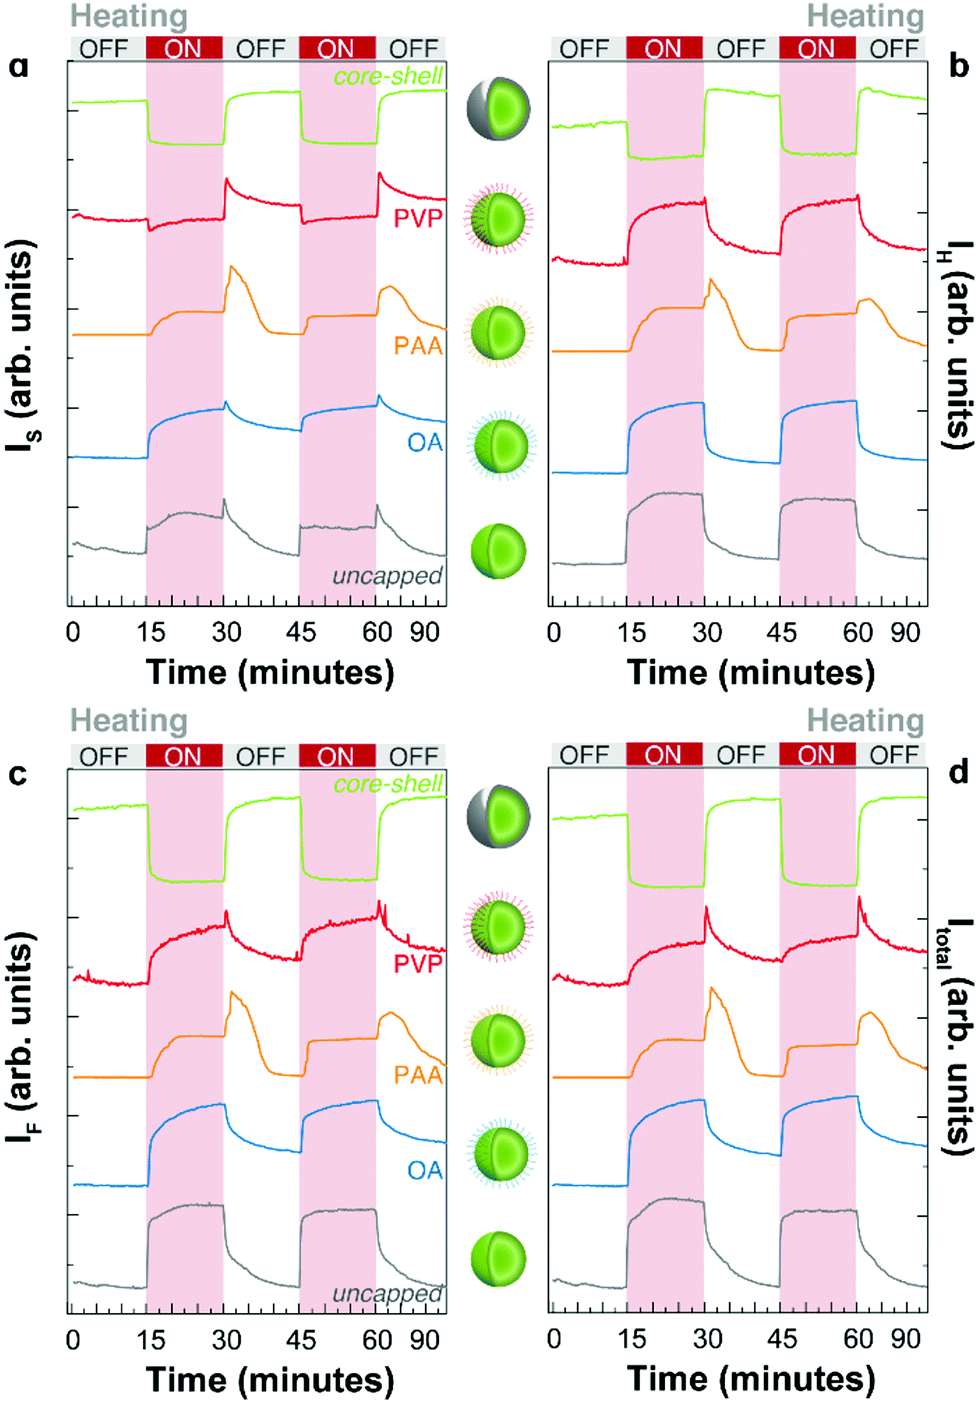 | ||
| Fig. 3 The integrated intensity in two thermal cycles corresponding to the (a) S transition (IS, 4S3/2 → 4I15/2), (b) H transition (IH, 2H11/2 → 4I15/2), (c) F transition (IF, 4F9/2 → 4I15/2), and (d) the sum of the areas of S, H, and F transitions (Itotal) for all the samples studied in this work. | ||
For the as-synthesized OA capped UCNPs, the adsorption of water is limited. Ideally, the hydrophilic carboxylic groups of OA should be attached to the surface forming carboxylate-ligands with surface Y3+ or Yb3+ ions, only exposing hydrophobic aliphatic chains. In reality, dangling bonds remain available for interacting with water considering that carboxylate groups can be protonated and detached from the UCNP surface.28,29 Hence, water can be adsorbed in the OA-UCNP system. The increase in temperature favours the gradual desorption of water resulting in an apparent increase of the emission intensity. Note that this phenomenon is not only an enhancement but also the reduction of the quenching effect of water molecules. When the heating element is turned off, water re-adsorption begins.
On the other hand, the thermometric parameter Δ follows the expected profiles during the thermal cycles (Fig. 4a–e). The effect of temperature on the emission intensity can be presented differently by plotting the total intensity vs. the thermometric parameter as shown in Fig. 4f–j. Here, the thermal effects are easily observed in the non-reversible trajectories generated during the heating and cooling branches of the thermal cycles. Except for the core–shell sample, which will be discussed below, all other samples show hysteresis loops upon thermal cycling, resembling those of ferromagnetic materials. This highlights the importance of the thermal history in the emission intensity of UCNPs.
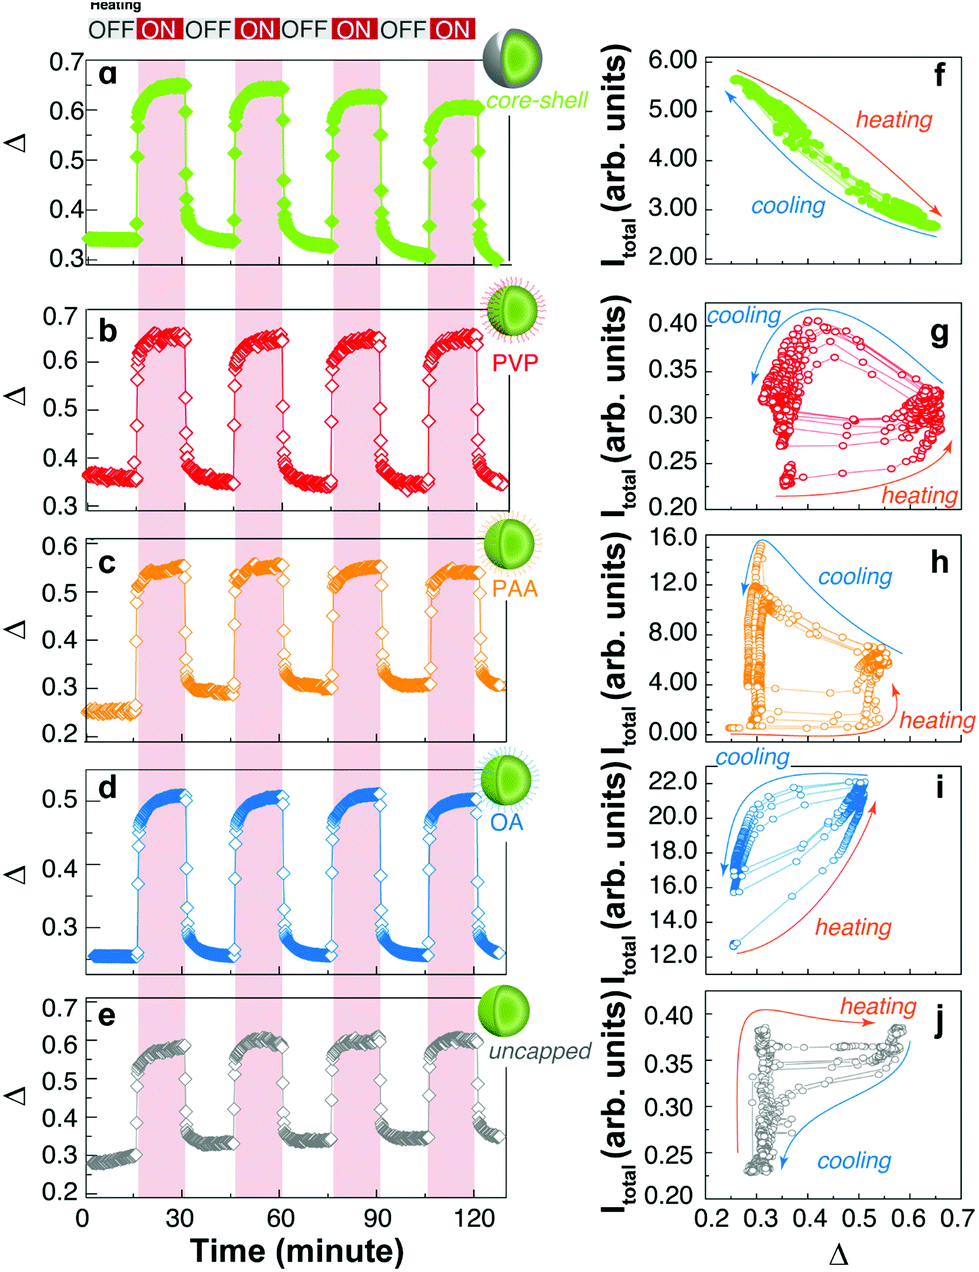 | ||
| Fig. 4 Evolution of the thermometric parameter (Δ) in four thermal cycles for (a) core–shell, (b) PVP-capped, (c) PAA-capped, (d) OA-capped, and (e) uncapped nanoparticles. The corresponding dependences of the total integrated intensities (Itotal) with Δ are presented in f–j in consecutive heating–cooling cycles. | ||
In the uncapped UCNPs, the absence of coating molecules (Fig. 3 and 4j) results in very fast adsorption and desorption kinetics. During the heating branch of the thermal cycle, a small increase in the temperature produces an abrupt increase in the emission intensity until a saturation level is reached and the emission intensity remains practically unchanged. When the heating source is turned off, a gradual decrease of the emission intensity is observed, which is compatible with the adsorption of water molecules. Again, the kinetics involved in the adsorption/desorption of water can explain the difference in the thermal behaviour of capped and uncapped UCNPs, as well as the hysteresis loop. Briefly, the trajectories shown in Fig. 4f–j during heating and cooling cycles depend on the diffusion and adsorption of water molecules on the surface of the UCNPs; therefore, for a given temperature (or equivalently Δ) the content of water is not univocally defined but rather depends on the thermal history and the humidity of the atmosphere, as shown by Wang et al.10 and others.6 Because these measurements were performed under non-equilibrium conditions, kinetic factors must be considered, also explaining the observed cycle-to-cycle differences.
When particles are capped with a water-soluble polymer, such as PVP, the thermal behaviour is modified. The water desorption becomes energetically unfavorable because of the strong interaction of water with the carbonyl group of the pyrrolidone groups, forming hydrogen bonds. To desorb water during the duty cycle, higher final temperatures must be applied. We augmented the electrical power delivered to the heating element to reach higher temperatures. First, the emission intensity remains roughly constant until higher temperatures are reached, followed by a gradual increase. When the heating source is turned off, the emission intensity continues to increase until the temperature is low enough to allow water re-adsorption.
A very interesting behaviour is observed for UCNPs capped with PAA (Fig. 3, 4c, h, and 5). PAA is a strongly hydrophilic polymer due to the multiple carboxylic groups free for hydrogen bonding. For this reason, the activation energy for water desorption is higher and thus occurs at higher temperatures. The heating branch of the thermal cycle shows that the emission intensity remains nearly constant until a critical temperature of 85 ± 1 °C is reached, corresponding to Δ = 0.52 ± 0.02, and water desorption is activated. A rapid increase in the emission intensity was observed once again due to the “unquenching” effect from water release. On the cooling branch of the cycle, the reversal effect (i.e., quenching) takes place on water re-adsorption at a characteristic temperature between 35 and 45 °C, corresponding to Δ values between 0.28 and 0.32, respectively. The additional and sudden enhancement observed after turning the heating source off is discussed in the following section.
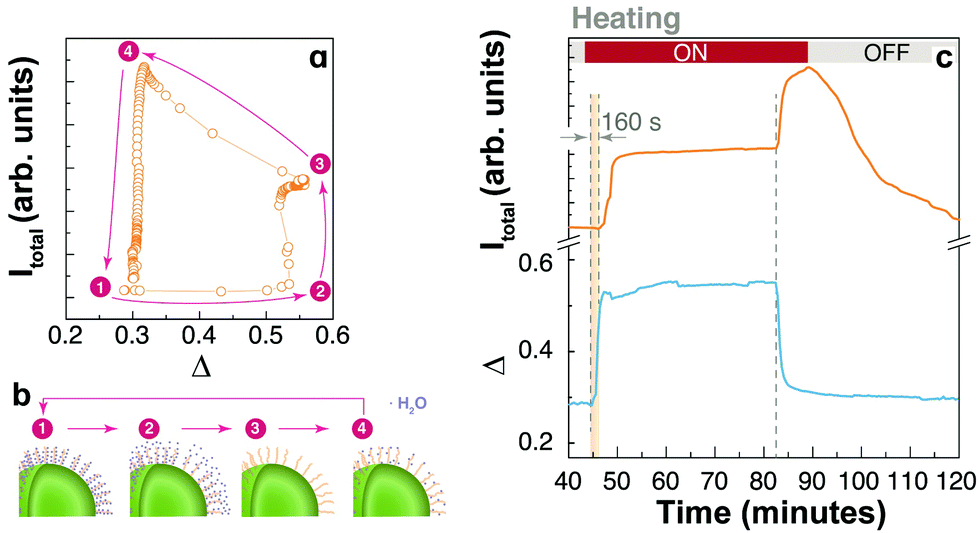 | ||
| Fig. 5 A water adsorption–desorption model exemplified for PAA-capped nanoparticles. (a) A thermal hysteresis loop (second cycle) identifying four critical points. (b) Schematic representation of the water (blue dots) adsorption state in each of the critical points. In the initial state (1) the water content is maximum and the emission intensity is partially quenched. At state (2) water desorption from PAA is thermally activated, producing the unquenching of the emissions. At state (3) the heating source is turned off; on cooling, the thermal quenching is reduced and the system reaches its maximum emission intensity at state (4) when water re-adsorption occurs. (c) Time evolution of the integrated emission intensity (orange) and the thermometric parameter (blue) for the second thermal cycle of PAA-capped UCNPs. A delay in the apparent rise is observed during the initial heating cycle, but the delay is absent when the heating source is turned off. | ||
The need for a physical separation of the emitting ions and the external environment has motivated the introduction of an insulating shell in UCNPs.21–23 Here, we prepared an additional sample with a shell layer containing Yb3+ and Tm3+ ions. Interestingly, we can follow the thermal behaviour of the emissions from the ions in the core (Er3+) and the shell (Tm3+). The emission from the core is completely different from the profiles observed for the previously discussed systems. Here, the increase in temperature produces a quenching of the emission intensity of Er3+ ions and the effect is completely reversible (Fig. 3, 4a and f). This is the typical behaviour for large-sized UCNPs or bulk upconverting materials.2,24 We can understand this behaviour by considering that the Yb3+–Er3+ coupled ions are spatially separated from the adsorbed water molecules, avoiding the water's quenching effect and thus exposing only the regular thermal quenching effect. This result has already been reported for thick (>3 nm) inert shells, i.e. without Yb3+ ions;7,21,25 however, as recently reported,4 active shells (∼3.5 nm thick) can also exhibit the thermal enhancing effect because of energy migration among Yb3+ ions reaching the surface and being quenched by the –OH vibrations from the adsorbed water. In our case, an active shell layer was grown with a 30 at% of Yb3+ ions and a thickness of ∼9 nm, but the thermal adsorption/desorption mechanism seems to be effectively suppressed. The difference here could be due to the thickness of the shell layer, but further research needs to be performed to accurately measure the length along which energy migration can effectively occur.
On the other hand, the emissions from Tm3+ in the shell layer were studied by following the 3H4 → 3H6 transition observed between 750 and 850 nm. Fig. S2 in the ESI† shows that the thermal enhancement effect is also observed for the Tm3+ ions present in the shell, highlighting the importance of the distance between the emitting ions and the surface of the UCNPs. These observations demonstrate that the UCL enhancement effect is most effective for activator ions located closer to the surface of the UCNP. Moreover, the overshoot phenomenon clearly observed here points out the role of the surface defect states (SDS). Experimental evidence of the SDS can be found in the literature26–28 for similar lanthanide-doped UCNPs. Also, the defects were modelled based on density functional theory calculations, as detailed by Qin et al.29 and Huang et al.30 Thus, the SDS in the NaYF4:Yb3+,Er3+ nanocrystals are mainly attributed to the fluorine vacancies due to the incomplete coordination of the cations Na+, Y3+, Yb3+, and Er3+ on the surface. These vacancies create electron–hole pairs, and their recombination may provide long-lived photon trapping.31 In this sense, we modelled the SDS as an energy reservoir that can relax after the heating source is turned off, triggering the energy transfer to the Ln3+ ion, similarly to the persistent luminescence phenomenon.32 Future studies on thermoluminescence and time-resolved spectroscopy could univocally show the presence and characteristics of surface defects.
A possible explanation for the thermal behaviour of UCL in these systems can be lined up with the previous models of thermal enhancement for small-sized UCNPs. The important role of water adsorption on the quenching of upconversion luminescence was demonstrated in many recent reports.10,11,25 The adsorbed moisture provides non-radiative relaxation pathways for the populated excited levels of the lanthanide ions by transferring their energy to the stretching vibration of water molecules (∼3500 cm−1).27 Vibrational overtones of OH-stretching were also pointed out for non-radiative relaxation.33 Increasing the temperature produces the desorption of water molecules, therefore reducing the quenching effect. This is perceived as an emission intensity enhancement but should be properly interpreted as an “unquenching” mechanism, also termed by some authors as “thermally alleviated surface quenching”.34 These adsorption-related phenomena depend on the surface-to-volume ratio and surface chemistry, whereas the former explains the presence of a critical size separating the thermal enhancement and quenching behaviours, and the functionalization or chemical nature of the surface of the particle regulates the adsorption or desorption dynamics by setting its hydrophilicity or hydrophobicity.
2.4 Enhancement overshoot
The enhancement overshoot that shows up when turning off the heating source (at the very beginning of the cooling branch of the thermal cycles) is another observation that, to the best of our knowledge, has never been reported before and should be considered in detail (Fig. 3). Instead of reversing the emission enhancement, a sudden increase in the intensity of emissions is produced. The enhancement overshoot is significantly different for each UCNP system, showing the fundamental role of surface chemistry. For example, the effect is augmented for the UCNPs capped with PVP and PAA, and even between these samples the effect is quite different. Most importantly, the effect is not equivalent for each emission line and it is clear for the 4S3/2 → 4I15/2 transition. For example, the uncapped UCNPs shows a remarkable overshoot in the IS transition that is absent in the IH and IF profiles. A similar observation is valid for the UCNPs-OA system. As shown in the ESI (Fig. S3†), we have observed the thermal enhancement and the overshoot phenomenon in UCNPs-OA with smaller sizes (∼8 nm) with or without a thin shell, and for the emissions in the NIR of Tm3+ in the core–shell sample (Fig. S2†). This points to a direct influence of the surface chemistry on the energy transfer and non-radiative transitions between the 4fn multilevel structures.The increasing emission intensities at the beginning of the cooling cycle can be interpreted considering two competing thermal effects. First, it is well known that temperature increase negatively affects the quantum efficiency of luminescence processes by increasing the non-radiative decay probabilities through multi-phonon relaxation.35,36 On cooling the effect is the opposite and a higher emissivity is expected. On the other hand, considering the water adsorption/desorption mechanism, a temperature increase affects the emission intensity positively in these UCNPs by reducing the quenching effect of water molecules due to thermal desorption. On cooling, quenching occurs when water molecules are re-adsorbed. To illustrate a possible dynamics of water absorption/desorption in the heating–cooling cycle we use the PAA-coated UCNPs (Fig. 5a and b). At the beginning (1), water molecules are already adsorbed at room temperature (T1), partially quenching the UCL. Desorption takes place at elevated temperatures (T2 ∼ 85 °C) and the water quenching effect disappears (2); however, the opposite phononic thermal quenching effect becomes relevant. At point (3), one can assume that most water molecules were desorbed but the high temperature (T3 ∼ 95 °C) partially limits the upconversion quantum yield. When the heating source is turned off, as the sample cools down, the quantum yield is recovered, and the emission intensity increases. At point (4), water adsorption rapidly occurs producing a notorious quenching of the upconversion, and the system returns to the initial condition.
Considering the overshoot phenomenon for the PAA-coated UCNP system, it is worth noting that there is a delay, of about 160 s, between the beginning of the heating cycle and the enhancement in the emission intensity. However, the overshoot enhancement after the thermal plate is turned off is immediate, without any delay. This is shown in Fig. 5c in which the total emission intensity and the thermometric parameter are plotted as a function of time. This additional information is consistent with the thermal desorption of water during heating, delayed by water diffusion, and a phononic thermal effect that is instantaneously reflected at the cooling stage. The distinctive characteristics of the overshoot peak for each sample and each transition line point out an additional mechanism that must be related to surface states. We hypothesize that the presence and nature of surface defects play a significant role in this overshoot effect. To investigate this hypothesis, we performed numerical calculations considering the surface defects involved in the energy transfer to activator ions.
2.5 Modelling the emission overshoot
We modelled the non-radiative energy transfer from the SDS to the Ln3+ ions. This additional energy route is operative only when the population of these defects decays to the valence band of the material when turning the heat source off. The energy released by this decay induces an abrupt population increase in the 4F9/2, 4S3/2, and 2H11/2 emitting levels of the Er3+ ion after the non-radiative energy transfer (for light emission the SDS act as energy reservoirs). In other words, when the heating source is turned on, the SDS trap electrons excited from the valence band of the material, filling it up. From our theoretical model, we infer that this filling process is supported by the Ln3+-to-SDS energy transfer. When the heating source is turned off, the SDS population starts to decay to the valence band transferring the equivalent amount of energy (ED) to the Ln3+ ion.This novel model introduced here is based on a well-established theory of intramolecular energy transfer by Malta and collaborators.37–42 Further details can be found in the ESI.†
For a semiconductor material, an increase in the temperature should decrease the average energy of the creation of electron–hole pairs.43 We expect this same trend in insulators such as NaYF4 nanoparticles. Thus, the SDS energy may be reduced and the SDS-to-Ln3+ energy transfer could be in out-of-resonance conditions. For this reason, we calculated the SDS-to-Ln3+ energy transfer rates by performing a scan in the SDS energies from 0 to 30![[thin space (1/6-em)]](https://www.rsc.org/images/entities/char_2009.gif) 000 cm−1, which is inside the bandgap interval of the NaYF4 material (ca. 64500 cm−1).44
000 cm−1, which is inside the bandgap interval of the NaYF4 material (ca. 64500 cm−1).44
The SDS can occur in a low energetic condition (situation 1, 4000 cm−1 < ED < 12000 cm−1), close to the 2F5/2 (Yb3+) level.29,45,46 Here, we are also considering these states in a higher energy condition like a deep electron trap (situation 2, 12000 cm−1 < ED < 30000 cm−1), as considered by Rodrigues et al.47 These two situations are shown in Fig. 6c and d, respectively. Although some reports pointed out a possible existence of energy transfer from defects to Ln3+ ions,45,46,48 our data presented in Fig. 6e is the first quantitative analysis of the SDS-to-Ln3+ energy transfer rates (details in the ESI†).
 | ||
| Fig. 6 (a) Illustration of a NaYF4 spherical nanoparticle and (b) its amplified image showing surface defects and ligands and (c) and (d) are the two situations in which the defects would interact as energy donors. (1) is the Yb3+ absorption (2F7/2 → 2F5/2); (2) and (3) are the first step in the Yb–Er UC process where the Er3+ ground population is excited to an intermediary level (4I15/2 → 4I11/2); (4) and (5) are the second step in the Yb–Er UC process, resulting in a population increase in the Er3+ emitting levels (2H11/2, 4S3/2, and 4F9/2) by a sequential multi-phonon relaxation; (6) is the energy transfer from the Ln3+ ion (Ln = Yb and Er in (c) and (d), respectively) to the valence band promoting its population that will be trapped into the SDS with energy ED; (7) represents the vibrational states of the surface defects; and (8) is the non-radiative energy transfer rate W from the SDS to the Er3+ levels, responsible for the luminescence overshoot phenomenon. (e) Semi-log scale of the energy transfer rates W between the SDS and the Er3+ ion. Dotted and full lines represent the rates when the SDS state is resonant with the 4I11/2 level (situation 1, (c)) and with the 2H11/2, 4S3/2, and 4F9/2 levels (situation 2, (d)), respectively. The horizontal lines, from top to bottom, ordering the 2H11/2 → 4S3/2 non-radiative decay rate, the average upconversion energy transfer rate Yb–Er,49 and the 4F9/2 → 4I9/2 and 4S3/2 → 4F9/2 non-radiative decay rates. | ||
Fig. 6e and Table 1 present the behaviour and the calculated SDS-to-Er3+ energy transfer rates using eqn (S5) (ESI†) and the approximate energy position of the SDS that matches the luminescence overshoots (ratio IOFF/ION > 1). Since the 2H11/2 population decays very fast non-radiatively by multi-phonon relaxation (in the order of WNR(2H11/2 → 4S3/2) ∼ 106 s−1 at 120 °C, ESI†), when the energy transfer rate is lower than the multi-phonon decay there is a population escape from the 2H11/2 level that effectively migrates to the 4S3/2 level. As can be seen in Fig. 6e, this condition affords W values between WNR(2H11/2 → 4S3/2) and the equilibrium rate WYb–Er. This can explain the luminescence overshoot behaviour of the OA-capped and uncapped samples (both in situation 2) that is present only in the 4S3/2 → 4I15/2 transition. In the samples capped with PVP and PAA, the luminescence overshoot is observed in all transitions, some less pronounced than others (Table 1). In particular, the appearance of the luminescence overshoot in the 2H11/2 → 4I15/2 transition indicates that the 2H11/2 level receives a substantial energy rate W to compensate the WNR(2H11/2 → 4S3/2) decay. Since PAA has a higher luminescence overshoot among all samples, this leads to an SDS energetic position at around 9400 cm−1 that favours a high transfer rate to all involved levels (situation 1). The sample capped with PVP presents the same but less pronounced trend compared to the PAA ones, leading to an SDS at around 12600 cm−1, whereas the rates are decreasing moderately. The UCL overshoot does not affect the Boltzmann's thermal equilibrium between the 2H11/2 and 4S3/2 levels, thus, with no impact on the thermometric parameter (Fig. 4), because the energy transfer rate between the SDS and the two Er3+ levels, and within these levels, (Fig. 6) is much higher than the integration rate in two consecutive measurements.
| Sample | OA | Uncapped | PVP | PAA |
|---|---|---|---|---|
| I OFFF/IONF | 0.97 | 0.84 | 1.08 | 1.54 |
| I OFFS/IONS | 1.08 | 1.18 | 1.52 | 2.21 |
| I OFFH/IONH | 0.70 | 0.75 | 1.03 | 1.26 |
| E D (cm−1) | 27000 |
25900 |
12600 |
9400 |
| W F (s−1) | 12.5 | 83 | 1.51 × 10⁵ | 2.73 × 10⁶ |
| W S (s−1) | 192 | 744 | 5.49 × 10³ | 2.10 × 10⁴ |
| W H (s−1) | 6.15 × 10⁵ | 2.11 × 10⁶ | 3.81 × 10⁶ | 1.02 × 10⁷ |
3. Conclusions
We have prepared a standard system consisting of UCNPs with a size of 21 nm co-doped with Yb3+–Er3+ and capped with OA molecules. We performed a standard chemical procedure to modify the surface and obtain UCNPs without capping molecules or to replace the OA ligands with PVP or PAA, which are polymers with different hydrophilic characteristics. The successful modification of the surface chemistry was verified by FTIR. The intensity of the upconversion emissions under NIR excitation was recorded during heating and cooling cycles while the emissions from the Er3+ ions were used to probe the actual temperature in real time. Distinctive intensity–temperature trajectories were observed during the thermal cycling for UCNPs with different surface capping molecules. The heating and cooling branches of the thermal cycles were markedly different, showing that the emission intensity remained at a high-level state even when the heating source was turned off. In some cases, the intensity continued to increase upon cooling until the temperature was low enough. Based on the well-established mechanism of thermal adsorption and desorption of water molecules, here we showed that the hydrophilicity of the particles’ surface is of great importance in regulating the thermo-optical properties, as it determines the extent and kinetics of water adsorption/desorption. UCNPs with a highly hydrophilic surface, as in the case of UCNPs-PAA, show a remarkable bi-stable behaviour exhibiting an optical switching effect on thermal cycling. The fundamental role of the chemical coating is demonstrated when comparing the thermal performance of core–shell UCNPs, showing only the thermal quenching effect.Depending on the surface capping of the UCNPs, and for specific radiative transitions, an overshoot peak in the emission intensity is observed immediately after shutting down the heat source. To explain this phenomenon, we proposed that surface defects act as thermally populated reservoirs that, upon cooling, transfer their stored energy to the emitting levels of activator ions. Ultimately, we performed numerical calculations on the transfer rates to address this mechanism quantitatively. We thus modelled the thermal behaviour observed for UCNPs with different surface capping molecules by considering the presence of low- or high-energy surface defects. The energy position depends on the nature of the UCNP surface: for PAA and PVP, low energy defect states should be considered while for uncapped and OA capped UCNPs, high energy surface defects may be considered. We strikingly found that the proposed defects act as thermally populated reservoirs, providing a mechanism for the sudden increase in UCL observed immediately after turning the heat source off. All these findings shed new light on the thermal properties of UCNPs and will be useful for the development of novel nanophotonic-based technologies and photoresponsive materials.50
4. Materials and methods
4.1 Synthesis of UCNPs
The UCNPs were synthesized by the co-precipitation method using rare-earth acetates and sodium fluoride following the well-established protocols of Wang et al.14 After the synthesis, UCNPs were washed and extracted by multiple steps of dispersion in ethanol and centrifugation. Stable colloids in cyclohexane were prepared. For the synthesis of a shell layer, a layer-by-layer method was applied following procedures reported by Li and co-workers.23 Briefly, rare-earth (Gd, Yb, and Tm) acetates dissolved in OA and Na(COOCF3) were successively added by injection to a dispersion of the core-UCNPs in OA and ODE at 280 °C. Three cycles of injection of each reactant were performed in total. A detailed explanation of the synthesis procedures is provided in the ESI.†4.2 Surface modification
The surface modification of core UCNPs was performed following HCl acid treatment as detailed by Bogdan and co-workers15 and generalized by Kong et al.16 Experimental details are described in the ESI.†4.3 Luminescence measurements
A solid-state NIR (976 nm) continuous wave (CW) FBG stabilized laser (BL976-PAG900 ThorLabs) was used for excitation. Emission spectra were recorded using a portable spectrometer (QEPro, Ocean Optics). A short-pass optical filter was added to avoid the spectrometer saturation by the 976 nm line of the laser. Several drops of the corresponding colloids of functionalized UCNPs were deposited on silicon wafers and left to dry. The wafers were placed in thermal contact on a Peltier plate using a high thermal conductivity paste. Temperatures were directly measured by positioning a thermocouple, or a resistance temperature detector (Pt100), on the Peltier plate. The thermal cycling was automated using an Arduino-controlled relay.4.4 Electronic microscopy
Transmission electron microscopy (TEM) images were obtained using an electronic microscope (JEM 2100, JEOL) equipped with a LaB6 filament and operated at 200 kV. EDS maps were obtained using a coupled EDAX spectrometer.Author contributions
The manuscript was written through the contributions of all authors. All authors have approved the final version of the manuscript.Conflicts of interest
There are no conflicts to declare.Acknowledgements
This work was supported and performed under the auspices of FAPESP through Grants #2011/19924-2, #2012/04870-7, #2012/05903-6, #2015/21290-2, #2015/21289-4, and #2017/10581-1. E. D. M. was the beneficiary of a post-doctoral FAPESP fellowship #2015/23882-4 during part of the development of this work. R. R. U. acknowledges CNPq Grant No. 309483/2018-2. E. D. M. acknowledges funding from ANPCyT-FONCyT PICT 2017-0307. The research was supported by the LNNano-Brazilian Nanotechnology National Laboratory (CNPEM/MCTI) during the use of the electron microscopy open-access facility. This work was also developed within the scope of the project CICECO – Aveiro Institute of Materials, UIDB/50011/2020, financed by Portuguese funds through the FCT/MEC and co-financed by FEDER under the PT2020 Partnership Agreement. Financial support from the European Union's Horizon 2020 FET Open programme under grant agreement no. 801305 is also acknowledged. This work was initiated at IFGW-UNICAMP, Brazil, continued and finished at the current affiliation of the corresponding author.Notes and references
- D. D. Li, Q. Y. Shao, Y. Dong, F. Fang and J. Q. Jiang, Part. Part. Syst. Charact., 2015, 32, 728–733 CrossRef CAS.
- D. Li, Q. Shao, Y. Dong and J. Jiang, J. Phys. Chem. C, 2014, 118, 22807–22813 CrossRef CAS.
- E. D. Martínez, R. R. Urbano and C. Rettori, Nanoscale, 2018, 10, 14687–14696 RSC.
- Y. Hu, Q. Shao, P. Zhang, Y. Dong, F. Fang and J. Jiang, J. Phys. Chem. C, 2018, 122, 26142–26152 CrossRef CAS.
- H. Zou, X. Yang, B. Chen, Y. Du, B. Ren, X. Sun, X. Qiao, Q. Zhang and F. Wang, Angew. Chem., Int. Ed., 2019, 58, 17255–17259 CrossRef CAS PubMed.
- D. Li, W. Wang, X. Liu, C. Jiang and J. Qiu, J. Mater. Chem. C, 2019, 7, 4336–4343 RSC.
- J. Zhou, S. Wen, J. Liao, C. Clarke, S. A. Tawfik, W. Ren, C. Mi, F. Wang and D. Jin, Nat. Photonics, 2018, 12, 154–158 CrossRef CAS.
- C. Mi, J. Zhou, F. Wang and D. Jin, Nanoscale, 2019, 11, 12547–12552 RSC.
- L. Lei, J. Xia, Y. Cheng, Y. Wang, G. Bai, H. Xia and S. Xu, J. Mater. Chem. C, 2018, 6, 11587–11592 RSC.
- Z. Wang, J. Christiansen, D. Wezendonk, X. Xie, M. A. van Huis and A. Meijerink, Nanoscale, 2019, 11, 12188–12197 RSC.
- R. Shi, E. D. Martinez, C. D. S. Brites and L. D. Carlos, Phys. Chem. Chem. Phys., 2021, 23, 20–42 RSC.
- Y. Zhou, Y. Cheng, Q. Huang, J. Xu, H. Lin and Y. Wang, J. Mater. Chem. C, 2021, 9, 2220–2230 RSC.
- Y. Wang, B. Chen and F. Wang, Nanoscale, 2021, 13, 3454–3462 RSC.
- F. Wang, R. Deng and X. Liu, Nat. Protoc., 2014, 9, 1634–1644 CrossRef CAS PubMed.
- N. Bogdan, F. Vetrone, G. A. Ozin and J. A. Capobianco, Nano Lett., 2011, 11, 835–840 CrossRef CAS PubMed.
- W. Kong, T. Sun, B. Chen, X. Chen, F. Ai, X. Zhu, M. Li, W. Zhang, G. Zhu and F. Wang, Inorg. Chem., 2017, 56, 872–877 CrossRef CAS PubMed.
- C. D. S. Brites, A. Millán and L. D. Carlos, in Handbook on the Physics and Chemistry of Rare Earths, ed. J.-C. G. Bünzli and V. K. Pecharsky, Elsevier, 2016, vol. 49, pp. 339–427 Search PubMed.
- M. Suta and A. Meijerink, Adv. Theory Simul., 2020, 3, 2000176 CrossRef CAS.
- S. Balabhadra, M. L. Debasu, C. D. S. Brites, R. A. S. Ferreira and L. D. Carlos, J. Phys. Chem. C, 2017, 121, 13962–13968 CrossRef CAS.
- C. D. S. Brites, S. Balabhadra and L. D. Carlos, Adv. Opt. Mater., 2019, 7, 1801239 CrossRef.
- Q. Su, S. Han, X. Xie, H. Zhu, H. Chen, C. K. Chen, R. S. Liu, X. Chen, F. Wang and X. Liu, J. Am. Chem. Soc., 2012, 134, 20849–20857 CrossRef CAS PubMed.
- G.-S. Yi and G.-M. Chow, Chem. Mater., 2007, 19, 341–343 CrossRef CAS.
- X. Li, D. Shen, J. Yang, C. Yao, R. Che, F. Zhang and D. Zhao, Chem. Mater., 2013, 25, 106–112 CrossRef CAS.
- E. D. Martínez, C. D. S. Brites, L. D. Carlos, A. F. García-Flores, R. R. Urbano and C. Rettori, Adv. Funct. Mater., 2019, 29, 1807758 CrossRef.
- Q. Shao, G. Zhang, L. Ouyang, Y. Hu, Y. Dong and J. Jiang, Nanoscale, 2017, 9, 12132–12141 RSC.
- F. Wang, J. Wang and X. Liu, Angew. Chem., Int. Ed., 2010, 49, 7456–7460 CrossRef CAS PubMed.
- F. T. Rabouw, P. T. Prins, P. Villanueva-Delgado, M. Castelijns, R. G. Geitenbeek and A. Meijerink, ACS Nano, 2018, 12, 4812–4823 CrossRef CAS PubMed.
- D. Yuan, M. C. Tan, R. E. Riman and G. M. Chow, J. Phys. Chem. C, 2013, 117, 13297–13304 CrossRef CAS.
- X. Qin, L. Shen, L. Liang, S. Han, Z. Yi and X. Liu, J. Phys. Chem. C, 2019, 123, 11151–11161 CrossRef CAS.
- B. Huang, H. Dong, K.-L. Wong, L.-D. Sun and C.-H. Yan, J. Phys. Chem. C, 2016, 120, 18858–18870 CrossRef CAS.
- A. N. Carneiro Neto and O. L. Malta, Nature, 2021, 590, 396–397 CrossRef CAS PubMed.
- X. Ou, X. Qin, B. Huang, J. Zan, Q. Wu, Z. Hong, L. Xie, H. Bian, Z. Yi, X. Chen, Y. Wu, X. Song, J. Li, Q. Chen, H. Yang and X. Liu, Nature, 2021, 590, 410–415 CrossRef CAS PubMed.
- R. Arppe, I. Hyppänen, N. Perälä, R. Peltomaa, M. Kaiser, C. Würth, S. Christ, U. Resch-Genger, M. Schäferling and T. Soukka, Nanoscale, 2015, 7, 11746–11757 RSC.
- B. Chen and F. Wang, Trends Chem., 2020, 2, 427–439 CrossRef CAS.
- D. Yu, J. Ballato and R. E. Riman, J. Phys. Chem. C, 2016, 120, 9958–9964 CrossRef CAS PubMed.
- X. Shen, Q. Nie, T. Xu, S. Dai and X. Wang, J. Lumin., 2010, 130, 1353–1356 CrossRef CAS.
- O. L. Malta, J. Lumin., 1997, 71, 229–236 CrossRef CAS.
- F. R. G. e Silva and O. L. Malta, J. Alloys Compd., 1997, 250, 427–430 CrossRef CAS.
- W. M. Faustino, O. L. Malta and G. F. de Sá, J. Chem. Phys., 2005, 122, 054109 CrossRef CAS PubMed.
- A. N. Carneiro Neto, E. E. S. Teotonio, G. F. de Sá, H. F. Brito, J. Legendziewicz, L. D. Carlos, M. C. F. C. Felinto, P. Gawryszewska, R. T. Moura Jr., R. L. Longo, W. M. Faustino and O. L. Malta, in Handbook on the Physics and Chemistry of Rare Earths, ed. J.-C. G. Bünzli and V. K. Pecharsky, Elsevier, 2019, vol. 56, pp. 55–162 Search PubMed.
- E. Kasprzycka, A. N. Carneiro Neto, V. A. Trush, L. Jerzykiewicz, V. M. Amirkhanov, O. L. Malta, J. Legendziewicz and P. Gawryszewska, J. Rare Earths, 2020, 38, 552–563 CrossRef CAS.
- P. P. Lima, S. S. Nobre, R. O. Freire, S. A. Júnior, R. A. Sá Ferreira, U. Pischel, O. L. Malta and L. D. Carlos, J. Phys. Chem. C, 2007, 111, 17627–17634 CrossRef CAS.
- A. M. Barnett, J. E. Lees and D. J. Bassford, Appl. Phys. Lett., 2013, 102, 181119 CrossRef.
- K. Chong, T. Hirai, T. Kawai, S. Hashimoto and N. Ohno, J. Lumin., 2007, 122–123, 149–151 CrossRef CAS.
- X. Dai, L. Lei, J. Xia, X. Han, Y. Hua and S. Xu, J. Alloys Compd., 2018, 766, 261–265 CrossRef CAS.
- L. Lei, D. Chen, C. Li, F. Huang, J. Zhang and S. Xu, J. Mater. Chem. C, 2018, 6, 5427–5433 RSC.
- L. C. V. Rodrigues, J. Hölsä, M. Lastusaari, M. C. F. C. Felinto and H. F. Brito, J. Mater. Chem. C, 2014, 2, 1612 RSC.
- J. Xia, L. Lei, H. Xia and S. Xu, Opt. Commun., 2019, 444, 131–136 CrossRef CAS.
- A. N. Carneiro Neto, R. T. Moura and O. L. Malta, J. Lumin., 2019, 210, 342–347 CrossRef CAS.
- L. Liang, Y. Tang, X. Hu, J. Wang, S. Xiao, D. Li, L. Fu, Z. Li and Q. Yuan, CCS Chem., 2019, 1, 490–501 CrossRef CAS.
Footnote |
| † Electronic supplementary information (ESI) available: Details of materials, methods, experimental setup, additional measurements and equations for optical thermometry and modelling of surface defects. See DOI: 10.1039/d1nr03223b |
| This journal is © The Royal Society of Chemistry 2021 |