
Photocatalytic hydrogen generation using mesoporous silicon nanoparticles: influence of magnesiothermic reduction conditions and nanoparticle aging on the catalytic activity†
Isabel S.
Curtis
,
Ryan J.
Wills
and
Mita
Dasog
 *
*
Department of Chemistry, Dalhousie University, 6274 Coburg Road, Halifax, NS B3H 4R2, Canada. E-mail: mita.dasog@dal.ca
First published on 26th January 2021
Abstract
In recent years, mesoporous silicon (mp-Si) nanoparticles (NPs) have been recognized as promising materials for sustainable photocatalytic hydrogen (H2) generation, which is both an important chemical feedstock and potential clean energy vector. These materials are commonly prepared via magnesiothermic reduction of silica precursors due to the ease, scalability, and tunability of this reaction. In this work, we investigate how the conditions of magnesiothermic reduction (i.e. reaction temperature and time) influence the performance of mp-Si for photocatalytic H2 generation. The mp-Si NPs were prepared using either the conventional single temperature heating method (650 °C for 3 or 6 h) or a two-temperature method in which the reaction is initially heated to 650 °C for 0.5 h, followed by a second step heating at 100 (mp-Si100), 200 (mp-Si200), or 300 °C (mp-Si300) for 6 h. Of these, mp-Si300 was the best performing photocatalyst and showed the highest H2 evolution rate (4437 μmol h−1 g−1 Si). Our results suggest that crystallinity has a profound effect on the performance of mp-Si photocatalysts. Additionally, high amounts of oxygen and particle sintering lower H2 evolution rates by introducing defect states or grain boundaries. It was also discovered that aging mp-Si NPs under ambient conditions result in continued surface oxidation which deleteriously affects its photocatalytic performance.
Introduction
Hydrogen (H2) gas is an important chemical feedstock that is in high demand for numerous industrial applications such as metal refining, production of hydrocarbons, fertilizers, pharmaceuticals and plastics among other chemicals.1 Furthermore, H2 is an energy carrier that can be used in fuel cells to generate electricity without the release of carbon dioxide (CO2), making it a promising alternative energy source to fossil fuels.2,3 Industrial production of H2 is commonly achieved through the process of steam methane (CH4) reforming, resulting in high emissions of CO2.4 As such, the development of alternative routes to producing H2 is necessary if its large-scale use is to be continued. H2 generation via water-splitting through electrochemical,5–7 photoelectrochemical,7–9 photochemical,9,10 biological,11,12 and solar thermal13,14 pathways has been researched extensively. Of these, H2 production via solar-driven water-splitting using suspended particulate photocatalysts has been predicted to be cost-effective by technoeconomic analysis.15,16In recent years, nanostructured silicon (Si) has shown promise as a photocatalyst for H2 generation.17–24 Si is an attractive semiconductor for this application given its abundance, non-toxicity, and ability to absorb in the UV to near IR region of the solar spectrum.22,25 While bulk Si has been well-established for electricity production in solar cells26 and fuel formation in photoelectrochemical systems,27,28 its applicability as a particulate photocatalyst remains relatively under investigated. Recent studies have demonstrated that mesoporous Si (mp-Si) nanoparticles (NPs) are attractive particulate photocatalysts for H2 production for the following reasons: (i) the porous network provides a high-surface area and abundant catalytic sites which enhance the amount of H2 generated, (ii) the nano-structuring shifts the conduction band edge position of Si favorably to further facilitate electron transfer to drive H2 formation, and (iii) the pore structure can enhance light absorption through pore-induced multiple reflections.21,22 The mp-Si NPs for photocatalytic H2 generation have been prepared either via reduction of SiCl4 using a NaK alloy21 or through magnesiothermic reduction of silica precursors.18,20,22,24 Magnesiothermic reduction is becoming the sought-after method given its ease, scalability, and tunability. The reaction conditions of magnesiothermic reduction can be easily modified to change the physical properties such as the surface area, pore size, crystallinity, and crystallite size of the resulting mp-Si.29 While this can be used as a tool to design the best performing mp-Si photocatalyst, unfortunately, it is not currently well understood how different magnesiothermic reduction conditions affect the photocatalytic behaviour of mp-Si formed. Various reaction parameters (i.e. silica precursor, reaction time, and temperature) in literature reports have led to different H2 evolution rates despite the common use of magnesiothermic reduction as the synthetic method. As such, a systematic evaluation of magnesiothermic reduction parameters on the catalytic activity of mp-Si is required to design an optimum photocatalyst.
Herein, the relationship between the magnesiothermic reduction conditions (i.e. reaction temperature and time) and their influence on the photocatalytic activity for H2 generation was investigated. The mp-Si NPs were prepared using either the conventional single temperature heating method or recently reported two-temperature heating method.30 The particle morphology was analyzed using scanning electron microscopy and transmission electron microscopy (SEM and TEM). The amount of oxygen in mp-Si NPs was determined using energy dispersive X-ray spectroscopy (EDS) and X-ray photoelectron spectroscopy (XPS). The crystallinity was analyzed using Raman spectroscopy and high-resolution TEM (HRTEM). The bandgap was estimated using Tauc plots. The photocatalytic H2 evolution rates were determined for various mp-Si NPs and their performance was compared to their physical properties. While performing these studies, we noticed that catalyst aging under ambient conditions also influenced the catalytic performance of mp-Si NPs. Therefore, the best performing photocatalyst was aged under ambient conditions and its photocatalytic activity was studied as a function of time.
Experimental methods
Materials
Ammonium hydroxide (28% NH3) and magnesium −325 mesh powder (Mg, 99.8%) were purchased from Alfa Aesar. Tetraethyl orthosilicate (TEOS, 99.9%), hydrochloric acid (HCl, 37%), methanol, and ethanol (95% and 100%) were purchased from Sigma-Aldrich. All reagents were used as received without further purification. Deionized water was obtained using an Arium Ultrapure Water System.Synthesis of Stöber silica (SiO2) nanoparticles
30.0 mL of TEOS was added to 700 mL of 95% ethanol followed by 60.0 mL of 28% ammonia solution. The reaction vessel was sealed with parafilm and left to stir for 18 h at 400 rpm. The relative humidity and room temperature were recorded to be 41% and 20 °C, respectively. Following the reaction, the white solid was collected by centrifugation at 3300 rpm for 25 min. The supernatant was discarded, and the nanoparticles were washed twice with 100% EtOH to remove any unreacted TEOS. The white solid (SiO2 NPs) was dried in an oven overnight at 100 °C.Magnesiothermic reduction of silica nanoparticles
The dried Stöber SiO2 nanoparticles (0.20 g) and −325 mesh Mg powder (0.18 g) were ground together using a mortar and pestle, resulting in a uniform light grey/purple powder. It is important to grind them homogenously to prevent uneven Mg distribution. The SiO2/Mg was transferred to a ceramic reaction boat, which was placed in a tube furnace and heated under an argon atmosphere at a ramp rate of 10 °C min−1. For the single temperature heating process, the reaction was held at 650 °C for 3 or 6 h, and then cooled to room temperature. For the two-temperature heating process, the reaction was held at 650 °C for 0.5 h, then cooled and held at a predetermined temperature (100, 200 or 300 °C) for 6 h. After the reaction was completed and cooled to room temperature, the resulting product was treated with 25.0 mL of 1.0 M HCl for 4 h with stirring at 300 rpm. The solid was collected by suction filtration and washed with 150 mL of distilled water, and then dried overnight in an oven at 100 °C.Materials characterization
Powder X-ray diffraction (XRD) patterns were collected on a Rigaku Ultima IV X-ray diffractometer with Cu Kα radiation (λ = 1.54 Å). The samples were placed on a zero-background Si wafer and spectra were collected at 3 counts per s. The scanning electron microscopy (SEM) images were collected on a Hitachi S-4700 electron microscope. The samples were dispersed in acetone and drop-cast onto a silicon wafer to prepare them for SEM analysis. EDS analysis was performed on a JEOL JSM-7000F microscope equipped with an Oxford Instruments X-Max EDS detector. The transmission electron microscopy (TEM) images were collected on a FEI Titan 80–300 microscope at an operating voltage of 300 kV. The particles were dispersed in EtOH and drop coated onto a carbon coated copper TEM grid. The particle size analysis was performed using Image J software. Raman spectroscopy was conducted on the mp-Si powders using a Jobin–Yvon T64000 Raman system with 532 nm laser excitation and a CCD detector. Raman spectra were collected through a 50× long working distance objective, with a power of 10 mW at the sample. X-ray photoelectron spectroscopy (XPS) was conducted with a ThermoVGScientific Multilab 2000 XPS using Al Kα radiation. High-resolution spectra were recorded with a pass energy of 30 eV in 0.1 eV steps. Binding energies were corrected with respect to the binding energy of the C 1s peak at 284.8 eV. Ultraviolet-visible (UV-Vis) absorbance spectra were recorded on a Varian Cary 100 Bio spectrophotometer.Photocatalytic hydrogen evolution
Photocatalytic experiments were performed in a gas-tight Pyrex cell sealed with a rubber septum and hose clamp. 0.010 g of the dried mp-Si NP powder (used <48 h after the synthesis) was transferred to the reaction vessel which was then flushed with N2 gas for 0.5 h. Distilled water and methanol were bubbled with N2 for 0.5 h, and then 5 mL of the N2 bubbled methanol and 30 mL of the N2 bubbled water were added to the reaction vessel containing the mp-Si NPs under N2 flow. The reaction mixture was sealed and stirred for the duration of the experiment. A broadband LED (Thorlabs, SOLIS-3C) was used as the light source and the photocatalytic reactions were carried out at 100 mW cm−2 illumination power density. The power output from the LED source was calibrated using a silicon photodiode (Thorlabs). Gas from the reaction vessel headspace was collected using a syringe through the rubber septum and H2 amounts were quantified using gas chromatography (GC) with a thermal conductivity detector (Agilent 8860 GC System) with N2 as the carrier gas. For the cycling experiments, gas from the reaction vessel headspace was sampled every hour for a period of 5 h. Illumination was then ceased, and the reaction vessel was evacuated using N2 flow before resuming illumination for another 5 h cycle. The reaction vessel was evacuated using N2 flow and left overnight in the dark before performing another 5 h cycle.Catalyst aging
To determine the effect of catalyst aging, the mp-Si NPs were stored in a glass vial under an ambient atmosphere in a drawer for a predetermined amount of time. The photocatalytic activity was examined under broadband illumination as outlined in the previous section.Results and discussion
Stöber SiO2 NPs were prepared using a previously reported base catalyzed sol–gel method.31 The synthesized particles were monodisperse and had an average diameter of 295 ± 15 nm as seen in the SEM image (Fig. S1A, ESI†). The powder XRD pattern showed a broad peak centered around ∼22° corresponding to amorphous SiO2 (Fig. S1B†).32 These NPs were reduced with −325 mesh Mg metal using the conventional single temperature heating at 650 °C (which is the melting point of Mg) for 3 h. The powder XRD pattern (Fig. 1) of the reduced product (mp-Si650) showed reflections at 28.3, 47.2, 56.1, 68.8, and 76.3° corresponding to 111, 220, 311, 400, and 331 crystal planes of Si (JCPDS#27-1402), respectively. The SEM (Fig. 2A) and TEM (Fig. 2E) images of the product showed formation of porous Si NPs; however, morphological damage was observed and the mp-Si NPs were found to be broken (Fig. 2E) and sintered in certain areas (Fig. S2†). This structural damage occurs due to the exothermic nature of the magnesiothermic reaction where the local temperatures can reach above >1000 °C.33,34 The HRTEM analysis showed the mp-Si NPs to be composed of crystalline primary particles (Fig. 2I) ranging between 20 and 40 nm in diameter. The EDS analysis indicated the presence of 10 ± 2% atomic oxygen in the mp-Si650 sample.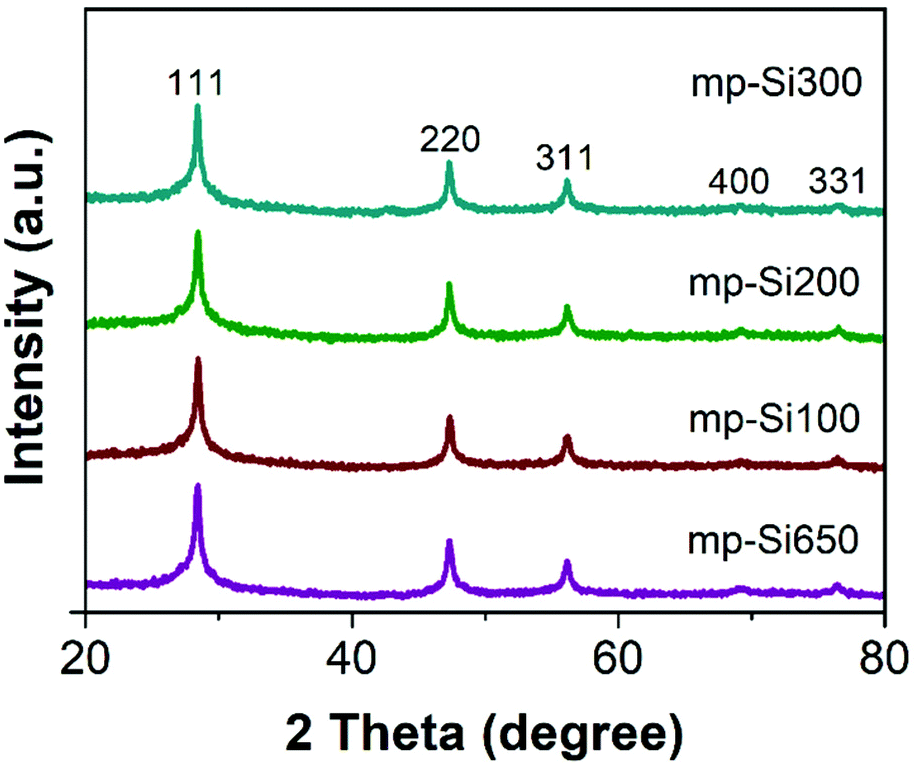 | ||
| Fig. 1 Powder XRD patterns of mp-Si NPs prepared using a single heating step magnesiothermic reduction process at 650 °C for 3 h (mp-Si650) and two heating steps with the second annealing temperature of 100 (mp-Si100), 200 (mp-Si200), and 300 °C (mp-Si300). | ||
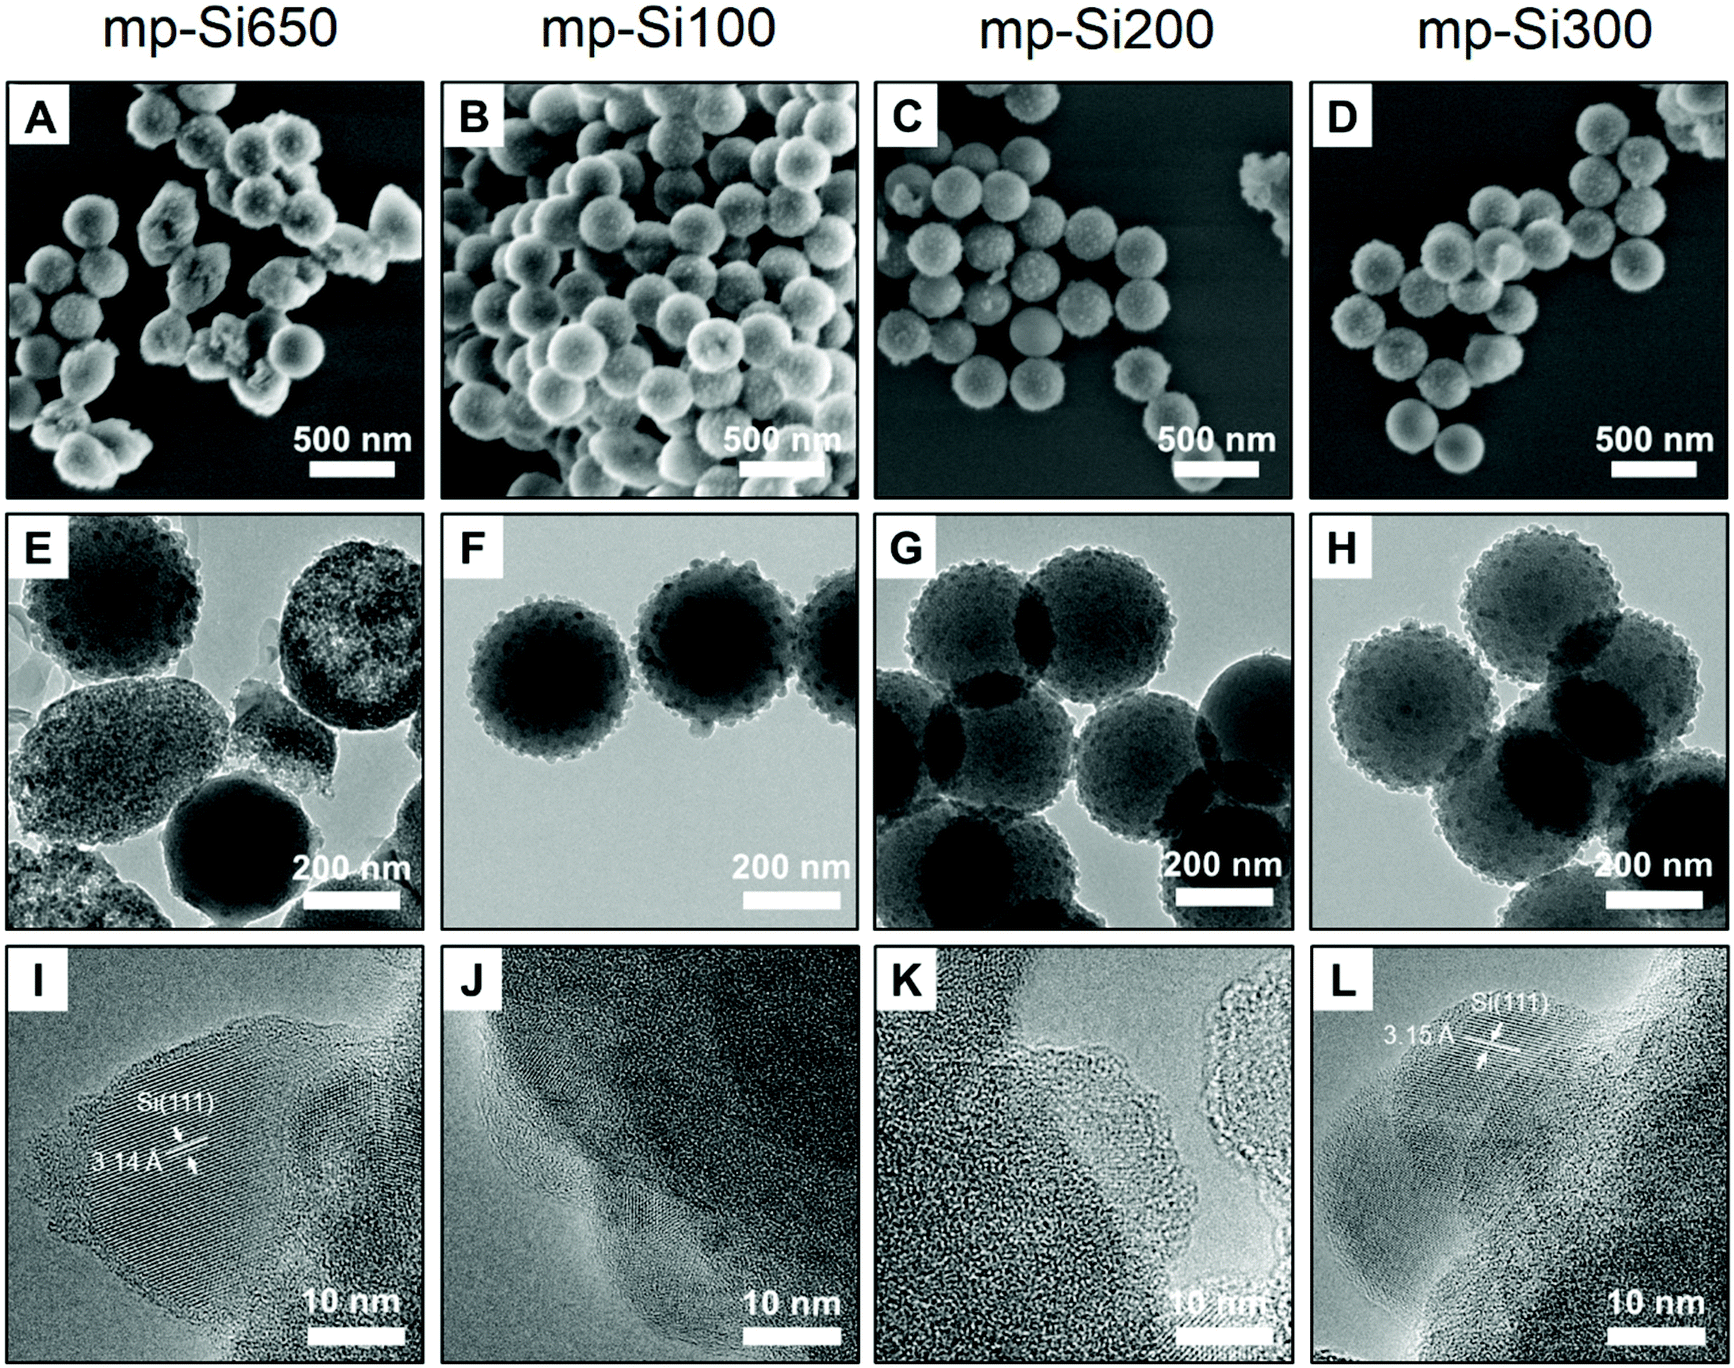 | ||
| Fig. 2 (A–D) SEM, (E–H) TEM, and (I–L) HRTEM images of mp-Si NPs prepared under different magnesiothermic reduction conditions. mp-Si650 was prepared using the single step heating at 650 °C for 3 h. mp-Si100, mp-Si200, and mp-Si300 were prepared using the two step heating method with the second annealing temperature of 100, 200, and 300 °C, respectively. | ||
To address the issue of heat induced structural damage, our group recently introduced a two-temperature heating method where the reaction is initiated at 650 °C, but the bulk of the reaction is carried out at a second lower temperature.30 The heat released from the exothermic magnesiothermic reduction provides the additional energy required to sustain the reaction at lower temperatures. Three sets of mp-Si NPs were prepared using the two-temperature heating method, where the reaction was initially heated to 650 °C for 0.5 h followed by a second step of heating at 100 (mp-Si100), 200 (mp-Si200), or 300 °C (mp-Si300) for 6 h. The powder XRD patterns of all three samples showed characteristic reflections corresponding to elemental Si (Fig. 1). The SEM (Fig. 2B–D) and TEM (Fig. 2F–H) analysis showed mostly spherical mp-Si NPs with minimal structural damage for samples made by this method. Similar to the mp-Si650 sample, the mp-Si300 showed crystalline primary particles (Fig. 2L) ranging between 15 and 30 nm. The mp-Si100 and mp-Si200 samples had smaller regions of crystallinity within the primary particles surrounded by a more disordered structure (Fig. 2J and K). The EDS analysis of these mp-Si NPs showed an atomic oxygen content of 21 ± 2, 10 ± 2, and 7 ± 1% for mp-Si100, mp-Si200, and mp-Si300 samples, respectively.
Raman spectroscopy is a useful technique to determine crystallinity in Si structures. Typically, a sharp peak is observed at ∼520 cm−1 corresponding to crystalline Si and a broad peak centered around ∼480 cm−1 for amorphous Si.35 For nanocrystalline Si, as the crystallite size and degree of crystallinity decrease, the peak shifts from 520 cm−1 to lower wavenumbers and the full width at half maximum (FWHM) of the peak increases.36 While the powder XRD patterns of all the mp-Si NPs were similar, the Raman analysis revealed the differences in these samples (Fig. 3). The mp-Si650 NPs had a peak maximum at 512 cm−1 and a FWHM of 17 cm−1. The mp-Si300 sample was similar to mp-Si650 with a peak maximum at 514 cm−1 and a FWHM of 15 cm−1. The peak maximum shifted from 514 to 503 and 494 cm−1 as the second heating temperature decreased from 300 to 200 and 100 °C, respectively. Correspondingly, the peak FWHM increased to 22 and 26 cm−1 for mp-Si200 and mp-Si100 NPs, respectively, indicating a decrease in the grain size and crystallinity with decreasing temperatures which is consistent with HRTEM analysis. XPS analysis was performed to understand the extent of surface oxidation in mp-Si NP samples. The Si 2p region of freshly prepared mp-Si NPs showed the presence of elemental Si (Si(0) 2p3/2 peak at ∼99.2 eV), suboxides (Si(+1, +2, and +3) 2p3/2 peaks at ∼100.2, ∼101.4, and ∼102.5 eV, respectively), and SiO2 (Si(+4) 2p3/2 peak at ∼103.4 eV) in all the samples (Fig. S3†).37 The highest amount of SiO2 was present in the mp-Si100 and mp-Si650 samples, whereas the smallest amount of SiO2 was present in the mp-Si300 NPs. We have previously determined the specific surface area of mp-Si650, mp-Si100, mp-Si200, and mp-Si300 samples using N2 adsorption measurements to be 174 ± 22, 364 ± 18, 412 ± 15, and 527 ± 21 m2 g−1, respectively.30,34
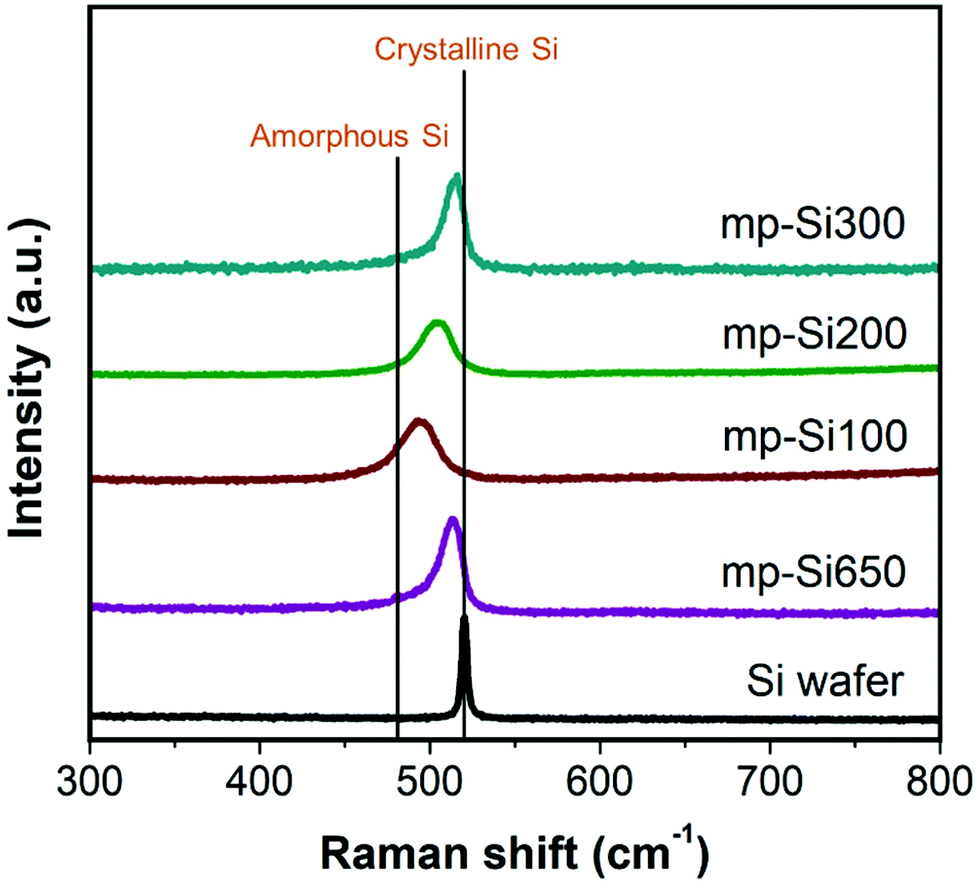 | ||
| Fig. 3 Raman spectra of Si wafer and mp-Si NPs prepared under different magnesiothermic reduction conditions. mp-Si650 was prepared using the single step heating at 650 °C for 3 h. mp-Si100, mp-Si200, and mp-Si300 were prepared using the two step heating method with the second annealing temperature of 100, 200, and 300 °C, respectively. | ||
Optical absorption measurements were performed on mp-Si NPs dispersed in ethanol (Fig. S4†) and all the samples exhibited a typical absorption profile observed for nanostructured Si where the absorption increases moving from near-IR to visible region. The bandgaps of mp-Si samples estimated using Tauc plots (Fig. S4†) were derived from the absorption measurements and found to be 1.45, 1.52, 1.50, and 1.46 eV for mp-Si650, mp-Si100, mp-Si200, and mp-Si300 NPs, respectively. All the values were higher than the bulk Si bandgap of 1.11 eV which is due to quantum confinement effects in the nanostructured mp-Si NPs.38 This observation is consistent with other mp-Si materials prepared using magnesiothermic reduction all of which exhibit wider bandgaps than bulk Si.20–22
The photocatalytic H2 evolution performance of freshly prepared (less than 48 h after the synthesis) mp-Si NPs via water-splitting was investigated under 100 mW cm−2 broadband illumination. As Si does not have a wide enough bandgap to perform overall water-splitting, methanol was used as a sacrificial hole scavenger in the photocatalytic experiments. The amount of H2 evolved was quantified using gas chromatography. The typical H2 evolution profiles for different mp-Si NPs are shown in Fig. 4A. An H2 evolution rate of 3554 ± 373, 1118 ± 275, 1997 ± 350, and 4437 ± 450 μmol h−1 g−1 of Si was observed for mp-Si650, mp-Si100, mp-Si200, and mp-Si300, respectively (Fig. 4B). In the dark, H2 evolution rates were below 200 μmol h−1 g−1 of Si for all the samples investigated. The lowest rate was observed for the mp-Si100 sample which is likely due to the high oxygen content and low crystallinity, both of which introduce large concentrations of defect states leading to charge carrier recombination and low catalytic activity.21,39–41 The XPS analysis revealed mp-Si100 to have a high surface SiO2 amount (Fig. S3†) and the EDS analysis showed a high atomic oxygen content probably due to incomplete reduction. This can be seen in the TEM analysis of this sample (Fig. 2F) which contains a darker core likely due to the presence of non-porous unreduced SiO2. The HRTEM (Fig. 2J) and Raman (Fig. 3) analysis also revealed the presence of less crystalline regions in the mp-Si100 sample. The best performance was observed for the mp-Si300 sample, which had the lowest oxygen content and possessed high crystallinity. Even though mp-Si650 had similar crystallinity to mp-Si300 NPs (as seen in the HRTEM and Raman analysis), it had lower activity owing to higher surface oxidation as seen in the XPS measurements (Fig. S3†). Due to more extensive morphological damage, the mp-Si650 NPs fractured, exposing more of the Si which probably results in higher surface oxidation. Furthermore, sintering can introduce higher amounts of grain boundaries which can act as trap states for charge carriers42 and contribute to lower photocatalytic activity. While both mp-Si650 and mp-Si200 have a similar oxygen content based on EDS analysis, the latter had lower photocatalytic performance likely due to lower crystallinity. This shows that Si crystallinity is more crucial in determining its photocatalytic activity. The mp-Si300 NPs were tested under natural sunlight during which bubble evolution (due to H2 gas formation) can be seen, demonstrating their potential in solar-driven water-splitting (ESI video†).
 | ||
| Fig. 4 (A) H2 evolution profiles of different mp-Si NPs under broadband illumination, (B) H2 evolution rates of mp-Si NPs, (C) photocatalytic cyclability of mp-Si300 NPs, and (D) the change in the H2 evolution rate of mp-Si300 NPs with catalyst aging. | ||
The influence of magnesiothermic reduction time on the photocatalytic activity of mp-Si NPs was also explored. The mp-Si NPs were prepared using the conventional single temperature heating method at 650 °C but the reaction time was increased from 3 to 6 h. The powder XRD pattern revealed the formation of crystalline Si (Fig. S5A†) but the TEM images showed extensive particle damage and sintering (Fig. S5B and C†). The EDS analysis indicated the presence of 8 ± 1% atomic oxygen. The photocatalytic study showed an H2 evolution rate of 983 ± 223 μmol h−1 g−1 of Si which is significantly lower compared to the 3 h reaction time sample. This is likely due to particle sintering which can introduce a significant number of grain boundaries and defect states in which the carriers can get trapped.42 Therefore, care must be taken to prevent extensive morphological damage during the synthesis of mp-Si NPs.
The cycling ability of only the highest performing mp-Si300 sample was evaluated (Fig. 4C). A slight drop in the H2 evolution rate was observed in cycle 2; however, after leaving the mp-Si NPs suspended in water overnight, a considerable decline in photocatalytic activity was observed in cycle 3. A similar drop in performance during cycling experiments has been observed before due to the gradual surface oxidation of mp-Si NPs.20 Robust surface protection strategies are required to improve the longevity of mp-Si NPs and make them a viable option for solar-driven H2 generation via water-splitting. After the synthesis of mp-Si, the NPs form an oxide shell as shown by the XPS analysis (Fig. S3†). This native oxide on Si is typically believed to be self-passivating (within a few hours) and as such, the synthesized mp-Si NPs were stored under ambient conditions.43 However, a gradual decline in the H2 evolution rates was observed even in a matter of a few days, while performing the replicates for the photocatalytic studies. The H2 evolution rate decreased from 4437 to 4055 μmol h−1 g−1 of Si after storing the mp-Si300 NPs for ∼7 days in air (Fig. 4D). The rate continued to decrease to 3175 and 1899 μmol h−1 g−1 of Si as the sample was aged for ∼30 and ∼90 days, respectively. The XPS analysis of Si 2p regions showed an increase in SiO2 and Si suboxide amounts with catalyst aging (Fig. 5). Correspondingly, EDS analysis showed the atomic % oxygen to increase from 7 ± 1 in the freshly prepared mp-Si300 to 11 ± 2, 18 ± 2, and 22 ± 3% for samples aged for approximately 7, 30, and 90 days, respectively. This demonstrates that oxidation continues to occur long after the mp-Si NP synthesis and care must be taken to properly store them. The surface oxides are known to introduce trap states in nanostructured Si,44 which would deleteriously affect the catalytic activity and therefore a decline in the H2 evolution rate is observed. In the future, it would also be beneficial to report the age and storage conditions of the mp-Si photocatalysts to allow for better comparison between the different literature reports.
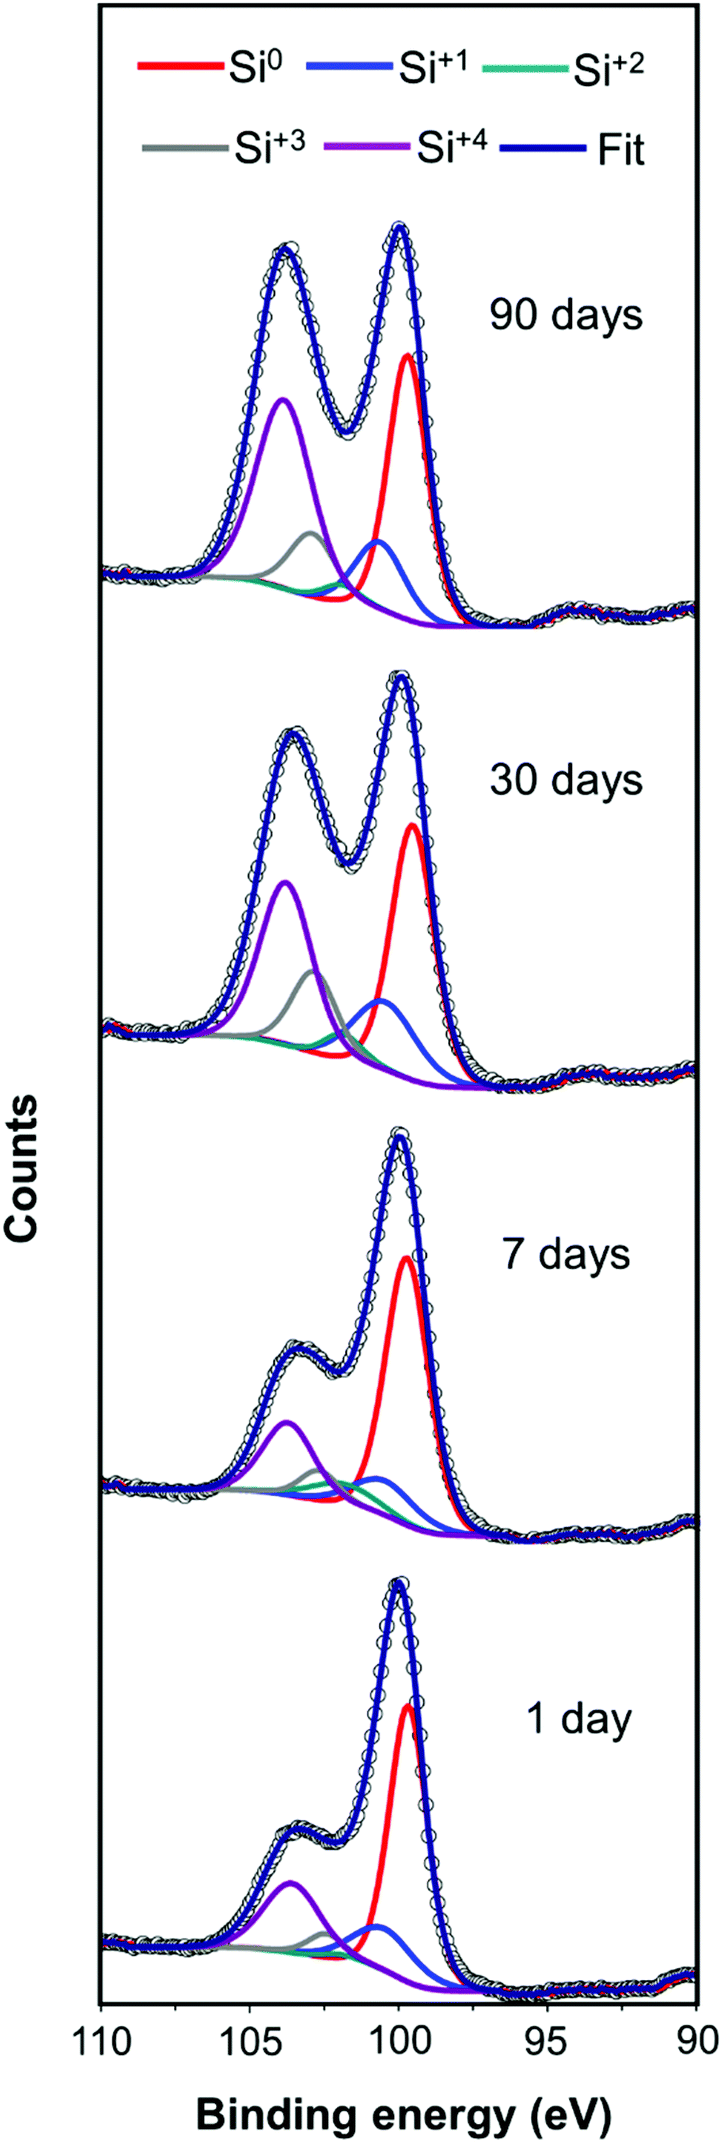 | ||
| Fig. 5 High resolution XP spectra of the Si 2p region of mp-Si300 NPs at different times after the synthesis and storage under ambient conditions. For clarity, only 2p3/2 peaks of different oxidation states are shown. | ||
Conclusions
In summary, we report the influence of magnesiothermic reduction conditions on the photocatalytic activity of mp-Si NPs. When the NPs are prepared using the conventional single temperature heating step at 650 °C for 3 h, an H2 evolution rate of 3554 μmol h−1 g−1 of Si was observed. When the reaction time was increased, the rate decreased to 983 μmol h−1 g−1 owing to the increase in particle sintering. Three sets of mp-Si NPs were prepared using a two-step heating process where the reaction was initiated at 650 °C for 0.5 h but the bulk of the reaction was performed at 100, 200, or 300 °C. Of these, mp-Si100 had the lowest H2 evolution rate of 1118 μmol h−1 g−1 of Si due to low crystallinity and high amounts of oxygen. The mp-Si200 had an H2 evolution rate of 1997 μmol h−1 g−1 of Si despite a lower amount of oxygen. It is hypothesized that the crystallinity plays an important role in determining the catalytic activity and therefore, mp-Si200 exhibited lower activity due to lesser crystallinity. The mp-Si300 NPs had the highest H2 evolution rate reported to date of 4437 μmol h−1 g−1 of Si as they had good crystallinity, low oxygen content, and minimal particle sintering. To prepare optimally performing mp-Si photocatalysts, we need to maximize crystallinity but also minimize oxidation and grain boundaries resulting from particle sintering. The mp-Si NPs were found to continue to oxidize when stored under ambient conditions which led to a decrease in the H2 evolution rate over time. Therefore, care must be taken to store the mp-Si NPs to minimize oxidation. In the future, surface protection approaches need to be developed to improve the longevity of mp-Si NPs during the photocatalytic experiments.Conflicts of interest
There is no conflict of interest to declare.Acknowledgements
The authors acknowledge funding from the Natural Sciences and Engineering Research Council of Canada (NSERC Discovery Grant # 2017-05143), Canada Foundation for Innovation JELF program, and Dalhousie University. P. Scallion, A. George, and Clean Technologies Research Institute (CTRI) are thanked for access and assistance with the SEM and XPS analysis. Dr C. Andrei and Canadian Centre for Electron Microscopy (CCEM) are thanked for assistance with TEM measurements. Drs K. Hewitt and M. Richter are thanked for their assistance with Raman and cycling measurements, respectively.References
- C. Mansilla, C. Bourasseau, C. Cany, B. Guinot, A. Le Duigou and P. Lucchese, in Hydrogen Supply Chain: Design, Deployment and Operation, ed. C. Azzaro-Pantel, Elsevier, London, 2018, ch. 7, pp. 271–292 Search PubMed.
- M. Z. Jacobson, W. G. Colella and D. M. Golden, Science, 2005, 308, 1901–1905 CrossRef CAS.
- G. W. Crabtree and M. S. Dresselhaus, MRS Bull., 2008, 33, 421–428 CrossRef CAS.
- B. Chen, Z. Liao, J. Wang, H. Yu and Y. Yang, Int. J. Hydrogen Energy, 2012, 37, 3191–3200 CrossRef CAS.
- X. Li, X. Hao, A. Abudula and G. Guan, J. Mater. Chem. A, 2016, 4, 11973–12000 RSC.
- X. Zou and Y. Zhang, Chem. Soc. Rev., 2015, 44, 5148–5180 RSC.
- I. Roger, M. A. Shipman and M. D. Symes, Nat. Rev. Chem., 2017, 1, 0003 CrossRef CAS.
- J. Joy, J. Mathew and S. C. George, Int. J. Hydrogen Energy, 2018, 43, 4804–4817 CrossRef CAS.
- T. Hisatomi, J. Kubota and K. Domen, Chem. Soc. Rev., 2014, 43, 7520–7535 RSC.
- Q. Wang and K. Domen, Chem. Rev., 2020, 120, 919–985 CrossRef CAS.
- R. C. Prince and H. S. Kheshgi, Crit. Rev. Microbiol., 2005, 31, 19–31 CrossRef CAS.
- M. L. Ghirardi, A. Dubini, J. Yu and P. C. Maness, Chem. Soc. Rev., 2009, 38, 52–61 RSC.
- C. N. R. Rao and S. Dey, Proc. Natl. Acad. Sci. U. S. A., 2017, 114, 13385–13393 CrossRef CAS.
- C. L. Muhich, B. D. Ehrhart, I. Al-Shankiti, B. J. Ward, C. B. Musgrave and A. W. Weimer, Wires Energy Environ., 2016, 5, 261–287 CrossRef CAS.
- B. A. Pinaud, J. D. Benck, L. C. Seitz, A. J. Forman, Z. Chen, T. G. Deutsch, B. D. James, K. N. Baum, G. N. Baum, S. Ardo, H. Wang, E. Miller and T. F. Jaramillo, Energy Environ. Sci., 2013, 6, 1983–2002 RSC.
- M. R. Shaner, H. A. Atwater, N. S. Lewis and E. W. McFarland, Energy Environ. Sci., 2016, 9, 2354–2371 RSC.
- P. Lv, C. Xu and B. Peng, ACS Omega, 2020, 5, 6358–6365 CrossRef CAS.
- Y. J. Jang, J. Ryu, D. Hong, S. Park and J. S. Lee, Chem. Commun., 2016, 52, 10221–10224 RSC.
- W. Ma, J. Li, H. Sun, J. Chen, D. Wang and Z. Mao, Int. J. Hydrogen Energy, 2020, 45, 19007–19016 CrossRef CAS.
- H. Sun, J. Chen, S. Liu, D. K. Agrawal, Y. Zhao, D. Wang and Z. Mao, Int. J. Hydrogen Energy, 2019, 44, 7216–7221 CrossRef CAS.
- F. Dai, J. Zai, R. Yi, M. L. Gordin, H. Sohn, S. Chen and D. Wang, Nat. Commun., 2014, 5, 1–11 Search PubMed.
- H. Song, D. Liu, J. Yang, L. Wang, H. Xu and Y. Xiong, ChemNanoMat, 2017, 3, 22–26 CrossRef CAS.
- J. Ryu, Y. J. Jang, S. Choi, H. J. Kang, H. Park, J. S. Lee and S. Park, NPG Asia Mater., 2016, 8, e248 CrossRef CAS.
- S. A. Martell, U. Werner-Zwanziger and M. Dasog, Faraday Discuss., 2020, 222, 176–189 RSC.
- S. W. Hwang, G. Park, C. Edwards, E. A. Corbin, S. K. Kang, H. Cheng, J. K. Song, J. H. Kim, S. Yu, J. Ng, J. E. Lee, J. Kim, C. Yee, B. Bhaduri, F. G. Omennetto, Y. Huang, R. Bashir, L. Goddard, G. Popescu, K. M. Lee and J. A. Rogers, ACS Nano, 2014, 8, 5843–5851 CrossRef CAS.
- C. Battaglia, A. Cuevas and S. De Wolf, Energy Environ. Sci., 2016, 9, 1552–1576 RSC.
- Q. Huang, Z. Ye and X. Xiao, J. Mater. Chem. A, 2015, 3, 15824–15837 RSC.
- R. Fan, Z. Mi and M. Shen, Opt. Express, 2019, 27, A51 CrossRef CAS.
- J. E. Entwistle, G. Beaucage and S. V. Patwardhan, J. Mater. Chem. A, 2020, 8, 4938–4949 RSC.
- S. A. Martell, Y. Lai, E. Traver, J. MacInnis, D. D. Richards, S. MacQuarrie and M. Dasog, ACS Appl. Nano Mater., 2019, 2, 5713–5719 CrossRef CAS.
- K. Nozawa, H. Gailhanou, L. Raison, P. Panizza, H. Ushiki, E. Sellier, J. P. Delville and M. H. Delville, Langmuir, 2005, 21, 1516–1523 CrossRef CAS.
- S. Musić, N. Filipović-Vinceković and L. Sekovanić, Braz. J. Chem. Eng., 2011, 28, 89–94 CrossRef.
- Y. Lai, J. R. Thompson and M. Dasog, Chem. – Eur. J., 2018, 24, 7913–7920 CrossRef CAS.
- W. Luo, X. Wang, C. Meyers, N. Wannenmacher, W. Sirisaksoontorn, M. M. Lerner and X. Ji, Sci. Rep., 2013, 3, 2222 CrossRef.
- S. Periasamy, S. Venkidusamy, R. Venkatesan, J. Mayandi, J. Pearce, J. H. Selj and R. Veerabahu, Z. Physiol. Chem., 2017, 231, 1585–1598 CAS.
- Z. Sui, P. P. Leong, I. P. Herman, G. S. Higashi and H. Temkin, Appl. Phys. Lett., 1992, 60, 2086–2088 CrossRef CAS.
- A. Dane, U. K. Demirok, A. Aydinli and S. Suzer, J. Phys. Chem. B, 2006, 110, 1137–1140 CrossRef CAS.
- T. Y. Kim, N. M. Park, K. H. Kim, G. Y. Sung, Y. W. Ok, T. Y. Seong and C. J. Choi, Appl. Phys. Lett., 2004, 85, 5355–5357 CrossRef CAS.
- A. Esser, K. Seibert, H. Kurz, G. N. Parsons, C. Wang, B. N. Davidson, G. Lucovsky and R. J. Nemanich, Phys. Rev. B: Condens. Matter Mater. Phys., 1990, 41, 2879–2884 CrossRef CAS.
- R. C. Newman, Rep. Prog. Phys., 1982, 45, 1163–1210 CrossRef.
- Z. Shen, U. Kortshagen and S. A. Campbell, J. Appl. Phys., 2004, 96, 2204–2209 CrossRef CAS.
- H. F. Mataré, J. Appl. Phys., 1984, 56, 2605–2631 CrossRef.
- C. Bohling and W. Sigmund, Silicon, 2016, 8, 339–343 CAS.
- W. Q. Huang, F. Jin, H. X. Wang, L. Xu, K. Y. Wu, S. R. Liu and C. J. Qin, Appl. Phys. Lett., 2008, 92, 221919 Search PubMed.
Footnote |
| † Electronic supplementary information (ESI) available. See DOI: 10.1039/d0nr07463b |
| This journal is © The Royal Society of Chemistry 2021 |