
 Open Access Article
 This Open Access Article is licensed under a
 Creative Commons Attribution 3.0 Unported Licence
Efficient Kr/Xe separation from triangular g-C3N4 nanopores, a simulation study†
Mohammad Tohidi
Vahdat
ab,
Davide
Campi
b,
Nicola
Colonna
 bc,
Luis Francisco
Villalobos
a,
Nicola
Marzari
*b and
Kumar Varoon
Agrawal
*a
bc,
Luis Francisco
Villalobos
a,
Nicola
Marzari
*b and
Kumar Varoon
Agrawal
*a
aLaboratory of Advanced Separations (LAS), École Polytechnique Fédérale de Lausanne (EPFL), Sion, Switzerland. E-mail: kumar.agrawal@epfl.ch
bTheory and Simulation of Materials (THEOS), National Centre for Computational Design and Discovery of Novel Materials (MARVEL), EPFL, Lausanne, Switzerland. E-mail: nicola.marzari@epfl.ch
cLaboratory for Neutron Scattering and Imaging (LSN), Paul Scherrer Institute, 5232 Villigen PSI, Switzerland
First published on 24th July 2020
Abstract
Poly(triazine imide) or PTI is a promising material for molecular sieving membranes, thanks to its atom-thick ordered lattice with an extremely high density (1.6 × 10¹⁴ pores per cm2) of triangular-shaped nanopores of ∼0.34 nm diameter. Here, we investigate the application of PTI nanopores in the purification of Kr from Xe to reduce the storage volume of the mixture of 85Kr/Xe. Using van der Waals density-functional theory (vdW-DFT) calculations, benchmarked against the random phase approximation (RPA), we calculate the potential energy profiles for Kr and Xe across the nanopores. For each gas, starting from the RPA potential-energy profile, the force-field parameters to be used in the classical restrained molecular dynamics framework are trained to calculate the Helmholtz free energy barrier as a function of temperature, and therefore, the corresponding entropic loss. Overall, due to the much higher activation energy from the adsorbed state in Xe (17.61 and 42.10 kJ per mole for Kr and Xe, respectively), a large Kr/Xe separation selectivity is postulated from the PTI membrane. Furthermore, the combination of the atom-thick PTI lattice and high pore density leads to extremely large yet selective permeances for Kr. For example, a Kr permeance of 1000 gas permeation units (GPU) accompanying a large Kr/Xe selectivity (>10![[thin space (1/6-em)]](https://www.rsc.org/images/entities/char_2009.gif) 000) is calculated at 25 °C, which is significantly better than that of the state-of-the-art membranes for Kr/Xe separation, making PTI-based membranes a leading candidate for processing the hazardous waste of 85Kr/Xe mixture.
000) is calculated at 25 °C, which is significantly better than that of the state-of-the-art membranes for Kr/Xe separation, making PTI-based membranes a leading candidate for processing the hazardous waste of 85Kr/Xe mixture.
1. Introduction
The development of materials to enable energy-efficient and straightforward processes can provide a solution to complex challenges in chemical separations. For example, an important separation challenge is purification of 85Kr from a 10/90 mixture of 85Kr/Xe, currently stored as hazardous waste.1,2 Addressing this would reduce by ten times the storage volume of 85Kr, and therefore reduce also associated risks.3,4 Moreover, Xe recovered in a pure form or with negligible 85Kr contamination can find applications in flash and arc lamps, as propellants for ion thrusters in satellites, and as general anesthetics.5–8Currently, the separation of non-hazardous Kr/Xe mixtures is carried out predominantly by cryogenic distillation, relying on the relative volatility of liquid Kr and Xe.7 When handling hazardous wastes from power plants, such as 85Kr/Xe, reducing the process footprint is desirable, and membrane-based separation becomes very attractive. Membrane separation is one of the simplest industrial processes, requiring minimal maintenance. Moreover, by developing membranes yielding a high Kr permeance (defined as pressure-normalized flux), one can further reduce the membrane area needed. Nanoporous materials, hosting pores with a gap in the electron-density appropriate for sieving Kr (that has a kinetic diameter of 3.60 Å) from Xe (kinetic diameter 3.96 Å) can achieve high separation selectivity.9–12 Recent progress in synthesizing atom-thick membranes, for example by using single-layer graphene, has made it possible to realize large but selective gas permeance.13–16 However, for effective sieving of Kr from Xe, two-dimensional nanoporous structures hosting uniform nanopores would be highly attractive. Such materials can be identified by screening databases of nanoporous materials.17–19 A review of the literature indicates that carbon nitride materials can be very attractive to reach this goal.20–22 Among them, g-C3N4 is rapidly emerging for application in catalysis,23,24 energy storage,25 sensors,26 and molecular separations.27,28 The in-plane structure of g-C3N4 hosts either a 1,3,5-triazine or a heptazine (1,3-,4,6,7,9,9b-heptaazaphenalene) building unit.29 In particular, poly(triazine imide) or PTI is quite attractive for gas separation because of its highly ordered nanoporous structure, composed of imide-bridged triazine units which form a triangular sub-nanometer-sized pore (Fig. 1).27 A remarkable aspect of the mesh-like two-dimensional (2d) structure of PTI is its high pore density, 1.6 × 10¹⁴ pores per cm2, much larger than those typically realized in other 2d nanoporous membranes (such as nanoporous single-layer graphene),30 making it promising for obtaining large permeances. The chemical and thermal robustness of PTI is also attractive for separation under harsh conditions.31
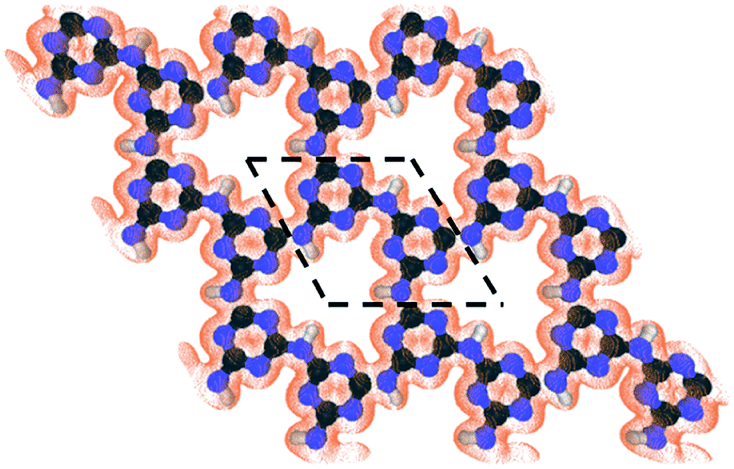 | ||
| Fig. 1 The structure of the nanoporous PTI lattice and its electron density isosurface (isovalue of 0.03 e Å−3) revealing an electron-density gap of ∼3.4 Å. The dashed lines show the PTI unit cell. | ||
Here, we investigate the performance of PTI nanopores in such useful membrane-based separation processes, employing vdW-DFT calculations, carefully benchmarked against exact exchange (EXX) plus RPA calculations, and molecular dynamics (MD) simulations. We indeed find that PTI nanopores can be very attractive for Kr/Xe separation, with selectivity exceeding 10000 at room temperature. This is accompanied by a high Kr permeance of 1000 gas permeation units or GPU (1 GPU = 3.35 × 10⁻¹⁰ mol m−2 s−1 Pa−1).
2. Computational methods
2.1 DFT
To investigate the potential energy surface of Kr and Xe, vdW-DFT calculations are performed using the Quantum ESPRESSO distribution.32,33 A 2 × 2 supercell is used to ensure the decoupling of in-plane molecule–molecule interactions. Integration over the Brillouin zone is carried out with a uniform 6 × 6 × 1 k-point grid. A vacuum region of 40 Å is employed in the z direction, to avoid interactions among periodic replicas. An energy cutoff of 60 Ry is used for the plane wave expansion of the wavefunctions. A kinetic energy cutoff of 480 Ry on the charge is used together with ultra-soft pseudopotentials.34,35 In order to carefully take into account the influence of the van der Waals (vdW) interactions, five different vdW approximations are tested: vdW-DF2,36 Grimme-D2,37 Grimme-D3,38 the revised version of the Vydrov van Voorhis functional (rVV10),39,40 and Tkatchenko–Scheffler (TS).41 Since TS is not implemented in Quantum ESPRESSO when using ultrasoft pseudopotentials, calculations with this vdW approximation are carried out with norm-conserving pseudopotentials.42 In this case, an energy cutoff of 100 Ry is used for the wave functions.2.2 EXX/RPA
Using the implementation of the ACFDT formalism available in the Quantum ESPRESSO33,43,44 distribution, we compute the total energies within exact-exchange plus the random-phase approximation. From a practical point of view, the main limitation of EXX/RPA is its computational cost, which is considerably higher than that of conventional LDA or GGA calculations. In order to use this computational-demanding method efficiently, some convergence tests are carried out (Fig. S2†); the PES of gases is studied as a function of relaxation of the gas (Fig. S2a†), supercell size (Fig. S2b†), k-point sampling (Fig. S2c†), pseudopotentials (Fig. S2d†), and cutoff values (Fig. S2e†). The PES is not affected significantly when the supercell sizes and cutoff values are reduced, and when the pseudopotential is changed. Overall, it can be concluded that EXX/RPA calculations can be performed for the systems at hand at the Γ point using a PTI unit cell size and norm-conserving pseudopotentials.2.3 Calculation of free energy profile
All classical MD simulations are carried out with the large-scale atomic/molecular massively parallel simulator (LAMMPS) package.45 The interatomic interactions are described by the general AMBER force field (GAFF).46 Partial atomic charges on PTI are considered using the AM1-BCC method.47 Kr and Xe are modelled as single center Lennard-Jones (LJ) particles. The LJ parameters used to consider non-bonded interactions, are tabulated in ESI Tables 1 and 2.† The particle–particle–particle–mesh (PPPM) is implemented to consider long-range electrostatic interactions48 and the vdW interactions are calculated within a cutoff distance of 12 Å.The dimensions of the simulation box in the x, y, and z directions are 25.9, 31.3, and 40.0 Å, respectively. The PTI lattice is placed in the x–y plane and its atoms are allowed to move in all directions except the atoms on the external edges, which were kept fixed to avoid any rigid shift of the PTI monolayer due to interactions with gases. In this way, it is ensured that the PTI sheet would not shift due to the interaction with Kr and Xe. Periodic boundary conditions are employed in all directions. For each simulation, the total energy of the system is minimized for 100000 steps. Then, the system is equilibrated in a constant number, volume and temperature (NVT) ensemble for 1 ns with a timestep of 1 fs. A Nose–Hoover thermostat is employed to control the temperature of the system.49,50
Then, in the restrained MD framework, umbrella sampling51 is used to gather enough statistics in a reasonable period of time. To overcome the energy barrier and configurations which might be inaccessible in a reasonable amount of time, a harmonic restrain with the force constant of 5 kcal mol−1 Å−1 is used every 0.5 Å. Sampling is performed for 4 ns, and trajectories are collected every picosecond. Finally, the weighted histogram analysis method (WHAM) is used to unbias and combine the distribution of gases along the translocation trajectory function and construct the Helmholtz free energy profile.52
2.4 Calculations of the concentration of occupied pores
In order to calculate the concentration of occupied pores, [COX], a simulation box with the dimensions of 25.9, 31.3, and 120.0 Å in the x, y, and z directions, respectively, is defined (Fig. S3†). We position the PTI lattice in the x–y plane at z = 60 Å, dividing the simulation box into two chambers (feed and permeate) of equal volume. In order to prevent the escape of the gas into the vacuum region due to the periodicity, a graphene layer is positioned at z = 0 as a physical barrier. To accelerate the MD simulations and gather enough statistics in the 7 ns-simulations, a gas pressure of 50 bar is used corresponding to 56 Kr or Xe atoms in the feed chamber while the permeate chamber is initially empty. In order to prevent vertical displacement of graphene and PTI, their coordinates are fixed. The trajectories of gas atoms are collected every ten picoseconds to keep track of the number of adsorbed atoms. At the end of simulations, the average number of atoms in the adsorption region is obtained to calculate [COX] (Fig. S3†).3. Results and discussion
First, the PTI lattice is relaxed to its minimum energy configuration. The optimized lattice parameters are 8.64, 8.65, 8.65, 8.64, and 8.67 Å with vdW-DF2, Grimme-D2, TS, Grimme-D3, and rVV10, respectively, in good agreement with each other. To give a heuristic representation of the electron-density gap, the isosurface of PTI at a small value of 0.03 e Å−3 is generated (Fig. 1). An equilateral-triangle-shaped nanopore can be observed, with each side measuring 9.15 Å. The nanopore can host a circle with a diameter of 3.40 Å. This pore size is attractive for the separation of light gases based on their size, especially Kr from Xe by the size-sieving mechanism because the kinetic diameter of Kr is closer to the nanopore size. To investigate the adsorption behavior of gases on the porous PTI monolayer, a constrained relaxation is carried out. The gas is placed at several positions away from the sheet and the mass center of the gas is fixed in the z direction (perpendicular to the sheet); the gas still has the freedom to relax in x and y directions to minimize the potential energy at a given distance from the PTI monolayer in the z direction. Since the potential energy surface (PES) for Kr and Xe are simple enough (Kr and Xe are just one single atom), it is not required to perform Nudge elastic band calculations. The convergence threshold on the total energy is 2 × 10⁻⁶ Ry and this criterion on forces is equal to 10−4 Ry/a.u. The minimum PES for different gases passing through the PTI monolayer is explored by calculating the interactions energy with the PTI film as:| Eint = Emolecule+PTI − Emolecule − EPTI | (1) |
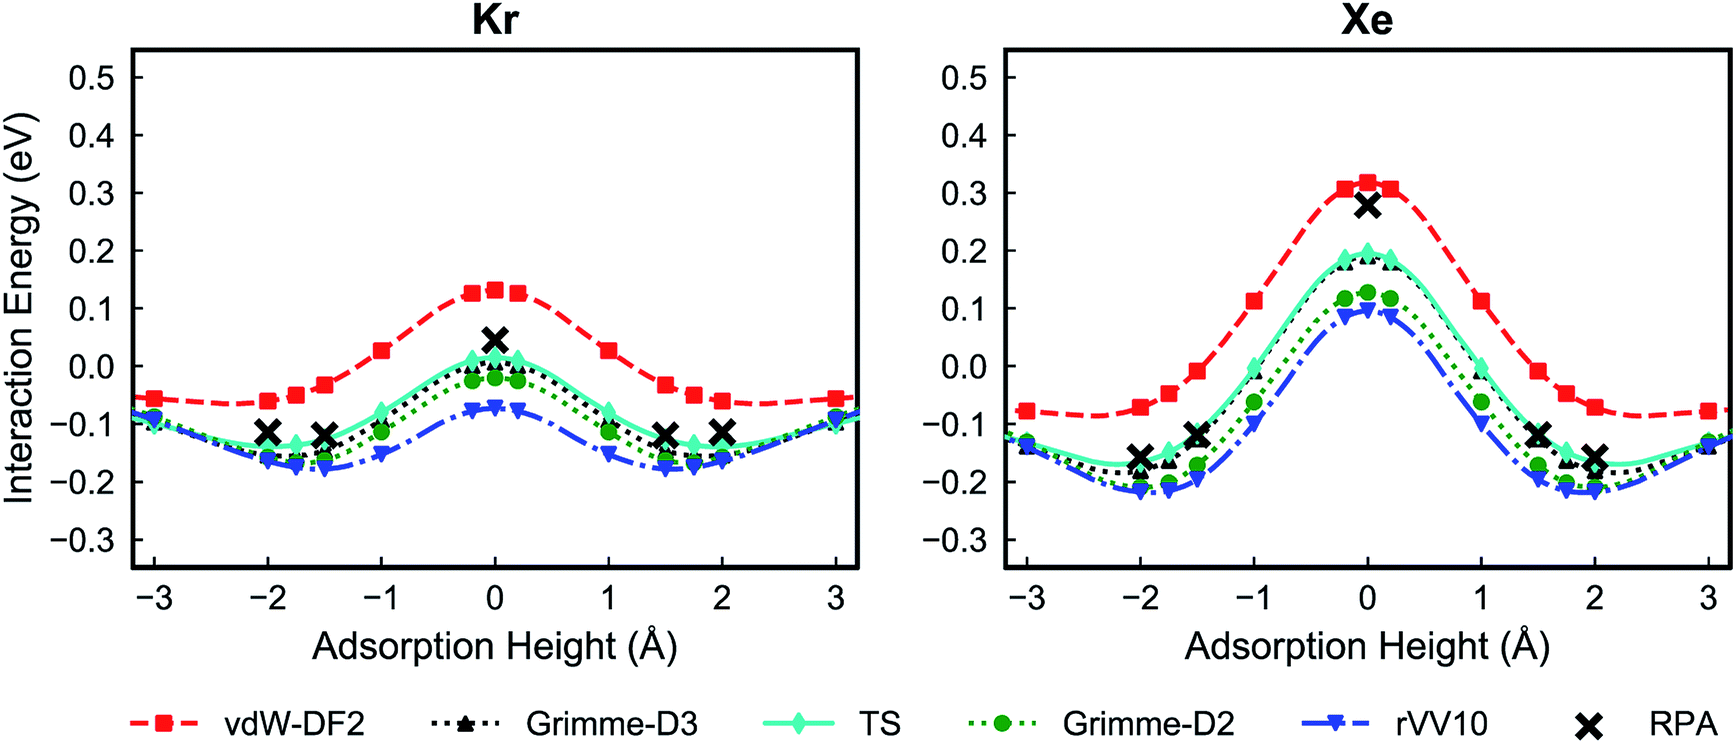
Fig. 2 shows the PES for Kr and Xe obtained using the five considered vdW approximations. In order to make sure that the PTI monolayer does not shift rigidly due to the interactions with gases, the atoms on the edge of the PTI plane are kept fixed. It is worth emphasizing that during these calculations all the PTI monolayer atoms (except the atoms on the edge of the plane) are free to move and relax. When the PTI lattice is treated as a rigid lattice, the PES profile did not change by a considerable amount (Fig. S1†), indicating that the PTI lattice is reasonably rigid. The results indicate that the Kr adsorption energy in the middle of the pore (Eads, defined as the maximum attractive interaction energy when z ≠ 0) is in the range of −0.06 to −0.17 eV, and the adsorption height from the PTI plane is in the range of 1.60–2.00 Å. Xe adsorption energy is in the range of −0.07 to −0.22 eV, and the adsorption height in the range of 1.80 to 2.50 Å. The resulting activation barriers to translocate the nanopore (Eact, defined as the difference in the interaction energy at z = 0 and Eads) for Kr and Xe are in the range of 0.14 to 0.22 eV, and 0.37 to 0.46 eV, respectively. In all cases, Eact for Xe is higher than that for Kr (Table 1). The discrepancy between the vdW approximations is more apparent in Eads than in Eact.
| E ads (eV) | Adsorption height (Å) | E act (eV) | ||||
|---|---|---|---|---|---|---|
| Kr | Xe | Kr | Xe | Kr | Xe | |
| vdW-DF2 | −0.06 | −0.07 | 2.0 | 2.5 | 0.22 | 0.46 |
| Grimme-D3 | −0.15 | −0.18 | 1.7 | 2.0 | 0.19 | 0.43 |
| TS | −0.14 | −0.17 | 1.8 | 2.0 | 0.18 | 0.41 |
| Grimme-D2 | −0.16 | −0.21 | 1.7 | 1.9 | 0.17 | 0.40 |
| rVV10 | −0.17 | −0.22 | 1.6 | 1.8 | 0.14 | 0.37 |
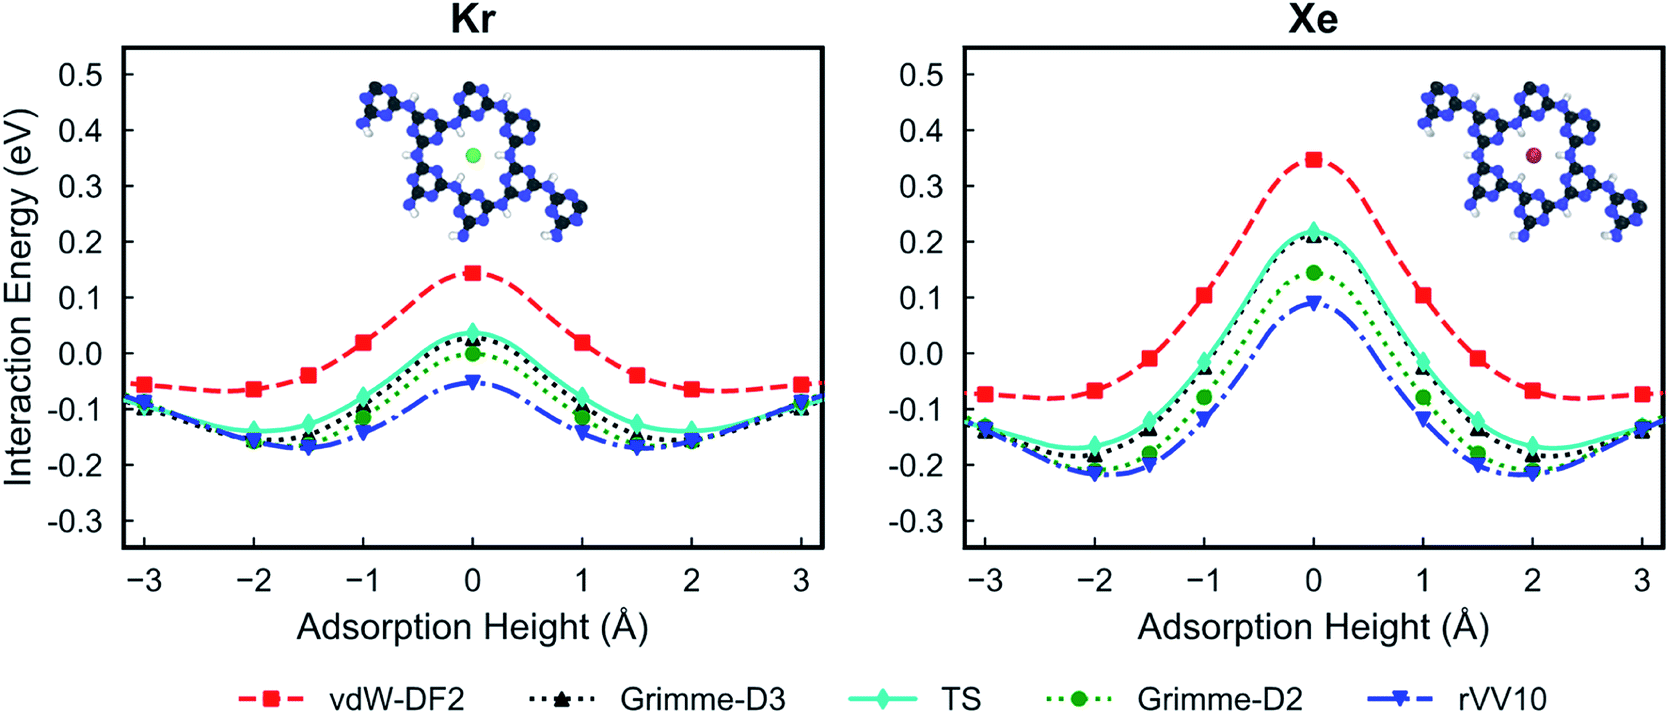 | ||
| Fig. 2 Potential energy surfaces of Kr (left) and Xe (right) for the PTI lattice using different van der Waals functionals: vdW-DF2,32 Grimme-D2,33 Grimme-D3,34 rVV10,35,36 and TS.37 A height of 0 Å corresponds to the plane of PTI. | ||
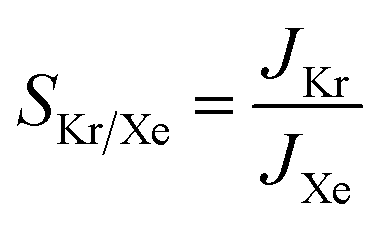
To understand the effects of the vdW approximations on the sieving performance, the Arrhenius relationship for activation energies is used to calculate Kr/Xe selectivities, assuming that the translocation of the PTI nanopore would be the rate limiting step after the gases are adsorbed on the PTI lattice.53 The selectivity based on the Arrhenius equation is defined in eqn (2):
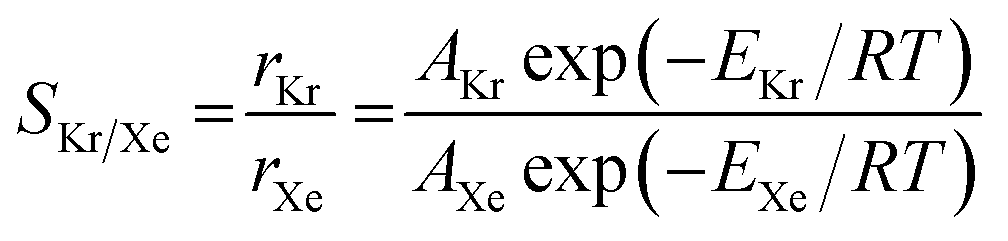 | (2) |
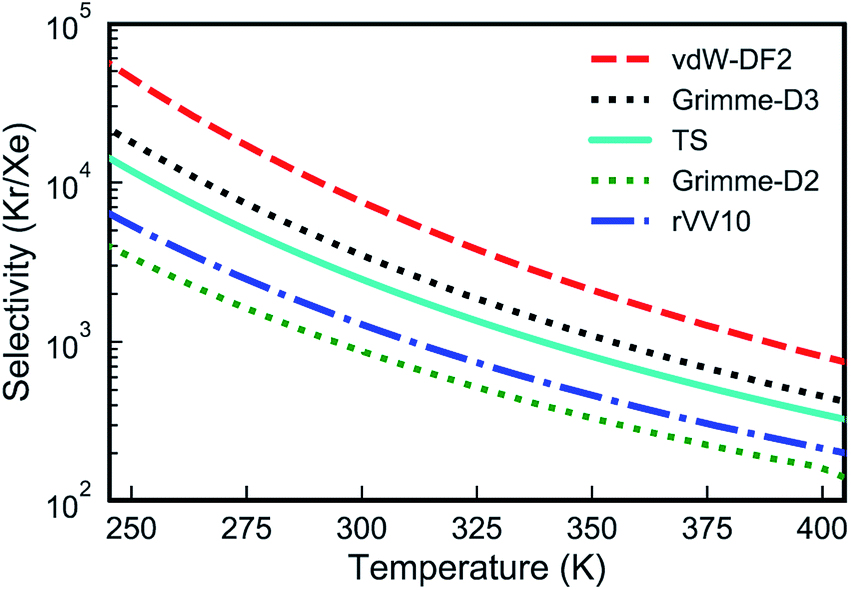 | ||
| Fig. 3 Kr/Xe selectivities from the PTI lattice as a function of temperature calculated with several van der Waals approximations. | ||
Overall, all vdW approximations predict a high Kr/Xe separation selectivity, above 100 in all cases in the temperature range of 250–400 K (Fig. 3). Selectivities increase when the temperature is reduced, since Xe encounters a higher activation energy than Kr.
Despite the fact that all the vdW-DFT calculations give the same qualitative result, selectivities obtained with different functionals can differ quite dramatically, with room-temperature values spanning a wide range that goes from 875 for Grimme-D2 to 7550 for vdW-DF2 (Fig. 3). Properly capturing vdW interactions with density-functional theory is complex and a relatively recent endeavor that still represents a challenging problem.55 In order to have a higher-level description of van der Waals interactions, crucial to determine the gas-PTI monolayer interaction, and to have a qualitative estimation of the selectivity, for the first time, we evaluated the energetics of the PTI complexes in the framework of adiabatic-connection fluctuation dissipation theory (ACFDT),56,57 allowing a better understanding of the performances of different vdW approximations for these systems. The EXX/RPA method has been proved to correctly capture vdW correlations,58,59 and e.g., the results of physisorption binding energies between different types of molecules and surfaces show an excellent agreement with the values measured by experiments.60–66
The RPA/EXX results reveal that the Grimme-D2, Grimme-D3 and TS approximations yield a good agreement PES (Fig. 4). The calculations show that vdW-DF2 overestimates the adsorption energy and on the other hand rVV10 underestimates the adsorption energy.
 | ||
| Fig. 4 Potential energy surfaces of Kr (left) and Xe (right) with several van der Waals approximations in comparison to the results calculated by EXX/RPA. Here, potential energy surfaces calculated with vdW-DFT are obtained with same parameters as EXX/RPA (sampling at Γ point and using a PTI unit cell size and norm-conserving pseudopotentials). | ||
In absolute terms, the discrepancies with RPA appear to be larger for the two non-local functionals (rVV10 and vdW-DF2). This might suggest that the models for the effective polarizability of the two functionals, sharing an isotropic dependence on the charge density gradient, might give unprecise results in highly anisotropic configurations like gas-membrane interacting systems. However, further study is needed in order to elucidate this point. A minor role could also be played by the many-body interactions, fully included in RPA, partially included in Grimme-D3 through a three-body term and absent in the other approximations.67
The transport of gases through two-dimensional nanopores can take place via direct gas phase transport or adsorbed-phase transport.13,68 Attributing to the small nanopores of PTI, the gas transport is expected to proceed predominantly via the adsorbed-phase transport mechanism, where gas first adsorbs on the lattice, transport to the pore mouth in the adsorbed state, and finally arrive at the rate-limiting transition state at the center of the pore. Overall the gas pair selectivity is determined by the adsorption energy and relative size of the atoms/molecules with respect to the size of the nanopore. In the present case, based on the relative size of Kr (kinetic diameter of 3.6 Å) and Xe (kinetic diameter of 3.96 Å) with respect to PTI nanopore (3.4 nm), it is expected that size-sieving is the predominant separation mechanism.69 However, while the vdW-DFT calculations reveal that PTI nanopores are promising for sieving Kr from Xe by the size-sieving mechanism, the selectivity calculations do not take entropic effects into account (loss of entropy of the gas in the adsorbed phase and in the transition state with respect to that in the gas phase). The calculations of entropic loss, for example using an enhanced method like umbrella sampling in the framework of classical MD simulations, allow one to accurately predict the gas permeance using a gas transport model across 2d nanopores, as e.g., recently proposed by Strano and co-workers,53,68 and more recently by Blankschtein and co-workers.69 A unique advantage of this route is that one can avoid unaffordable long MD simulations to track the passage of gases. This is especially relevant when the activation barriers are high, making translocation of gases a rare event.
In this study, the LJ parameters are trained such that the resulting PES in the classical MD framework agrees with those from the RPA calculations (Fig. 5a and b).
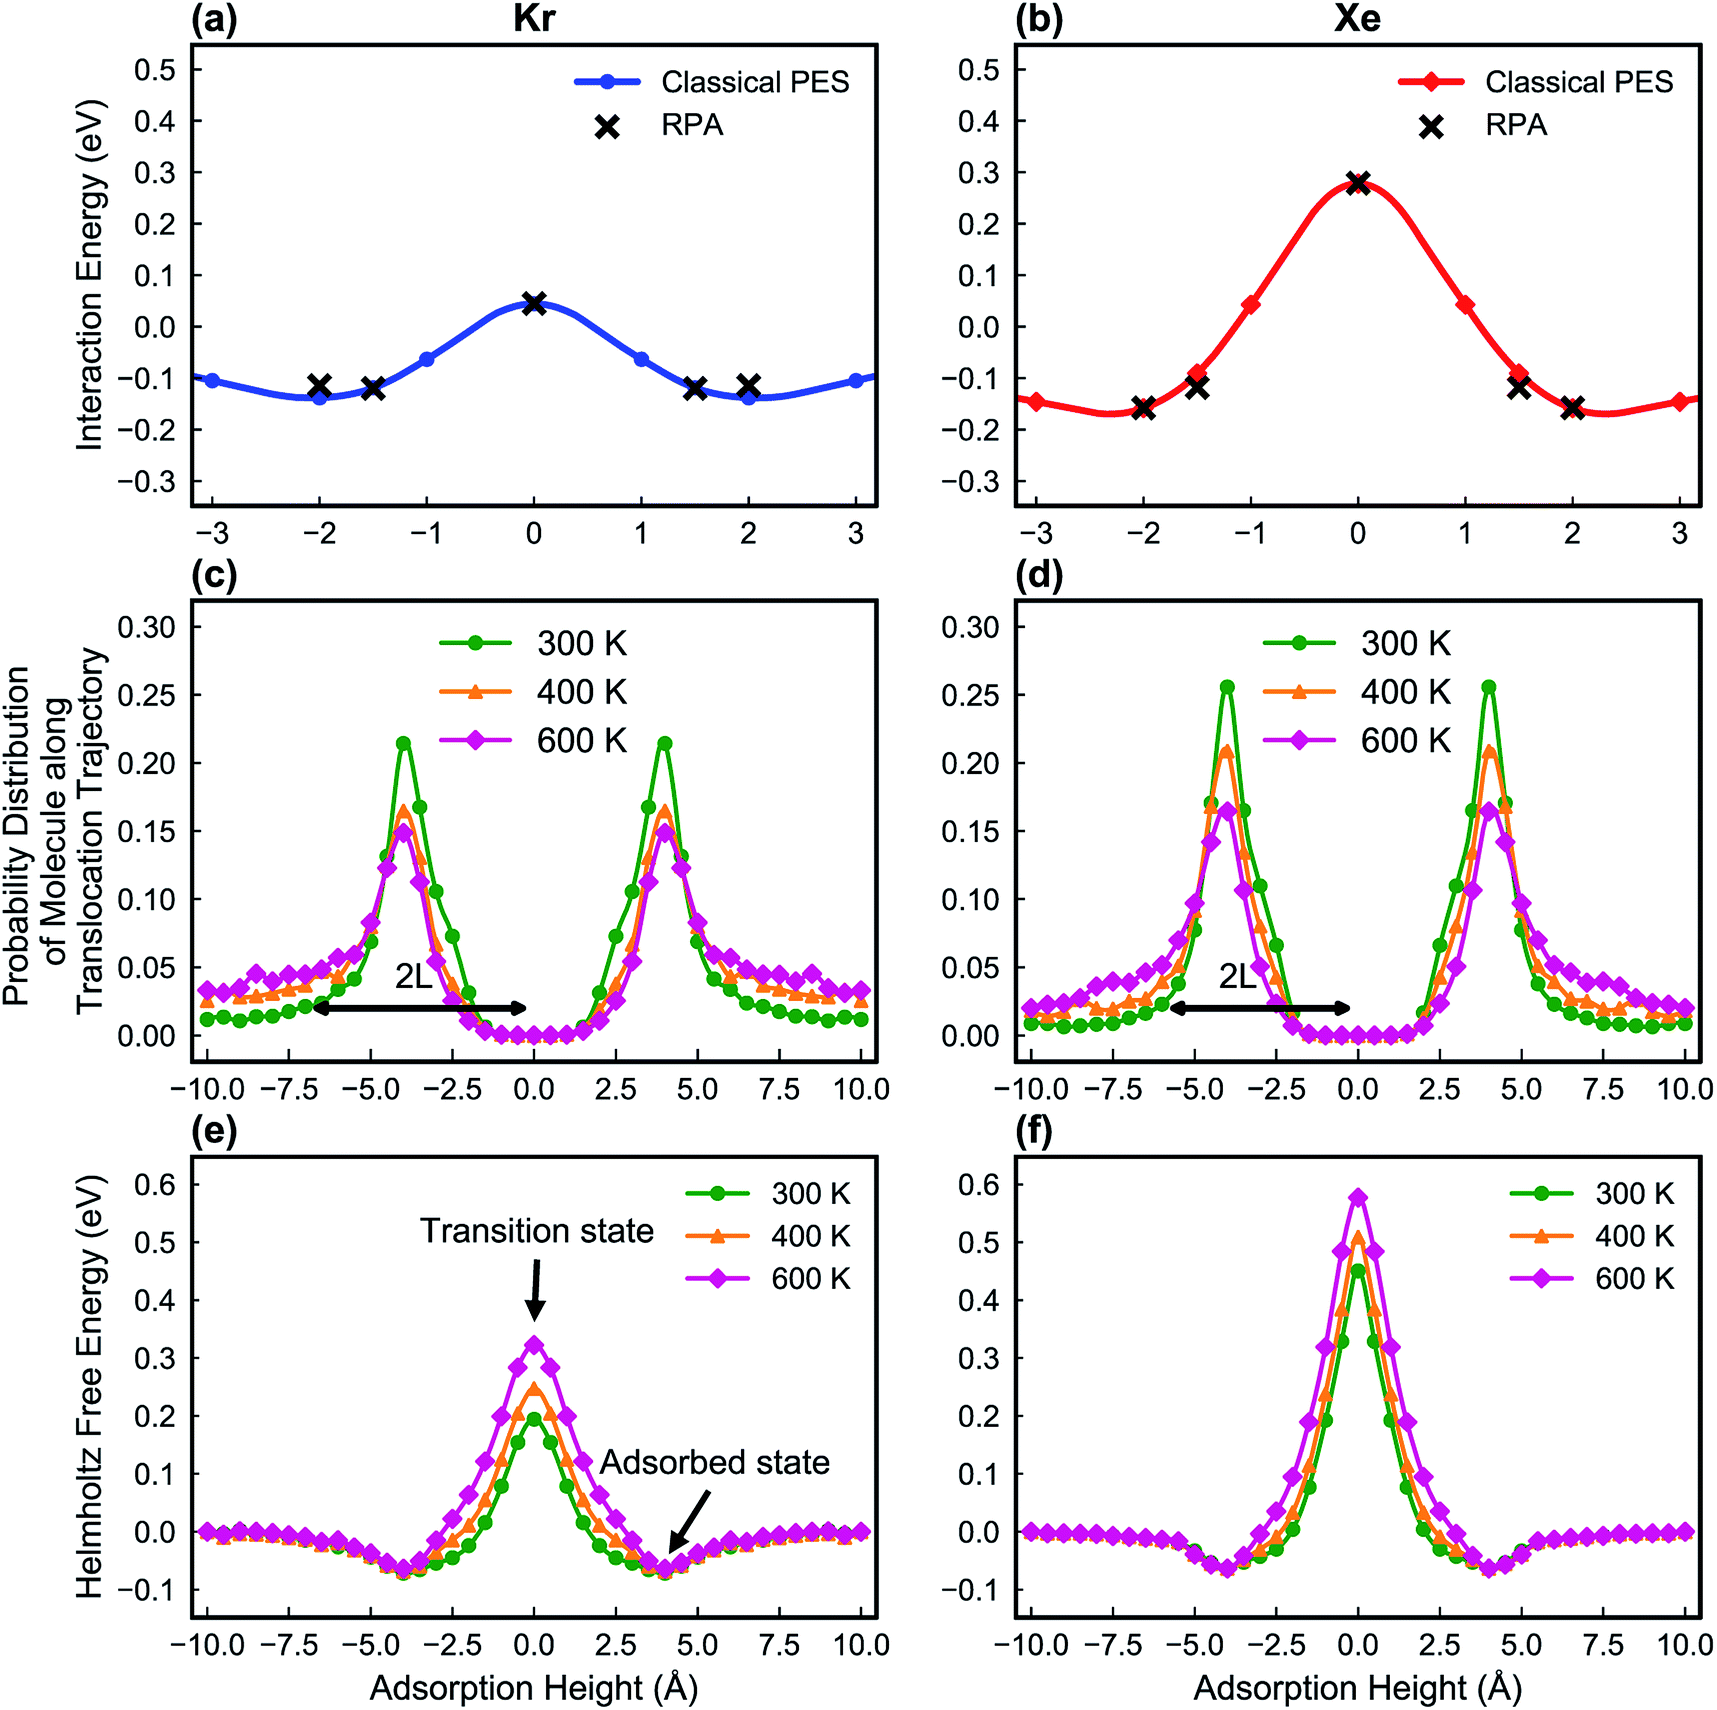 | ||
| Fig. 5 The potential energy surfaces of Kr (a) and Xe (b) on a PTI monolayer, obtained with classical MD simulations to find out the best LJ parameters for Kr and Xe. The LJ parameters are trained in such a way that the potential energy surface shows a good agreement with the RPA results. The probability distribution of Kr (c) and Xe (d) along the translocation trajectories. Corresponding L (half-peak width of the probability distribution function) is shown. The Helmholtz free energy profile of Kr (e) and Xe (f) on a PTI lattice calculated with the umbrella sampling method at three different temperatures (300, 400 and 600 K) in the classical MD framework. | ||
Fig. 5e and f show the calculated Helmholtz free energy profiles for Kr and Xe interacting with the PTI lattice at three different temperatures. The free energy barrier for both gases to translocate PTI nanopores increases with temperature. The barrier for Xe is larger than that for Kr, consistent with earlier observation from the vdW-DFT calculations.
In molecular transport across a nanoporous layer, it is well-established that when the interaction of a molecule at the center of the pore is repulsive, the corresponding transition state is the rate limiting step. Therefore, the translocation rate can be determined by measuring the rate of molecules crossing the transition state (kTSTtrans). To calculate the rate of gases crossing the transition state, an Arrhenius-type equation can be used, and parameters of such a model can be obtained using the transition state theory:70,71
 | (3) |
 | (4) |
| ΔF = ΔE − TΔS | (5) |
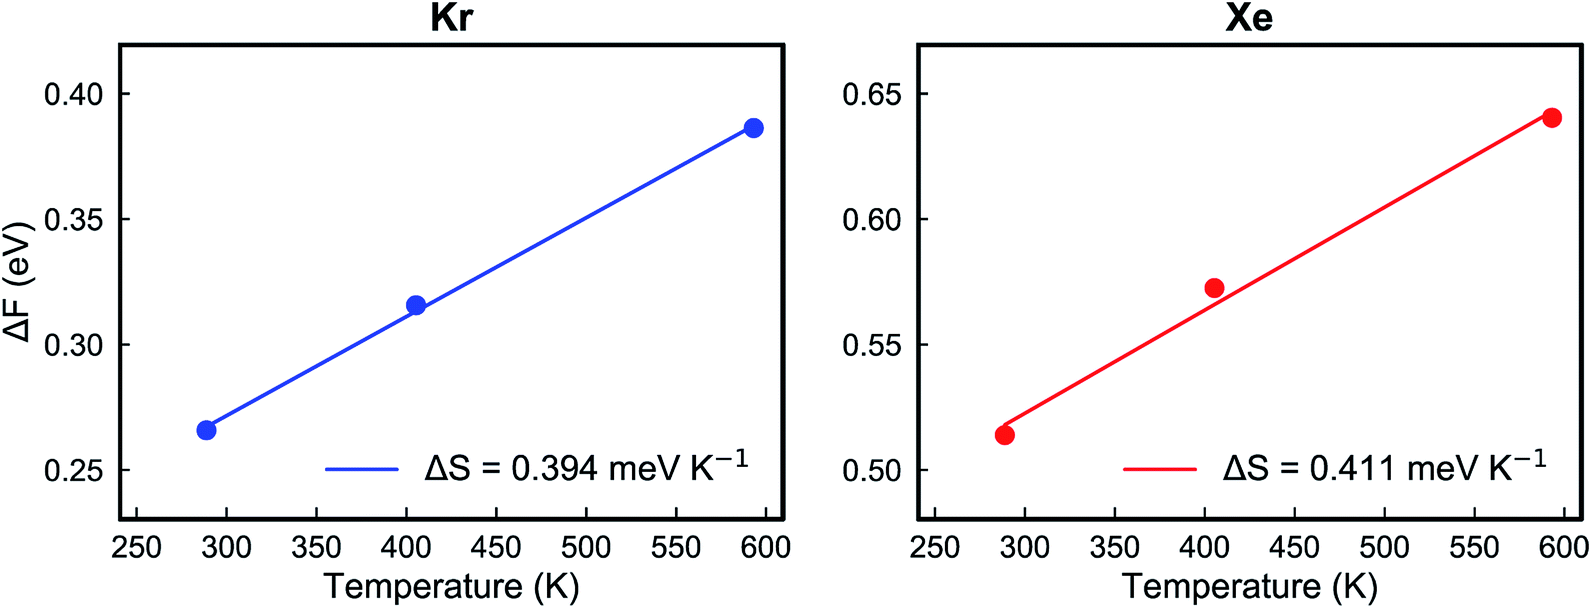 | ||
| Fig. 6 The Helmholtz free energy changes of Kr (left) and Xe (right) at different temperatures when the gas arrives at the transition state from the adsorbed state. | ||
| Kr | Xe | |
|---|---|---|
| Adsorption | ||
| [COx] (mol m−2) | 9.6 × 10⁻⁷ | 1.1 × 10⁻⁶ |
|
||
| Translocation through nanopore | ||
| ΔE (kJ mol−1) | 17.6 | 42.1 |
| ΔS (J mol−1 K−1) | 38.0 | 39.7 |
| A TSTtrans (s−1) | 2.0 × 10⁹ | 1.5 × 10⁹ |
| k TSTtrans (s−1) | 1.7 × 10⁶ | 72.0 |
| Permeance (GPU) | 1000 | 0.05 |
Once kTSTtrans is known, the gas flux can be obtained as:
| J = kTSTtrans[COX] | (6) |
| X + O ⇔ OX | (7) |
 | (8) |
The key parameters related to adsorption and translocation of Kr and Xe are summarized in Table 2. Briefly, the concentration of adsorbed atoms corresponds to site occupancy of 37 and 41% for Kr and Xe, respectively. This sub-monolayer adsorption at a high pressure of 50 bar is expected for the noble gases. The adsorption of gas atoms sets the stage for the translocation event during which the adsorbed gas loses entropy. Since the pre-exponential factor, ATSTtrans, is an exponential function of entropy loss (eqn (3)), it decreases from the typical 1013 s−1 to 2.0 × 10⁹ and 1.5 × 10⁹ s−1 for Kr and Xe, respectively. Despite this, thanks to the presence of a single transition state in the translocation of the gases across the atom-thick PTI nanosheets, a high Kr permeance of 1000 GPU at 300 K is obtained. Owing to the relatively high activation energy for Xe to translocate the PTI nanopore, Xe permeance is low (0.05 GPU), leading to a selectivity of 20000.
Overall, the calculated Kr permeance (1000 GPU) and Kr/Xe selectivity (20000) from PTI at room temperature is significantly better than those from the state-of-the-art membranes demonstrated for Kr/Xe separation. Typically, selectivities in the range of 6–45 and Kr permeance in the range of 20–450 GPU have been reported. For example, 2–5 μm thick silicoaluminophosphate-34 (SAPO-34, chabazite zeolite) films hosting a nominal pore size of 0.38 nm could separate Kr/Xe with a selectivity of 23 and Kr permeance up to 26 GPU.1 Another study using 3-μm-thick SAPO-34 membranes yielded Kr permeance of 360 GPU and selectivity of 45 which is the best reported membrane performance to date.9 The lower selectivity in the case of SAPO-34, with respect to that predicted from PTI membrane, can be attributed to relatively lower energy barrier of Xe to transport across 0.38 nm sized SAPO-34 pores compared to 0.34 nm sized PTI pores. Similarly, using another nanoporous material with a pore size of 0.38 nm (aluminophosphate-18 or AlPO-18), only a small Kr/Xe selectivity of 6.4 could be obtained.10 The separation of Kr/Xe with nanoporous materials hosting smaller pores (0.34 nm) has also been attempted, involving zeolitic imidazolate framework-8 or ZIF-8 membranes. However, owing to the lattice flexibility of ZIF-8, which tends to accommodate larger molecules in ZIF-8, a small selectivity of 14.2 was realized.11
The extremely high Kr/Xe selectivity from PTI nanopore makes it especially attractive for the separation of 85Kr from a 10/90 mixture of 85Kr/Xe, targeting near pure 85Kr and Xe streams using a PTI membrane. This will allow one to safely use the purified Xe for commercial applications. The recent development in obtaining single-layer PTI nanosheets72 will allow one to fabricate a few nanometer thick films, similar to what has been achieved in the case of graphene and metal–organic framework (MOF) nanosheet-based membranes.73,74
4 Conclusions
This study reveals the high potential of PTI-based membrane, thanks to ∼0.34 nm-sized nanopores, for separation of Kr/Xe mixtures. In order to ensure accurate predictions on gas selectivity, which are critically influenced by small changes in the adsorption and the activation energies, we performed an extensive comparison of several vdW-corrected functionals within DFT and benchmarked them against accurate, reference EXX/RPA calculations. We highlight that differences in commonly used vdW functionals can lead to dramatic changes in selectivity measurements, raising accuracy concerns for some of these that require further care of practitioners in the field. In order to consider finite-temperature effects, the entropic contribution in the transition state has been determined from Helmholtz free energy calculations at different temperatures, obtained with restrained MD simulations where the force-field parameters have been trained on the EXX/RPA potential-energy profile. Finally, gas permeances are predicted by calculating the translocation coefficient from single-layer PTI using transition-state theory. We obtain, from our simulations, a Kr/Xe separation factor exceeding 10000 at room temperature, which would allow one to obtain nearly pure 85Kr and Xe streams.
Overall, the method developed here, vdW-DFT calculations benchmarked against EXX/RPA calculations to predict the energy barrier and entropic penalties for gas translocation across a nanopore, can be applied to a diverse set of two-dimensional nanoporous films, e.g., nanoporous graphene, C2N, polyheptazine imide, etc., for calculating the molecular separation performance. Apart from the high accuracy, the method used here to predict permeance is also attractive in comparison to the classical MD simulations when the energy barrier for the translocation event of at least one component is high enough to make the permeation a rare event, in which case, one has to conduct time-consuming and expensive long MD simulation trials.
Conflicts of interest
There are no conflicts to declare.Acknowledgements
We thank our host institution, EPFL, for the generous support. Parts of the work were funded by the Swiss National Science Foundation (Assistant Professor Energy Grant; grant number PYAPP2_173645) and the Swiss Competence Center for Energy Research: Efficiency of Industrial Processes (SCCER-EIP). We thank the Swiss National Supercomputing Center, CSCS, for the allocation of computing resources (production projects s860 and s953). D. C. and N. M. acknowledge support from the MARVEL NCCR. D. C. acknowledges support from the EPFL Fellows program co-funded by Marie Sklodowska-Curie, Horizon 2020 grant agreement no. 66566.References
- Y. H. Kwon, B. Min, S. Yang, D.-Y. Koh, R. R. Bhave and S. Nair, ACS Appl. Mater. Interfaces, 2018, 10, 6361–6368 CrossRef CAS PubMed.
- D. Banerjee, C. M. Simon, A. M. Plonka, R. K. Motkuri, J. Liu, X. Chen, B. Smit, J. B. Parise, M. Haranczyk and P. K. Thallapally, Nat. Commun., 2016, 7, 11831–11837 CrossRef PubMed.
- P. Paviet-Hartmann, W. Kerlin and S. Bakhtiar, Treatment of gaseous effluents issued from recycling – a review of the current practices and prospective improvements, United States, N. p., 2010 Search PubMed.
- Y. Hye Kwon, C. Kiang, E. Benjamin, P. Crawford, S. Nair and R. Bhave, AIChE J., 2017, 63, 761–769 CrossRef CAS.
- S. Yeralan, D. Doughty, R. Blondia and R. Hamburger, Proc. SPIE 5740, Projection Displays XI, 10 April 2005 Search PubMed.
- P. W. Hoff, J. C. Swingle and C. K. Rhodes, Appl. Phys. Lett., 1973, 23, 245–246 CrossRef CAS.
- L. Chen, P. S. Reiss, S. Y. Chong, D. Holden, K. E. Jelfs, T. Hasell, M. A. Little, A. Kewley, M. E. Briggs, A. Stephenson, K. M. Thomas, J. A. Armstrong, J. Bell, J. Busto, R. Noel, J. Liu, D. M. Strachan, P. K. Thallapally and A. I. Cooper, Nat. Mater., 2014, 13, 954–960 CrossRef CAS PubMed.
- T. F. Holsträter, M. Georgieff, K. J. Föhr, W. Klingler, M. E. Uhl, T. Walker, S. Köster, G. Grön and O. Adolph, Anesthesiology, 2011, 115, 398–407 CrossRef PubMed.
- X. Feng, Z. Zong, S. K. Elsaidi, J. B. Jasinski, R. Krishna, P. K. Thallapally and M. A. Carreon, J. Am. Chem. Soc., 2016, 138, 9791–9794 CrossRef CAS PubMed.
- T. Wu, J. Lucero, Z. Zong, S. K. Elsaidi, P. K. Thallapally and M. A. Carreon, ACS Appl. Nano Mater., 2018, 1, 463–470 CrossRef CAS.
- T. Wu, X. Feng, S. K. Elsaidi, P. K. Thallapally and M. A. Carreon, Ind. Eng. Chem. Res., 2017, 56, 1682–1686 CrossRef CAS.
- R. Anderson, B. Schweitzer, T. Wu, M. A. Carreon and D. A. Gómez-Gualdrón, ACS Appl. Mater. Interfaces, 2018, 10, 582–592 CrossRef CAS PubMed.
- M. S. H. Boutilier, C. Sun, S. C. O'Hern, H. Au, N. G. Hadjiconstantinou and R. Karnik, ACS Nano, 2014, 8, 841–849 CrossRef CAS PubMed.
- Z. Yuan, J. D. Benck, Y. Eatmon, D. Blankschtein and M. S. Strano, Nano Lett., 2018, 18, 5057–5069 CrossRef CAS PubMed.
- S. Huang, M. Dakhchoune, W. Luo, E. Oveisi, G. He, M. Rezaei, J. Zhao, D. T. L. Alexander, A. Züttel, M. S. Strano and K. V. Agrawal, Nat. Commun., 2018, 9, 2632–2642 CrossRef PubMed.
- J. Zhao, G. He, S. Huang, L. F. Villalobos, M. Dakhchoune, H. Bassas and K. V. Agrawal, Sci. Adv., 2019, 5, eaav1851 CrossRef CAS PubMed.
- C. M. Simon, R. Mercado, S. K. Schnell, B. Smit and M. Haranczyk, Chem. Mater., 2015, 27, 4459–4475 CrossRef CAS.
- B. J. Sikora, C. E. Wilmer, M. L. Greenfield and R. Q. Snurr, Chem. Sci., 2012, 3, 2217–2223 RSC.
- N. Mounet, M. Gibertini, P. Schwaller, D. Campi, A. Merkys, A. Marrazzo, T. Sohier, I. E. Castelli, A. Cepellotti, G. Pizzi and N. Marzari, Nat. Nanotechnol., 2018, 13, 246–252 CrossRef CAS.
- J. Mahmood, E. K. Lee, M. Jung, D. Shin, I. Y. Jeon, S.-M. Jung, H.-J. Choi, J.-M. Seo, S.-Y. Bae, S.-D. Sohn, N. Park, J. H. Oh, H.-J. Shin and J.-B. Baek, Nat. Commun., 2015, 6, 6486–6492 CrossRef CAS.
- S. Yang, W. Li, C. Ye, G. Wang, H. Tian, C. Zhu, P. He, G. Ding, X. Xie, Y. Liu, Y. Lifshitz, S.-T. Lee, Z. Kang and M. Jiang, Adv. Mater., 2017, 29, 1605625–1605631 CrossRef PubMed.
- B. Xu, H. Xiang, Q. Wei, J. Q. Liu, Y. D. Xia, J. Yin and Z. G. Liu, Phys. Chem. Chem. Phys., 2015, 17, 15115–15118 RSC.
- X. Wang, K. Maeda, A. Thomas, K. Takanabe, G. Xin, J. M. Carlsson, K. Domen and M. Antonietti, Nat. Mater., 2009, 8, 76–80 CrossRef CAS PubMed.
- W.-J. Ong, L.-L. Tan, Y. H. Ng, S.-T. Yong and S.-P. Chai, Chem. Rev., 2016, 116, 7159–7329 CrossRef CAS PubMed.
- W.-B. Luo, S.-L. Chou, J.-Z. Wang, Y.-C. Zhai and H.-K. Liu, Small, 2015, 11, 2817–2824 CrossRef CAS PubMed.
- D. Das, S. L. Shinde and K. K. Nanda, ACS Appl. Mater. Interfaces, 2016, 8, 2181–2186 CrossRef CAS PubMed.
- L. F. Villalobos, M. T. Vahdat, M. Dakhchoune, Z. Nadizadeh, M. Mensi, E. Oveisi, D. Campi, N. Marzari and K. V. Agrawal, Sci. Adv., 2020, 6, eaay9851 CrossRef PubMed.
- Y. Wang, L. Li, Y. Wei, J. Xue, H. Chen, L. Ding, J. Caro and H. Wang, Angew. Chem., 2017, 56, 8974–8980 CrossRef CAS PubMed.
- F. K. Kessler, Y. Zheng, D. Schwarz, C. Merschjann, W. Schnick, X. Wang and M. J. Bojdys, Nat. Rev. Mater., 2017, 2, 17030–17046 CrossRef CAS.
- G. He, S. Huang, L. F. Villalobos, J. Zhao, M. Mensi, E. Oveisi, M. Rezaei and K. V. Agrawal, Energy Environ. Sci., 2019, 12, 3305–3312 RSC.
- E. Wirnhier, M. Döblinger, D. Gunzelmann, J. Senker, B. V. Lotsch and W. Schnick, Chem. – Eur. J., 2011, 17, 3213–3321 CrossRef CAS PubMed.
- P. Giannozzi, S. Baroni, N. Bonini, M. Calandra, R. Car, C. Cavazzoni, D. Ceresoli, G. L. Chiarotti, M. Cococcioni, I. Dabo, A. Dal Corso, S. De Gironcoli, S. Fabris, G. Fratesi, R. Gebauer, U. Gerstmann, C. Gougoussis, A. Kokalj, M. Lazzeri, L. Martin-Samos, N. Marzari, F. Mauri, R. Mazzarello, S. Paolini, A. Pasquarello, L. Paulatto, C. Sbraccia, S. Scandolo, G. Sclauzero, A. P. Seitsonen, A. Smogunov, P. Umari and R. M. Wentzcovitch, J. Phys.: Condens. Matter, 2009, 21, 395502–395520 CrossRef PubMed.
- P. Giannozzi, O. Andreussi, T. Brumme, O. Bunau, M. Buongiorno Nardelli, M. Calandra, R. Car, C. Cavazzoni, D. Ceresoli, M. Cococcioni, N. Colonna, I. Carnimeo, A. Dal Corso, S. de Gironcoli, P. Delugas, R. A. DiStasio, A. Ferretti, A. Floris, G. Fratesi, G. Fugallo, R. Gebauer, U. Gerstmann, F. Giustino, T. Gorni, J. Jia, M. Kawamura, H.-Y. Ko, A. Kokalj, E. Küçükbenli, M. Lazzeri, M. Marsili, N. Marzari, F. Mauri, N. L. Nguyen, H.-V. Nguyen, A. Otero-de-la-Roza, L. Paulatto, S. Poncé, D. Rocca, R. Sabatini, B. Santra, M. Schlipf, A. P. Seitsonen, A. Smogunov, I. Timrov, T. Thonhauser, P. Umari, N. Vast, X. Wu and S. Baroni, J. Phys.: Condens. Matter, 2017, 29, 465901–465930 CrossRef CAS PubMed.
- K. Lejaeghere, G. Bihlmayer, T. Bjorkman, P. Blaha, S. Blugel, V. Blum, D. Caliste, I. E. Castelli, S. J. Clark, A. Dal Corso, S. de Gironcoli, T. Deutsch, J. K. Dewhurst, I. Di Marco, C. Draxl, M. Du ak, O. Eriksson, J. A. Flores-Livas, K. F. Garrity, L. Genovese, P. Giannozzi, M. Giantomassi, S. Goedecker, X. Gonze, O. Granas, E. K. U. Gross, A. Gulans, F. Gygi, D. R. Hamann, P. J. Hasnip, N. A. W. Holzwarth, D. Iu an, D. B. Jochym, F. Jollet, D. Jones, G. Kresse, K. Koepernik, E. Kucukbenli, Y. O. Kvashnin, I. L. M. Locht, S. Lubeck, M. Marsman, N. Marzari, U. Nitzsche, L. Nordstrom, T. Ozaki, L. Paulatto, C. J. Pickard, W. Poelmans, M. I. J. Probert, K. Refson, M. Richter, G.-M. Rignanese, S. Saha, M. Scheffler, M. Schlipf, K. Schwarz, S. Sharma, F. Tavazza, P. Thunstrom, A. Tkatchenko, M. Torrent, D. Vanderbilt, M. J. van Setten, V. Van Speybroeck, J. M. Wills, J. R. Yates, G.-X. Zhang and S. Cottenier, Science, 2016, 351, aad3000 CrossRef PubMed.
- G. Prandini, A. Marrazzo, I. E. Castelli, N. Mounet and N. Marzari, npj Comput. Mater., 2018, 4, 72–84 CrossRef.
- K. Lee, É. D. Murray, L. Kong, B. I. Lundqvist and D. C. Langreth, Phys. Rev. B: Condens. Matter Mater. Phys., 2010, 82, 3–6 Search PubMed.
- S. Grimme, J. Comput. Chem., 2004, 25, 1463–1473 CrossRef CAS PubMed.
- S. Grimme, J. Antony, S. Ehrlich and H. A. Krieg, J. Chem. Phys., 2010, 132, 154104–154123 CrossRef PubMed.
- O. A. Vydrov and T. Van Voorhis, J. Chem. Phys., 2010, 133, 244103–244111 CrossRef PubMed.
- R. Sabatini, T. Gorni and S. de Gironcoli, Phys. Rev. B: Condens. Matter Mater. Phys., 2013, 87, 041108–041111 CrossRef.
- A. Tkatchenko and M. Scheffler, Phys. Rev. Lett., 2009, 102, 073005–073008 CrossRef PubMed.
- M. J. van Setten, M. Giantomassi, E. Bousquet, M. J. Verstraete, D. R. Hamann, X. Gonze and G.-M. Rignanese, Comput. Phys. Commun., 2018, 226, 39–54 CrossRef CAS.
- H.-V. Nguyen and S. de Gironcoli, Phys. Rev. B: Condens. Matter Mater. Phys., 2009, 79, 205114–205125 CrossRef.
- N. L. Nguyen, N. Colonna and S. de Gironcoli, Phys. Rev. B: Condens. Matter Mater. Phys., 2014, 90, 045138–045147 CrossRef.
- S. Plimpton, J. Comput. Phys., 1994, 117, 1–19 CrossRef.
- J. Wang, R. M. Wolf, J. W. Caldwell, P. A. Kollman and D. A. Case, J. Comput. Chem., 2004, 25, 1157–1174 CrossRef CAS PubMed.
- A. Jakalian, D. B. Jack and C. I. Bayly, J. Comput. Chem., 2002, 23, 1623–1641 CrossRef CAS PubMed.
- D. N. LeBard, B. G. Levine, P. Mertmann, S. A. Barr, A. Jusufi, S. Sanders, M. L. Klein and A. Z. Panagiotopoulos, Soft Matter, 2012, 8, 2385–2397 RSC.
- W. G. Hoover, Phys. Rev. A, 1985, 31, 1695–1697 CrossRef PubMed.
- S. A. Nosé, J. Chem. Phys., 1984, 81, 511–519 CrossRef.
- J. Kästner, Wiley Interdiscip. Rev.: Comput. Mol. Sci., 2011, 1, 932–942 Search PubMed.
- S. Kumar, J. M. Rosenberg, D. Bouzida, R. H. Swendsen and P. A. Kollman, J. Comput. Chem., 1992, 13, 1011–1021 CrossRef CAS.
- L. W. Drahushuk and M. S. Strano, Langmuir, 2012, 28, 16671 CrossRef CAS PubMed.
- S. Blankenburg, M. Bieri, R. Fasel, K. Müllen, C. A. Pignedoli and D. Passerone, Small, 2010, 20, 2266–2271 CrossRef PubMed.
- M. Stöhr, T. Van Voorhis and A. Tkatchenko, Chem. Soc. Rev., 2019, 48, 4118–4154 RSC.
- D. C. Langreth and J. P. Perdew, Solid State Commun., 1975, 17, 1425–1429 CrossRef.
- D. C. Langreth and J. P. Perdew, Phys. Rev. B: Solid State, 1977, 15, 2884–2901 CrossRef.
- J. F. Dobson and T. Gould, J. Phys.: Condens. Matter, 2012, 24, 073201–073213 CrossRef PubMed.
- D. Lu, H.-V. Nguyen and G. Galli, J. Chem. Phys., 2010, 133, 154110–154120 CrossRef PubMed.
- M. Rohlfing and T. Bredow, Phys. Rev. Lett., 2008, 101, 266106–266109 CrossRef PubMed.
- X. Ren, P. Rinke and M. Scheffler, Phys. Rev. B: Condens. Matter Mater. Phys., 2009, 80, 045402–045409 CrossRef.
- X. Ren, P. Rinke, C. Joas and M. Scheffler, J. Mater. Sci., 2012, 47, 7447–7471 CrossRef CAS.
- D. Lu, Y. Li, D. Rocca and G. Galli, Phys. Rev. Lett., 2009, 102, 206411–266109 CrossRef PubMed.
- D. Rocca, J. Chem. Phys., 2014, 140, 18A501–18A508 CrossRef PubMed.
- M. Hellgren, N. Colonna and S. de Gironcoli, Phys. Rev. B, 2018, 98, 045117–045128 CrossRef CAS.
- N. Colonna, M. Hellgren and S. de Gironcoli, Phys. Rev. B, 2016, 93, 195108–195118 CrossRef.
- J. Hermann, R. A. DiStasio and A. Tkatchenko, Chem. Rev., 2017, 117, 4714–4758 CrossRef CAS PubMed.
- K. V. Agrawal, L. W. Drahushuk and M. S. Strano, Philos. Trans. R. Soc., A, 2016, 374, 20150357–20150369 CrossRef PubMed.
- Z. Yuan, A. Govind Rajan, R. P. Misra, L. W. Drahushuk, K. V. Agrawal, M. S. Strano and D. Blankschtein, ACS Nano, 2017, 11, 7974–7987 CrossRef CAS PubMed.
- D. Chandler, J. Chem. Phys., 1978, 68, 2959–2970 CrossRef CAS.
- S. M. Auerbach, Int. Rev. Phys. Chem., 2000, 19, 155–198 Search PubMed.
- Y. Peng, Y. Li, Y. Ban and W. Yang, Angew. Chem., 2017, 56, 9757–9761 CrossRef CAS PubMed.
- Y. Peng, Y. Li, Y. Ban, H. Jin, W. Jiao, X. Liu and W. Yang, Science, 2014, 346, 1356–1359 CrossRef CAS PubMed.
- H. Li, Z. Song, X. Zhang, Y. Huang, S. Li, Y. Mao, H. J. Ploehn, Y. Bao and M. Yu, Science, 2013, 342, 95–98 CrossRef CAS PubMed.
- M. A. Carreon, Science, 2020, 367, 624–625 CrossRef CAS PubMed.
Footnote |
| † Electronic supplementary information (ESI) available. See DOI: 10.1039/d0ta03071f |
| This journal is © The Royal Society of Chemistry 2020 |