
Thermal properties of lipid bilayers derived from the transient heating regime of upconverting nanoparticles†
Ana R. N.
Bastos
 a,
Carlos D. S.
Brites
a,
Paola A.
Rojas-Gutierrez
b,
Rute A. S.
Ferreira
a,
Ricardo L.
Longo
*c,
Christine
DeWolf
b,
John A.
Capobianco
*b and
Luís D.
Carlos
*a
a,
Carlos D. S.
Brites
a,
Paola A.
Rojas-Gutierrez
b,
Rute A. S.
Ferreira
a,
Ricardo L.
Longo
*c,
Christine
DeWolf
b,
John A.
Capobianco
*b and
Luís D.
Carlos
*a
aPhantom-g, CICECO – Aveiro Institute of Materials, Department of Physics, University of Aveiro, 3810-193, Aveiro, Portugal. E-mail: lcarlos@ua.pt
bDepartment of Chemistry and Biochemistry, and Centre for NanoScience Research, Concordia University, 7141 Sherbrooke St. West, Montreal, Quebec H4B 1R6, Canada. E-mail: John.Capobianco@concordia.ca
cDepartamento de Química Fundamental, Universidade Federal de Pernambuco, Cidade Universitária, 50740-560, Recife, PE, Brazil. E-mail: ricardo.longo@ufpe.br
First published on 24th November 2020
Abstract
Heat transfer and thermal properties at the nanoscale can be challenging to obtain experimentally. These are potentially relevant for understanding thermoregulation in cells. Experimental data from the transient heating regime in conjunction with a model based on the energy conservation enable the determination of the specific heat capacities for all components of a nanoconstruct, namely an upconverting nanoparticle and its conformal lipid bilayer coating. This approach benefits from a very simple, cost-effective and non-invasive optical setup to measure the thermal parameters at the nanoscale. The time-dependent model developed herein lays the foundation to describe the dynamics of heat transfer at the nanoscale and were used to understand the heat dissipation by lipid bilayers.
Introduction
During metabolism cells undergo continuous heat transfer. However, very little is known about the heat transfer at the cellular level, and in particular about the thermal properties of each of the cellular components.1–5 Frequently the thermal conductivity and/or heat transfer coefficients of the lipid membrane, proteins, and intracellular fluid are all assumed to be the same, an inaccuracy highlighted by Suzuki and Plakhotnik.5 The thermal properties of the cell membrane itself are important in thermoregulation, i.e. the heat transfer from the cell to the surrounding environment and vice versa. The cell membrane is best approximated by a phospholipid bilayer that has been employed extensively for investigating the membrane thermodynamic and thermal properties both experimentally6,7 and computationally.8–10 While much of the phospholipid literature is focused on the thermotropic phase behaviour, absolute measurements of intrinsic lipid bilayer thermodynamic properties are less accessible.Luminescent nanothermometry11–15 has been widely used in the determination of cell temperature, which relies on luminescent probes such as proteins, dyes, fluorescent gold nanoclusters and nanoparticles.5,16–19 Furthermore, the technique has been recently used to measure the core temperature of upconverting nanoparticles (UCNPs) coated with a lipid bilayer enabling the direct determination of the thermal conductivity of the coating, with advantages relative to the established experimental electrical methods.20 However, simply measuring the temperature, a state variable, does not provide an insight into the dissipation of heat which is dynamic thus, requiring that the transient regime be studied.
Herein, we employ a nanoconstruct comprising a UCNP (LiYF4:Er3+/Yb3+) surrounded by a conformal supported lipid bilayer (containing dioleoylphosphatidylcholine, DOPC, dioleoylphosphatidic acid, DOPA, cholesterol, and oleate)20,21 to develop a model and demonstrate experimentally that the transient regime permits to obtain the specific heat capacity of both the lipid bilayer and the UCNP. In contrast, the steady-state regime only yields an estimate of the conduction heat transfer of both components of the nanoconstruct. The determination of the specific heat capacity at the nanoscale is challenging, less explored and important to clarify why nanofluids show enhanced specific heat capacities. This property has been observed upon the addition of nanoparticles to a molten salt, that has technological relevance in energy storage, however, the mechanism is not yet understood.22
Experimental details
Materials
Dispersions of tetragonal phase LiYF4:Er3+/Yb3+ were synthesized via thermal decomposition. Capped UCNPs have been coated with a conformal supported lipid bilayer coating. The capped and uncapped (oleate-free23) nanoparticles are dispersed in either ultrapure H2O or D2O (dispersion concentrations are based on the dry weight of nanoparticles). Nanoparticles were characterized using transmission and scanning electron microscopy and X-ray diffraction. Properties of the UCNPs are provided in section I of the ESI and in Tables S1 and S2.† Details of the synthesis and characterization of the nanoparticles have been reported previously.21Methods
 | ||
| Fig. 1 (a) Schematic of the experimental setup used to record the temporal dependence of the temperature of the nanofluids under 980 nm excitation. The magnification of the laser spot on the nanofluid represents the heat exchange between the solvent (H2O or D2O) and the nanoparticle due to 980 nm excitation, and the composition of the conformal lipid bilayer coating the surface of the nanoparticle. (b) Temperature profiles of the uncapped UCNPs and lipid bilayer-capped UCNPs dispersed in H2O, and uncapped UCNPs dispersed in D2O, measured under 980 nm excitation (222 W cm−2) using the immersed thermocouple. Dashed lines are fits for the entire data set and continuous lines are fits of the initial period of NIR irradiation. (c) Magnification of the first 25 s (shaded area of (b)) highlighting the fit of the model in the initial period of 980 nm irradiation. | ||
It is relevant to determine how ΔT, associated with absorption, varies across and along the excitation cylinder of the laser beam path, which will determine the accuracy and reliability of the derived properties as well as establish the temperature monitoring. Assuming constant thermal conductivity, and that the power absorbed from the laser beam is converted into heat, the temperature variation across the laser beam path is Tsurface − Tcentre = (NP,bσP + σS)PD/4πκL, which under the experimental conditions used corresponds to a temperature variation of 0.061 K. Given the small size of the focal point, ΔT can be assumed to be spatially homogenous within this region (section VI of the ESI†). Regarding the temperature variation along a cylinder defined by the path of the laser beam, the exponential attenuation of the radiant power of the laser beam causes a monotonic decrease of ΔT along the optical pathlength by ca. 1.6 times (section VI of the ESI†). Therefore, it is very important to ensure that the temperature is always monitored in the same position. Note that temperature monitoring by ratiometric luminescence using the UCNPs will not be addressed here.
 | ||
| Fig. 2 Time-dependence of the reduced temperature for the (a) uncapped UCNPs and (b) lipid bilayer-capped UCNPs dispersed in H2O, and (c) uncapped UCNPs dispersed in D2O, measured by the immersed thermocouple. The logarithmic representation of the reduced temperature profiles allows the identification of the time range in which ln[1 − θ(t)] is linear. The horizontal bars mark the time interval (Δt) in which these linear fits are verified. The solid lines are the best fits to eqn (16) (r2 > 0.970) and the dashed lines are guides for the eyes. | ||
Results and discussion
Laser heating of nanofluids containing upconversion nanoparticles, UCNPs, including capped-UCNPs, has been performed, and by analyzing the temperature increase at steady-state, the thermal conductivities of the nanofluids were determined.20,21 However, for analysis of the transient regime, a time-dependent approach is necessary and additional considerations are in order.Modelling laser heating of nanofluids: power balance
As a laser beam travels through a nanofluid, photons are absorbed by the medium and this absorbed energy is converted into heat, which will cause an increase of temperature. Under the experimental conditions, the optical pathlength is ca. 100 times larger than the diameter of the laser spot, so the laser beam can be considered as a long cylinder and the heat will be dissipated radially from the surface of this cylinder. As a result, the heat dissipation along the laser path is negligible and considering that only the particles within this cylinder will absorb and cause heating, the process can be described by a one-dimensional (radial) heat transfer with cylindrical symmetry. To model this heating process, each of the components of the nanofluid (UCNPs, lipid bilayer and solvent) will be considered as independent. The total absorption cross-section will then be the sum of the absorption cross-sections of the individual components. This applies similarly to the heat transfer properties of the nanofluid, particularly, heat capacity.The time at which the irradiation starts (the initial time) is denoted by t0. The temperature, T(t), increases up to a constant value, the so-called steady-state regime, T(tss) ≡ Tss. The period during which the temperature increases from the initial equilibrium temperature of the sample, T(t0) ≡ T0, to its steady-state value, Tss, denoted by Δt = tss − t0, defines the transient regime.
Energy conservation dictates that, on average, the total energy of an isolated system is constant, i.e. it is conserved over time. Thus, the power (or energy rate) gained, Wgain, has to be equal the power lost (or dissipated), Wlost:
| Wgain = Wlost | (1) |
This is the power balance equation, which can be obtained from the transient heat transfer differential equation derived using, for example, the shell balance approach28 under homogeneous conditions of the thermal conductivity and of the temperature gradient. The power balance equation has been successfully applied to several nanosystems, particularly in describing processes such as laser-induced incandescence.29,30 The simplicity to setup and to solve this equation is one of its appeals because only the processes of power gains and power losses associated with the experimental conditions are required. In the case of laser heating of nanofluids, the power gain is basically that absorbed from the laser beam, so that Wgain = Wabs, where the rate of energy absorption, Wabs, can be determined as (section IV of the ESI†)
| Wabs ≅ (NP,bσP + NP,bσL + σS,b)PD | (2) |
Power lost or dissipated
The main mechanisms and pathways of energy dissipation are: (i) heat transfer via conduction, convection, and thermal radiation, (ii) increase of internal energy due to heat capacity, and (iii) upconversion emission by the UCNPs. Other sources of heat dissipation such as evaporation, ionization, dissociation, etc. will not be considered because of the stability of the systems and the relatively small temperature increase. In addition, the effects of the coupling between the flow of heat and the flow of matter, e.g. the Soret (or thermophoresis, or thermal diffusion) and the Dufour (heat flow caused by a concentration gradient) effects will not be considered. Derivations and calculations of the main contributions to heat dissipation are presented in section V of the ESI.†Power dissipation via heat transfer
The heating of the nanofluid within the path of the laser beam creates a temperature gradient between the excitation cylinder and the bulk of the sample that is at room temperature. So, the temperature varies radially from T(t) at the surface of the cylinder to T0. According to Fourier's law of heat conduction,31 the rate of heat dissipation by conduction, Wcond (in W), is proportional to the temperature gradient. Given the spatial homogeneity of the system and the small temperature increase caused by the laser heating, the temperature gradient can be approximated by its finite difference form as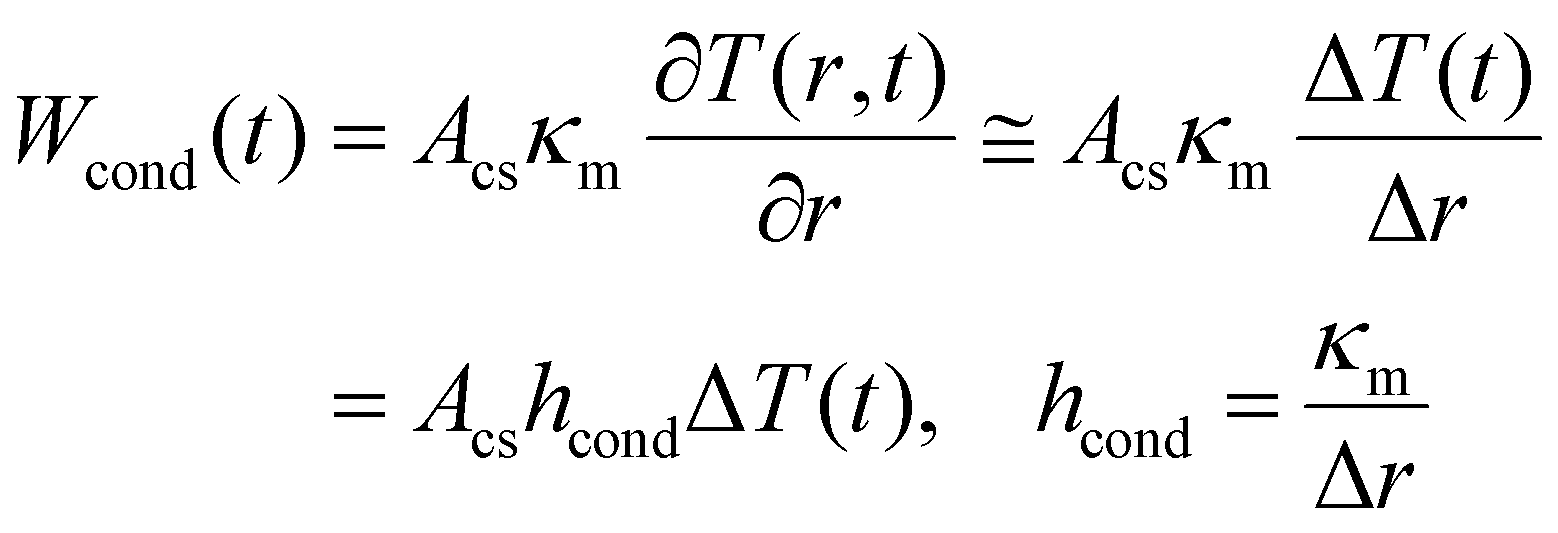 | (3) |
A hotter region can also dissipate heat to a colder region via convection. So, according to Newton's cooling law the convective heat dissipation, Wconv(t),31 by the laser heated nanofluid is
| Wconv(t) = AcshconvΔT(t) | (4) |
Matter at a temperature above 0 K emits thermal radiation with an upper limit to its emissive power given by the Stefan–Boltzmann law, which is proportional to the fourth power of the temperature. It also absorbs thermal radiation from the environment, which is governed by the same law. However, when the body is at a temperature T(t) higher than its surroundings T0, a net power dissipation, Wrad(t), will be established due to thermal radiation, which can be expressed as31
| Wrad(t) = εσSBAcs[T4(t) − T04] = AcshradΔT(t) | (5) |
| hrad = εσSB[T(t) + T0][T2(t) + T02] | (6) |
It is noteworthy that all three contributions to the power dissipation via heat transfer, namely, the approximated expression in eqn (3) for conduction, eqn (4) for convection, and eqn (5) for thermal radiation have the same functional form, so they can be combined into
| Wht(t) = hhtAcsΔT(t) | (7) |
Power loss via upconversion emission
The UCNPs in the nanofluid absorb radiation from the near-infrared laser and emit radiation in the visible region. This process will then decrease the amount of absorbed energy that is transformed into heat, so it will not contribute to the heating of the nanofluid and can be considered as dissipated power. From the definition of the quantum yield and the energies of the absorbed and emitted photons during the upconversion (UC) process, the power loss due to upconversion emission, WUC, can be expressed as | (8) |
 and
and  are the absorption and emission wavenumbers, ϕUC is the quantum yield of the upconversion process, NP,b is the number of UCNPs within the path of the laser beam, σP is the absorption cross-section of a single UCNP, and PD is the power density of the incident laser beam. The ϕUC values for the uncapped and lipid bilayer-capped LiYF4:Er3+/Yb3+ UCNPs dispersed in water were measured as (0.040 ± 0.004) × 10−4 and (0.120 ± 0.010) × 10−4, respectively, justifying the last approximation in eqn (8) (
 ). As far as we know, this is the first report of absolute emission quantum yields in LiYF4:Er3+/Yb3+ UCNPs. The values obtained here are of the same order of magnitude as those recorded for SrF2:Er3+/Yb3+ UCNPs,26 although smaller than those reported for LiYF4:Tm3+/Yb3+ UCNPs dispersed in toluene and NaYF4:Er3+/Yb3+ UCNPs suspended in water.24,32 However, we note that the use of different solvents, hosts, dopant ions, dopant concentrations, and particle sizes preclude the direct comparison between values.
Notice that power loss via emission at ca. 980 nm by Yb3+ and in the NIR region by Er3+ were not considered because the energy transfer upconversion rates from excited Yb3+ to Er3+ are much larger than the radiative decay of excited Yb3+.33–35 Consequently, emissions in the NIR region are not observed, as shown in Fig. S5 (section IX of the ESI†).
Power loss via the increase of internal energy
Because the nanofluid within and surrounding the excitation cylinder of the laser beam has a heat capacity, cN, it can store energy and the rate of energy storage or the rate of internal energy increase, Wint(t), is | (9) |
| mNcN = mPcP + mScS | (10) |
| mNcN = mPcP + mScS + mLcL | (11) |
Power balance equation and analysis
The power dissipated from the laser heated nanofluid can then be approximated by the sum of contributions in eqn (7), (8), and (9), that is, Wlost ≅ Wht(t) + WUC + Wint(t). Considering that the power gain for the laser heating of the nanofluid is due to absorption from the laser beam: Wgain = Wabs, which is assumed to be completely converted into heat, the following expression for the power balance, eqn (1), can be obtained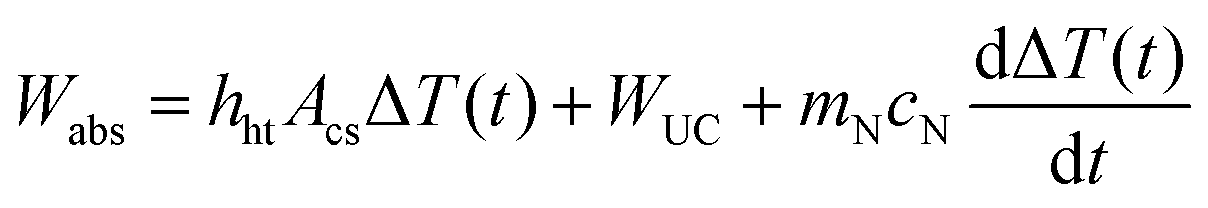 | (12) |
 | (13) |
An interesting feature of the model quantified in eqn (13) is that the measurement of the temperature increase ΔT(t) could be performed by luminescence thermometry with the UCNPs and/or with a thermocouple. These measurements should yield different temperatures because of their distinct locations within the nanofluid. However, it is expected that both measurements would provide the same temperature profile during the transient regime because the medium between the laser beam and the thermocouple is constant. To ensure this latter statement, the thermocouple should be always placed at the same position relative to the laser beam. In the present experimental setup, the excitation of the UCNPs will depend on their positions along the optical path, so a direct temperature measurement from the luminescence is not viable and further modeling or a different experimental setup is required. Hence, the increase ΔT(t) during the transient regime was determined only by a thermocouple with a narrow area.
It is evident from eqn (8), that the power dissipated by the upconversion process, WUC, is smaller than ca. 0.05% of the power absorbed by the UCNPs within the laser beam. As a result, the ratio WUC/Wabs is smaller than 10−5 (section V of the ESI†), which justifies the approximation in eqn (13).
The solution of the equation describing the laser heating of a nanofluid also provides the following expression for the increase of temperature at the steady-state regime
 | (14) |
It is noteworthy that the transient regime described by eqn (13) does not require the determination of the heat transfer properties of the nanofluids, as long as ΔTss is considered a parameter that can be determined experimentally. In other words, the transient regime is fully described by ΔTss and τ which can be related to the heat transfer properties and the heat capacities of nanofluids, respectively. In fact, the heat capacity, cN, of the nanofluid can be obtained as
 | (15) |
Thus, a direct fit of eqn (13) is not appropriate and the following linearized form using the reduced temperature, θ(t), was employed where τ was obtained from the inverse of the slope of the linear regime (Fig. 2 and Fig. S2b†).
 | (16) |
As shown in Fig. 2 and Fig. S2b,† the transient regime is accurately described by the linearized model which enables the establishment of the limits of the first regime of the transient curve. This analysis was applied to samples of pure water, and dispersions of uncapped and capped UCNPs in H2O and D2O for several laser power densities. An example of the transient properties is shown in Table 1. The complete data related to these properties are presented in the ESI (Tables S6–S8†).
| Fluid | W abs (mW) | ΔTss (K) | τ (s) |
|---|---|---|---|
| Pure water | 8.93 ± 0.83 | 8.2 ± 0.1 | 0.31 ± 0.01 |
| UCNPs in H2O | 9.03 ± 0.72 | 13.8 ± 0.1 | 0.51 ± 0.03 |
| Capped-UCNPs in H2O | 9.08 ± 0.92 | 16.2 ± 0.1 | 0.60 ± 0.03 |
| UCNPs in D2O | 0.35 ± 0.24 | 3.9 ± 0.1 | 4.21 ± 0.39 |
As expected from the absorption spectra of the fluids, the absorbed power, Wabs, is dominated by H2O, and even for D2O its contribution is significant. The lipid bilayer also has a significant impact on the optical properties of the UCNPs. In fact, the lipid bilayer doubles the absorption cross-section of the UCNPs, from 0.16 to 0.32 nm2, despite the small increase of ca. 14% of the geometrical cross-section, from 2255 nm2 for the uncapped UCNP to 2570 nm2 for the capped UCNP. This significant increase of the absorption cross-section at 980 nm is due to the presence of high energy oscillators such as O–H, N–H, and C–H associated with the lipid bilayer and with hydration molecules in the nanoconstruct (supported lipid bilayer-coated UCNPs). However, despite Wabs being dominated by water, the nanoparticles have a significant effect on the thermal properties of the fluid, causing a steep increase of ΔTss and τ.
Analysis of the transient regime at three power densities for water (Fig. S4 and Table SI†) yielded a heat capacity of 4177 ± 367 J kg−1 K−1, which agrees within the uncertainty with the reported value of 4181 ± 4 J kg−1 K−1 at 298 K,36 showing the reliability of the proposed approach. For the nanofluid comprising uncapped UCNPs in H2O, the heat capacity of water shown above was subtracted and a value of 715 ± 57 J kg−1 K−1 for the uncapped UCNPs was obtained. This value is in reasonable agreement with that reported for LiYF4 crystals at room temperature (790 J kg−1 K−1).37–39 Despite the instability of the suspension of UCNPs dispersed in D2O, a value for the heat capacity of uncapped UCNPs of 709 ± 93 J kg−1 K−1 could be derived from measurements at two laser power densities which is also in agreement with the reported value for LiYF4 crystals. Through this analysis, the main sources of the uncertainty of the heat capacity are the quantities appearing in eqn (15), namely: (i) mass of the UCNPs; (ii) number of species exposed to the laser beam; (iii) absorption cross-sections; (iv) power density and (v) measured parameters τ and ΔTss. Note that this analysis also considers the specific heat capacity to be independent of temperature. Nonetheless, because the temperature increase over the transient regime is at most ca. 10 K (Fig. 1c and Fig. S4†), this limitation causes a small relative uncertainty of ca. 0.03% and 3% in the final values for water and the uncapped UCNPs, respectively.
To the best of our knowledge, this is the first time that the heat capacity of a UCNP has been measured. The similarity of the heat capacity of the UCNPs to that of the bulk LiYF4 may be attributed to the size of the nanoparticles employed (Table S2†). Specifically, although the literature provides very little data (experimental and computational) for the heat capacities of nanomaterials, it has been reported that particles with sizes larger than ca. 70 nm have thermal properties similar to the bulk material, while particles smaller than ca. 20 nm display a drastic increase in the specific heat capacity.40–42
To determine the specific heat capacity of the lipid bilayer we consider that the heat capacity of the lipid bilayer-capped UCNPs dispersed in H2O also comprises a contribution from the lipid bilayer, namely, mNcN = mpcp + mScS + mLcL, where mL and cL are the mass and specific heat capacity of the lipid bilayer, respectively. Notice that the host LiYF4 was selected because its tetragonal structure yields eight identical {101} faces that all have equal surface energies (0.82 J m−2), which promotes a uniform bilayer coverage due to identical host-lipid interactions.43 The values of the heat capacity of the lipid bilayer are similar when determined using either the calculated photophysical (715 ± 57 J kg−1 K−1) or the reported (790 J kg−1 K−1)37–39cp values of LiYF4.
Analysis of the transient regime for six laser power densities provided an average value of 5039 ± 211 J kg−1 K−1 (1.20 ± 0.06 cal g−1 K−1) for the specific heat capacity of the lipid bilayer, which corresponds to a molar heat capacity of 2.93 ± 0.12 kJ mol−1 K−1. This value of the molar heat capacity is similar to those obtained by atomistic molecular dynamics simulations44 for a dipalmitoylphosphatidylcholine (DPPC) lipid bilayer (Table 2).
| Compound | c L | Technique | Ref. | |
|---|---|---|---|---|
| (J kg−1 K−1) | (kJ mol−1 K−1) | |||
| a DPPE: dipalmitoylphosphatidylethanolamine. b Measured at 293 K. | ||||
Oleate![[thin space (1/6-em)]](https://www.rsc.org/images/entities/char_2009.gif) :DOPA:DOPC:cholesterol (21:51:5:24) :DOPA:DOPC:cholesterol (21:51:5:24) |
5039 ± 211 | 2.93 ± 0.12 | Transient heating of nanofluids | This work |
| DPPC | 3678 | 2.7 | Atomistic molecular dynamics simulations | 44 |
| DPPC | 2166 | 1.59 | Differential scanning calorimetryb | 45 |
| DPPEa | 2268 | 1.57 | ||
Note that the differences in values for the specific heat capacities derive from the significant compositional differences (and hence molecular weight) between our multicomponent bilayer and pure DPPC. Both the current work and the molecular dynamics simulation values are higher than the molar heat capacities measured by differential scanning calorimetry.45 Even with correction proposed by Blume for lipid phase and chain length, the estimated molar heat capacity of DOPC only increases to 1.98 kJ mol−1 K−1. However, molar heat capacities obtained herein are not necessarily directly comparable with the calorimetric results owing not only to significant differences in the composition of the bilayer but also to potential differences in hydrophobic hydration.45 Notably, prior work has focused on single component (‘pure’) systems rather than the more biologically relevant and complex, mixed-lipid bilayers studied here.
Conclusions
Using direct measurements of the transient regime under NIR irradiation of an aqueous dispersion of the nanoconstruct comprising upconverting LiYF4:Er3+/Yb3+ nanoparticles coated with a conformal lipid bilayer and a power balance model, we demonstrate that the transient regime permits to determine the specific heat capacities of the nanoparticle and the lipid bilayer. The model developed can be considered the first step towards a quantitative description of the dynamics of heat transfer at the nanoscale, which may provide insight into the heat dissipation at the cellular level. The approach described is quite versatile because different solvents can be selected that absorb in the NIR region and which can form stable nanofluids with a diversity of nanoparticles which do not need to be luminescent for this generalized model. Moreover, the model can be used to obtain valuable fundamental biophysical characteristics of different lipid and membrane compositions, such as those in mammalian cells, bacterial cells, and viral lipid envelopes.Conflicts of interest
There are no conflicts to declare.Acknowledgements
This work has received funding from the European Union's Horizon 2020 FET Open program under grant agreement no. 801305 and was partially developed in the scope of the projects CICECO-Aveiro Institute of Materials UIDB/50011/2020 & UIDP/50011/2020, financed by Portuguese funds through the FCT/MEC and when appropriate co-financed by FEDER under the PT2020 Partnership Agreement. Financial support from FCT (PTDC/CTM-NAN/4647/2014, NANOHEATCONTROL – POCI-01-0145-FEDER-031469) is acknowledged. J. A. Capobianco is a Concordia University Research Chair in Nanoscience and is grateful to Concordia University and Natural Science and Engineering Research Council (NSERC) of Canada for the sustained support of his research. C. DeWolf is grateful to NSERC for the support of her research. Ricardo Longo is grateful for the Brazilian Agencies CNPq, CAPES, FACEPE, FINEP, and Pronex for providing partial financial support under grants: Pronex APQ-0675-1.06/14, INCT-NANOMARCS APQ-0549-1.06/17, APQ-1007-1.06/15, and CNPq-PQ fellowship (Proc. 309177/2018-9).References
- G. Baffou, H. Rigneault, D. Marguet and L. Jullien, Nat. Methods, 2014, 11, 899–901 CrossRef CAS.
- S. Kiyonaka, R. Sakaguchi, I. Hamachi, T. Morii, T. Yoshizaki and Y. Mori, Nat. Methods, 2015, 12, 801–802 CrossRef CAS.
- M. Suzuki, V. Zeeb, S. Arai, K. Oyama and S. Ishiwata, Nat. Methods, 2015, 12, 802–803 CrossRef CAS.
- M. C. Rajagopal, J. W. Brown, D. Gelda, K. V. Valavala, H. Wang, D. A. Llano, R. Gillette and S. Sinha, Commun. Biol., 2019, 2, 279 CrossRef.
- M. Suzuki and T. Plakhotnik, Biophys. Rev., 2020, 12, 593–600 CrossRef.
- C. H. Huang and S. S. Li, Biochim. Biophys. Acta, Rev. Biomembr., 1999, 1422, 273–307 CrossRef CAS.
- C. Demetzos, J. Liposome Res., 2008, 18, 159–173 CrossRef CAS.
- S. Youssefian, N. Rahbar, C. R. Lambert and S. Van Dessel, J. R. Soc., Interface, 2017, 14, 20170127 CrossRef.
- S. Youssefian, N. Rahbar and S. Van Dessel, J. Chem. Phys., 2018, 148, 174901 CrossRef.
- T. Nakano, G. Kikugawa and T. Ohara, J. Chem. Phys., 2010, 133, 154705 CrossRef.
- C. D. S. Brites, P. P. Lima, N. J. O. Silva, A. Millán, V. S. Amaral, F. Palacio and L. D. Carlos, Nanoscale, 2012, 4, 4799–4829 RSC.
- D. Jaque and F. Vetrone, Nanoscale, 2012, 4, 4301–4326 RSC.
- B. del Rosal, E. Ximendes, U. Rocha and D. Jaque, Adv. Opt. Mater., 2017, 5, 1600508 CrossRef.
- M. Dramićanin, Luminescence Thermometry: Methods, Materials, and Applications, Elsevier, Cambridge, 2018 Search PubMed.
- C. D. S. Brites, S. Balabhadra and L. D. Carlos, Adv. Opt. Mater., 2019, 7, 1801239 CrossRef.
- T. T. Bai and N. Gu, Small, 2016, 12, 4590–4610 CrossRef CAS.
- S. Uchiyama, C. Gota, T. Tsuji and N. Inada, Chem. Commun., 2017, 53, 10976–10992 RSC.
- J. M. Yang, H. Yang and L. W. Lin, ACS Nano, 2011, 5, 5067–5071 CrossRef CAS.
- L. Shang, F. Stockmar, N. Azadfar and G. U. Nienhaus, Angew. Chem., Int. Ed., 2013, 52, 11154–11157 CrossRef CAS.
- A. R. N. Bastos, C. D. S. Brites, P. A. Rojas-Gutierrez, C. DeWolf, R. A. S. Ferreira, J. A. Capobianco and L. D. Carlos, Adv. Funct. Mater., 2019, 29, 1905474 CrossRef CAS.
- P. A. Rojas-Gutierrez, C. DeWolf and J. A. Capobianco, Part. Part. Syst. Charact., 2016, 33, 865–870 CrossRef CAS.
- R. Hentschke, Nanoscale Res. Lett., 2016, 11, 88 CrossRef.
- N. Bogdan, F. Vetrone, G. A. Ozin and J. A. Capobianco, Nano Lett., 2011, 11, 835–840 CrossRef CAS.
- J. C. Boyer and F. C. J. M. van Veggel, Nanoscale, 2010, 2, 1417–1419 RSC.
- C. Wurth, M. Kaiser, S. Wilhelm, B. Grauel, T. Hirsch and U. Resch-Genger, Nanoscale, 2017, 9, 4283–4294 RSC.
- S. Balabhadra, M. L. Debasu, C. D. S. Brites, R. A. S. Ferreira and L. D. Carlos, J. Lumin., 2017, 189, 64–70 CrossRef CAS.
- C. T. Xu, Q. Q. Zhan, H. C. Liu, G. Somesfalean, J. Qian, S. L. He and S. Andersson-Engels, Laser Photonics Rev., 2013, 7, 663–697 CrossRef CAS.
- R. J. Roselli and K. R. Diller, Biotransport: Principles and Applications, Springer, New York, 2011 Search PubMed.
- H. A. Michelsen, J. Chem. Phys., 2003, 118, 7012–7045 CrossRef CAS.
- H. A. Michelsen, F. Liu, B. F. Kock, H. Bladh, A. Boiarciuc, M. Charwath, T. Dreier, R. Hadef, M. Hofmann, J. Reimann, S. Will, P. E. Bengtsson, H. Bockhorn, F. Foucher, K. P. Geigle, C. Mounaim-Rousselle, C. Schulz, R. Stirn, B. Tribalet and R. Suntz, Appl. Phys. B: Lasers Opt., 2007, 87, 503–521 CrossRef CAS.
- T. L. Bergman, A. S. Lavine, F. P. Incropera and D. P. DeWitt, Fundamentals of Heat and Mass Transfer, Wiley, New York, 7th edn, 2011 Search PubMed.
- J. Wang, R. R. Deng, M. A. MacDonald, B. L. Chen, J. K. Yuan, F. Wang, D. Z. Chi, T. S. A. Hor, P. Zhang, G. K. Liu, Y. Han and X. Liu, Nat. Mater., 2014, 13, 157–162 CrossRef CAS.
- D. W. Lu, C. C. Mao, S. K. Cho, S. Ahn and W. Park, Sci. Rep., 2016, 6, 18894 CrossRef CAS.
- R. H. Page, K. I. Schaffers, P. A. Waide, J. B. Tassano, S. A. Payne, W. F. Krupke and W. K. Bischel, J. Opt. Soc. Am. B, 1998, 15, 996–1008 CrossRef CAS.
- B. SimondiTeisseire, B. Viana, D. Vivien and A. M. Lejus, Opt. Mater., 1996, 6, 267–274 CrossRef CAS.
- W. M. Haynes, CRC Handbook of Chemistry and Physics, CRC Press, Boca Raton, FL, 2017 Search PubMed.
- S. S. Ballard and J. S. Browder, in Handbook of Laser Science and Technology, ed. M. J. Weber, CRC, Boca Raton, FL, 1986, vol. IV, p. 52 Search PubMed.
- L. G. DeShazer and B. A. Wechsler, in Handbook of Laser Science and Technology, ed. M. J. Weber, CRC, Boca Raton, FL, 1987, vol. V, p. 328 Search PubMed.
- R. L. Aggarwal, D. J. Ripin, J. R. Ochoa and T. Y. Fan, J. Appl. Phys., 2005, 98, 103514 CrossRef.
- M. Saeedian, M. Mahjour-Shafiei, E. Shojaee and M. R. Mohammadizadeh, J. Comput. Theor. Nanosci., 2012, 9, 616–620 CrossRef CAS.
- X. M. Wu, L. Wang, Z. C. Tan, G. H. Li and S. S. Qu, J. Solid State Chem., 2001, 156, 220–224 CrossRef CAS.
- S. L. Gafner, L. V. Redel, Y. Y. Gafner and V. M. Samsonov, J. Nanopart. Res., 2011, 13, 6419–6425 CrossRef CAS.
- P. A. Rojas-Gutierrez, S. Bhuckory, C. Mingoes, N. Hildebrandt, C. DeWolf and J. A. Capobianco, ACS Appl. Nano Mater., 2018, 1, 5345–5354 CrossRef CAS.
- L. P. Sun and R. A. Bockmann, Eur. Biophys. J., 2018, 47, 151–164 CrossRef CAS.
- A. Blume, Biochemistry, 1983, 22, 5436–5442 CrossRef CAS.
Footnote |
| † Electronic supplementary information (ESI) available. See DOI: 10.1039/d0nr06989b |
| This journal is © The Royal Society of Chemistry 2020 |