
 Open Access Article
 This Open Access Article is licensed under a
 Creative Commons Attribution 3.0 Unported Licence
Spinel ferrites MFe2O4 (M = Co, Cu, Zn) for photocatalysis: theoretical and experimental insights†
Charlotte A.
Hall
ab,
Pilar
Ferrer
 *b,
David C.
Grinter
b,
Santosh
Kumar
b,
Ivan
da Silva
c,
Juan
Rubio-Zuazo
de,
Peter
Bencok
b,
Frank
de Groot
f,
Georg
Held
b and
Ricardo
Grau-Crespo
*a
*b,
David C.
Grinter
b,
Santosh
Kumar
b,
Ivan
da Silva
c,
Juan
Rubio-Zuazo
de,
Peter
Bencok
b,
Frank
de Groot
f,
Georg
Held
b and
Ricardo
Grau-Crespo
*a
aDepartment of Chemistry, University of Reading, Whiteknights, Reading RG6 6DX, UK. E-mail: r.grau-crespo@reading.ac.uk
bDiamond Light Source, Harwell Science and Innovation Campus, Didcot OX11 0DE, UK. E-mail: pilar.ferrer-escorihuela@diamond.ac.uk
cISIS Neutron and Muon Source, STFC, Rutherford Appleton Laboratory, Didcot, OX11 0QX, UK
dBM25-SpLine, European Synchrotron Radiation Facility, CS40220, F-38043 Grenoble Cedex 9, France
eICMM-CSIC, Sor Juana Inés de la Cruz 3, Cantoblanco, Madrid, Spain
fDebye Institute for Nanomaterials Science, Utrecht University, 3584 CA Utrecht, The Netherlands
First published on 30th September 2024
Abstract
Spinel ferrites exhibit significant promise in photocatalysis and other applications due to their compositional diversity and favourable electronic structure, magnetism, and partially tuneable cation distribution. However, their complex properties, for example, the different behaviour of bulk and nanostructured materials, are not well understood. Here, we combine advanced computational and experimental methods with reactivity measurements to explore the inversion degrees, electronic structures, and photocatalytic activities of MFe2O4 spinels (M = Co, Cu, Zn). X-ray diffraction and anomalous X-ray scattering measurements determined bulk inversion degrees of 0.81, 0.91, and 0.26 for CoFe2O4, CuFe2O4, and ZnFe2O4, respectively. Photocatalytic tests showed that only ZnFe2O4 is active in the oxygen evolution reaction (OER), which correlates with its favourable band alignment, as determined through electronic structure simulations. Surface-sensitive X-ray Absorption Spectroscopy (XAS) measurements provided insights into the cation distributions at the surfaces, showing significant deviations from bulk properties, particularly in ZnFe2O4 in which 52% of the near-surface tetrahedral sites are occupied by Fe cations, compared to 26% in the bulk. DFT simulations of ZnFe2O4 illustrated how the surface terminations can alter the thermodynamic preference for cation distribution in comparison with the bulk. Our findings illustrate the complex interplay between surface and bulk properties in spinel ferrites.
1. Introduction
Spinel ferrites constitute a versatile family of materials with important applications in photocatalysis,1,2 water purification,3 biomedicine,4 and other fields.5 They are metal oxides with composition MFe2O4, where M represents a divalent metal cation (e.g. Co2+, Cu2+, Zn2+) and iron is present in trivalent form, Fe3+. In a “normal” spinel the M2+ and Fe3+ cations occupy the tetrahedral (Td) and octahedral (Oh) positions, respectively, of the spinel structure (Fig. 1). But for some compositions, the cations are redistributed across the Td and Oh sites, therefore the formula can be written as (M1−xFex)[MxFe2−x]O4 where () represents the Td sites and [] represents the Oh sites. The degree of inversion (0 ≤ x ≤ 1) is defined here as the fraction of Fe3+ cations occupying the Td site. | ||
| Fig. 1 Crystal structure of MFe2O4 spinels represented by (a) the conventional cubic cell and (b) the primitive unit cell. Colour scheme: tetrahedral (Td) sites = silver; octahedral (Oh) sites = gold; oxygen = red. | ||
Spinel ferrites are attractive materials for photocatalytic applications for several reasons. First, their electronic structure and optical properties can be tuned via their composition and/or cation distribution, which allows optimising light absorption or targeting specific band alignments.6–8 Second, they tend to be chemically stable under a wide range of temperatures and pH levels.9 Third, they are magnetic, which allows for easy recovery and reuse of the photocatalyst from the reaction mixture, reducing waste and improving process efficiency.5 Spinel ferrites are also relatively cheap catalysts and can be made up of naturally abundant metals.10,11 One potential application of spinel ferrite photocatalysts is water splitting to produce renewable hydrogen gas, H2.12 Spinels such as CoFe2O4 and CuFe2O4 have been reported as potential photocatalysts for water splitting; however, they are typically used as part of composite photocatalysts.10,13 Drawbacks of cobalt and copper ferrites include poor conductivity, insufficient active sites, rapid charge carrier recombination, and irregular morphology.14,15 In many studies where activity has been observed, a co-catalyst or sacrificial agent has been used alongside the spinel-based catalyst; the use of different sacrificial agents, such as oxalates16,17 or methanol,14,18 can have a significant effect on the efficiency of the catalyst. Another common strategy for improving the activity of CoFe2O4 or CuFe2O4 is constructing heterojunctions with other wide band gap materials, such as Fe2O3 (ref. 19 and 20) or C3N4.21,22 Compared to cobalt and copper ferrites, zinc ferrite, ZnFe2O4, is a more efficient photocatalyst.23 In a study by Rodríguez et al.,24 more than twice the amount of H2 was produced by ZnFe2O4 compared to CoFe2O4 over 8 hours with a methanol sacrificial agent. However, ZnFe2O4 is also still often used in conjunction with a co-catalyst or as a hetero-junction.23,25,26 Intrinsically altering the spinel by cation substitution, such as Ga in place of Fe, has proved effective in improving zinc ferrites performance as a photocatalyst.27 To overcome the limitations of spinel ferrites for water splitting, a fundamental understanding of their electronic and photocatalytic properties is required.
Previous work has suggested substantial differences in the properties of spinel ferrites between bulk crystals and nanoparticles.28,29 For example, the cation distribution in nanoparticles can be significantly different from that in the bulk, and is heavily influenced by factors such as preparation method30 and/or thermal treatment.31 CoFe2O4 is known to have fully inverse cation distribution (x ≈ 1) in the bulk,32,33 whereas in nanoparticles lower degrees of inversion in the range of x = 0.66–0.68 are observed.28,34 CuFe2O4 also displays a high bulk inversion degree; Siddique et al.29 report x = 0.88 in the bulk compared to x = 0.80 in nanoparticle form. However, inversion degrees as low as x = 0.57 have been observed in copper ferrite samples with a particle size of less than 10 nm.35 In contrast, bulk ZnFe2O4 has a very low inversion degree of x ≈ 0,36 whereas ZnFe2O4 nanoparticles display a higher degree of inversion of up to x = 0.4, depending on particle size and thermal history.30,37 Understanding the properties that are inherent to the bulk materials and differentiating them from the effects of the surface is important in applications including photocatalysis, because both the bulk and the surface participate with different roles in the photocatalytic process.
In this study we have used a combination of computational simulations, X-ray absorption spectroscopy, X-ray diffraction, and photocatalytic activity measurements to investigate bulk and surfaces properties of MFe2O4 (M = Co, Cu or Zn) in an effort to rationalise the bulk/surface behaviour of these metal ferrites nanoparticles (particle sizes < 35 nm). In addition to the characterisation of structural, photocatalytic and electronic properties, our modelling offers insights on the departures from bulk behaviour seen in small nanoparticles due to different behaviour of bulk and surfaces in terms of degree of inversion.
2. Methods
2.1 Ab initio simulations of bulk and surface models
The calculations were performed using density functional theory (DFT) as implemented in the VASP code.38,39 Geometry optimisations were performed using the generalised gradient approximation (GGA) with the Perdew–Burke–Ernzerhof (PBE) exchange–correlation functional.40 Hubbard (GGA + U) corrections with Ueff values of 3.3 eV and 4.0 eV were applied to the Co and Cu/Fe d orbitals, respectively; these values were obtained by Wang et al.41via fitting to the experimental oxidation enthalpies of the corresponding binary metal oxides, and have been found to transfer well to the study of more complex oxides (e.g. FeSbO4,42 LaCoO3 and LaFeO3,43 YBa2Fe3−xCoxO8,44 and BiFe1−xCoxO3 (ref. 45)). The interaction between the valence and core electrons was described with the projector augmented wave (PAW) method.46 An energy cut-off of 520 eV, 30% above the recommended value for the PAW potentials, was used for all geometry optimisations involving cell volume charges, to decrease the Pulay errors.For the bulk calculations, primitive unit cells of MFe2O4 (M = Co, Cu, Zn) containing two formula units were modelled with inversion degrees of x = 0, 0.5 and 1. For each inversion degree there is only one symmetrically different configuration in the primitive cell, therefore allowing us to calculate the inversion energy (configurational contribution only) as ΔEconf(x) = E(x) − E(0). The electronic structure calculations to determine the band gap and alignment of the most stable configurations were completed using the hybrid functional by Heyd, Scuseria and Ernzerhof (HSE06),47 which includes 25% of Hartree–Fock exchange as well as range-separated screening with an attenuation parameter of 0.2 Å−1. The HSE06 calculations used the geometries optimised at GGA + U level, i.e. we did not re-optimise the structures at HSE06 level (but we checked, using ZnFe2O4 as a test, that this is an acceptable approximation, leading to both cell parameters and band gaps very close, within 0.5%, to those obtained with the full HSE06 approach). The band alignment was calculated using the top of the valence band and the bottom of the conduction band in the HSE06 band structure.
In all calculations, the magnetic moment for Fe3+ (and for Co2+ in the case of CoFe2O4) was initialised in high-spin state.48,49 For CoFe2O4 there is an additional degree of freedom: both cobalt and iron cations can exist in +2 or +3 oxidation states; therefore, charge transfer could occur resulting in Co3+ and Fe2+ being present. Test calculations were completed in which charge transfer and different spin states of the cations were considered. In all cases, the structures were either higher in energy or converged back to the more stable Co2+/Fe3+ high-spin configuration. Magnetic moment orientations were initialised at the magnetic ground state which was found by considering all the possible orientations of the moments. For ZnFe2O4 with normal distribution, an antiferromagnetic configuration of the Fe3+ in Oh sites had the lowest energy. However, a ferromagnetic orientation of Fe3+ in Oh sites was most stable for normally distributed CoFe2O4 and CuFe2O4. For the ground state of all three spinels structures, when partially or fully inverse, the Fe3+ in Td sites had magnetic moments opposite to the moments of the Fe3+ in the Oh sites.
To simulate the (100) and (111) ZnFe2O4 terminated surfaces, four periodic slab models of ZnFe2O4 with different terminations separated by a vacuum gap of 10 Å were optimised using the same parameters outlined for the bulk GGA + U calculations. These surfaces of the spinel are Tasker type-III surfaces, in which there is a dipole moment perpendicular to the surface which can only be eliminated by surface reconstruction.50 Therefore, we need to modify the slabs to build stoichiometric, non-polar surface models, which are generally expected to be stable under neutral (not very reducing or very oxidising) conditions. Having stoichiometric and non-polar slabs is also important in our work because they are used to estimate the offset of the macroscopic electrostatic potential between the bulk and the vacuum level. However, it is generally possible to study deviations in stoichiometry, as done elsewhere for spinel oxides,51–55 to understand the variation in surface stoichiometry with external conditions, such as the oxygen partial pressure; we have not conducted such analysis here. The details of reconstructions of the surfaces for our study are shown in the ESI Fig. 5,† and the notation for the stoichiometric non-polar surfaces follows the one used in ref. 52. As seen in Fig. 2, reconstructions A and B of the (100) surface terminate on Zn and Fe/O respectively. Building the (111) presented a greater challenge, as the unit cell needed to be expanded in both lateral directions. The (111) surfaces are Fe-terminated, but the (111)B reconstruction also has Zn exposed at the surface, from the second atomic layer. An inversion on the surface was modelled by switching one Fe atom in an Oh site with one Zn atom in a Td site on either side of the slabs to maintain the stoichiometry and symmetry. For the most stable surface termination further inversions were created propagating into the surface.
 | ||
| Fig. 2 Surface structures of ZnFe2O4 (100) and (111) surface reconstructions leading to stoichiometric and non-polar terminations. Only one side of the slab is shown but the other side of the slab is equivalent by symmetry. Colour scheme: Zn = silver; Fe = gold; oxygen = red. | ||
Surface energies (γ) for the different surface terminations were obtained from the equation:
2.2 Semi-empirical simulations of core-level spectra
The semi-empirical quantum many-body program QUANTY,56–58 within the graphical user interface CTM4XAS,59 was used to simulate the Fe L2,3 edges. This semi-empirical approach considers Coulomb interaction, spin–orbit coupling and crystal-field splitting around a given species, without consideration of the crystalline structure. Independent calculations were completed for the three Fe species observed in the spinels: Fe3+ in Oh and Td symmetry and Fe2+ in Oh symmetry. Based on experience in modelling similar systems, the Coulomb interaction was scaled to 94% and 88% of the Hartree–Fock values of the Slater integrals, whereas the spin–orbit coupling parameter were kept at 1.0 (no screening) for both core and valence levels.59 A broadening of 0.1 eV was used for Gaussian functions and broadenings of 0.2–0.4 eV were used for Lorentzian functions in both the Near-Edge X-ray Absorption Fine Structure (NEXAFS) and X-Ray Magnetic Circular Dichroism (XMCD) simulations. The broadening values for each Fe species have been outlined in Table 1, alongside the crystal field parameters. The integrated Fe2+ and Fe3+ spectra of the were normalised to the corresponding numbers of d electrons (6 and 5, respectively). The energies of the simulated spectral shapes were aligned by fitting to the experimental XMCD signals.| Fe species | 10 Dq/eV | Exchange field/meV | |
|---|---|---|---|
| XAS | XMCD | ||
| Fe3+ (Td) | −0.5 | 0 | −90 |
| Fe3+ (Oh) | 1.6 | 0 | 90 |
| Fe2+ (Oh) | 1.2 | 0 | 90 |
2.3 X-ray diffraction
Powder X-ray diffraction (PXRD) patterns from CuFe2O4 and ZnFe2O4 samples were collected on a Rigaku SmartLab diffractometer, using CuKα1 radiation, in reflection mode and at room temperature, over a 2θ range of 10–80°.In the case of the CoFe2O4 spinel, the PXRD technique is limited because Co and Fe have similar atomic numbers (27 and 26, respectively), leading to similar scattering factors, and making it difficult to distinguish between these cations when they share a given spinel site. For this sample, an Anomalous X-Ray Scattering (AXRS) experiment was carried out on the multipurpose six-circle geometry diffractometer of SpLine BM25 Beamline at the European Synchrotron Radiation Facility (Grenoble, France). The CoFe2O4 sample was loaded in a 0.5 mm diameter borosilicate capillary, and the recorded diffraction patterns were collected for sample CoFe2O4: one using a beam energy of 20![[thin space (1/6-em)]](https://www.rsc.org/images/entities/char_2009.gif) 000 eV (6–60° 2θ range), and another one using an energy of 7097 eV (15–67° 2θ range), that is 15 eV below the Fe K-edge absorption edge at 7112 eV.
000 eV (6–60° 2θ range), and another one using an energy of 7097 eV (15–67° 2θ range), that is 15 eV below the Fe K-edge absorption edge at 7112 eV.
The Rietveld method was used for fitting the powder diffraction patterns and crystal structure refinements, by means of the Topas Academic v6 software. The structural starting model used for the refinements was the normal spinel structure and, for the case of AXRS data, the diffraction patterns at both incident energies were fitted simultaneously using the same structural parameters for CoFe2O4. In all cases, the A and B cation occupancy at both Td and Oh crystallographic positions were refined, applying the constrain that both sites should be fully occupied, and that the final calculated formula should be AB2O4.
Instrument peak profile parameters, which were calculated from a Silicon NIST-640C standard reference sample measured at the same conditions as the three different samples, were used to calculate broadening effects, due to crystalline size, and perform particle size analysis.
2.4 Catalytic testing
The catalytic testing was undertaken at the Catalysis Hub based at the Research Complex at Harwell. The photocatalytic oxygen evolution was measured at room temperature in a gas-tight 50 mL quartz photoreactor. The light intensity was adjusted to 1 sun (100 mW cm−2) using an AM 1.5G mass filtered 300 W Xe source. 25 mg of sample was used for each spinel (MFe2O4, M = Co, Cu, Zn) measurement in a 0.5 M AgNO3 medium to act as the hole scavenger. The system was purged for 1 hour with 1.5 bar Ar gas. The gas composition was monitored by gas chromatography with a barrier ionisation discharge (BID) detector (GC, Shimadzu GC-2010 Plus). The oxygen evolution was measured over 5 hours. Reference measurements for each medium were taken to normalise the oxygen evolution data for the spinel samples; further details of the control measurements can be seen in ESI Fig. 3.†2.5 Near-edge X-ray absorption fine structure
Near-edge X-ray absorption fine structure (NEXAFS) measurements were carried out on branch B of the B07 (VerSoX) beamline at Diamond Light Source (DLS) using the total electron yield (TEY) mode collected under 1 mbar helium and corrected for the beamline transmission.60,612.6 X-ray magnetic circular dichroism
X-ray magnetic circular dichroism (XMCD) measurements were carried out on the I10 beamline at DLS on the electromagnet end station in TEY mode. The measurements were done at normal incidence with a positive helicity at room temperature. Varied external magnetic fields of ±1.5 to ±1.9 T were applied to the spinels.623. Results
3.1 Bulk structure: DFT simulations and X-ray diffraction
We first discuss the thermodynamics of cation distribution in the three ternary oxides CoFe2O4, CuFe2O4, and ZnFe2O4. To approximate the free energy of inversion as a function of inversion degree and temperature, we interpolate the inversion energies obtained from the three DFT calculations at x = 0, 0.5 and 1 using a quadratic dependence, which was originally proposed by O'Neill and Navrotsky63 and has subsequently been used in several investigations of the thermodynamics of inversion in spinels.64–66 The interpolated inversion energy functions, ΔEconf, are shown in Fig. 3a. They only depend on the configuration and are therefore independent of the temperature. | ||
| Fig. 3 (a) Inversion energies per formula unit (ΔEconf, configurational contributions only) obtained by DFT, and (b) configurational free energies (ΔFconf) at 300 K (solid line), 600 K (dotted line) and 900 K (dashed line) of CoFe2O4 (blue circles), CuFe2O4 (green diamonds) and ZnFe2O4 (pink triangles). | ||
From the calculated inversion energies, the configurational free energy of inversion, ΔFconf, can be estimated as:
| ΔFconf = ΔEconf − TΔSconf, |

There might be other (excess) contributions to the inversion entropy, arising from energy differences between configurations at a given inversion degree, or from vibrational contributions. However, previous work65 showed that these contributions are relatively small and can be ignored in a first approximation.
The dominant effect is the inversion energy, whereas the entropic term plays a relatively small role. Both CoFe2O4 and CuFe2O4 reach the minimum inversion energy at x = 1, implying a preference to be fully inverse. In contrast, the inversion energy of ZnFe2O4 is positive across the full range of x, with the most stable configuration being normal (x = 0). These results can be rationalised based on simple physical arguments. In A2+B23+O42− spinels, the lattice (Madelung) energy slightly favours the normal cation distribution. Thus, in the absence of crystal field stabilisation energy (CFSE) effects, the normal distribution is preferred, as observed for ZnFe2O4 (d10 cations like Zn2+ and d5 cations like Fe3+ do not have CFSE). In both CoFe2O4 and CuFe2O4 the divalent cation is a transition metal with higher CFSE in the octahedral than in the tetrahedral site (excess octahedral stabilisation energy is 30.9 kJ mol−1 for Co2+ and 63.5 kJ mol−1 for Cu2+ ref. 69); therefore, these spinels favour the inverse distribution.
The inclusion of configurational entropy effects permits the consideration of finite temperatures within this simple model, but it does not change the picture considerably. The free energy of inversion variation with x at different temperatures is shown in Fig. 3b. In the cases of CoFe2O4 and CuFe2O4, the free energy of inversion minima occurs at x = 1 even at high temperatures up to 900 K. On the other hand, the inversion free energy minima of ZnFe2O4 are close to the normal end, ranging from x = 0 at room temperature up to x = 0.2 at 900 K.
We now consider how these theoretical bulk values of the inversion degree compare with the observed values for small nanoparticles. The nanoparticle size, inversion degree (x), cell parameter (a) and the oxygen coordinate parameter (u) of the spinel samples, as determined by AXRS or XRD with the Rietveld method, are listed in Table 2. The corresponding XRD and AXRS patterns can be seen in ESI Fig. 1 and 2.† The particle sizes of the cobalt, copper and zinc ferrites are 35, 24, and 22 nm respectively. CoFe2O4 and CuFe2O4 display high inversion degrees (x) of 0.81 and 0.91 respectively, which are slightly below the DFT-predicted value of 1 (fully inverse) for both systems. In contrast, the degree of inversion of ZnFe2O4 (0.26), although much lower compared to the cobalt and copper ferrites, is more inverse than the DFT predicted normal structure. The inversion energy curve, however, shows a very small x-dependence, therefore small additional entropy contribution can alter the position of the minimum significantly. Overall, the general trends of x agree with that of DFT predictions and with previous literature reports.29,30,32
![[3 with combining macron]](https://www.rsc.org/images/entities/char_0033_0304.gif) m space group
m space group
| Sample | Experimental (nanoparticles at room temperature) | DFT (bulk at 0 K) | |||||
|---|---|---|---|---|---|---|---|
| Size/nm | x | a/Å | u | x | a/Å | u | |
| CoFe2O4 | 35 | 0.81 | 8.398 | 0.246 | 1 | 8.423 | 0.245 |
| CuFe2O4 | 24 | 0.91 | 8.371 | 0.249 | 1 | 8.409 | 0.242 |
| ZnFe2O4 | 22 | 0.26 | 8.439 | 0.243 | 0 | 8.481 | 0.239 |
The absolute values of the cell and oxygen parameters of the nanoparticle samples are generally close to those calculated by DFT, with the largest percentage differences between the experimental and calculated a and u (2% and 3% respectively) being observed in the case of CuFe2O4. The trend in a values observed in the experimental data (Cu < Co < Zn) is also seen in the simulation results. Factors effecting the accuracy of the simulation prediction include the approximations made in the density functional (the generalised gradient approximation), the absence of nanostructuring effects (calculations are done for the infinite bulk crystal), and the temperature difference (0 K in DFT, room temperature for experiment). Also, a direct comparison between the parameters is difficult as the simulated spinels have extreme inversion degrees (i.e. x = 0 or 1), from which the nanoparticles deviate.
3.2 Electronic structure, band alignment, and photocatalysis
The water splitting reaction can be separated into half-reactions, the hydrogen evolution reaction (HER), 2H+ + 2e− → H2, and the oxygen evolution reaction (OER), 2H2O → 4H+ + 4e− + O2. The kinetics of the OER are substantially slower than those of the HER, as evidenced by a large overpotential, making this the rate-limiting step.12,70The photocatalytic OER using Ag+ ions as an electron sacrificial agent on all the samples was carried out under simulated solar light (1 sun). As seen in Fig. 4, CoFe2O4 and CuFe2O4 exhibit very little photocatalytic oxygen evolution across 5 hours of irradiation (<3 μmol g−1 of O2). In contrast, ZnFe2O4 produced approximately 65 μmol g−1 of O2 after 5 hours.
 | ||
| Fig. 4 Photocatalytic oxygen evolution of MFe2O4 (M = Co, Cu or Zn) over a time of 5 hours under simulated sun light using AgNO3 as an electron sacrificial agent. | ||
We now attempt to rationalise the photocatalytic behaviour of the samples in terms of the electronic structures and band alignments. The density of states (DOS), including the partial DOS contributions from the ions, of the spinels can be seen in Fig. 5. In each case, the Fe 3d levels are the main contribution to the conduction band (CB). On the other hand, the character of the valence band (VB) differs among the spinels: the high-lying filled Co 3d levels make the main contribution to the VB of CoFe2O4, leading to the narrowest gap in the series; whereas the absence of d level contributions to the VB of ZnFe2O4 leads to the widest gap among the three spinels. The calculated band gaps of CoFe2O4, CuFe2O4 and ZnFe2O4 are 1.96, 2.17 and 2.84 eV respectively, which are similar to those observed in respective nanoparticle samples in the literature.71,72 These band gap values are all sufficient in principle for photocatalysis of the overall water splitting reaction, for which a minimum thermodynamic potential of 1.23 eV is required.12,70
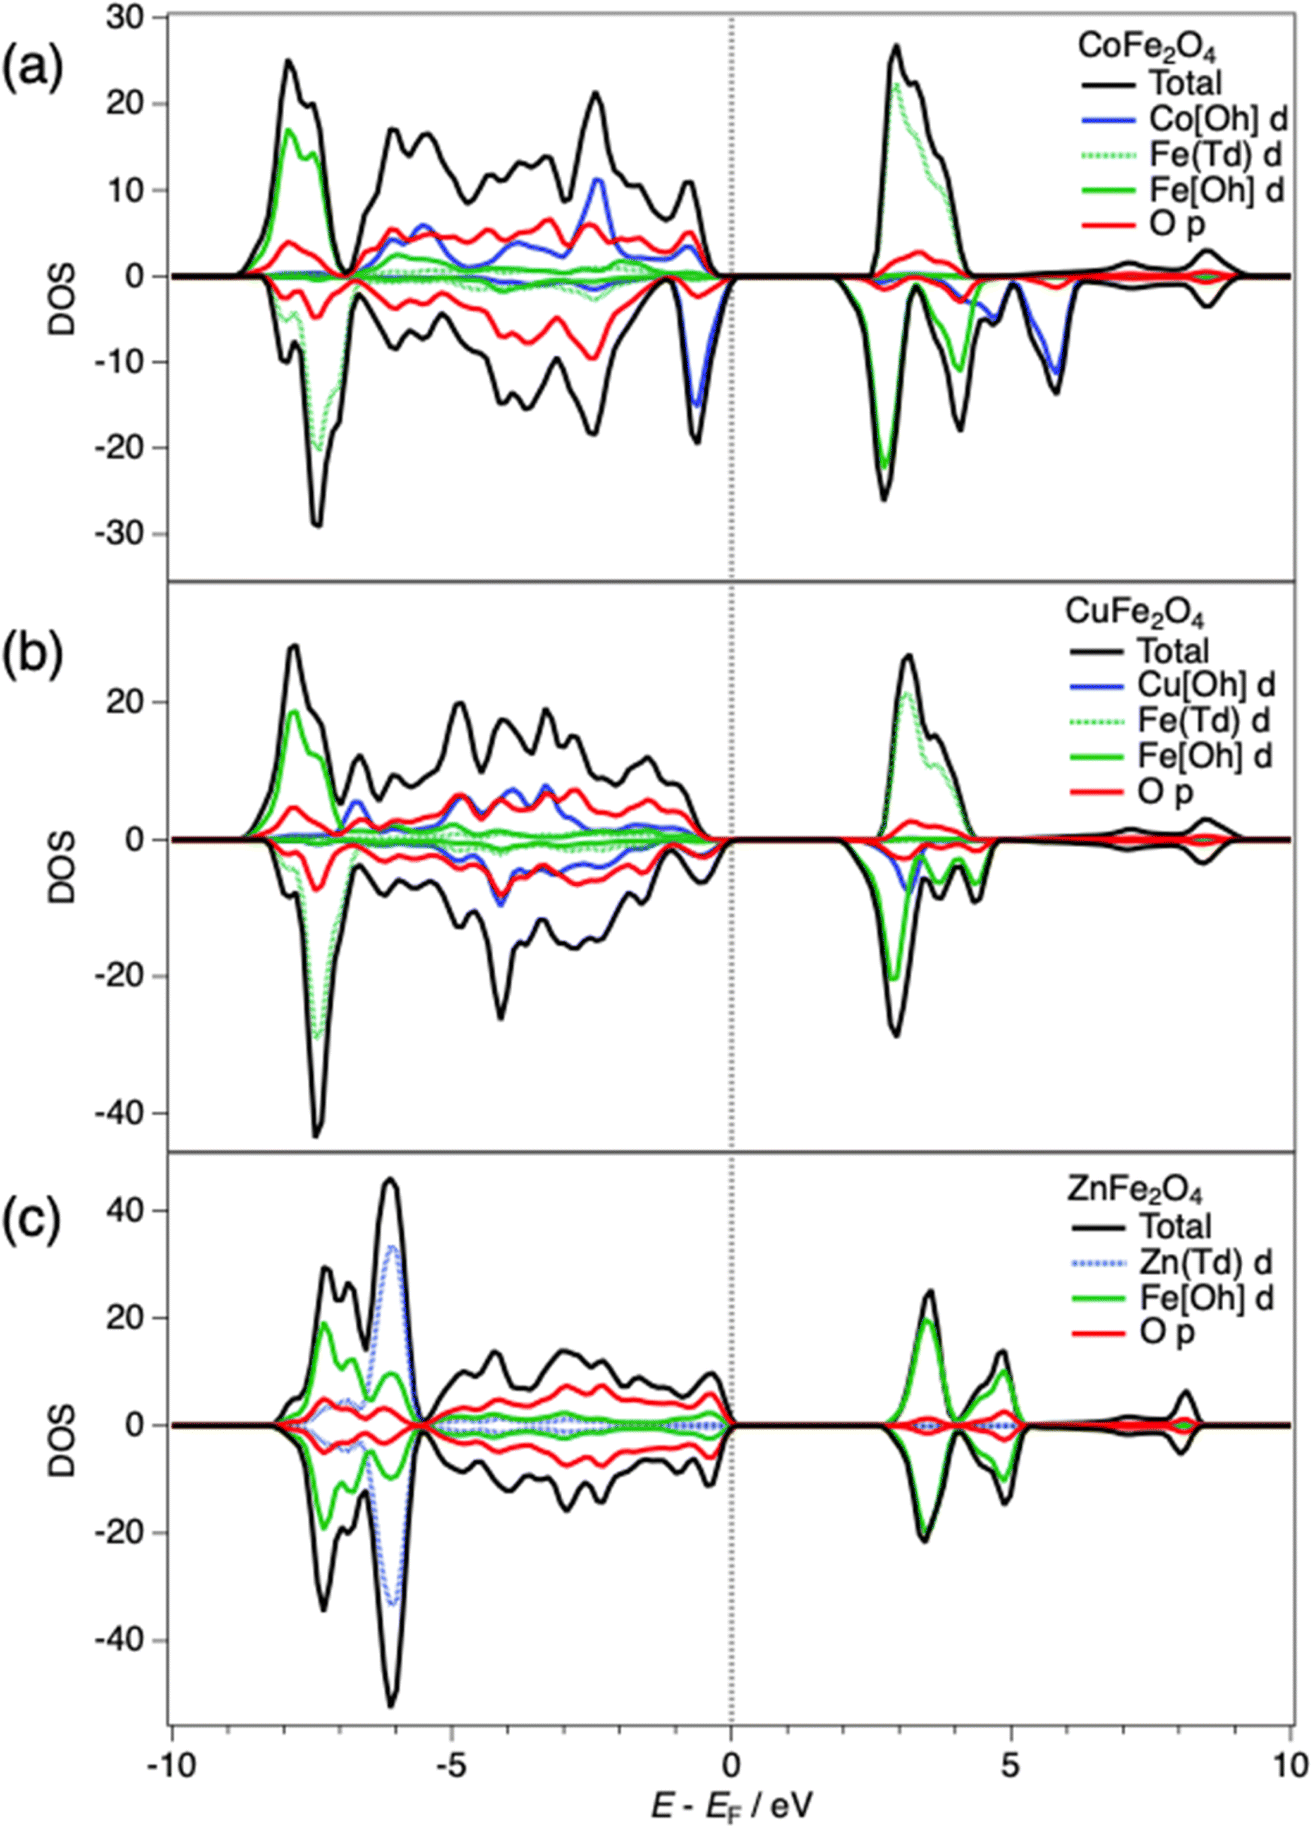 | ||
| Fig. 5 Density of states (DOS) at HSE06 level for (a) CoFe2O4, (b) CuFe2O4 and (c) ZnFe2O4 and partial DOS contributions from Co, Cu, Zn and Fe d orbitals and O p orbitals. | ||
In addition to having a suitable band gap, a semiconductor must also have CB and VB positions straddling the HER and OER levels in order to be a good water splitting photocatalyst (in a single-semiconductor configuration).12 From the bulk simulations, the CB minimum and VB maximum are calculated with respect to the average electron potential in the solid. To compare these potentials with respect to the HER and OER potentials the electronic structure needs to be aligned relative to the vacuum level. To do so, a slab calculation can be used to determine the potential difference (ΔV) between the pseudo-bulk average and the vacuum potential. Fig. 6 shows a stoichiometric slab, with a symmetric (100) terminated surface and vacuum level.
 | ||
| Fig. 6 (a) ZnFe2O4 slab with a (100) termination and (b) the planar-averages of the electrostatic potential. | ||
The calculated band alignment of the spinels with respect to vacuum scale are shown in Fig. 7, compared with potentials of the water splitting half-reactions. The potentials of the HER and OER in the vacuum scale at pH = 0 are −4.44 and −5.67 eV respectively. These energy levels are shifted up with a pH > 0 at temperature T by kBT × pH × ln10.45,73 Therefore, at room temperature and pH = 7 the HER and OER potentials are −4.03 and −5.25 eV respectively, corresponding to those seen in Fig. 7. Despite all three spinels having a suitable band gap to catalyse the overall water splitting process, their band alignments do not fit the thermodynamic requirements, due their high-lying CB minima with respect to the HER potential (−4.03 eV). The lack of oxygen evolution displayed by CoFe2O4 and CuFe2O4 (Fig. 4) could be explained by the VB maxima positions, which lie above the OER potential (−5.25 eV). In contrast, the band alignment of ZnFe2O4 meets the thermodynamic requirements for the OER, with a VB potential −5.90 eV.
 | ||
| Fig. 7 Calculated CB and VB positions and band gaps of MFe2O4 (M = Co, Cu or Zn). Half-reaction potentials for water splitting are represented by dotted lines. | ||
3.3 Surface effects: NEXAFS and XMCD experiments and slab calculations
While the prior discussion is focused on bulk properties, the behaviour at the oxide surfaces, where the actual catalytic reactions take place, might depart considerably from the bulk behaviour. Understanding the surface properties of these complex oxides is challenging, but some insights can be obtained from using surface-sensitive techniques, such as total electron yield (TEY) NEXAFS and XMCD. These techniques probe approximately 2 nm into the sample surface. The Fe L2,3 edges measured in TEY mode by NEXAFS of CoFe2O4, CuFe2O4, and ZnFe2O4 are shown in Fig. 8a. The spectral features are dependent on the relative quantities of each iron species, as calculated in Fig. 8b. The intensity of the feature between the pre- and main edges at 708 eV (indicated by the red arrow in Fig. 8a) can be related to the presence or absence of tetrahedral (Td) Fe3+. The width of the main edge at 709 eV is also affected by the cation distribution. In ZnFe2O4, the intensity of this feature is lower compared to CoFe2O4 and CuFe2O4, indicating that there is less Fe3+ (Td) (i.e. less inversion) in the zinc ferrite surface compared to the surface of the other two spinels. Therefore, the same trend in cation distribution is observed in both the surface and bulk of these materials. However, quantitively determining the relative amounts of the different Fe species is difficult to do by just fitting NEXAFS spectra; more spectral features or information is required, which can be obtained from XMCD. | ||
| Fig. 8 (a) Fe L2,3 edge NEXAFS spectra of MFe2O4 (M = Co, Cu or Zn) and (b) calculated spectra of Fe3+ (Td), Fe3+ (Oh) and Fe2+ (Oh) by CTM4XAS. | ||
The Fe L3 edges measured by XMCD seen in Fig. 9a–c (also collected in TEY mode, and therefore surface-sensitive) display spectral features that are more distinguishable between the different Fe species, compared to NEXAFS. The features at 707.5 eV, 708.7 eV and 709.4 eV can be attributed mainly to contributions from Fe2+ (Oh), Fe3+ (Td) and Fe3+ (Oh), respectively, with the Oh and Td ions displaying opposite dichroism. The difference of around 2 eV observed in our spinel XMCD spectra between the Fe2+ and Fe3+ peak maxima in Oh coordination is smaller than that reported for magnetite (Fe3O4), a fully inverse spinel (2.5 eV).74 However, the relative shifts between the iron species peak maxima observed in Fig. 9a–c are comparable with XMCD shifts reported of spinel ferrite reported in the literature.75,76 The relative quantities of the Fe species at the surface can be estimated by fitting a combination of the calculated species-specific spectra (Fig. 9d) to the experimental spectra. Since the XMCD measurements were also collected in TEY mode, the Fe distribution at the near-surface can be determined. The percentages of Fe2+/Fe3+ in Oh/Td sites, as derived from the XMCD fit, are listed in the ESI Table 1.† The fit of the CoFe2O4 signal showed 76% percent of near-surface Td sites are occupied by Fe cations, in contrast to 81% of Fe occupied Td sites in the bulk. A similar difference was observed in CuFe2O4 with 74% of the near-surface Td sites being occupied by Fe cations, compared to 91% in the bulk. ZnFe2O4 showed a significant contrast from 26% of Td occupied by Fe in the bulk to 52% at the surface. The XMCD signals also indicate that around 20% of the Fe in Oh was Fe2+ in all three of the samples, indicating some level of surface reduction which could be explained by the formation of oxygen vacancies or other surface defects.
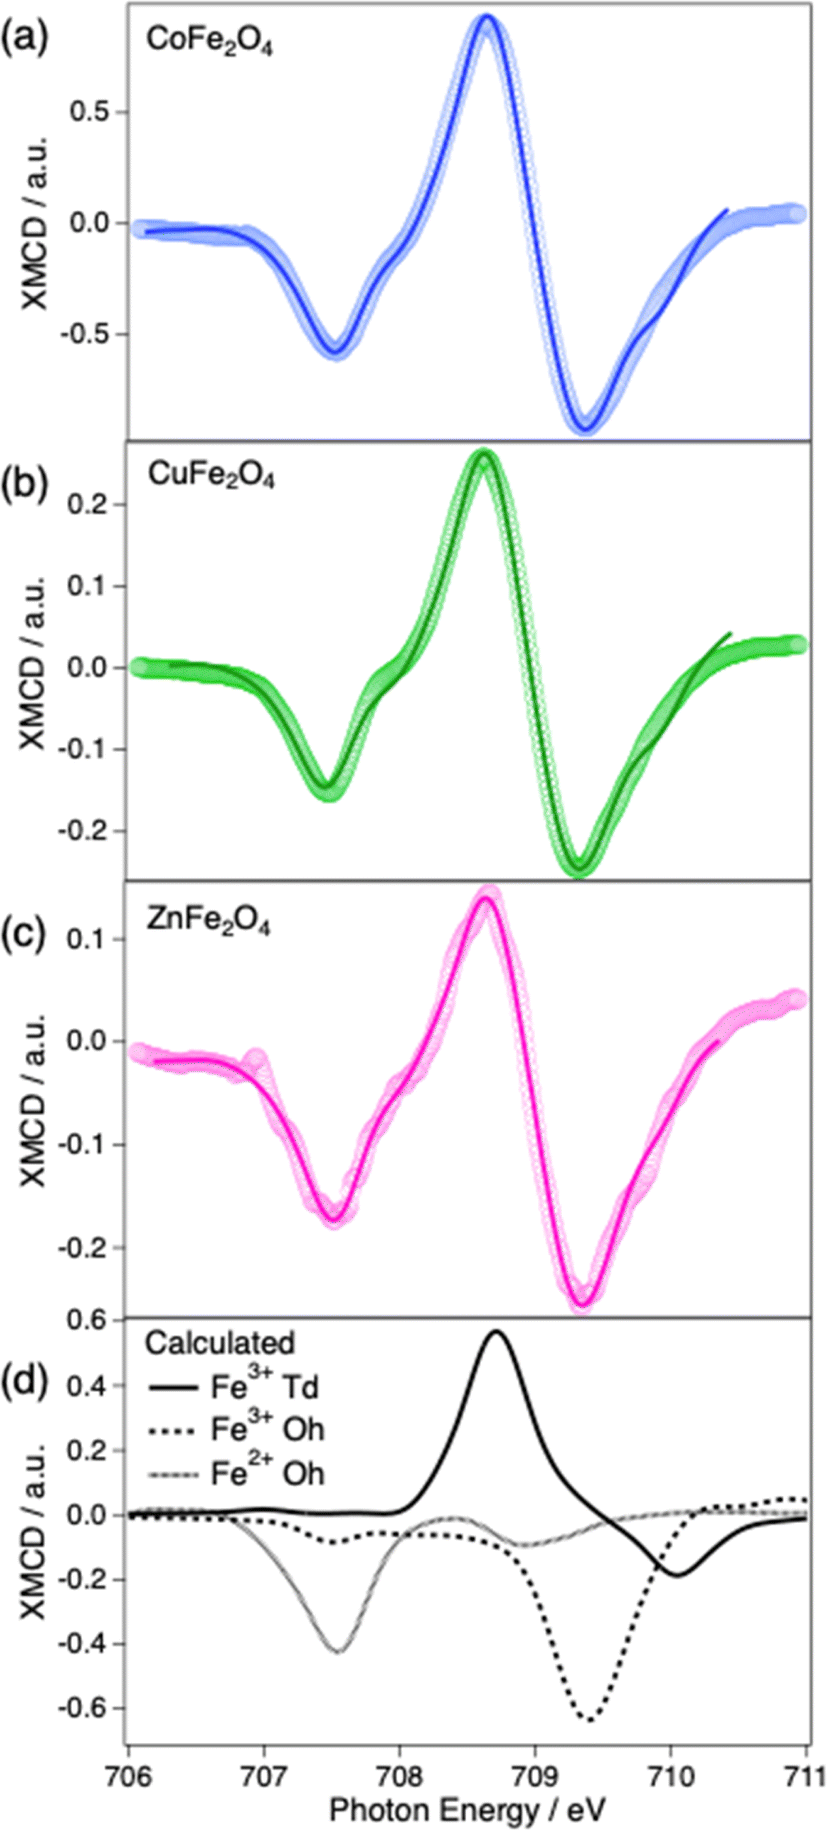 | ||
| Fig. 9 Fe L3 edge XMCD spectra of (a) CoFe2O4, (b) CuFe2O4 and (c) ZnFe2O4 in which the circles are the experimental data and the solid line are the calculated spectra. (d) the calculated Fe L3 edge of Fe3+ (Td), Fe3+ (Oh) and Fe2+ (Oh) by CTM4XAS. | ||
To illustrate how the presence of the surface can alter the preferred cation distribution observed in the bulk, we conducted DFT simulations in ZnFe2O4 slabs with different surface terminations (Fig. 2) and cation distributions (swapping Zn and Fe cations at the top layer). Only ZnFe2O4 was considered for the surface calculations, since for this composition nanoparticles have a significant difference in the inversion degree observed in the surface compared to the bulk. Also, unlike CoFe2O4 and CuFe2O4, zinc ferrite was the only sample that demonstrated any catalytic activity for the OER.
The relaxation of the different terminations can be seen in ESI Fig. 6 and 7.† In the (100)A and (111)A terminated surfaces, the surface cations shift towards the bulk by up to 1.2 Å, which generates minor distortion or shifting towards surface within their sub-surface layers. The (100)B sub-surface layers shift towards bulk, however the top cations remain relatively fixed in the square structure. Minimal cation shifting occurs in the surface and sub-surface layers in (111)B structures during relaxation.
The calculated surface energies are summarised in Table 3. The most stable surface is the Zn-terminated (100)A surface, whereas the Fe/O-terminated (100)B surface is much less stable. This result aligns with a previous ab initio study that found that the (100) surface of zinc ferrite is always more stable when Zn-terminated, regardless of the presence of O-rich or O-poor conditions.54 We also find that the (111) surface is less stable than the (100)A termination. This contrasts with the conclusion from a theoretical study by Guo et al.53 that found that the (111) surface is the most stable under the range of chemical potentials at which bulk ZnFe2O4 is stable. Since we do not perform an analysis here as a function of chemical potentials, it is difficult to compare with the results of ref. 53. However, for the purpose of this work, we are less interested in the relative stabilities of the surfaces, and more focused on the effect of changes in the cation distribution at the surface with respect to that of the bulk.
| Surface | Termination | Cation distribution at surface | γ/J m−2 |
|---|---|---|---|
| (100) | A | Normal | 1.28 |
| Inverted | 1.26 | ||
| B | Normal | 2.91 | |
| Inverted | 1.91 | ||
| (111) | A | Normal | 2.32 |
| Inverted | 1.62 | ||
| B | Normal | 1.75 | |
| Inverted | 1.61 |
The comparison of the normal vs. inverted distribution of cations shows that in all cases the surface becomes more stable after the cation inversion at the surface. The (100)A surface has the smallest difference in surface energy between the normal and inverted surface (0.02 J m−2). In contrast, the (100)B termination was the least stable normal surface, but showed the most stabilisation with the inversion. The (111)B termination is more stable than the (111)A termination with no inversion; however, when inverted there is only a 0.01 J m−2 difference in surface energy between the A and B terminations.
The stabilisation of inversion at the ZnFe2O4 surfaces illustrates how surface terminations, which imply a change in cation coordination, can alter the thermodynamic preferences observed in the bulk, which were driven by crystal field effects. To investigate how deep this effect can propagate from the oxide in the top layer, a second cation pair in the sub surface was inverted in the most stable surface termination, (100)A. The relaxation of this surface can be seen in ESI Fig. 8.† A similar shift and distortion in the surface and sub-surface layers is observed in both the (100)A surface with one and two inverted cation pairs. The calculated inversion energies (ΔE) of the normal and inverted (100)A surfaces are shown in Table 4. A negative inversion energy of −10.6 kJ mol−1 is observed when one inversion is created on the surface, therefore increasing the stability as seen in the surface energies (Table 3). When creating a second inversion in the sub-surface layer the inversion energy is even lower at −16.9 kJ mol−1. This demonstrates that it is thermodynamically favourable for inversion to be propagated deeper into top layer of ZnFe2O4. In contrast, creating an inversion in the bulk is an unfavourable process, with a calculated inversion energy of 10.6 kJ mol−1.
| Surface | Number of cation pair inversions on surface | ΔE/kJ mol−1 |
|---|---|---|
| (100)A | 0 | 0.0 |
| 1 | −10.6 | |
| 2 | −16.9 |
Given the small size and high specific surface of the oxide nanoparticles, these surface effects can have a significant impact on the overall cation distributions in the nanoparticles. It is indeed reported that small nanoparticles of ZnFe2O4 tend to have higher degree of inversion compared to bulk material.30,77,78 Due to the nature of the simulated surfaces, an extensive study of the surface effects, including reduction and oxygen vacancies, have not yet been investigated. However, given the important role of nanostructuring (and surfaces) in photocatalysis, these effects deserve further research attention.
4. Conclusions
Our comprehensive study on MFe2O4 (M = Co, Cu, Zn) spinel ferrites, using a combination of theoretical and experimental techniques, provides insights into their structure, electronic properties, and photocatalytic behaviours. The results from DFT simulations align well with experimental findings, revealing distinct inversion degrees and photocatalytic activities across the spinels. The DFT-predicted preference for inverse configurations in CoFe2O4 and CuFe2O4 and a normal configuration in ZnFe2O4 were confirmed by X-ray diffraction and AXRS measurements which showed inversion degrees of 0.81, 0.91, and 0.26, respectively.Among the three spinel compositions, only ZnFe2O4 demonstrated photocatalytic activity for the oxygen evolution reaction (OER), generating 65 μmol g−1 of oxygen over 5 hours under UV irradiation. This can be attributed to its favourable band alignment, as demonstrated through our electronic structure simulations. CoFe2O4 and CuFe2O4 do not exhibit OER activity, which could be explained by their band positions relative to the OER potential.
Surface-sensitive measurements via X-ray Absorption Spectroscopy (XAS) reveal significant variations in cation distribution at the surface compared to the bulk, particularly in CuFe2O4 (74% of the near-surface Td sites being occupied by Fe cations, compared to 91% in the bulk) and ZnFe2O4 (52% of the near-surface Td sites occupied by Fe cations, compared to 26% in bulk). These findings highlight the influence of surface chemistry on the photocatalytic properties of these materials. Further, DFT simulations of surface terminations provided additional understanding of the stability and properties of the surfaces, showing that cation inversion is energetically favourable at the surfaces of ZnFe2O4, even if it is not in the bulk. Our calculations show that the effect of the surface termination in the energetics of cation inversion propagates beyond the top surface layer. The role of surface defects such as oxygen vacancies in the stabilisation of cation inversion at the surface requires investigation in the future.
This study not only deepens the understanding of spinel ferrites but also illustrates the critical role of both bulk and surface properties in determining the photocatalytic performance of these materials. Future work should continue to explore the intricate relationship between structural characteristics and catalytic activities, potentially leading to the development of more effective photocatalytic materials based on spinel ferrites.
Data availability
The experimental and computational data underlying this study are openly available in the University of Reading Research Data Archive at https://doi.org/10.17864/1947.001342.Conflicts of interest
No conflicts of interest.Acknowledgements
We are grateful to the UK Materials and Molecular Modelling Hub for computational resources, which is partially funded by EPSRC (EP/T022213/1, EP/W032260/1 and EP/P020194/1). C. A. H. acknowledges financial support for her PhD studies by Diamond Light Source (DLS) and the University of Reading. Collaboration with the Utrecht group was funded by COST Action CA18234 (CompNanoEnergy), supported by COST (European Cooperation in Science and Technology) https://www.cost.eu. Authors thank D. L. S. for beamtime on B07-B under proposal SI33639 and SI34919 and on I10 under proposal MM36558; ESFR for beamtime on BM25 under proposal A25-2-1023; ISIS Neutron and Muon Source, for access to the facilities at the Materials Characterisation Laboratory. We also thank the Research Complex and the UK Catalysis Hub at Harwell Campus. J. R. Z. acknowledges the Spanish Ministerio de Ciencia, Innovación y Universidades and Consejo Superior de Investigaciones Científicas for financial support and for provision of synchrotron radiation facilities at BM25-SpLine (PIE 2010 6 0E 013 and PIE 2021 60 E 030).References
- H. Ma and C. Liu, Front. Energy, 2021, 15, 621–630 CrossRef.
- T. Tatarchuk, B. Al-Najar, M. Bououdina and M. A. A. Ahmed, in Handbook of Ecomaterials, 2018, ch. 158-1, pp. 1–50, DOI:10.1007/978-3-319-48281-1_158-1.
- D. H. K. Reddy and Y.-S. Yun, Coord. Chem. Rev., 2016, 315, 90–111 CrossRef CAS.
- M. Amiri, M. Salavati-Niasari and A. Akbari, Adv. Colloid Interface Sci., 2019, 265, 29–44 CrossRef CAS PubMed.
- S. J. Salih and W. M. Mahmood, Heliyon, 2023, 9, e16601 CrossRef CAS.
- M. Feng, A. Yang, X. Zuo, C. Vittoria and V. G. Harris, J. Appl. Phys., 2010, 107, 09A521 CrossRef.
- G. Liu, J. Wang, X. Sheng, X. Xue and Y. Wang, Ceram. Int., 2023, 49, 29747–29754 CrossRef CAS.
- Z. Szotek, W. M. Temmerman, D. Ködderitzsch, A. Svane, L. Petit and H. Winter, Phys. Rev. B: Condens. Matter Mater. Phys., 2006, 74, 174431 CrossRef.
- V. Tsurkan, H.-A. Krug von Nidda, J. Deisenhofer, P. Lunkenheimer and A. Loidl, Phys. Rep., 2021, 926, 1–86 CrossRef CAS.
- M. G. Idris, H. Y. Hafeez, J. Mohammed, A. B. Suleiman and C. E. Ndikilar, Appl. Surf. Sci. Adv., 2023, 18, 100468 CrossRef.
- K. Malaie, Z. Heydari and M. R. Ganjali, Int. J. Hydrogen Energy, 2021, 46, 3510–3529 CrossRef.
- S. A. Razek, M. R. Popeil, L. Wangoh, J. Rana, N. Suwandaratne, J. L. Andrews, D. F. Watson, S. Banerjee and L. F. J. Piper, Electron. Struct., 2020, 2, 023001 CrossRef.
- S. Chandrasekaran, C. Bowen, P. Zhang, Z. Li, Q. Yuan, X. Ren and L. Deng, J. Mater. Chem. A, 2018, 6, 11078–11104 RSC.
- S. Bera, S. Ghosh, T. Maiyalagan and R. N. Basu, ACS Appl. Energy Mater., 2022, 5, 3821–3833 CrossRef.
- H. Wang, Q. Hu, J. Qiu, R. Guo and X. Liu, Catal. Sci. Technol., 2023, 13, 6102–6125 RSC.
- M. Benlembarek, N. Salhi, R. Benrabaa, A. M. Djaballah, A. Boulahouache and M. Trari, Int. J. Hydrogen Energy, 2022, 47, 9239–9247 CrossRef CAS.
- H. Yang, J. Yan, Z. Lu, X. Cheng and Y. Tang, J. Alloys Compd., 2009, 476, 715–719 CrossRef CAS.
- G. He, Y. Wen, C. Ma, X. Li, L. Gao and Z. Sun, Int. J. Hydrogen Energy, 2021, 46, 5369–5377 CrossRef CAS.
- A. Farooq, S. Khalil, B. Basha, A. Habib, M. S. Al-Buriahi, M. F. Warsi, S. Yousaf and M. Shahid, Int. J. Hydrogen Energy, 2024, 51, 1318–1332 CrossRef CAS.
- S. Hussain, S. Hussain, A. Waleed, M. M. Tavakoli, Z. Wang, S. Yang, Z. Fan and M. A. Nadeem, ACS Appl. Mater. Interfaces, 2016, 8, 35315–35322 CrossRef CAS PubMed.
- S. Bellamkonda, C. Chakma, S. Guru, B. Neppolian and G. R. Rao, Int. J. Hydrogen Energy, 2022, 47, 18708–18724 CrossRef CAS.
- R. Cheng, X. Fan, M. Wang, M. Li, J. Tian and L. Zhang, RSC Adv., 2016, 6, 18990–18995 RSC.
- R. Dillert, D. H. Taffa, M. Wark, T. Bredow and D. W. Bahnemann, APL Mater., 2015, 3, 104001 CrossRef.
- A. A. Rodríguez-Rodríguez, M. B. Moreno-Trejo, M. J. Meléndez-Zaragoza, V. Collins-Martínez, A. López-Ortís, E. Martínez-Guerra and M. Sánchez-Domínguez, Int. J. Hydrogen Energy, 2019, 44, 12421–12429 CrossRef.
- L. Kong, Z. Jiang, T. Xiao, L. Lu, M. O. Jones and P. P. Edwards, Chem. Commun., 2011, 47, 5512–5514 RSC.
- S. Xu, D. Feng and W. Shangguan, J. Phys. Chem. C, 2009, 113, 2463–2467 CrossRef.
- X. Xu, A. K. Azad and J. T. S. Irvine, Catal. Today, 2013, 199, 22–26 CrossRef.
- D. Carta, M. F. Casula, A. Falqui, D. Loche, G. Mountjoy, C. Sangregorio and A. Corrias, J. Phys. Chem. C, 2009, 113, 8606–8615 CrossRef.
- M. Siddique and N. M. Butt, Phys. B Condens. Matter, 2010, 405, 4211–4215 CrossRef.
- F. S. Li, L. Wang, J. B. Wang, Q. G. Zhou, X. Z. Zhou, H. P. Kunkel and G. Williams, J. Magn. Magn. Mater., 2004, 268, 332–339 CrossRef.
- L. I. Granone, R. Dillert, P. Heitjans and D. W. Bahnemann, ChemistrySelect, 2019, 4, 1232–1239 CrossRef.
- J. Venturini, A. M. Tonelli, T. B. Wermuth, R. Y. S. Zampiva, S. Arcaro, A. Da Cas Viegas and C. P. Bergmann, J. Magn. Magn. Mater., 2019, 482, 1–8 CrossRef CAS.
- W. H. Wang and X. Ren, J. Cryst. Growth, 2006, 289, 605–608 CrossRef.
- H. L. Andersen, M. Saura-Muzquiz, C. Granados-Miralles, E. Canevet, N. Lock and M. Christensen, Nanoscale, 2018, 10, 14902–14914 RSC.
- D. Pajić, K. Zadro, R. E. Vanderberghe and I. Nedkov, J. Magn. Magn. Mater., 2004, 281, 353–363 CrossRef.
- J. R. Sandemann, K. A. H. Stockler, X. Wang, B. C. Chakoumakos and B. B. Iversen, J. Am. Chem. Soc., 2023, 145, 21053–21065 CrossRef PubMed.
- J. Philip, G. Gnanaprakash, G. Panneerselvam, M. Antony, T. Jayakumar and B. Raj, J. Appl. Phys., 2007, 102, 054305 CrossRef.
- G. Kresse and J. Furthmüller, Phys. Rev. B: Condens. Matter Mater. Phys., 1996, 54, 11169 CrossRef PubMed.
- G. Kresse and J. Furthmüller, Comput. Mater. Sci., 1996, 6, 15–50 CrossRef.
- J. P. Perdew, K. Burke and M. Ernzerhof, Phys. Rev. Lett., 1996, 77, 3865 CrossRef PubMed.
- L. Wang, T. Maxisch and G. Ceder, Phys. Rev. B: Condens. Matter Mater. Phys., 2006, 73, 195107 CrossRef.
- R. Grau-Crespo, F. Corà, A. A. Sokol, N. H. de Leeuw and C. R. A. Catlow, Phys. Rev. B: Condens. Matter Mater. Phys., 2006, 73, 035116 CrossRef.
- Y.-L. Lee, M. J. Gadre, Y. Shao-Horn and D. Morgan, Phys. Chem. Chem. Phys., 2015, 17, 21643–21663 RSC.
- C. Collins, M. S. Dyer, A. Demont, P. A. Chater, M. F. Thomas, G. R. Darling, J. B. Claridge and M. J. Rosseinsky, Chem. Sci., 2014, 5, 1493–1505 RSC.
- S. Grover, K. T. Butler, U. V. Waghmare and R. Grau-Crespo, Adv. Theory Simul., 2023, 6, 2200673 CrossRef.
- P. E. Blöchl, Phys. Rev. B: Condens. Matter Mater. Phys., 1994, 50, 17953–17979 CrossRef.
- J. Heyd, G. E. Scuseria and M. Ernzerhof, J. Chem. Phys., 2003, 118, 8207–8215 CrossRef.
- A. Hossain, M. S. I. Sarker, M. K. R. Khan and M. M. Rahman, Mater. Sci. Eng. B, 2020, 253, 114496 CrossRef.
- Y. H. Hou, Y. J. Zhao, Z. W. Liu, H. Y. Yu, X. C. Zhong, W. Q. Qiu, D. C. Zeng and L. S. Wen, J. Phys. D: Appl. Phys., 2010, 43, 445003 CrossRef.
- P. W. Tasker, J. Phys. C: Solid State Phys., 1979, 12, 4977 CrossRef.
- Q. Cai, J.-g. Wang, Y. Wang and D. Mei, J. Phys. Chem. C, 2016, 120, 19087–19096 CrossRef.
- D. Santos-Carballal, A. Roldan, R. Grau-Crespo and N. H. de Leeuw, Phys. Chem. Chem. Phys., 2014, 16, 21082–21097 RSC.
- H. Guo, A. C. Marschilok, K. J. Takeuchi, E. S. Takeuchi and P. Liu, ACS Appl. Mater. Interfaces, 2018, 10, 35623–35630 CrossRef PubMed.
- K. L. S. Rodríguez, J. J. M. Quintero, H. H. Medina Chanduví, A. V. G. Rebaza, R. Faccio, W. A. Adeagbo, W. Hergert, C. E. R. Torres and L. A. Errico, Appl. Surf. Sci., 2020, 499, 143859 CrossRef.
- R. E. Warburton, H. Iddir, L. A. Curtiss and J. Greeley, ACS Appl. Mater. Interfaces, 2016, 8, 11108–11121 CrossRef.
- M. W. Haverkort, G. Sangiovanni, P. Hansmann, A. Toschi, Y. Lu and S. Macke, Europhys. Lett., 2014, 108, 57004 CrossRef.
- M. W. Haverkort, M. Zwierzycki and O. K. Andersen, Phys. Rev. B: Condens. Matter Mater. Phys., 2012, 85, 165113 CrossRef.
- Y. Lu, M. Höppner, O. Gunnarsson and M. W. Haverkort, Phys. Rev. B: Condens. Matter Mater. Phys., 2014, 90, 085102 CrossRef.
- E. Stavitski and F. M. F. de Groot, Micron, 2010, 41, 687–694 CrossRef PubMed.
- G. Held, F. Venturini, D. C. Grinter, P. Ferrer, R. Arrigo, L. Deacon, W. Quevedo Garzon, K. Roy, A. Large, C. Stephens, A. Watts, P. Larkin, M. Hand, H. Wang, L. Pratt, J. J. Mudd, T. Richardson, S. Patel, M. Hillman and S. Scott, J. Synchrotron Radiat., 2020, 27, 1153–1166 CrossRef PubMed.
- D. C. Grinter, P. Ferrer, F. Venturini, M. A. van Spronsen, A. I. Large, S. Kumar, M. Jaugstetter, A. Iordachescu, A. Watts, S. L. M. Schroeder, A. Kroner, F. Grillo, S. M. Francis, P. B. Webb, M. Hand, A. Walters, M. Hillman and G. Held, J. Synchrotron Radiat., 2024, 578–589, DOI:10.1107/S1600577524001346.
- H. Wang, P. Bencok, P. Steadman, E. Longhi, J. Zhu and Z. Wang, J. Synchrotron Radiat., 2012, 19, 944–948 CrossRef PubMed.
- H. S. C. O'Neill and A. Navrotsky, Am. Mineral., 1983, 68, 181–194 Search PubMed.
- D. Santos-Carballal, A. Roldan, R. Grau-Crespo and N. H. de Leeuw, Phys. Rev. B: Condens. Matter Mater. Phys., 2015, 91, 195106 CrossRef.
- Y. Seminovski, P. Palacios, P. Wahnón and R. Grau-Crespo, Appl. Phys. Lett., 2012, 100, 102112 CrossRef.
- S.-H. Wei and S. Zhang, Phys. Rev. B: Condens. Matter Mater. Phys., 2001, 63, 075205 CrossRef.
- A. Navrotsky and O. J. Kleppa, J. Inorg. Nucl. Chem., 1967, 29, 2701–2714 CrossRef.
- F. Tielens, M. Calatayud, R. Franco, J. M. Recio, J. Pérez-Ramírez and C. Minot, J. Phys. Chem. B, 2006, 110, 988–995 CrossRef PubMed.
- J. D. Dunitz and L. E. Orgel, in Advances in Inorganic Chemistry and Radiochemistry, ed. H. J. Emeleus and A. G. Sharpe, Academic Press, 1960, vol. 2, pp. 1–60 Search PubMed.
- L. Yuan, C. Han, M.-Q. Yang and Y.-J. Xu, Int. Rev. Phys. Chem., 2016, 35, 1–36 Search PubMed.
- N. Guijarro, P. Bornoz, M. Prévot, X. Yu, X. Zhu, M. Johnson, X. Jeanbourquin, F. Le Formal and K. Sivula, Sustain. Energy Fuels, 2018, 2, 103–117 Search PubMed.
- M. Sundararajan, L. John Kennedy, P. Nithya, J. Judith Vijaya and M. Bououdina, J. Phys. Chem. Solids, 2017, 108, 61–75 CrossRef CAS.
- Q. Liang, G. Brocks and A. Bieberle-Hütter, J. Phys.: Energy, 2021, 3, 026001 CAS.
- H. Elnaggar, R. Wang, M. Ghiasi, M. Yañez, M. U. Delgado-Jaime, M. H. Hamed, A. Juhin, S. S. Dhesi and F. de Groot, Phys. Rev. Mater., 2020, 4, 026001 CrossRef.
- B. Liu, C. Piamonteze, M. U. Delgado-Jaime, R.-P. Wang, J. Heidler, J. Dreiser, R. Chopdekar, F. Nolting and F. M. F. de Groot, Phys. Rev. B, 2017, 96, 026001 Search PubMed.
- R. A. D. Pattrick, G. Van Der Laan, C. M. B. Henderson, P. Kuiper, E. Dudzik and D. J. Vaughan, Eur. J. Mineral., 2002, 14, 1095–1102 CrossRef CAS.
- V. Blanco-Gutierrez, E. Climent-Pascual, M. J. Torralvo-Fernandez, R. Saez-Puche and M. T. Fernandez-Diaz, J. Solid State Chem., 2011, 184, 1608–1613 CrossRef CAS.
- M. Á. Cobos, P. de la Presa, I. Puente-Orench, I. Llorente, I. Morales, A. García-Escorial, A. Hernando and J. A. Jiménez, Ceram. Int., 2022, 48, 12048–12055 CrossRef CAS.
Footnote |
| † Electronic supplementary information (ESI) available. See DOI: https://doi.org/10.1039/d4ta04941a |
| This journal is © The Royal Society of Chemistry 2024 |