
 Open Access Article
 This Open Access Article is licensed under a Creative Commons Attribution-Non Commercial 3.0 Unported Licence
Combined experimental and computational study of the photoabsorption of the monodoped and nondoped nanoclusters Au24Pt(SR)18, Ag24Pt(SR)18, and Ag25(SR)18†
Pierpaolo
D’Antoni
a,
Luca
Sementa
b,
Sara
Bonacchi
 c,
Mattia
Reato
c,
Flavio
Maran
*cd,
Alessandro
Fortunelli
*b and
Mauro
Stener
*a
c,
Mattia
Reato
c,
Flavio
Maran
*cd,
Alessandro
Fortunelli
*b and
Mauro
Stener
*a
aDipartimento di Scienze Chimiche e Farmaceutiche, Università di Trieste, Via Giorgieri 1, I-34127 Trieste, Italy. E-mail: stener@units.it
bCNR-ICCOM & IPCF, Consiglio Nazionale delle Ricerche, Via Giuseppe Moruzzi 1, I-56124 Pisa, Italy. E-mail: alessandro.fortunelli@cnr.it
cDepartment of Chemistry, University of Padova, Via Marzolo 1, I-35131 Padova, Italy. E-mail: flavio.maran@unipd.it
dDepartment of Chemistry, University of Connecticut, 55 North Eagleville Road, Storrs, Connecticut 06269, USA
First published on 7th June 2024
Abstract
Assessing the accuracy of first-principles computational approaches is instrumental to predict electronic excitations in metal nanoclusters with quantitative confidence. Here we describe a validation study on the optical response of a set of monolayer-protected clusters (MPC). The photoabsorption spectra of Ag25(DMBT)18−, Ag24Pt(DMBT)182− and Au24Pt(SC4H9)18, where DMBT is 2,4-dimethylbenzenethiolate and SC4H9 is n-butylthiolate, have been obtained at low temperature and compared with accurate TDDFT calculations. An excellent match between theory and experiment, with typical deviations of less than 0.1 eV, was obtained, thereby validating the accuracy and reliability of the proposed computational framework. Moreover, an analysis of the TDDFT simulations allowed us to ascribe all relevant spectral features to specific transitions between occupied/virtual orbital pairs. The doping effect of Pt on the optical response of these ultrasmall MPC systems was identified and discussed.
1. Introduction
Metal nanoclusters protected by a layer of coating ligands with well-defined stoichiometry and chemical structure, often referred to as monolayer-protected clusters (MPC), are compounds that exhibit peculiar physicochemical properties and have emerged as a very important class of nanomaterials for both fundamental studies and potential applications.1–31Thanks to the versatility of properly devised bottom-up wet-chemistry synthesis and purification procedures, many MPC have been successfully characterized with atomic precision via mass spectrometry and single-crystal X-ray crystallography, thereby achieving a level of information that surpasses by far the more elusive bare ‘naked’ metal clusters originally investigated and characterized in, e.g., molecular beams and inert dielectric matrices. Knowledge of the crystal geometry and composition has been also instrumental to devise experimental and computational characterization procedures, and this provided the chance of cross-validating methods and results in a rigorous and robust framework. Cross-validation is especially important to develop and refine computational methods aimed to be quantitatively predictive in the study of the MPCs’ structure/property relationships, such as first-principles quantum mechanics (QM) methods. For example, although several different theoretical methods are available and have been employed to study MPCs with various degrees of accuracy and computational cost, it is very important to assess their performances and shortcomings in view of choosing the most suitable method for a specific investigation, while keeping the expected error and computational effort under control. Once validated, computational approaches can then be employed with confidence to obtain accurate and predictive information also when experimental information is not available, and ultimately, design new materials with desired properties.
The optical response, particularly the photoabsorption spectrum of MPCs, is one of the those properties for which accurate validation studies are desirable.32,33 Indeed, whereas a qualitative agreement between theory and experiment has been generally obtained,34–36 a quantitative match is much more challenging and has rarely been achieved.37–39 In this context, one of the first quantitatively accurate optical-response calculations for an MPC system was carried out for Au30(S–tBu)18.37 The conclusions of that study were that the necessary conditions for a quantitative match between theory and experiment are: (i) use an accurate MPC geometry, e.g., employing the experimental geometry (from X-ray diffraction) in the calculation to avoid inaccuracies due to QM structure prediction; (ii) employ a time dependent density functional theory (TDDFT) method that uses hybrid exchange–correlation (xc-) functionals (such as the B3LYP40,41 xc-functional in both the Kohn–Sham equation and the response kernel).
More recently,42 some of us have considered an even more stringent comparison regarding the hybrid B3LYP TDDFT scheme calculation and the low temperature (77 K) absorption spectrum of the Ag24Au(DMBT)18− anion. In that work an almost quantitative agreement was attained across the entire energy interval considered in the experimental spectral analysis. In particular, it was confirmed that the use of a hybrid xc-functional is mandatory to properly describe the low energy optical spectral region, where electronic transitions involving metal–ligand bonds play a major role. In contrast, GGA xc-functionals such as PBE43 or even asymptotically correct xc-functionals such as LB9444 gave a significantly worse agreement with experiment in the low energy region of the spectrum, although performing better at higher energies, which are dominated by ligand excitations. A previous complete study regarding the choice of the exchange–correlation functional38 (as well the basis set and the geometry) has allowed to assess which are the principal requirements of TDDFT for the calculation of photoabsorption of MPCs. In general it was concluded that asymptotically corrected functionals like LB94 and SAOP perform much better than standard GGA, but the low energy region remains difficult to predict and can be properly described only by hybrid functionals like B3LYP. The accurate prediction of the optical response of MPCs represents a real challenge to theory, due the co-existence and, thus, coupling of three moieties with quite different electronic properties: (1) a metal core in a low-oxidation state; (2) the metal shell of the “staple” motifs that interacts with both metal core and ligands, (3) the ligands (thiolates, etc.). Indeed, it has been shown that the B3LYP hybrid xc-functional and kernel enable one to obtain a balanced description of the electronic structure of regions with such a different chemical nature.37,38 It is worth stressing that a quantitative prediction of optical excitations in MPCs is particularly important for understanding properties and exploiting these compounds in view of applications, such as sensing and photocatalysis.45
The present work develops within this research framework. Our main goal consists in testing and extending the validation of the B3LYP scheme to a larger and more diverse set of clusters than previously investigated. The present study, where we vary the nature of the metal and the ligands, is particularly relevant to assess the predictivity of the previously proposed B3LYP scheme, as it is known37 that the optical properties of MPC are affected by both the metal and the ligand components. We selected three metal clusters that share the same M25 metallic core structure but have different metal composition and ligands: Ag25(DMBT)18−, Ag24Pt(DMBT)182− and Au24Pt(SC4H9)18 where DMBT is 2,4-dimethylbenzenethiolate and SC4H9 is n-butylthiolate. These nanoclusters can be prepared with atomic precision and offer a diverse set of MPC compounds on which to test and validate our theoretical approach.
2. Theoretical method
To predict optical spectra, we employ the complex polarizability TDDFT (polTDDFT) algorithm.46 This approach is able to treat very large systems by avoiding the bottleneck of the more traditional Casida diagonalization via a direct solution of the response equations, while still providing a very good accuracy when compared with the exact Casida solution.38,47 The reader is referred to the original work for a detailed description of the algorithm46 and its implementation in the AMS/ADF program.48In practice, the photoabsorption spectrum σ(ω) is calculated point by point, from the imaginary part of the dynamical polarizability α(ω):
 | (1) |
This expression is of practical interest when the polarizability is calculated for complex frequency, i.e. ω = ωr + iωi, where the real part ωr is the scanned photon frequency (energy) and ωi is the imaginary part which corresponds to a Lorentzian broadening of the discrete lines and can be interpreted as a pragmatic inclusion of the excited states finite lifetime. The complex dynamical polarizability is calculated by solving the following non-homogeneous linear system, working with a basis set of density-fitting functions:
| [S − M(ω)]b = d | (2) |
In eqn (2)S is the overlap matrix between fitting functions, b is the unknown vector with the expansion coefficients bμ(ω) of the time-dependent electron density ρ(1)z induced by the electromagnetic field, d is the frequency dependent vector corresponding to the known non-homogeneous term, and finally the elements of the frequency dependent matrix M are:
| Mμν = 〈fμ|χKS(ω)K|fν〉 | (3) |
In eqn (3)χKS is the Kohn–Sham frequency-dependent dielectric function, K is the kernel, and fμ and fν are the elements of the basis set of density-fitting functions. Note that the matrix element in eqn (3) is between density fitting functions, and therefore the present implementation of the algorithm allows one to employ only density-dependent kernels. For this reason, the density-matrix-dependent Hartree–Fock exchange kernel, which is an ingredient of hybrid xc-functionals, cannot directly be employed in polTDDFT. However, it is still possible to employ hybrid kernels with nonlocal Hartree–Fock exchange components if the hybrid diagonal approximation (HDA) is employed. The HDA method, which we have recently proposed,49 to which we refer for further details is a very efficient and robust approximation to TDDFT: by correcting only the diagonal matrix elements for the non-local exchange, while including local-density exchange–correlation terms of the kernel in the off-diagonal elements, the computational complexity is drastically reduced while keeping an excellent accuracy.49
3. Experimental and computational details
[n-Oct4N+][Ag25(DMBT)18−], [n-Oct4N+]2[Ag24Pt(DMBT)182−], and Au24Pt(SC4H9)18 were synthetized according to known procedures,50–52 with minor modifications (see ESI†).Photoabsorption measurements were carried out with a near-infrared VARIAN Cary 60 spectrophotometer with a spectral resolution of 0.5 nm. The spectra were collected over a range of 250–900 nm. [n-Oct4N+][Ag25(DMBT)18−] and [n-Oct4N+]2[Ag24Pt(DMBT)182−] were dissolved in a 5![[thin space (1/6-em)]](https://www.rsc.org/images/entities/char_2009.gif) :4:2 vol butyronitrile/propionitrile/dichloromethane solution, whereas Au24Pt(SC4H9)18 was dissolved in a 1:1 vol tetrahydrofuran/toluene solution; we verified that both solvent combinations form clear glasses at low temperatures. The solutions were adjusted to obtain an absorbance of 0.2 at 400 nm, using a 1 mm optical-path quartz cuvette. The temperature was controlled with an OptistatDN cryostat equipped with a MercuryiTC temperature controller (Oxford Instrument). A HiCube 80 Eco, DN 63 ISO-K turbo pumping station (PFEIFFER Vacuum) was used to generate a high vacuum inside the outer vacuum chamber of the cryostat. Before experiment, the sample holder was purged with high-purity helium, which was used as the temperature-exchange gas.
:4:2 vol butyronitrile/propionitrile/dichloromethane solution, whereas Au24Pt(SC4H9)18 was dissolved in a 1:1 vol tetrahydrofuran/toluene solution; we verified that both solvent combinations form clear glasses at low temperatures. The solutions were adjusted to obtain an absorbance of 0.2 at 400 nm, using a 1 mm optical-path quartz cuvette. The temperature was controlled with an OptistatDN cryostat equipped with a MercuryiTC temperature controller (Oxford Instrument). A HiCube 80 Eco, DN 63 ISO-K turbo pumping station (PFEIFFER Vacuum) was used to generate a high vacuum inside the outer vacuum chamber of the cryostat. Before experiment, the sample holder was purged with high-purity helium, which was used as the temperature-exchange gas.
The cluster geometries used to perform TDDFT simulations were taken from the corresponding experimental X-ray structures.51 The geometries were partially optimized in the ligand coordinates, while freezing the metal and sulfur atoms at their experimental geometry.
Geometry relaxations were performed using the CP2K package53 at the DFT/PBE level43 with the addition of the Grimme-D3 dispersion terms.54 DFT simulations, based on the hybrid Gaussian/plane-wave scheme (GPW),55 employed double-zeta-valence-plus polarization (DZVP) basis sets56 to represent the DFT Kohn–Sham orbitals, GTH pseudopotentials for describing the core-electrons of all the atomic species,57 and an auxiliary set of plane-waves whose cut-off was set to 300 Ry.
From these geometries, optical-response TDDFT calculations were performed with the version 2023.01 of the Amsterdam modeling suite (AMS)58 set of programs,59,60 employing a basis set of Slater type orbitals (STO) functions of Triple Zeta plus polarization (TZP) quality and optimized density fitting functions.61 Scalar relativistic effects were included via the Zero order regular approximation62 (ZORA). The hybrid B3LYP xc-functional was employed, which includes a portion of Hartree–Fock non-local exchange and provides consistently the most accurate predictions among DFT approaches. In this work, we employed the resolution of the identity (RI) technique to calculate the B3LYP HDA exchange integrals, as recently implemented in version 2023.01 of AMS.63 Such implementation, known as ‘fitted HDA’, allows a speedup up to a factor of 30 in the calculation of integrals with respect to the previous version that used numerical quadrature. The polTDDFT results were broadened by a Lorentzian function to obtain 0.150 eV of FWHM. An imaginary frequency ωi of 0.075 eV was employed in eqn (1).
4. Results and discussion
4.1. Cluster structures
Fig. 1 shows a schematic depiction of the structures of the three clusters, each one taken from two different points of view. The systems are characterized by the typical M25 structure which can be briefly described as follows:64 (1) one metal atom is in the center of the cluster; (2) 12 metal atoms form an icosahedron around the central atom; (c) a shell of ligands consisting of six ‘staple’ units -SR-M-SR-M-SR- protects the inner metal core. In the cluster series here considered: Ag25(DMBT)18−, Ag24Pt(DMBT)182− and Au24Pt(SC4H9)18, the first compound is a monometallic silver cluster, while the next terms correspond to monodoped silver and gold clusters respectively, where the central Au or Ag atom is replaced by a Pt atom. As to the ligand, whereas the first two clusters are protected by the typical aromatic DMBT ligand, SC4H9, is aliphatic and this may have effects on the optical properties. Indeed, it has been shown65 that aromatic thiolates can promote a plasmon ‘rebirth’ already at cluster sizes that would not yet be plasmonic. Although the first cluster is anionic, the second is dianionic, and the last one is neutral, they all display a closed-shell electronic structure.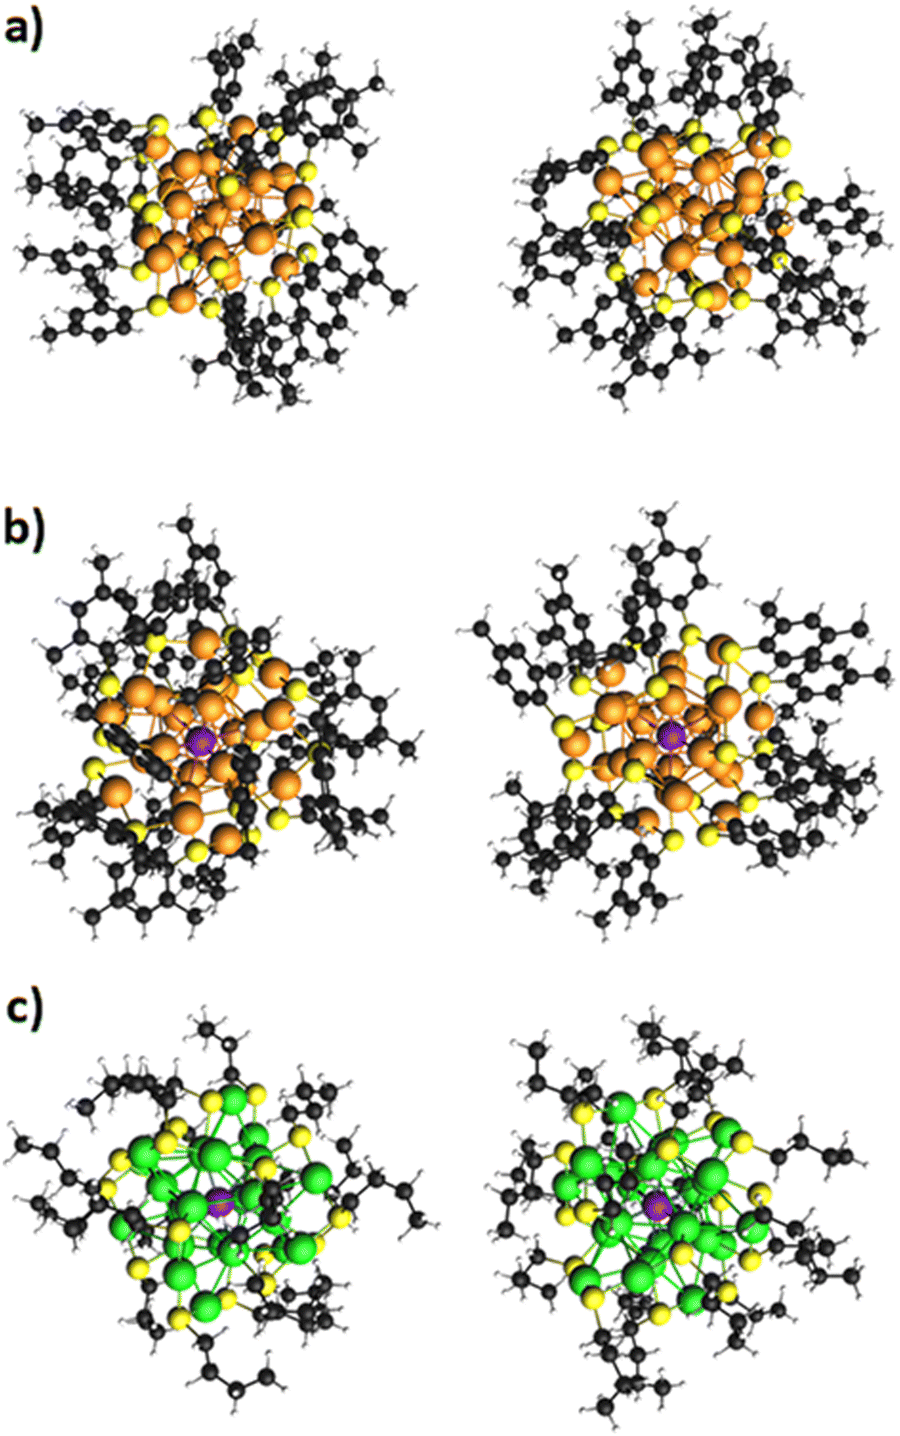 | ||
| Fig. 1 Geometries of the clusters (a) Ag25(DMBT)18−, (b) Ag24Pt(DMBT)182−, and (c) Au24Pt(SC4H9)18. | ||
4.2. Cluster selection and comparison with experiment
Fig. 2 shows the calculated photoabsorption of the three clusters calculated at the TDDFT level, as described in Sections 2 and 3, and the experimental spectra obtained at 77 K. The intensity scale is absolute for the calculated profiles, whereas the experimental profile intensity has been rescaled to achieve a best match with the calculated profile and compare the intensity of the calculated profile across different clusters. To have a more general perspective, we start by discussing the whole series, and defer the discussion of the single terms of the series to the following sections.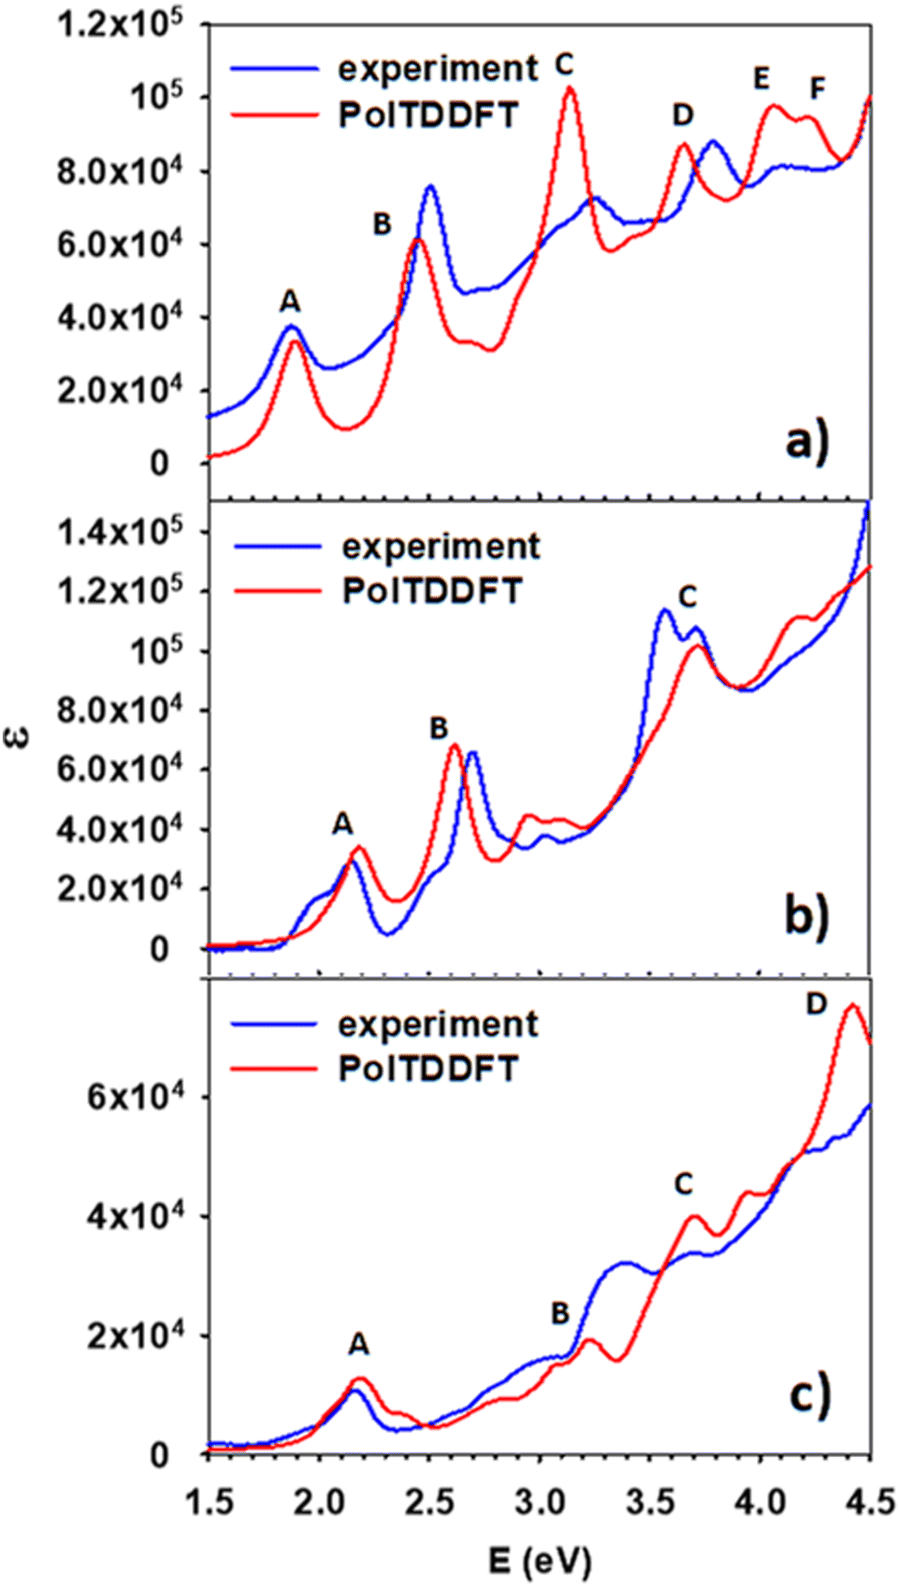 | ||
| Fig. 2 Comparison between experimental and calculated photoabsorption of the clusters (a) Ag25(DMBT)18−, (b) Ag24Pt(DMBT)182−, and (c) Au24Pt(SC4H9)18. | ||
First, we observe that for all three clusters a fairly nice agreement between theory and experiment holds. All the experimental features are properly reproduced by theory, with modest energy shifts of few tenth of eV and a rather accurate distribution of intensities, with only occasional deterioration. These finding provide a strict validation of our theory approach, demonstrating that the fitted HDA B3LYP polTDDFT scheme can attain quantitative accuracy even with metal doping and with different ligand nature and electronic effects.
Considering the trend of the spectra along the series, we notice that whereas Ag25(DMBT)18− and Ag24Pt(DMBT)182− display a photoabsorption spectrum very rich of spectral features, with many well resolved bands and maxima, the spectrum of Au24Pt(SC4H9)18, aside from the region at low energy, is much less structured, consisting mainly of weak shoulders superimposed to a background smoothly increasing with energy.
4.3. Ag25(DMBT)18−
In this section we focus on the specific analysis of the photoabsorption of Ag25(DMBT)18−. Fig. 3 shows a schematic picture of the main features (designated by the same capital letters from A to F as in Fig. 2a, as described in the inset), whereas Table 1 provides for each spectral feature the main contributions in terms of electronic configurations. From Fig. 2a it appears that the theory generally underestimates the experimental absorption energy: for the features A, E and F the difference is less than 0.1 eV, whereas a slightly larger disagreement is found for the other features, the largest deviation of 0.13 eV being found for feature D. The shape of the peaks is very well reproduced by theory, but for peak C where a quite sharper shape is predicted: this difference could be attributed to vibrational broadening or to a deficiency in the description of the electronic structure of the cluster. Regarding the assignment of the transitions, peaks A and B have a character very close to HOMO/LUMO excitations, ranging from HOMO−2 to LUMO+4. Interestingly, their energy difference is attributed mainly to the different energy of the virtual orbitals, which are grouped in two close groups separated by about 0.5 eV (see Fig. 3). All these orbitals have large silver contribution (see also the molecular orbital plots in Fig. S1 and S2 of the ESI†) that is especially large in LUMO and LUMO+1. We can describe the character of these orbitals as Ag–S σ-bonds for the HOMO, HOMO−1 and HOMO−2, whereas those from LUMO and LUMO+4 mainly pertain to Ag atoms only. With this picture in mind, we can attribute the A and B features to transitions from Ag–S σ-bonds to the metal core. B is more intense due to the largest metal contribution in the final virtual orbitals. C is the most intense band, whereas in the experiment it is more broadened as already noted. This feature is attributed to transitions starting from rather deep occupied orbitals (HOMO−20, HOMO−21) with major ligand character (Fig. S1, ESI†). The nature of the C band can also explain why it is so broadened in the experiment: the mainly ligand character of the occupied orbitals is conceivably more sensitive to their conformational freedom, which in solution is particularly relevant for the ligands but is much less important for the metal core.66,67 The next E and F features are less pronounced, with the orbitals involved in such transition localized mainly on the ligands.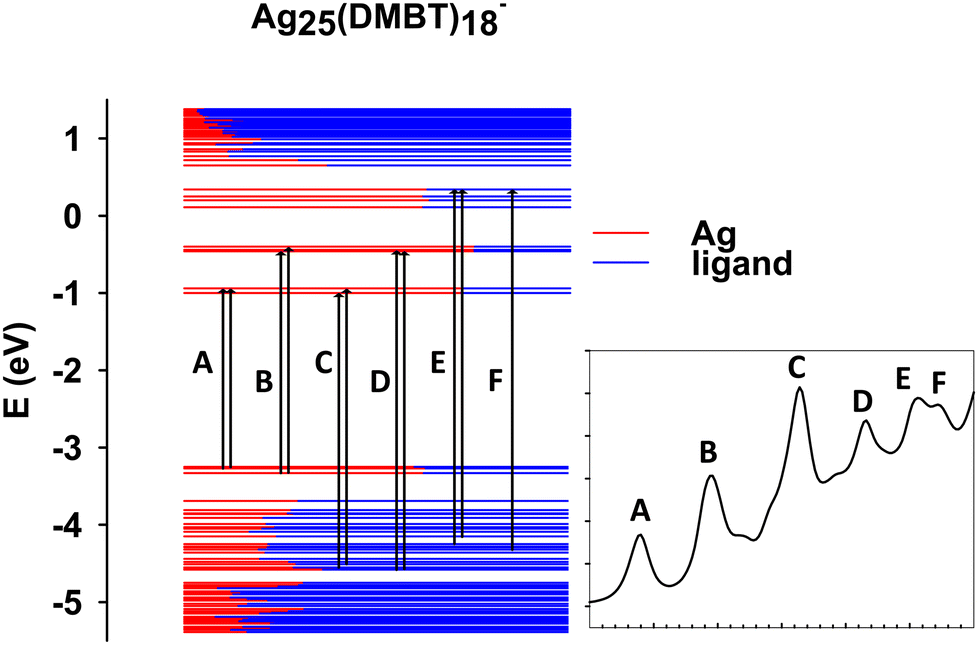 | ||
| Fig. 3 Scheme with the most important occupied-virtual configurations involved in the transitions in Ag25(DMBT)18−. The labels refer to specific features as reported in the inset. The color of the levels represents the nature of the molecular orbitals in terms of fragments (see legend). | ||
| Excitation | Excitation E (eV) | Experimental E (eV) |
|
Assignment |
|---|---|---|---|---|
| A | 1.90 | 1.88 | 33555 |
56.61% HOMO−1 (32% Ag 5s, 21% S 3p, 8% Ag 5p) → LUMO+1 (29% Ag 5s, 15% Ag 5p, 4% S 3p, 1% Ag 4d); 30.54% HOMO (28% Ag 5s, 20% S 3p, 7% Ag 5p) → LUMO+1 |
| B | 2.46 | 2.51 | 61256 |
21.50% HOMO−2 (31% Ag 5s, 18% S 3p, 7% Ag 5p, 5% Ag 4d) → LUMO+2 (25% Ag 5p, 23% Ag 5s, 6% S 3p, 1% Ag 4d); 15.26% HOMO → LUMO+4 (26% Ag 5p, 22% Ag 5s, 6% S 3p, 1% Ag 4d); 11.51% HOMO−2 → LUMO+4 |
| C | 3.16 | 3.22 | 102811 |
24.56% HOMO−22 (38% S 3p, 6% Ag 4d, 2% Ag 5s) → LUMO+1; 16.32% HOMO−20 (27% S 3p, 3% Ag 5s) → LUMO+1 |
| D | 3.66 | 3.79 | 87273 |
8.91% HOMO−23 (34% S 3p, 5% Ag 4d, 4% Ag 5s) → LUMO+3 (29% Ag 5p, 7% S 3p, 2% Ag 5s, 1% Ag 4d); 8.31% HOMO−22 → LUMO+2 |
| E | 4.06 | 4.07 | 97827 |
10.19% HOMO−13 (34% S 3p, 2% C 2p, 1% Ag 4d) → LUMO+8 (28% Ag 5p, 9% Ag 5s, 1% C 2p); 8.89% HOMO−12 (32% S 3p, 1% C 2p) → LUMO+8 |
| F | 4.22 | 4.15 | 94691 |
32.53% HOMO−16 (29% S 3p, 5% Ag 5s, 4% Ag 4d, 1% C 2p) → LUMO+8 |

4.4. Ag24Pt(DMBT)182−
Here we focus on the first doped cluster of the series, namely Ag24Pt(DMBT)182−. Fig. 4 shows the scheme of the molecular orbital energy levels together with the main spectral features (A, B and C), whereas the main contributions in terms of electronic configurations are reported in Table 2. Fig. 2b illustrates that the theory reproduces remarkably well the spectral window here considered, with the position of the three peaks in quantitative agreement with experiment, and the largest deviation for peak C limited to only 0.15 eV. Furthermore, the intensity distribution is quite accurately predicted by theory, and it is also worth noting that the profile shape between the peaks follows very closely the experimental trend. The energy levels from Fig. 4 give a situation qualitatively like the previous pure silver cluster: the A and B bands again start from the same group of occupied orbitals (HOMO, HOMO−1 and HOMO−2) but arrive to two different groups of virtual orbitals, separated by about 0.3 eV (LUMO and LUMO+1 for feature A and LUMO+2 and LUMO+3 and LUMO+4 for feature B). Interestingly, in comparison with Ag25(DMBT)18−, the nature of the transitions is the same but both transitions are blue shifted, which is a consequence of the larger HOMO/LUMO gap as well as the smaller separation between virtual states involved in features A and B. It is worth noting that the calculated shape of the peak C of the present cluster is in very good agreement with the experiment, at variance of previous Ag25 cluster where the experimental peak was strongly broadened. We attributed the strong broadening to a consequence of the ligand conformational freedom. Therefore it is interesting to argue if this different behavior could be ascribed to the Pt doping and/or to the charge of the cluster, since the rest of the system (such as the Ag geometry and the ligand nature) is the same. Indeed, the Pt–Ag bonds are much more ‘directional’ and stronger than Ag–Ag bonds, due to the role played by the Pt 5d orbitals, whereas in Ag the 4d orbitals are deeper in energy and play a very minor role in the chemical bond formed by Ag. Moreover, the larger charge of the Pt–Ag cluster should entail a larger ‘pressure’ by the solvent, which should also compress the ligands’ degrees of freedom. This enhanced ‘Pt–Ag bond directionality’ together with a larger environmental pressure should inhibit the conformational freedom of the ligands giving a sharper peak.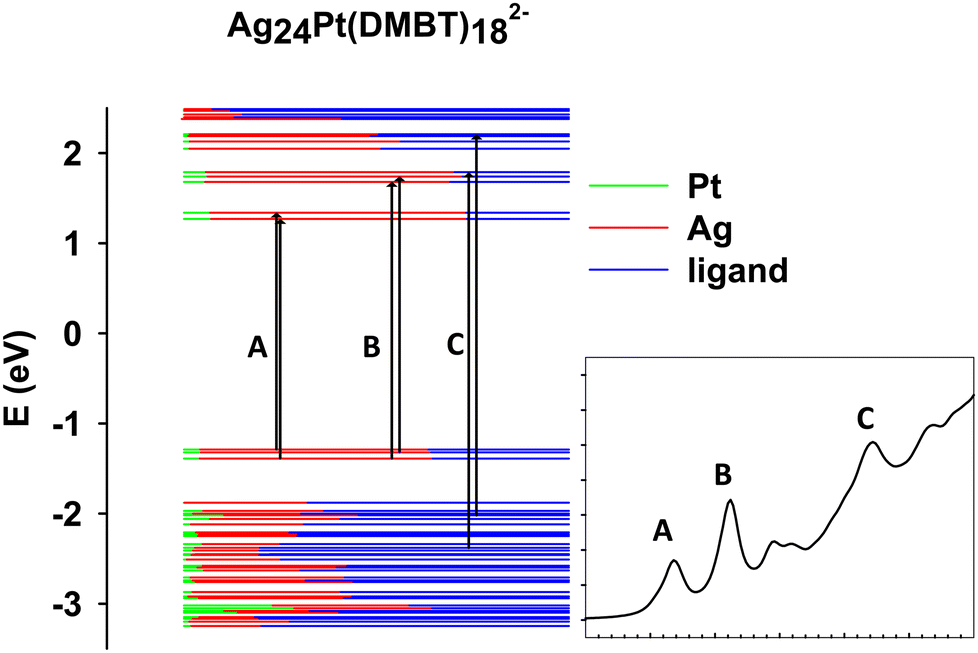 | ||
| Fig. 4 Scheme with the most important occupied-virtual configurations involved in the transitions in Ag24Pt(DMBT)182−. The labels refer to specific features as reported in the inset. The color of the levels represent the nature of the molecular orbitals in terms of fragments (see legend). | ||
| Excitation | Excitation E (eV) | Experimental E (eV) |
|
Assignment |
|---|---|---|---|---|
| A | 2.18 | 2.15 | 34131 |
37.37% HOMO (28% Ag 5s, 20% S 3p, 3% Ag 4d, 3% Pt 6p, 2% Ag 5p) → LUMO+1 (26% Ag 5s, 19% Ag 5p, 6% Pt 5d); 18.90% HOMO−2 (31% Ag 5s, 18% S 3p, 6% Ag 5p, 2% Pt 6s) → LUMO |
| B | 2.62 | 2.70 | 68651 |
24.62% HOMO−2 → LUMO+2 (21% Ag 5p, 19% Ag 5s, 4% Pt 5d, 1% S 3p); 22.00% HOMO−1 → LUMO+3 (23% Ag 5s, 25% Ag 5p, 3% Pt 5d, 3% S 3p) |
| C | 3.72 | 3.58 | 101702 |
10.65% HOMO−13 (29% S 3p, 16% C 2p, 1% Pt 5d) → LUMO+4 (22% Ag 5p, 19% Ag 5s, 4% Pt 5d, 2% S 3p); 9.10% HOMO−6 (27% S 3p, 9% Pt 5d, 7% Ag 4d, 3% Ag 5s, 1% C 2p) → LUMO+8 (16% Ag 5p, 8% Ag 5s, 1% C 2p) |

In summary, the computational model describes properly the optical behavior, ascribing the observed differences to the presence of the Pt atom. The Pt contribution remains below 10% in all the orbitals considered, except for some that are rather deep, around −3 eV, and do not contribute appreciably to the spectral features. Incidentally, the Pt atom participates mainly with the 5d electrons, which are rather diffuse, thereby providing kind of an ‘electron reservoir’. We can conclude that for this cluster the spectral difference with respect to the silver cluster can be rationalized in terms of the nature of the central atom.
4.5. Au24Pt(SC4H9)18
The last compound considered in this work consists of a neutral gold cluster protected by alkyl ligands and doped with Pt, Au24Pt(SC4H9)18. Fig. 5 shows the molecular-orbital energy levels, with the main features (A, B, C and D) analyzed in Table 3 in terms of leading electronic configurations. From the previous Fig. 2c, it appears that the theory reproduces quantitatively the peak A at low energy (2.2 eV). At higher energy the photoabsorption profile is not as highly structured as in the two silver-based clusters but is much smoother. Only weak shoulders are predicted to show up in the energy range 3.2–3.7 eV, which is in satisfactory agreement with experiment. For this cluster, the theoretical spectrum is blue shifted with respect to the experiment by few tenths of eV. The predicted feature D is unfortunately outside the experimental energy interval, and thus, we do not have an experimental counterpart for comparison. Also for this cluster it is worth noting that, despite a minor disagreement in the energy positions of features B and C, the calculated intensity profile resembles closely the experimental shape, which features a typical ‘step’ behavior. In the present work we did not consider the corresponding pure gold clusters, as they have already been the object of previous extensive experimental and theoretical studies,48,64,68 and thus we can profitably compare the present results on the Au/Pt nanoalloy with the photoabsorption spectrum of Au25(SR)18− measured at room temperature68 and the absorption spectrum we previously calculated at the TDDFT B3LYP HDA level.49 Note that in ref. 49 the experimental R = CH2CH2C6H5 ligand was simplified as R = CH3 in the calculations, but keeping the experimental geometry, in such a way that the alkyl ligand nature was preserved (important to describe properly the optical spectrum). This comparison indicates that Pt doping shifts the A feature to higher energy from 1.8 eV in Au25(SR)18− to 2.2 eV in Au24Pt(SC4H9)18 in both experiment and calculations. In the experimental Au25(SR)18− spectrum other less pronounced features appear at 2.75, 3.1 and 3.9 eV, all of them shifted at higher energy in Au24Pt(SC4H9)18 by about 0.5–0.6 eV on average. We conclude that Pt doping definitely promotes a blue shift of the spectral features by about 0.4–0.6 eV depending on the specific structure, in both Ag as well as Au clusters.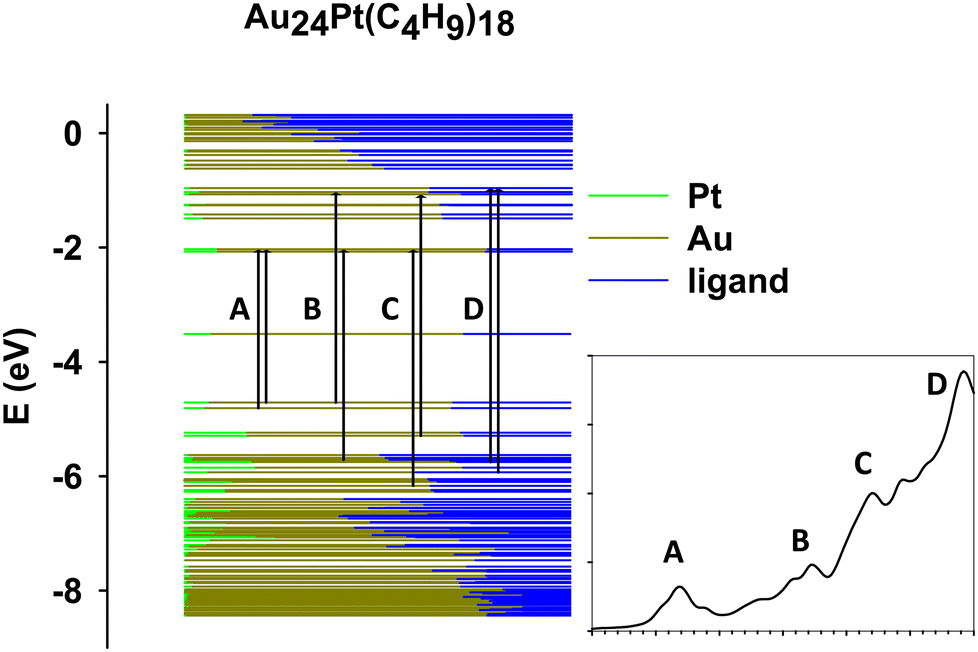 | ||
| Fig. 5 Scheme with the most important occupied-virtual configurations involved in the transitions in Au24Pt(SC4H9)18. The labels refer to specific features as reported in the inset. The color of the levels represent the nature of the molecular orbitals in terms of fragments (see legend). | ||
| Excitation | Excitation E (eV) | Experimental E (eV) |
|
Assignment |
|---|---|---|---|---|
| A | 2.20 | 2.16 | 12804 |
34.51% HOMO−1 (17% Au 6s, 17% S 3p, 8% Au 5d, 5% Pt 6p) → LUMO+2 (29% Au 6s, 15% Au 6p, 9% Pt 5d, 2% S 3p); 25.04% HOMO (23% S 3p, 15% Au 6s, 11% Au 5d, 7% Pt 6p, 4% Au 6p) → LUMO+2 |
| B | 3.24 | 3.06 | 19247 |
17.44% HOMO → LUMO+8 (25% Au 6p, 9% Au 6s, 6% S 3p, 1% C 2p, 1% H 2s); 15.88% HOMO−6 (30% S 3p, 11% Au 5d, 1% Pt 5d) → LUMO+2 |
| C | 3.70 | 3.40 | 40118 |
16.24% HOMO−14 (20% S 3p, 18% Au 5d, 12% Au 6s) → LUMO+2; 14.65% HOMO−3 (16% Pt 5d, 14% Au 5d, 10% S 3p, 8% Au 6s) → LUMO+7 (30% Au 6p, 13% Au 6s, 3% S 3p) |
| D | 4.42 | — | 75502 |
8.05% HOMO−8 (17% Pt 5d, 16% Au 5d, 14% S 3p, 1% Au 6s) → LUMO+9 (28% Au 6p, 2% Au 6s, 2% S 3p); 6.91% HOMO−10 (26% S 3p, 17% Au 5d, 7% Au 6s, 4% Pt 5d, 1% Pt 7s) → LUMO+9 |

5. Conclusions
The photoabsorption spectra of three MPC compounds with different alloy nature and ligands: Ag25(DMBT)18−, Ag24Pt(DMBT)182− and Au24Pt(SC4H9)18, where DMBT is 2,4-dimethylbenzenethiolate and SC4H9 is n-butylthiolate, have been measured at low temperature (77 K) in order to better resolve single optical peaks and compare them with state-of-the-art theoretical simulations at the TDDFT level of theory using hybrid xc-functional and experimentally-derived geometries. For all three cases, we find an excellent match between theory and experiment, with typical deviations being less than 0.1 eV, occasionally reaching 0.2 eV. This result provides a stringent validation of the proposed computational protocol. In addition to validated accuracy, the calculations are analyzed to assign the relevant spectra features, ascribing them to specific transitions between occupied-virtual orbital pairs. It is found that doping by Pt has an important effect on the spectra, shifting the spectral features to higher energy by about 0.4 eV, for both silver and gold clusters. Future developments of the present work would be towards metal clusters containing atoms of different nature with respect to the present ones, as well as ligands different from thiols. This would help to trace more general conclusions regarding the transferability of the method. Moreover future inclusion of range-separated xc-functionals, necessary to describe charge transfer excitations, is under consideration.Conflicts of interest
There are no conflicts of interest to declare.Acknowledgements
Computational support from CINECA supercomputing center within the ISCRA program is gratefully acknowledged. The authors are grateful to the Stiftung Beneficentia for a generous grant employed to set up a computational server. Support from Trieste University within the FRA programme is gratefully acknowledged. Financial support from ICSC – Centro Nazionale di Ricerca in High Performance Computing, Big Data and Quantum Computing, funded by European Union – NextGenerationEU is gratefully acknowledged. Financial support from MIUR of Italy under the PRIN 2022 project COCAP funded by European Union – NextGenerationEU is gratefully acknowledged. Networking within the COST Action CA21101 “Confined molecular systems: from a new generation of materials to the stars” (COSY) supported by COST (European Cooperation in Science and Technology) is gratefully acknowledged. Experimental work was financially supported by the Italian Ministero dell’Università e della Ricerca (PRIN2022 “ProNano4Bio” grant 2022RSXC9X) and the University of Padova (Supporting Talent in Research – STARS “TimeForResponse” grant 166081). Tiziano Dainese is thanked for his help in the syntheses of the two silver clusters.References
- R. L. Whetten, J. T. Khoury, M. M. Alvarez, S. Murthy, I. Vezmar, Z. L. Wang, P. W. Stephens, C. L. Cleveland, W. D. Luedtke and U. Landman, Adv. Mater., 1996, 8, 428 CrossRef CAS.
- P. D. Jadzinsky, G. Calero, C. J. Ackerson, D. A. Bushnell and R. D. Kornberg, Science, 2007, 318, 430 CrossRef CAS PubMed.
- J. Akola, M. Walter, R. L. Whetten, H. Häkkinen and H. Grönbeck, J. Am. Chem. Soc., 2008, 130, 3756 CrossRef CAS PubMed.
- M. W. Heaven, A. Dass, P. S. White, K. M. Holt and R. W. Murray, J. Am. Chem. Soc., 2008, 130, 3754 CrossRef CAS PubMed.
- H. Qian, W. T. Eckenhoff, Y. Zhu, T. Pintauer and R. Jin, J. Am. Chem. Soc., 2010, 132, 8280 CrossRef CAS PubMed.
- O. Lopez-Acevedo, H. Tsunoyama, T. Tsukuda, H. Häkkinen and C. M. Aikens, J. Am. Chem. Soc., 2010, 132, 8210 CrossRef CAS PubMed.
- C. Zeng, H. Qian, T. Li, G. Li, N. L. Rosi, B. Yoon, R. N. Barnett, R. L. Whetten, U. Landman and R. Jin, Angew. Chem., 2012, 51, 13114 CrossRef CAS PubMed.
- I. Dolamic, S. Knoppe, A. Dass and T. Bürgi, Nat. Commun., 2012, 3, 798 CrossRef PubMed.
- Y. Negishi, C. Sakamoto, T. Ohyama and T. Tsukuda, J. Phys. Chem. Lett., 2012, 3, 1624 CrossRef CAS PubMed.
- A. Desireddy, B. E. Conn, J. Guo, B. Yoon, R. N. Barnett, B. M. Monahan, K. Kirschbaum, W. P. Griffith, R. L. Whetten, U. Landman and T. P. Bigioni, Nature, 2013, 501, 399 CrossRef CAS PubMed.
- S. Mustalahti, P. Myllyperkiö, T. Lahtinen, K. Salorinne, S. Malola, J. Koivisto, H. Häkkinen and M. Pettersson, J. Phys. Chem. C, 2014, 118, 18233 CrossRef CAS.
- A. Dass, S. Theivendran, P. R. Nimmala, C. Kumara, V. R. Jupally, A. Fortunelli, L. Sementa, G. Barcaro, X. Zuo and B. C. Noll, J. Am. Chem. Soc., 2015, 137, 4610 CrossRef CAS PubMed.
- A. Fernando, K. L. D. M. Weerawardene, N. V. Karimova and C. M. Aikens, Chem. Rev., 2015, 115, 6112 CrossRef CAS PubMed.
- W. Kurashige, Y. Niihori, S. Sharma and Y. Negishi, Coord. Chem. Rev., 2016, 320–321, 238 CrossRef CAS.
- R. Jin, C. Zeng, M. Zhou and Y. Chen, Chem. Rev., 2016, 116, 10346 CrossRef CAS PubMed.
- N. A. Sakthivel, S. Theivendran, V. Ganeshraj, A. G. Oliver and A. Dass, J. Am. Chem. Soc., 2017, 139, 15450 CrossRef CAS PubMed.
- M. Rambukwella, N. A. Sakthivel, J. H. Delcamp, L. Sementa, A. Fortunelli and A. Dass, Front. Chem., 2018, 6, 330 CrossRef PubMed.
- T. Dainese, S. Antonello, S. Bogialli, W. Fei, A. Venzo and F. Maran, ACS Nano, 2018, 12, 7057 CrossRef CAS PubMed.
- Z. Lei, J. J. Li, X. K. Wan, W. H. Zhang and Q. M. Wang, Angew. Chem., 2018, 57, 8639 CrossRef CAS PubMed.
- M. A. Abbas, P. V. Kamat and J. H. Bang, ACS Energy Lett., 2018, 3, 840 CrossRef CAS.
- N. A. Sakthivel, M. Shabaninezhad, L. Sementa, B. Yoon, M. Stener, R. L. Whetten, G. Ramakrishna, A. Fortunelli, U. Landman and A. Dass, J. Am. Chem. Soc., 2020, 142, 15799 CrossRef CAS PubMed.
- C. A. Hosier, I. D. Anderson and C. J. Ackerson, Nanoscale, 2020, 12, 6239 RSC.
- T. Kawawaki, A. Ebina, Y. Hosokawa, S. Ozaki, D. Suzuki, S. Hossain and Y. Negishi, Small, 2021, 2005328 CrossRef CAS PubMed.
- J. V. Rival, P. Mymoona, K. M. Lakshmi Nonappa, T. Pradeep and E. S. Shibu, Small, 2021, 2005718 CrossRef CAS PubMed.
- T. Dainese, M. Agrachev, S. Antonello, D. Badocco, D. M. Black, A. Fortunelli, J. A. Gascón, M. Stener, A. Venzo, R. L. Whetten and F. Maran, Chem. Sci., 2018, 9, 8796 RSC.
- M. Agrachev, M. Ruzzi, A. Venzo and F. Maran, Acc. Chem. Res., 2019, 52, 44 CrossRef CAS PubMed.
- M. Agrachev, W. Fei, S. Antonello, S. Bonacchi, T. Dainese, A. Zoleo, M. Ruzzi and F. Maran, Chem. Sci., 2020, 11, 3427 RSC.
- E. Boisselier and D. Astruc, Chem. Soc. Rev., 2009, 38, 1759 RSC.
- U. H. F. Bunz and V. M. Rotello, Angew. Chem., 2010, 49, 3268 CrossRef CAS PubMed.
- Y. Du, H. Sheng, D. Astruc and M. Zhu, Chem. Rev., 2020, 120, 526 CrossRef CAS PubMed.
- R. Jin, G. Li, S. Sharma, Y. Li and X. Du, Chem. Rev., 2021, 121, 567 CrossRef CAS PubMed.
- A. Tlahuice-Flores, Phys. Chem. Chem. Phys., 2016, 18, 27738 RSC.
- C. M. Aikens, Acc. Chem. Res., 2018, 51, 3065 CrossRef CAS PubMed.
- K. L. D. M. Weerawardene and C. M. Aikens, Phys. Chem. C, 2018, 122, 2440 CrossRef CAS.
- K. L. D. M. Weerawardene and C. M. Aikens, J. Am. Chem. Soc., 2016, 138, 11202 CrossRef CAS PubMed.
- G. Barcaro, L. Sementa, A. Fortunelli and M. Stener, Phys. Chem. Chem. Phys., 2015, 17, 27952 RSC.
- A. Dass, T. Jones, M. Rambukwella, D. Crasto, K. Gagnon, L. Sementa, M. De Vetta, O. Baseggio, E. Aprà, M. Stener and A. Fortunelli, J. Phys. Chem. C, 2016, 120, 6256 CrossRef CAS.
- O. Baseggio, M. De Vetta, G. Fronzoni, D. Toffoli, M. Stener, L. Sementa and A. Fortunelli, Int. J. Quantum Chem., 2018, 118, e25769 CrossRef.
- H.-Ch Weissker, H. Barron Escobar, V. D. Thanthirige, K. Kwak, D. Lee, G. Ramakrishna, R. L. Whetten and X. López-Lozano, Nat. Commun., 2014, 5, 3785 CrossRef PubMed.
- A. D. Becke, J. Chem. Phys., 1993, 98, 5684 Search PubMed.
- P. J. Stephens, F. J. Devlin, C. F. Chabalowski and M. J. Frisch, J. Phys. Chem., 1994, 98, 11623 CrossRef CAS.
- M. Medves, L. Sementa, D. Toffoli, G. Fronzoni, K. R. Krishnadas, T. Bürgi, S. Bonacchi, T. Dainese, F. Maran, A. Fortunelli and M. Stener, J. Chem. Phys., 2021, 155, 084103 CrossRef CAS PubMed.
- J. P. Perdew, K. Burke and M. Ernzerhof, Phys. Rev. Lett., 1996, 77, 3865 CrossRef CAS PubMed.
- R. Van Leeuwen and E. J. Baerends, Phys. Rev. A, 1994, 49, 2421 CrossRef CAS PubMed.
- S. Linic, P. Christopher and D. B. Ingram, Nat. Mater., 2011, 10, 911 CrossRef CAS PubMed.
- O. Baseggio, G. Fronzoni and M. Stener, J. Chem. Phys., 2015, 143, 024106 CrossRef PubMed.
- O. Baseggio, M. De Vetta, G. Fronzoni, M. Stener, L. Sementa, A. Fortunelli and A. Calzolari, J. Phys. Chem. C, 2016, 120, 12773 CrossRef CAS.
- O. Baseggio, M. De Vetta, G. Fronzoni, M. Stener and A. Fortunelli, Int. J. Quantum Chem., 2016, 116, 1603 CrossRef CAS.
- M. Medves, L. Sementa, D. Toffoli, G. Fronzoni, A. Fortunelli and M. Stener, J. Chem. Phys., 2020, 152, 184102 CrossRef PubMed.
- M. S. Bootharaju, C. P. Joshi, M. R. Parida, O. F. Mohammed and O. M. Bakr, Angew. Chem., Int. Ed., 2016, 55, 922 CrossRef CAS PubMed.
- X. Liu, J. Yuan, C. Yao, J. Chen, L. Li, X. Bao, J. Yang and Z. Wu, J. Phys. Chem. C, 2017, 121, 13848 CrossRef CAS.
- W. Fei, S. Antonello, T. Dainese, A. Dolmella, M. Lahtinen, K. Rissanen, A. Venzo and F. Maran, J. Am. Chem. Soc., 2019, 141, 16033 CrossRef CAS PubMed.
- J. Hutter, M. Iannuzzi, F. Schiffmann and J. VandeVondele, Wiley Interdiscip. Rev.: Comput. Mol. Sci., 2014, 4, 15 CAS.
- S. Grimme, J. Antony, S. Ehrlich and H. Krieg, J. Chem. Phys., 2010, 132, 154104 CrossRef PubMed.
- G. Lippert, J. Hutter and M. Parrinello, Theor. Chem. Acc., 1999, 103, 124 Search PubMed.
- J. VandeVondele and J. Hutter, J. Chem. Phys., 2007, 127, 114105 CrossRef PubMed.
- S. Goedecker, M. Teter and J. Hutter, Phys. Rev. B, 1996, 54, 1703 CrossRef CAS PubMed.
- https://www.scm.com/product/ams .
- E. J. Baerends, D. E. Ellis and P. Ros, Chem. Phys., 1973, 2, 41 CrossRef CAS.
- C. Fonseca Guerra, J. G. Snijders, G. Te Velde and E. J. Baerends, Theor. Chem. Accounts, 1998, 99, 391 Search PubMed.
- M. Medves, G. Fronzoni and M. Stener, J. Comput. Chem., 2022, 43, 1923 CrossRef CAS PubMed.
- E. Van Lenthe, E. J. Baerends and E. J. J. G. Snijders, J. Chem. Phys., 1993, 99, 4597 CrossRef CAS.
- P. D'Antoni, M. Medves, D. Toffoli, A. Fortunelli, M. Stener and L. Visscher, J. Phys. Chem. A, 2023, 127, 9244 CrossRef PubMed.
- M. W. Heaven, A. Dass, P. S. White, K. M. Holt and R. W. Murray, J. Am. Chem. Soc., 2008, 130, 3754 CrossRef CAS PubMed.
- L. Sementa, G. Barcaro, O. Baseggio, M. De Vetta, A. Dass, E. Aprà, M. Stener and A. Fortunelli, J. Phys. Chem. C, 2017, 121, 10832 CrossRef CAS.
- M. Monti, G. Brancolini, E. Coccia, D. Toffoli, A. Fortunelli, S. Corni, M. Aschi and M. Stener, J. Phys. Chem. Lett., 2023, 14, 1941 CrossRef CAS PubMed.
- M. Monti, M. F. Matus, S. Malola, A. Fortunelli, M. Aschi, M. Stener and H. Häkkinen, ACS Nano, 2023, 17, 11481 CrossRef CAS PubMed.
- M. Zhu, C. M. Aikens, F. J. Hollander, G. Schatz and R. Jin, J. Am. Chem. Soc., 2008, 130, 5883 CrossRef CAS PubMed.
Footnote |
| † Electronic supplementary information (ESI) available: Syntheses’ details and further spectra, molecular orbitals of the clusters with large contributions to the relevant spectral features, atomic coordinates employed in the calculations. See DOI: https://doi.org/10.1039/d4cp00789a |
| This journal is © the Owner Societies 2024 |