Layer-by-layer self-assembly of Nafion–[CS–PWA] composite membranes with suppressed vanadium ion crossover for vanadium redox flow battery applications
Shanfu Luab,
Chunxiao Wuab,
Dawei Liangab,
Qinglong Tanab and
Yan Xiang*ab
aBeijing Key Laboratory of Bio-inspired Energy Materials and Devices, School of Chemistry and Environment, Beihang University, Beijing, 100191, P. R. China. E-mail: xiangy@buaa.edu.cn
bKey Laboratory of Bio-Inspired Smart Interfacial Science and Technology of Ministry of Education, School of Chemistry and Environment, Beihang University, Beijing, 100191, P. R. China
First published on 15th April 2014
Abstract
A novel polymer–inorganic composite membrane, Nafion–[CS–PWA]n (n = the number of bilayers), was prepared by a layer-by-layer self-assembly technique with polycation chitosan (CS) and negatively charged phosphotungstic acid (PWA) for vanadium redox flow battery applications. The UV-visible spectra and SEM results showed that the CS–PWA multilayer was successfully fabricated on the surface of the Nafion membrane, and the FTIR result showed that there was a strong interaction between the CS and PWA molecules. The obtained Nafion–[CS–PWA]n showed much lower vanadium ion permeability compared with the pristine Nafion membrane. Accordingly, the VRFB with the Nafion–[CS–PWA]3 membrane exhibited higher coulombic efficiency (CE) and energy efficiency (EE) together with a slower self-discharge rate than that of the pristine Nafion212 system.
1. Introduction
Flow battery (FB) systems have been extensively studied as clean and efficient power sources for applications in energy storage systems,1 and have become a valid solution to energy shortages.2,3 Among several systems such as polysulfide/bromide, iron/chromium, etc., the vanadium redox flow battery (VRFB) system has the advantages of an abundance of vanadium sources and low cost, as well as high energy efficiency, long lifetime, fast response time and deep-discharge capacity,4 and it has recently attracted considerable research interest.5–9The ion exchange membrane (IEM) is one of the key materials in a VRFB system. It functions as a separator of the cathode and anode compartments to prevent their crossover and allows the transport of protons to maintain the electrical balance during the charge–discharge process. Therefore, an ideal IEM that exhibits high proton conductivity and good stability, as well as outstanding ion selectivity is critically important for commercializing VRFBs.8–11 The state-of-the-art IEMs in VRFBs are perfluorosulfonic acid cation exchange membranes, such as the Nafion membrane (DuPont, America), exhibiting high conductivity, and high chemical and mechanical stabilities. However, the high vanadium ion permeability of Nafion affects its further application and development in VRFBs.12 The crossover of vanadium ions through proton-exchange membranes is the chief reason for high self-discharge rates, which then leads to low coulombic efficiency (CE) and energy efficiency (EE). To solve this problem, many researchers have paid attention to the modification of a Nafion membrane, such as blending with PVDF to prepare a NafionPVDF composite membrane,13 recasting with inorganic nanoparticles to form Nafion–SiO2 membranes,14,15 oxidation polymerization or electrodepositing a polymer on the surface of Nafion.16 All of the above modification methods can be used to decrease the crossover of vanadium ions in Nafion membranes, and in general improve the cell performance of VRFBs.14 However, the incorporation of inorganic nanoparticles or polymers inevitably alters the microstructure of Nafion, resulting in deterioration of its mechanical properties.
The layer-by-layer (LbL) self-assembly technique is an efficient method for fabricating multilayer thin films with controlled architecture and composition on the nanometer scale.17 This technique did not become well-known until it was rediscovered by Decher and Hong18 in 1992, but in recent years it has been widely used in new energy materials to prepare polymer/polymer layers on the membrane surface, and it has been found that it has a significant influence on ion selectivity and that the cells with these membranes display high efficiency.14,19,20 Previously, our group has used the inorganic compound PWA, a well known super proton conductor, to prepare a composite membrane by a self-assembly technique in DMFC, which suppresses methanol crossover and maintains high proton conductivity of the membrane. Consequently, a cell with this self-assembled membrane achieves a good cell performance.21,22
Heteropoly acids (HPAs) are well known superionic conductors in their fully hydrated states.23 Among the Keggin-type HPAs, phosphotungstic acid (H3PW12O40, PWA) has the strongest acidity and proton conductivity. Here, we used a LbL self-assembly technique to trap and anchor PWA molecules on the Nafion membrane surface for vanadium redox flow battery applications. The self-assembled CS–PWA bilayers not only suppress vanadium ion crossover but also minimise the impact on the proton conductivity of the Nafion membranes. VRFBs with the self-assembled Nafion–[CS–PWA]n membrane show higher coulombic efficiency (CE) and energy efficiency (EE) together with a slower self-discharge rate than that with the pristine Nafion212 system.
2. Experimental
2.1 Materials
Chitosan (Mw = 60![[thin space (1/6-em)]](https://www.rsc.org/images/entities/char_2009.gif) 000, CS, Hai Debei) and H3PW12O40 (PWA, Aldrich-Sigma) were used without further treatment. Nafion212 membranes were purchased from DuPont. Prior to modification, Nafion membranes were treated according to the standard procedure, which was 30 min in 3 wt% H2O2 solution at 80 °C, followed by rinsing with Milli-Q water 5 times, then 30 min in 0.5 M H2SO4 solution at 80 °C, before finally storing in Milli-Q water.
000, CS, Hai Debei) and H3PW12O40 (PWA, Aldrich-Sigma) were used without further treatment. Nafion212 membranes were purchased from DuPont. Prior to modification, Nafion membranes were treated according to the standard procedure, which was 30 min in 3 wt% H2O2 solution at 80 °C, followed by rinsing with Milli-Q water 5 times, then 30 min in 0.5 M H2SO4 solution at 80 °C, before finally storing in Milli-Q water.
2.2 Preparation of the Nafion–[CS–PWA]n membrane
The layer-by-layer (LbL) self-assembly of the multilayer CS–PWA was carried out by alternately immersing the pretreated Nafion membrane in a CS–acetic acid solution (2 wt%) and a PWA–ethanol solution (20 mM) at room temperature for 15 min. After each immersion step, the membrane was rinsed with Milli-Q water to remove the free CS and PWA on the surface. The process of alternately immersing in CS and PWA solutions was then repeated to increase the number of bilayers. The resulting poly-electrolyte multilayer modified composite membrane was denoted as Nafion–[CS–PWA]n, which were stored in Milli-Q water before use. The schematic of LbL self-assembly of the Nafion–[CS–PWA]n membrane is shown in Fig. 1.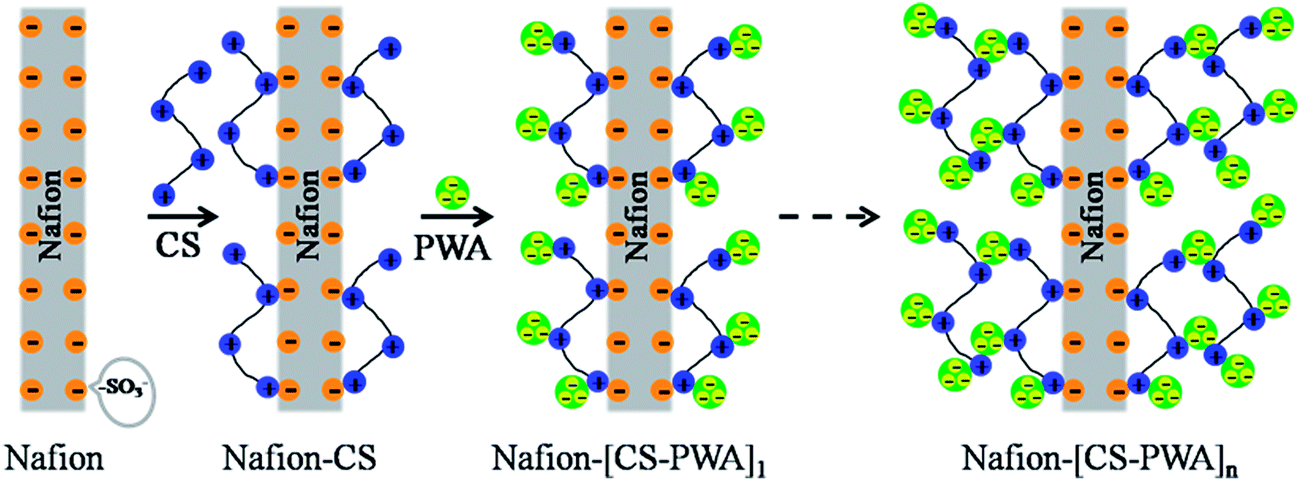 | ||
| Fig. 1 Schematic diagram of the layer-by-layer self-assembly of the Nafion–[CS–PWA]n membrane. | ||
2.3 Membrane characterization
The formation of the LbL self-assembled multilayer on the membrane, effectively prepared from polyelectrolytes, was monitored using a GBC Cintra 10e series UV-vis spectrophotometer. During the test, Milli-Q water was used as a blank for calibration of the instrument followed by measurement of the absorption spectrum of the membranes at room temperature. Fourier Transform Infrared Spectroscopy (FT-IR) was used to monitor the interaction between the functional groups on chitosan and PWA.A cross-section of the multilayer membranes was sputtered with gold and scanning electron microscopy (SEM) images taken using a JEOL JSM-5800 scanning electronic microscope at an acceleration voltage of 5 kV, alongside an energy dispersive X-ray (EDX) spectrometer. The samples were prepared by freezing the membranes in liquid nitrogen followed by breaking the frozen membrane with forceps. In addition, surface roughness and morphology of the composite membranes were measured by atomic force microscopy (AFM) using a Dimension Icon instrument (Bruker, USA).
Proton conductivity (σ) was measured using a four-point probe electrochemical impedance spectroscopy technique over a frequency range of 1 Hz to 100 kHz using a Princeton Applied Research PARSTAT 2273 potentiostat/galvanostat. The membrane was fixed between two half-cells with 1 M VOSO4/3 M H2SO4 solution. The resistances with and without the membrane were measured, recorded as R1 and R2, respectively. In this work, each result has been measured five times, and then the average used in the eventual calculation. The transverse resistance R (Ω) and the conductivity σ (S cm−1) can be calculated using the following equations:24
| R = R2 − R1 | (1) |
 | (2) |
The permeability of vanadium ions was determined by measuring the diffusion of VO2+. The membrane was exposed to a solution of 1 M VOSO4/3 M H2SO4 in the left reservoir and a solution of 1 M MgSO4/3 M H2SO4 in the right reservoir. The MgSO4 solution was used to equalize the ionic strengths of the two sides so as to minimize the effects of osmotic pressure.25 Samples of the solution from the right reservoir were taken out at regular time intervals and were used to measure the concentration of VO2+ by UV-vis spectroscopy. Accordingly, the vanadium ion concentration as a function of time is given by the equation:26
 | (3) |
The VRFB single cell performance was characterized by using 1 M VOSO4/3 M H2SO4 solution as the anolyte and 1 M V3+/3 M H2SO4 as the catholyte. The membrane thickness for all tests was 56–60 μm and the electrode area was 4 cm2. The coulombic efficiency (CE), voltage efficiency (VE) and energy transfer efficiency (EE) were calculated as follows:26
 | (4) |
 | (5) |
 | (6) |
3. Results and discussion
3.1 Membrane characterization
Fig. 2a shows the UV-vis spectra of the LbL self-assembled Nafion212 membranes as a function of the number of CS–PWA bilayers. The UV-vis spectra of the membranes exhibit a characteristic absorption peak at 265 nm that increases in intensity with an increasing number of the self-assembled CS–PWA bilayers. PWA has a characteristic absorption peak at 265 nm, while CS is basically transparent in the UV-vis spectral range. Thus, the increase in the absorbance at 265 nm is attributed to the adsorption of the PWA molecules in the previously deposited CS–PWA multilayer. The inset graph of Fig. 2a depicts the absorbance at 265 nm as a function of the number of CS–PWA bilayers, which increases linearly with the number of assembled CS–PWA bilayers. This linear relationship indicates that the same amount of polymer was deposited in every dipping cycle.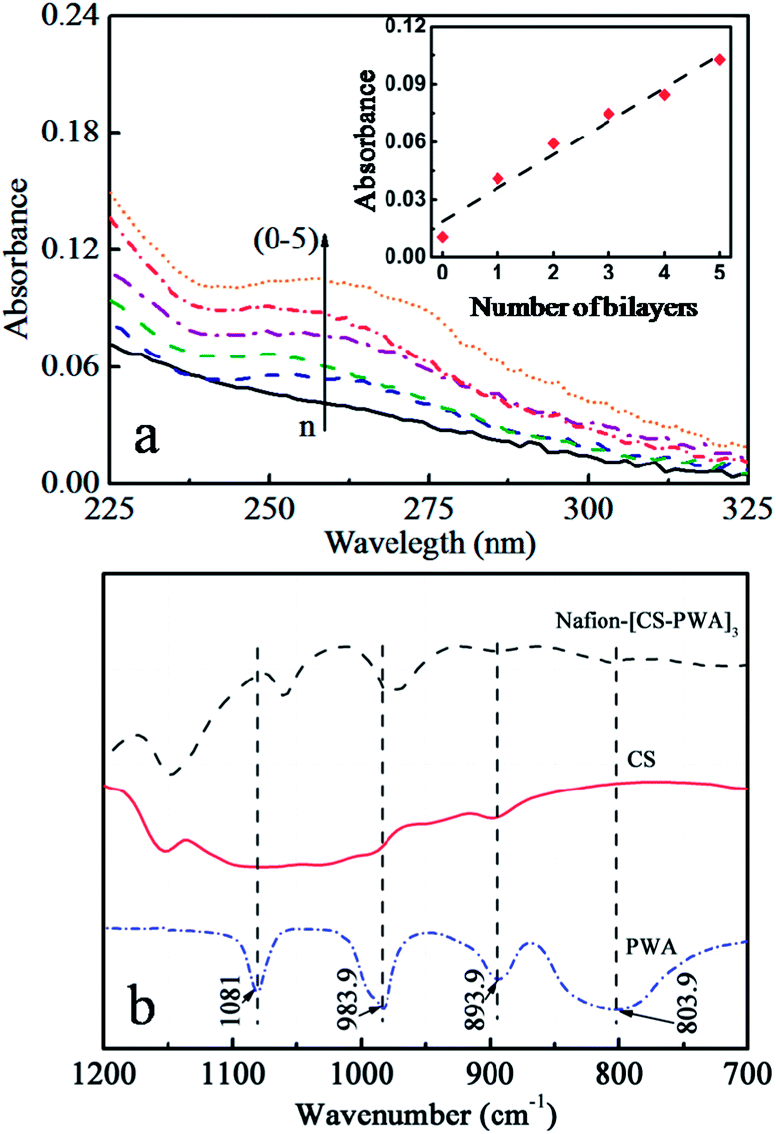 | ||
| Fig. 2 (a) UV-vis spectra of the Nafion–[CS–PWA]n self-assembled membranes; (b) FTIR analysis of the pure PWA and CS, and the surface of the Nafion–[CS–PWA]3, measured at room temperature. | ||
To verify the interaction between CS and PWA in the self-assembled multilayer on the Nafion surface, FTIR was used to analyse the membrane. Fig. 2b shows the FTIR spectra of pure PWA, CS and the Nafion–[CS–PWA]3 membrane. For pure PWA, characteristic bands are observed at 890 cm−1 (W–Ob–W), 983.9 cm−1 (W![[double bond, length as m-dash]](https://www.rsc.org/images/entities/char_e001.gif) Od), 893.9 cm−1 (W–Ob–W) and 803.9 cm−1 (W–Oc–W), which coincide with those reported in the reference for the [PW12O40]3− Keggin unit structure.27 Compared with pure PWA, the corresponding peaks of the membrane exhibit an obvious blue shift, which indicates that the terminal oxygen atoms of PWA strongly interact with the hydroxyl groups and the amino groups of chitosan. To further confirm the strong interaction between PWA and CS, we mixed a CS solution with a PWA solution and found that a large amount of white precipitate formed immediately. This result indicates that there does indeed exist a strong interaction between PWA and CS, which ensures that the PWA molecules trapped in the CS–PWA bilayer don't leach out in aqueous solution.
Od), 893.9 cm−1 (W–Ob–W) and 803.9 cm−1 (W–Oc–W), which coincide with those reported in the reference for the [PW12O40]3− Keggin unit structure.27 Compared with pure PWA, the corresponding peaks of the membrane exhibit an obvious blue shift, which indicates that the terminal oxygen atoms of PWA strongly interact with the hydroxyl groups and the amino groups of chitosan. To further confirm the strong interaction between PWA and CS, we mixed a CS solution with a PWA solution and found that a large amount of white precipitate formed immediately. This result indicates that there does indeed exist a strong interaction between PWA and CS, which ensures that the PWA molecules trapped in the CS–PWA bilayer don't leach out in aqueous solution.
The morphology and topography of the pristine Nafion membrane and the assembled Nafion–[CS–PWA]3 membrane were measured by AFM and SEM, as shown in Fig. 3. Based on the AFM images (Fig. 3a and b), it is clearly shown that the assembled Nafion–[CS–PWA]3 membrane shows distributed spikes, while the surface of the pristine Nafion membrane is smooth and flat. The mean interface roughness (Ra) values of the pristine Nafion membrane and the Nafion–[CS–PWA]3 are 0.38 nm and 5.18 nm, respectively. This indicates that something is present on the surface of the Nafion membrane. In order to confirm that the CS–PWA multilayer has changed the roughness, we analyzed the membrane cross-section by using SEM. Fig. 3c is the cross-section SEM image of Nafion–[CS–PWA]n with 18 self-assembled CS–PWA bilayers. The image clearly shows that the dense, homogenous multilayer is formed on the side of the Nafion membrane. The thickness of the CS–PWA multilayer is about 1.2 μm. It can be calculated that each CS–PWA bilayer is about 60–70 nm thick. Furthermore, the EDX spectra (Fig. 3d and e) indicate that elemental fluorine is uniformly distributed within the Nafion membrane and tungsten is present in the self-assembled multilayer. Importantly, the results of the AFM and SEM are consistent with the FTIR and UV-vis results.
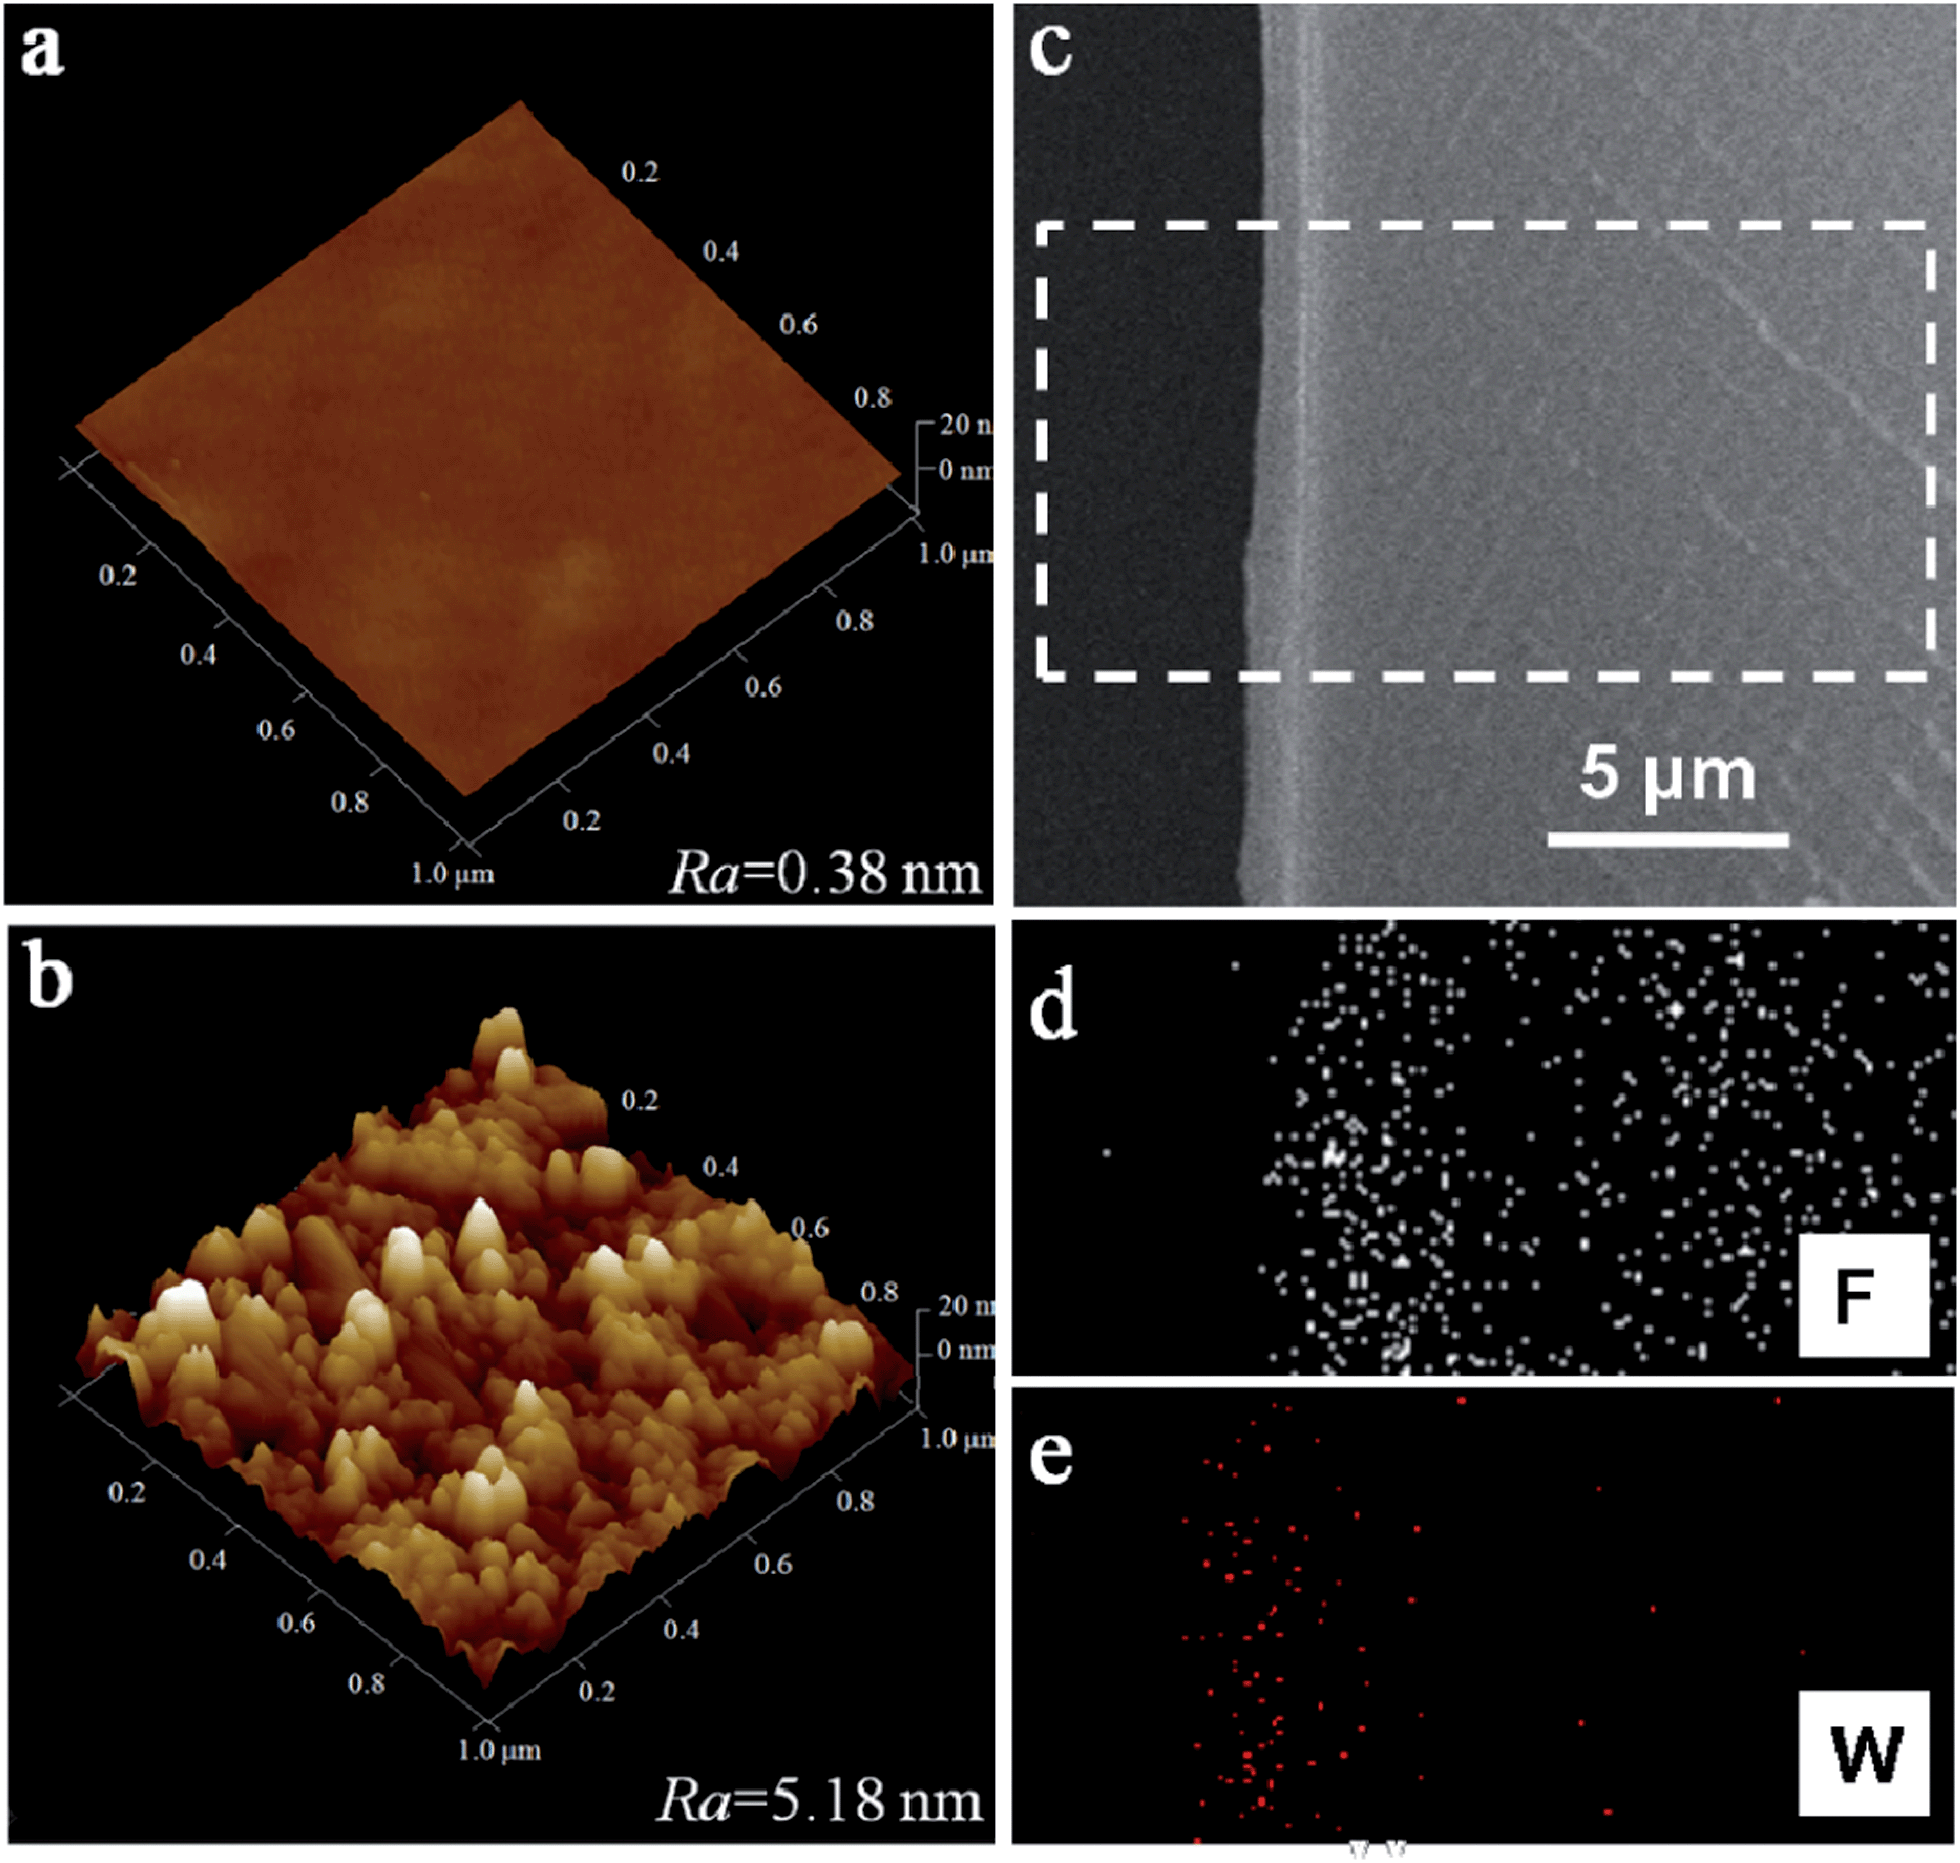 | ||
| Fig. 3 AFM images of the membrane surface: (a) Nafion membrane, (b) Nafion–[CS–PWA]3 membrane; SEM (c) and EDX (d and e) images of the cross-section of the Nafion–[CS–PWA]n membrane. | ||
3.2 Proton conductivity and vanadium ion permeability
The proton conductivity and the diffusion coefficient of V(IV) ions of the self assembled Nafion–[CS–PWA]n membranes were measured at room temperature. As show in Fig. 4a, the conductivities of the assembled Nafion–[CS–PWA]n membrane are all lower than that of the pristine Nafion membrane (0.129 S cm−1) in 1 M VOSO4/3 M H2SO4. With the increase in the number of self-assembled CS–PWA bilayers, proton conductivity of the membranes decreases gradually, probably due to the incorporated proton conducting PWA in the multilayer structure, as CS in the multilayer structure would not contribute to the conductivity. Fig. 4b shows the vanadium ion permeability of the Nafion–[CS–PWA]n membranes as a function of the number self-assembled CS–PWA bilayers. Compared with the conductivity, the vanadium ion permeability decreases sharply with the increasing number of bilayers. However, after the number of self-assembled CS–PWA bilayers has increased up to 3, there is little change in the vanadium ion permeability of the membranes, indicating that the self-assembled CS–PWA bilayers have reached their limit in blocking the vanadium crossover.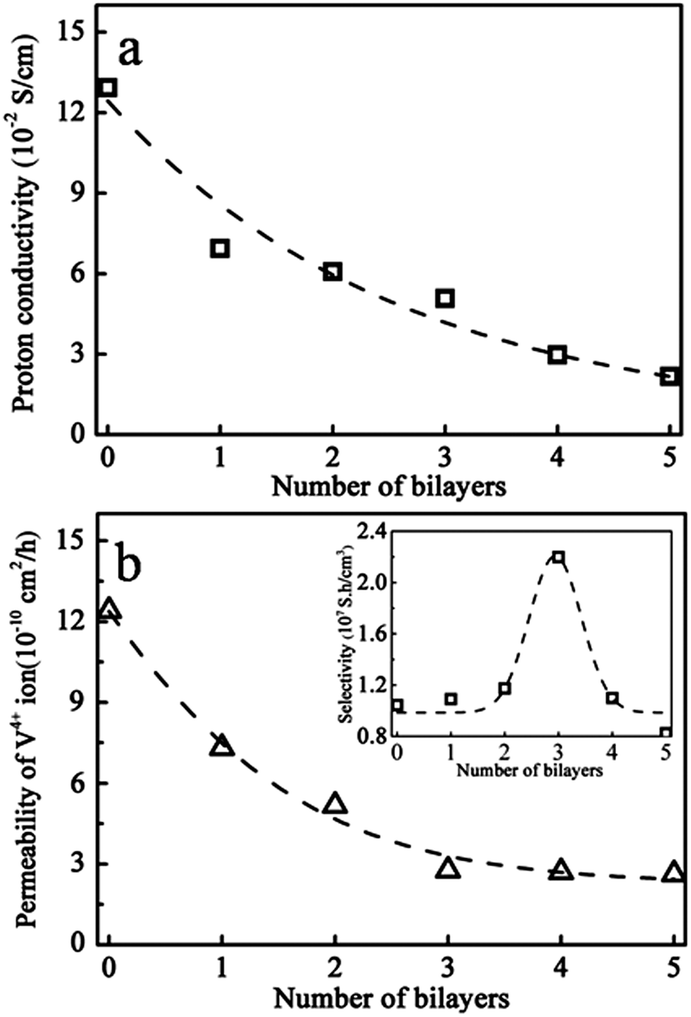 | ||
| Fig. 4 Plots of (a) conductivity and (b) VO2+ permeability of the Nafion membrane as a function of the number of self-assembled CS–PWA bilayers, measured at room temperature. Inset is the plot of σ/P for Nafion–[CS–PWA]n membrane as a function of the number of self-assembled CS–PWA bilayers. | ||
As reported in the literature,13 the Nafion membrane has a dual structure with a hydrophobic region interspersed with ion-rich hydrophilic domains, and a hydrophilic water-rich domain associated with polar clusters of –SO3− on the surface which form a channel. A proton could cross the membrane through the channel to maintain a high proton conductivity. However, hydrated V(IV) (bonding with the sulfonic acid groups) combined with water molecules can also enter the channel, which then traverse to the other side. Exactly as we expected, self-assembly of CS–PWA bilayers on the surface of the Nafion membrane can not only effectively suppress the crossover of V(IV) ions but can also minimise the impact on the proton conductivity of Nafion membranes.
Since IEMs applied in VRFBs should possess simultaneously high proton conductivity and low vanadium ion permeability, a new parameter, selectivity (the ratio of proton conductivity to ion permeability, σ/P) is defined to compare the comprehensive character of the composite membranes. That is to say, the higher the value of the σ/P, the better the performance of the membrane. Inset in Fig. 4b is the plot of σ/P of the Nafion212 membrane as a function of the number of self-assembled CS–PWA bilayers. As shown in the graph, the σ/P ratio reaches a maximum value of 2.2 × 10⁷ S h cm−3 for the composite membrane with 3 self-assembled CS–PWA bilayers and was about 2 times higher than that of any other membrane. Hence, we applied the Nafion–[CS–PWA]3 self-assembled membrane to the following tests.
3.3 Single cell performance
Charge–discharge curves of VRFBs with the Nafion and Nafion–[CS–PWA]3 membranes at a current density of 30–60 mA cm−2 are shown in Fig. 5. The results indicate that the charge–discharge voltage platform and capacity of the VRFB with the Nafion–[CS–PWA]3 membrane are both better than of that with pristine Nafion212. This is owing to the integrated effects of membrane conductivity and vanadium ion permeability. Although low conductivity will not be good for the charge–discharge process, less decline in the vanadium ion permeability results in a better charge–discharge performance of the composite membrane than that of pristine Nafion212. As shown in Fig. 6, the CE, VE and EE of the VRFB with the Nafion–[CS–PWA]3 membrane at various charge–discharge current densities are better than the CE, VE and EE with Nafion212. In the case of the VRFB with the Nafion membrane, vanadium ions will cross over through the Nafion membrane during the charge–discharge process and react with those vanadium ions which have a different valence state, resulting in a lower CE and EE. However, for the VRFB with the Nafion–[CS–PWA]3 membrane, the transport of vanadium ions through the membrane has been greatly reduced. Hence, a relatively high CE and EE can be achieved.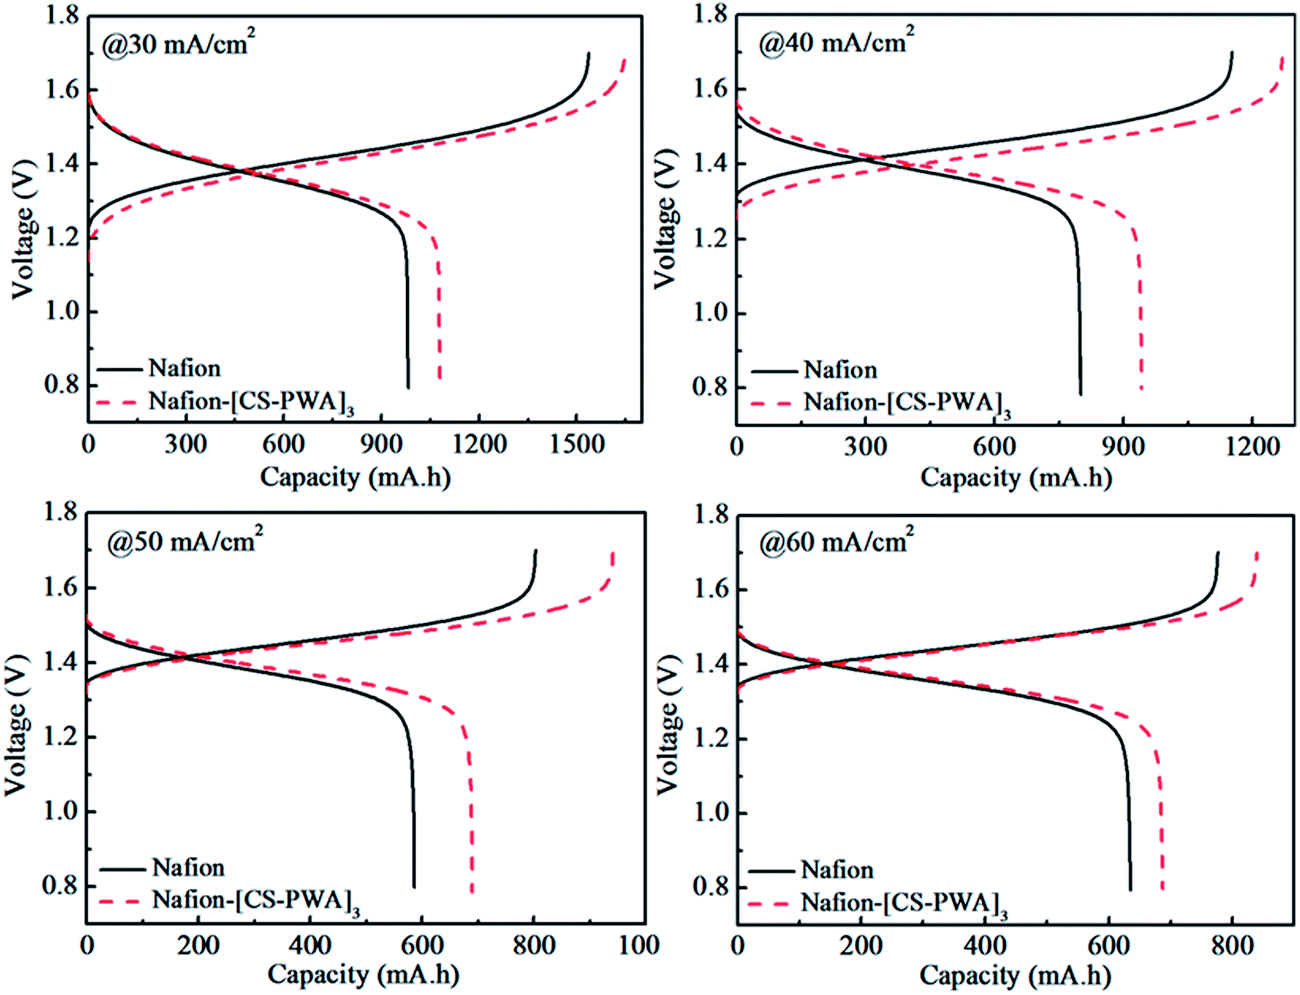 | ||
| Fig. 5 Charge–discharge curves of VRFBs with the Nafion and self-assembled Nafion–[CS–PWA]3 membranes at 30, 40, 50 and 60 mA cm−2 current density. | ||
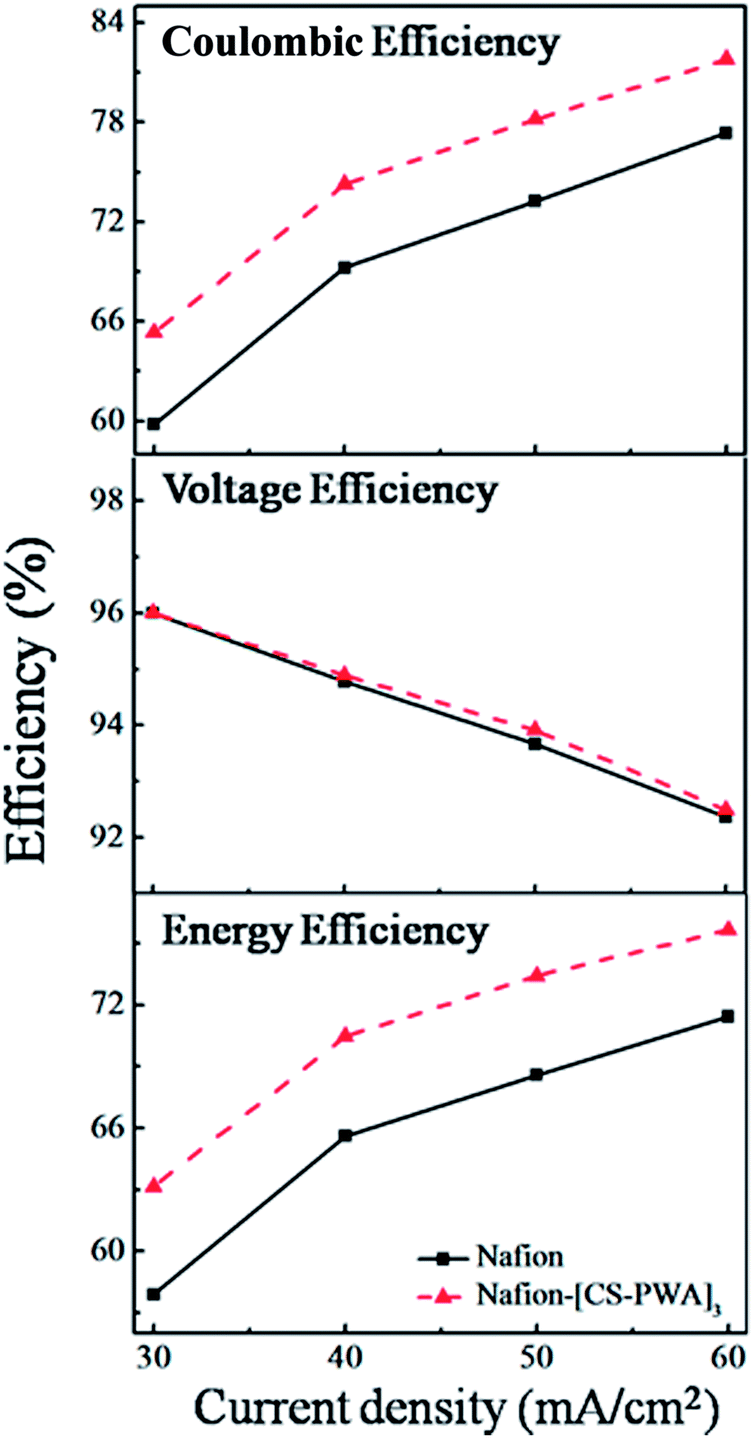 | ||
| Fig. 6 Efficiencies of VRFBs with the Nafion and self-assembled Nafion–[CS–PWA]3 membranes at various current densities. | ||
Open circuit voltage (OCV) is an important parameter for the self-discharge of a VRFB single cell. Self-discharge of a VRFB is mainly due to the crossover of vanadium ions through the membrane between the positive reservoir and negative reservoir. The VRFB self-discharge with different membranes was characterized by monitoring the OCV at room temperature after it was charged to a state of charge (SOC) of 80%. As show in Fig. 7, the OCV value initially decreases slowly with storage time and then drops sharply to 0.8 V. The time that the OCV is maintained above 1.3 V of the VRFB with the Nafion–[CS–PWA]3 membrane is 70 h, which is longer than that found with the pristine Nafion (50 h). This result is in accordance with the vanadium ion permeability results, indicating that the Nafion–[CS–PWA]3 composite membrane exhibits an excellent performance for VRFB applications.
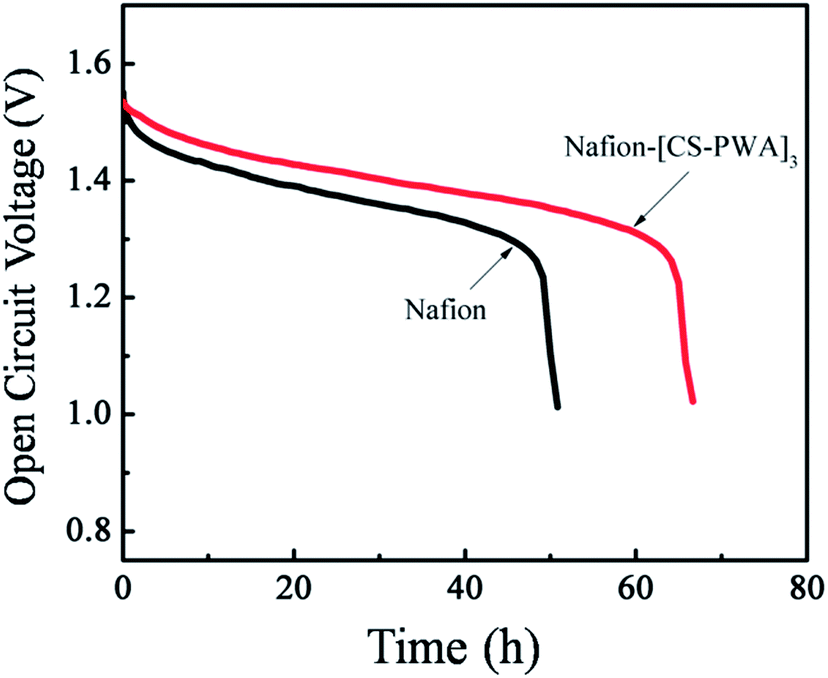 | ||
| Fig. 7 Open circuit voltage curves of the VRFB with the Nafion and self-assembled Nafion–[CS–PWA]3 membranes at SOC = 80%. | ||
In order to evaluate the stability of the self-assembled membrane under the working conditions of a VRFB, the single cell with the Nafion–[CS–PWA]3 or Nafion membrane was cycled at a current density of 60 mA cm−2 and the result is presented in Fig. 8. Over the 35 cycles, the CE and EE of the VRFB with the Nafion–[CS–PWA]3 membrane are both higher than the CE and EE with the Nafion membrane, which can be attributed to the lower vanadium permeability of the assembled Nafion–[CS–PWA]3 membrane. The efficiency of the VRFB with the assembled Nafion–[CS–PWA]3 membrane does not tend to decline over the 35 cycles, indicating that the self-assembled membrane possesses good stability in vanadium electrolyte under the working conditions, and thus is able to maintain an excellent comprehensive cell performance.
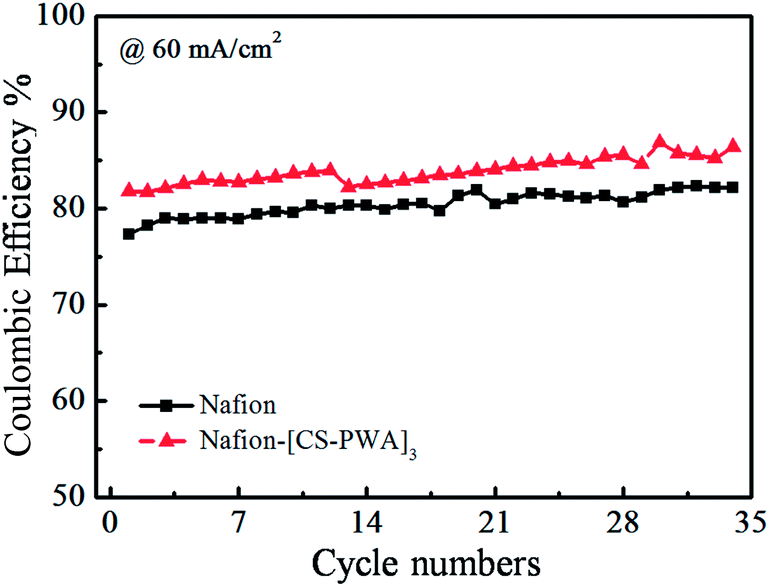 | ||
| Fig. 8 Cycling effect on the coulombic efficiency for the VRFB with the Nafion and self-assembled Nafion–[CS–PWA]3 membranes at 60 mA cm−2. | ||
4. Conclusion
In this work, Nafion–[CS–PWA]n membranes were successfully prepared by a layer-by-layer self-assembly technique on a Nafion surface with chitosan and PWA. The self-assembled CS–PWA bilayers were confirmed by AFM, SEM, FTIR and UV-vis spectra. The self-assembled CS–PWA bilayers not only suppress the vanadium ion crossover but also minimise the impact on the proton conductivity of the Nafion membrane. When three CS–PWA bilayers were assembled, the selectivity (σ/P) of the composite membrane reached its maximum value. The VRFB single cell with the Nafion–[CS–PWA]3 membrane showed higher coulombic and energy efficiencies and a lower self-discharge rate than that with the pristine Nafion membrane. As a result, the self-assembled Nafion–[CS–PWA]n membrane is a potential ion exchange membrane for VRFB applications.Acknowledgments
This work was financially supported by grants from the National Natural Science Foundation of China (no. 21003007, U1137602, 21073010), National High Technology Research and Development Program of China (863 program, 2013AA031902), National Program on Key Basic Research Project (973 Program) (no. 2011CB935700), National Science Foundation of Beijing (no. 2132051), Beijing Higher Education Young Elite Teacher Project (no. 29201493) and the Fundamental Research Funds for the Central Universities (YWF-13-T-RSC-030).References
- C. Ding, H. Zhang, X. Li, T. Liu and F. Xing, J. Phys. Chem. Lett., 2013, 4, 1281–1294 CrossRef CAS.
- B. Dunn, H. Kamath and J. M. Tarascon, Science, 2011, 334, 928–935 CrossRef CAS PubMed.
- G. L. Soloveichik, in Annual Review of Chemical and Biomolecular Engineering, ed. J. M. Prausnitz, 2011, vol. 2, pp. 503–527 Search PubMed.
- M. Skyllas-Kazacos, M. H. Chakrabarti, S. A. Hajimolana, F. S. Mjalli and M. Saleem, J. Electrochem. Soc., 2011, 158, R55 CrossRef CAS PubMed.
- B. Schwenzer, J. Zhang, S. Kim, L. Li, J. Liu and Z. Yang, ChemSusChem, 2011, 4, 1388–1406 CrossRef CAS.
- M. Skyllas-Kazacos, M. Rychcik, R. G. Robins, A. Fane and M. Green, J. Electrochem. Soc., 1986, 133, 1057–1058 CrossRef CAS PubMed.
- E. Sum, M. Rychcik and M. Skyllas-Kazacos, J. Power Sources, 1985, 16, 85–95 CrossRef CAS.
- C. Fabjan, J. Garche, B. Harrer, L. Jörissen, C. Kolbeck, F. Philippi, G. Tomazic and F. Wagner, Electrochim. Acta, 2001, 47, 825–831 CrossRef CAS.
- T. Mohammadi and M. Skyllas-Kazacos, J. Membr. Sci., 1995, 107, 35–45 CrossRef CAS.
- W. Wang, Q. Luo, B. Li, X. Wei, L. Li and Z. Yang, Adv. Funct. Mater., 2013, 23, 970–986 CrossRef CAS.
- G.-J. Hwang and H. Ohya, J. Power Sources, 1997, 132, 55–61 CrossRef CAS.
- J. Xi, Z. Wu, X. Qiu and L. Chen, J. Power Sources, 2007, 166, 531–536 CrossRef CAS PubMed.
- Z. Mai, H. Zhang, X. Li, S. Xiao and H. Zhang, J. Power Sources, 2011, 196, 5737–5741 CrossRef CAS PubMed.
- J. Xi, Z. Wu, X. Teng, Y. Zhao, L. Chen and X. Qiu, J. Mater. Chem., 2008, 18, 1232 RSC.
- Q. Luo, H. Zhang, J. Chen, P. Qian and Y. Zhai, J. Membr. Sci., 2008, 311, 98–103 CrossRef CAS PubMed.
- J. Zeng, C. Jiang, Y. Wang, J. Chen, S. Zhu, B. Zhao and R. Wang, Electrochem. Commun., 2008, 10, 372–375 CrossRef CAS PubMed.
- G. Decher, Science, 1997, 277, 1232–1237 CrossRef CAS.
- G. Decher, J. D. Hong and J. Schmitt, Thin Solid Films, 1992, 210–211(part 2), 831–835 CrossRef.
- X. Zhang, H. Chen and H. Zhang, Chem. Commun., 2007, 1395–1405 RSC.
- Y. Wang, S. Wang, M. Xiao, D. Han, M. A. Hickner and Y. Meng, RSC Adv., 2013, 3, 15467 RSC.
- M. Yang, S. Lu, J. Lu, S. P. Jiang and Y. Xiang, Chem. Commun., 2010, 46, 1434–1436 RSC.
- Y. Xiang, S. Lu and S. P. Jiang, Chem. Soc. Rev., 2012, 41, 7291–7321 RSC.
- M. Misono, Catal. Rev.: Sci. Eng., 1987, 29, 269–321 CAS.
- X. Teng, J. Dai, J. Su, Y. Zhu, H. Liu and Z. Song, J. Power Sources, 2013, 240, 131–139 CrossRef CAS PubMed.
- T. Sukkar and M. Skyllas-Kazacos, J. Appl. Electrochem., 2004, 34, 137–145 CrossRef CAS.
- D. Chen, S. Kim, V. Sprenkle and M. A. Hickner, J. Power Sources, 2013, 231, 301–306 CrossRef CAS PubMed.
- J. Lu, H. Tang, S. Lu, H. Wu and S. P. Jiang, J. Mater. Chem., 2011, 21, 6668 RSC.
| This journal is © The Royal Society of Chemistry 2014 |