
 Open Access Article
 This Open Access Article is licensed under a
 Creative Commons Attribution 3.0 Unported Licence
Yearlong study of indoor VOC variability: insights into spatial, temporal, and contextual dynamics of indoor VOC exposure†
Thomas
Warburton
 *a,
Jacqueline F.
Hamilton
ab,
Nicola
Carslaw
c,
Rosemary R. C.
McEachan
d,
Tiffany C.
Yang
d,
James R.
Hopkins
ab,
Stephen J.
Andrews
ab and
Alastair C.
Lewis
ab
*a,
Jacqueline F.
Hamilton
ab,
Nicola
Carslaw
c,
Rosemary R. C.
McEachan
d,
Tiffany C.
Yang
d,
James R.
Hopkins
ab,
Stephen J.
Andrews
ab and
Alastair C.
Lewis
ab
aWolfson Atmospheric Chemistry Laboratories, University of York, UK. E-mail: tom.warburton@york.ac.uk
bNational Centre for Atmospheric Science, UK
cDepartment of Environment and Geography, University of York, UK
dBradford Institute for Health Research, Bradford Teaching, Hospitals NHS Foundation Trust, UK
First published on 12th March 2025
Abstract
Volatile organic compounds (VOCs) are released from many sources indoors, with ingress of outdoor air being an additional source of these species indoors. We report indoor VOC concentrations for 124 homes in Bradford in the UK, collected between March 2023 and April 2024. Whole air samples were collected over 72 hours in the main living area of the home. Total VOC (TVOC) concentrations in the homes were highly variable, ranging from 100 μg m−3 to >8000 μg m−3 (median concentration ∼1000 μg m−3). Acetaldehyde and 1,3-butadiene concentrations in >75% of homes were found to be in exceedance of the 1 in 1![[thin space (1/6-em)]](https://www.rsc.org/images/entities/char_2009.gif) 000000 lifetime cancer risk threshold. Higher concentrations of benzene, toluene, ethylbenzene and xylene (BTEX) as well as trimethylbenzenes were found in urban houses (summed xylene median 2.35 μg m−3) compared to rural homes (summed xylene median 1.22 μg m−3, p-value = 0.02), driven by ingress of elevated outdoor BTEX and trimethylbenzenes (outdoor urban BTEX median 1.69 μg m−3, outdoor rural BTEX median 0.78 μg m−3). Inferred air change rate (ACR) exhibited a degree of seasonality, with average ACR varying between median values of 1.2 h−1 in the summer and 0.70 h−1 in winter. Time-averaged emission rate data provided additional insight compared to measured concentrations, such as seasonal variability, with highest total VOC time-averaged emission rates occurring in summer months (median 51953 μg h−1), potentially a product of both increased occupancy times during school holidays as well as off-gassing of VOCs from surfaces. This comprehensive analysis underscores the critical role of seasonal, spatial, and contextual factors in shaping indoor VOC exposure, as well as potential health risks associated with consistently elevated concentrations of specific VOCs.
000000 lifetime cancer risk threshold. Higher concentrations of benzene, toluene, ethylbenzene and xylene (BTEX) as well as trimethylbenzenes were found in urban houses (summed xylene median 2.35 μg m−3) compared to rural homes (summed xylene median 1.22 μg m−3, p-value = 0.02), driven by ingress of elevated outdoor BTEX and trimethylbenzenes (outdoor urban BTEX median 1.69 μg m−3, outdoor rural BTEX median 0.78 μg m−3). Inferred air change rate (ACR) exhibited a degree of seasonality, with average ACR varying between median values of 1.2 h−1 in the summer and 0.70 h−1 in winter. Time-averaged emission rate data provided additional insight compared to measured concentrations, such as seasonal variability, with highest total VOC time-averaged emission rates occurring in summer months (median 51953 μg h−1), potentially a product of both increased occupancy times during school holidays as well as off-gassing of VOCs from surfaces. This comprehensive analysis underscores the critical role of seasonal, spatial, and contextual factors in shaping indoor VOC exposure, as well as potential health risks associated with consistently elevated concentrations of specific VOCs.
Environmental significanceThis yearlong study provides critical insights into the environmental dynamics of indoor volatile organic compounds (VOCs), showcasing how urban–rural differences, seasonal patterns, and building characteristics influence indoor air composition. The findings emphasise the significance of understanding VOC sources and emission behaviours, not only for managing indoor environments but also for addressing their potential contributions to outdoor air pollution. Observations of VOC concentrations exceeding established benchmarks for lifetime cancer risk underscore the broader importance of reducing emissions from both indoor and outdoor sources to improve environmental quality. |
Introduction
Volatile organic compounds (VOC) are a class of air pollutants that are found both indoors and outdoors.1–3 Activities indoors such as cooking, using personal care products (PCPs), cleaning products and building and furnishing materials can all lead to VOC emissions; if these occur in poorly ventilated spaces then markedly elevated indoor concentrations can result.4–7 The same sources can also lead to the emission of semi-volatile organic compounds (SVOCs) which can undergo gas-to-particle phase partitioning, or produce new products following oxidation, as with VOCs. Both processes influence the total mass of particulate matter indoors, and hence the ability to cause harm to human health.8,9 As up to 90% of time is spent indoors,10 quantification of both VOC emissions and concentrations is an essential precursor to effective indoor air quality management.Whilst acute VOC exposure has been associated with serious medical conditions, such as breathing difficulties and cardiac arrhythmia,11,12 the effects of long-term exposure to lower concentrations of VOCs remains relatively understudied. Ambient indoor concentrations of VOCs in typical UK settings are generally not high enough to give rise to acute health effects. Indoor measurements rarely show concentrations that exceed guidelines for acute effects, e.g. as in Shrubsole et al. (2019) and adopted by Public Health England as “UK guidelines for volatile organic compounds in indoor spaces”.3,13–15 However, as of yet, there are no long-term indoor data sets that allow for assessments of the health effects of exposure to VOCs with confidence.
Incidental release of VOCs through activities such as cooking and cleaning gives rise to sudden and often large increases in associated VOC concentrations. Concentrations decrease once the activity has concluded, dependent on variables such as room volume, air exchange rate, gas-surface partitioning of VOCs, and oxidation, and can take several hours.6,16–19 VOCs with the highest measured indoor concentrations in the UK are typically propane, butane and ethanol.3,14 A common source of propane and butane is from the use of aerosol products where they are propellants, including as home care and personal care products. Propane and butane concentrations greater than 3000 μg m−3 have previously been reported in homes.3,14 Ethanol is used as an ingredient in some personal care products such as hairspray, but also arises from fragrance and disinfectant use, as well as from cooking.20–24 Increasing ventilation rates and controlling source emissions can aid in mitigating high VOC concentrations indoors.25,26
Air change rate (ACR) is defined as the number of air changes within a volume over a time period, usually per hour. ACR is inherently difficult to accurately determine in residential settings, and is usually calculated/inferred through tracer or decay methods and models.27,28 Low ACRs have been shown to give rise to an increase in indoor VOC concentrations and hence exposure.14,29,30 Residential ACRs are typically around 0.5 h−1 to 2 h−1, however, ACRs in general can vary greatly depending on whether the space is in a residential or commercial setting, the time of year, the leakiness of the building envelope, and human behaviour, among other factors.31–33
Ambient temperature can impact indoor VOC exposure through increased material off-gassing of surface-bound VOCs.34,35 This process is uneven however,36 with newer building materials having generally higher off-gassing VOC emission rates than older materials regardless of temperature effects.
Indoor–outdoor (IO) ratios of VOCs can be used to highlight those VOCs which have large indoor concentrations; reactive species such as monoterpenes and other double-bond-containing hydrocarbons often have higher indoor concentrations compared to outdoors.3,13,37,38 These compounds are noteworthy because of the potential for secondary product formation when they are oxidised, such as secondary organic aerosols (SOAs).39–41 Chronic exposure to SOAs is potentially linked to an increase in mortality.42,43
Datasets on indoor VOC concentrations in UK homes remain sparse, particularly for lower-income households. Limited measurements have been conducted across the broader range of VOCs present in the UK.3,13,14 This paper reports on VOC concentrations observed in 124 occupied homes as part of the INGENIOUS (UnderstandING the sourcEs, traNsformations and fates of IndOor air pollUtantS) project.44 It quantifies the concentrations and time-averaged emission rates of indoor VOCs, and how these are influenced by seasonal effects of ACR.
2. Experimental and methodology
2.1 Study area
Bradford is a city in the West Yorkshire Combined Authority in the North of England, in the UK. With a population of 560000,45 Bradford encompasses a large geographic envelope, with rural and urban areas often within short distances. Bradford is located east of the Pennine hills, and the city centre sits in a bowl-like position, flanked by inclines on almost all sides. A Clean Air Zone (CAZ) was introduced to Bradford within the outer ring road and extending up to Shipley in North Bradford in late-September 2022, currently the largest of its type in England outside of Greater London, covering 9.35 square miles. The extent of the CAZ, as well as a topographical presentation of the elevations surrounding Bradford are given in ESI Fig. S1.† The Bradford CAZ applies to all vehicles other than private cars and motorbikes in an effort to reduce vehicle-related emissions within the Bradford area, such as NOx. While it may be too soon to definitively identify the effects on outdoor air pollution of the introduction of the Bradford CAZ, preliminary results show a potential reduction in vehicle emissions since the introduction of the Bradford CAZ.46 More established CAZs, such as the Greater London Low Emission Zone (LEZ) and the Ultra-low Emission Zone (ULEZ), have been shown to reduce vehicle-related pollution levels more so than nearby CAZ-free areas.47,48 Given the potential for outdoor air penetration indoors, this could have a potential impact on indoor air quality in CAZ-enveloped areas.
Bradford's history is mainly industrial, being a centre of wool-based production and trade in the 1800s.49 Following the collapse of industrialisation in the UK, Bradford saw a decline in living standards, along with several other Northern English and other post-industrial cities across Europe.50–52 In the 21st century, Bradford has higher-than-average levels of socioeconomic disadvantage, as well as disproportionately lower life expectancy and health prospects when compared to the rest of England.53–56 Bradford is a highly diverse city with high levels of ethnic diversity.57
Studies have previously linked areas with higher deprivation levels with lower outdoor air quality across the entire UK and within countries and regions which make up the UK, especially so in comparable post-industrial cities.58–61 Outdoor air pollution in Bradford has been monitored continuously since 1999, with one continuous automatically-reporting monitoring site located on Mayo Avenue, Bradford measuring NO and NO2, as well as wind direction, speed and ambient temperature, forming part of the Defra national monitoring network.62 Despite over 20 years of continuous outdoor air pollution data collection, there are no reported datasets on indoor VOC concentrations for Bradford, or similar cities with high degrees of socioeconomic and ethnic diversity.
2.2 Participant selection and questionnaires
The methodology for participant selection and sampling regime, more broadly including the development and analysis of questionnaires, are detailed in Ikeda et al. (2023).63 In brief, 310 homes were monitored for indoor air pollutants using low-cost sensors.44 A subset of sampled homes participated in VOC analysis where a whole air canister was deployed and a time-integrated sample (up to 72 hours) was collected. The participants in this study were part of the Born in Bradford (BiB) birth cohort study.64 Homeowners were asked to complete home, health and behaviour surveys during sampling. This captured a large quantity of information that could be linked with each air sample. From these questionnaires, daily statistics of aerosol product and fragrance product use was taken for analysis in this study and summed for a total product use over the canister sampling period. A building audit was completed by BiB research assistants, capturing information about the different microenvironments in which samples were taken, of which the room volume was of specific interest to this study for the calculation of ACR (explained in Section 2.5). The full questionnaires are available in the ESI in Ikeda et al. (2023).63 Of the targeted 150 homes, a total of 124 homes had usable whole air samples taken for VOC analysis. All the samples had home, health, behaviour and building survey responses available. However, response rates to individual questions within the surveys were sometimes <100% (min 41%, max 100%, median 90%).2.3 Sample preparation, collection and preparation for analysis
Whole air samples inside each home were collected using 6 L vacuum-intake stainless steel canisters treated internally with a proprietary silica-based ceramic (Entech, CA, USA). Flow-restrictive inlets (Entech, CA, USA) were used to time-integrate samples up to 72 hours (sampling flow rates through low surface area sapphire orifice restrictors varied between 1.4 and 1.9 mL min−1). Canisters were evacuated to 0.01 Pa (29.9 “Hg” vacuum gauge, 99.99% vacuum) prior to use. Canister valves were assessed for seal integrity using a vacuum gauge fitted to the sealed canister valve.Canisters and flow-restrictive inlets, which remained paired throughout the study, were deployed in homes across Bradford from March 2023 to April 2024, with each sample collected over a 72 hour period. Canisters were consistently placed in the main living area, which was not always a designated ‘living room’ and often included open-plan spaces such as combined living, kitchen, and dining areas. Consequently, some canisters may have been exposed to episodic VOC emissions from activities such as cooking and food preparation. Canisters were positioned within the living area, no higher than 1 m above ground level and, where feasible, away from doorways. After sampling, the canisters were returned to the University of York for analysis.
2.4 Sample analysis
Samples were analysed following the method detailed in Warburton et al. (2023).14 Briefly, canister samples were initially diluted to 1 bar (gauge) with 6 L of humidified highly purified air free of VOCs (hereafter ‘blank gas’), produced by flowing compressed ambient air through a bed of platinum beads at >375 °C. 500 mL of diluted canister air was then drawn through a 16-port solenoid-actuated pneumatic valve manifold (Swagelok Company, OH, USA) at 15 mL min−1 into a custom-built thermal desorption unit (TDU), sequentially comprising a water trap, pre-concentration trap and finally a pre-injection focus trap. The water trap was held at −40 °C during sample intake, while the pre-concentration and focus traps were held at the lowest achievable temperature, always below −110 °C.Following flash heating from the focus trap, dried, pre-concentrated and focused samples were injected into a two-column gas chromatograph (GC, Agilent 7890A, Agilent Technologies, CA, USA) fitted with flame ionisation detectors (FIDs) and a quadrupole mass spectrometer (QMS, Agilent 5977A, Agilent Technologies, CA, USA). Samples were first separated on a 60 m, 150 μm internal diameter (ID) VF-WAX column with a film thickness of 0.50 μm (Agilent Technologies, CA, USA) at 1.6 mL min−1 (helium carrier gas pressure of 35 psi). This resulted in a long elution of unresolved C2 to C6 hydrocarbons from the VF-WAX column, which were passed through a Deans switch (Agilent Technologies, CA, USA) to a 50 m, 320 μm ID Na2SO4-deactivated Al2O3 porous-layer open tubular (PLOT) column with a wall coating thickness of 5 μm (Agilent Technologies, CA, USA). Eluent from the PLOT column directly flowed through to an FID. Once the unresolved species had finished eluting through the VF-WAX column (at 8.3 minutes) the Deans switch diverted the analyte flow through a section of fused silica (2 m × 150 μm ID) to both balance column flows at the Deans switch and split analyte flow between a second FID and the QMS for simultaneous detection, through sections of 150 μm ID fused silica of length 0.91 m and 2.1 m, respectively.
A thirty-component mix of non-methane hydrocarbons (NMHCs) in nitrogen was used for sample calibration. Each VOC was at a mixing ratio of approximately 4 ppb, provided by the National Physical Laboratory, Teddington, UK (cylinder number D933515, hereafter referred to as ‘NPL 30’). Sampled VOCs contained within the NPL 30 mix were directly calibrated, with remaining VOCs calibrated using equivalent carbon responses. Table S1 (ESI†) gives the identify of the thirty directly-calibrated species. Following each canister batch, blank gas was sampled three times, followed by five NPL 30 calibrations and finally three carrier gas/internal samples (‘no flow blanks’). A no flow blank method involved the TDU operating with the sample volume set to 0 mL and the sample time set to 33.3 minutes, the time a regular 500 mL sample would take to be drawn. This process resulted in only carrier gas flowing through the TDU traps over the sampling period, resulting in canister sample correction for both blank gas diluent impurities (none found) and wider carrier gas and system impurities (consistently 0.95 μg m−3 benzene only). Following analysis, canisters were re-evacuated according to the previous method. Evacuated canisters were spot checked for impurities by filling from evacuated to 1 bar (gauge) with humidified blank gas and run on a regular canister sampling method.
Following GC analysis, a subset of n = 90 samples was further processed for greenhouse gas analysis, by flowing the canister samples at 600 mL min−1 into a laser absorption spectrometer (Ultraportable Greenhouse Gas Analyser, Los Gatos Research Inc., CA, USA). This additional analysis allowed carbon dioxide mixing ratios to be quantified.
Chromatograms for each sample were initially qualitatively analysed using MassHunter (Agilent Technologies, CA, USA) to assess the quality of chromatographic separation and resolution. Chromatograms were then integrated using GCWerks (GC Soft Inc., CA, USA). FID data was mostly used for peak integration and concentration data analysis. However, QMS data was required to deconvolve benzene, monoterpenes, chlorinated species and cyclosiloxanes. Over 120 VOC species were identified and included in the analysis. Instrument limits of detection (LOD) and limits of quantification (LOQ) were calculated using a signal-to-noise ratio of 3:1 and 10:1 respectively, and are shown in Table S2 (ESI†) for all VOCs measured by the instrument (including some otherwise not explicitly mentioned in this paper).
The entire VOC dataset is open-access and available at https://doi.org/10.15124/24fd1762-0e98-4773-a74c-7dd87ef59aa8.
2.5 Calculation of ACR
Several methods exist to calculate and infer ACR. A common method is to use real-time CO2 mixing ratios (or another tracer gas) and monitor decay rates.65,66 The work presented here used assumptions about the natural generation of CO2 by home occupants (adjusted for time spent in the main living area assessed through available data on room occupancy statistics67,68), the room volume, and the difference between internal and external CO2 mixing ratios. Within the wider scope of the INGENIOUS project, real-time CO2 mixing ratios were measured by low-cost sensors and used to calculate ACR, and these results will form the basis of a future paper.Here, ACR was inferred according to an adapted method identified in Warburton et al. (2023),14 which itself used methods described by Batterman (2017),69 shown in eqn (1):
 | (1) |
2.6 VOC metrics and manipulation
For VOC analysis, a total of n = 124 samples were used. For each sample a metric of total VOC (“TVOC”) concentration was defined as the sum of all quantified VOC concentrations for each sample. This would often be a subset of the total number of VOCs quantified in this study, owing to variation in sample composition. Therefore, TVOC presented here is an operational air quality metric specific to this study and analytical method.Indoor VOC sources such as paints and other decorating products can emit BTEX species (benzene, toluene, ethylbenzene, and xylene) and trimethylbenzenes (TMB) in intense but episodic bursts, especially immediately following the use of paints,72 potentially producing extreme outliers that distort data and statistical analyses. However, given the inherently variable nature of indoor air, a data treatment approach was needed that could accommodate natural variations while mitigating the impact of extreme values. Modified Z-scores were therefore calculated for indoor BTEX and TMB according to eqn (2):
 | (2) |
 acts to scale the modified Z-score to compare against ‘regular’ Z-scores. MAD itself is the median value of the absolute deviation of each data point in group i from the median of group i, and can be calculated according to eqn (3):
| MAD = median(|xi − imed|) | (3) |
In this context, mzi may be used analogously to a standard Z-score for evaluating deviations from the central tendency. However, because mzi is based on group median and MAD, it is more resistant to the effects of outliers. Typically, if a value has an absolute mzi greater than 3.5, it is said to be an outlier, and this threshold was used here.73
To address skewing by the largest outliers and reduce the number of false positives when identifying outliers through the mzi calculation, the data were first logarithmically transformed. Outliers were then identified by calculating mzi according to eqn (2), with datapoints grouped by VOC having an mzi higher than 3.5 being filtered out. The typical lower threshold of −3.5 was not necessary in this case as the lowest modified Z-score for this analysis was −3.46. Finally, the data were transformed back to the original concentration values by applying an exponential to the filtered dataset.
 | (4) |
2.7 IRIS benchmark calculations
In this study, benzene exhibited a significantly lower median indoor concentration (0.70 μg m−3) compared to substances such as ethanol (median 320 μg m−3). Despite this, the health risks associated with chronic benzene overexposure are well-documented, with safe exposure thresholds set at notably low levels. Consequently, evaluating indoor concentrations against established exposure benchmarks offers additional insight into the potential long-term impacts of VOC exposure. Inhalation unit risks (IURs), defined as ‘the upper-bound excess lifetime cancer risk estimated to result from continuous exposure to an agent at a concentration of 1 μg m−3 in air for a lifetime’,75 for lifetime cancer risk (LCR) assessments and reference concentrations for hazard quotient (HQ) calculations were sourced from the IRIS database.76Calculation of both LCR and HQ for homeowners follow methods established by both the United States Environmental Protection Agency (US EPA)75,76 and the Agency for Toxic Substances and Disease Registry (ATSDR),77 also using freely available data on UK working patterns obtained from the Office for National Statistics (ONS)78 to better inform assumptions made. These methods are given in the ESI as supplementary method 2 and 3† for LCR and HQ, respectively.
2.8 Data visualisation and statistical analysis
All data analysis and manipulation were conducted through RStudio software. The tidyverse package was used in all data processing. Data plotting used ggplot2 for all figures. Boxplots show values in the order of (from bottom-to-top): lower outliers, 5th percentile, 25th percentile, median value, 75th percentile, 95th percentile, and upper outliers. Error bars on plots represent 95% confidence intervals, calculated using 1000 bootstrap resamples of the data.Multiple statistical testing methods were employed in this study. Data normality was first assessed using QQ plots, which indicated that all VOCs followed non-normal distributions. To evaluate stochastic dominance within data subsets, Brunner–Munzel tests (also known as the “generalized Wilcoxon test”) were conducted, grouping samples based on a binary variable. The Brunner–Munzel test was chosen over the more commonly used Mann–Whitney U test (Wilcoxon rank-sum test) because it does not assume equal variances or a location shift between groups, unlike the Mann–Whitney U test. Given the variability of indoor air due to personal behaviours, these assumptions could not be reliably made, necessitating a more robust testing method.
For datasets with multiple levels within groupings (e.g., seasons), an initial Kruskal–Wallis test was performed to assess overall differences across the primary binary grouping variable. Post hoc Dunn tests were then used to identify pairwise differences and determine specific levels exhibiting stochastic dominance.
All p-values were adjusted using Holm's correction for multiple comparisons. A significance level of α = 0.05 (95% confidence interval) was applied throughout the analysis, with p-values below this threshold indicating statistical significance.
3. Results and discussion
Raw VOC concentration and calculated time-averaged emission rate mean, quartile ranges and standard deviation is given in Tables S5 and S6 (ESI),† respectively.3.1 Indoor VOC concentrations
 | ||
| Fig. 1 Measured indoor concentrations of a select group of VOCs measured in the INGENIOUS homes. Boxplots show values in the order of (from bottom-to-top): lower outliers, 5th percentile, 25th percentile, median value, 75th percentile, 95th percentile, and upper outliers. The y-axis has been logarithmically transformed to aid presentation. | ||
Indoor sources of butane and propane are dominated by emissions from compressed aerosol products such as deodorants, cleaning aerosols, hairsprays and other aerosolized personal care products (PCPs), where they act as propellants.5 Methanol is a commonly found emission from cooking, but also originates as an endogenous human breath emission, as well as in small amounts in some household products and, more rarely, PCPs.16,79,80 Ethanol is commonly found indoors, arising from multiple sources such as household products and PCPs, alcohol consumption and cooking.3,16,79
 | ||
| Fig. 2 Indoor concentrations of aromatic VOCs, treated through modified Z-score analysis, and separated by rural or urban status. Boxplots show values in the order of (from bottom-to-top): lower outliers, 5th percentile, 25th percentile, median value, 75th percentile, 95th percentile, and upper outliers. The y-axis has been logarithmically transformed to aid presentation. TMB = trimethylbenzene, BTEX = benzene, toluene, ethylbenzene and xylene. * denotes a change of significance (p-value < 0.05). | ||
000000. Median values for acetaldehyde, carbon tetrachloride, chloroform and 1,3-butadiene were above the 1 in 1000000 threshold. Indeed, >60% of homes had concentrations of these four species above this threshold, with values sometimes exceeding 1 in 100000, comparable to LCRs derived from chronic exposure to second- and third-hand smoke.81,82 However, LCRs in this study were highly variable and in general appeared to be somewhat lower than LCRs for chronic exposure to indoor airborne particulates and outdoor airborne nitrosamines.82–85 Carbon tetrachloride has been phased out of publicly available products since the Montreal Protocol came into effect, as well as being a potent hepatotoxic suspected human carcinogen. However given the variability in calculated LCRs and indoor concentrations, it is clear that there was at least one indoor source of emission of carbon tetrachloride in this study, likely arising as a secondary by-product of atmospheric reactions rather than as a primary emission from the product formulation itself. Carbon tetrachloride, as well as other halogenated hydrocarbons have been shown to be emitted from the use of chlorinated bleach indoors.86,87 The use of chlorinated products indoors may have been a potential source of indoor carbon tetrachloride secondary emissions here.
 | ||
| Fig. 3 Calculated lifetime cancer risks (LCRs) for six VOCs. A horizontal dotted line is placed at the 0.000001 mark, representing the 1 in 1000000 chance threshold of developing cancer through a lifetime exposure to the exposure factor-adjusted concentration of the displayed VOC. Boxplots show values in the order of (from bottom-to-top): lower outliers, 5th percentile, 25th percentile, median value, 75th percentile, 95th percentile, and upper outliers. The y-axis has been logarithmically transformed to aid presentation. | ||
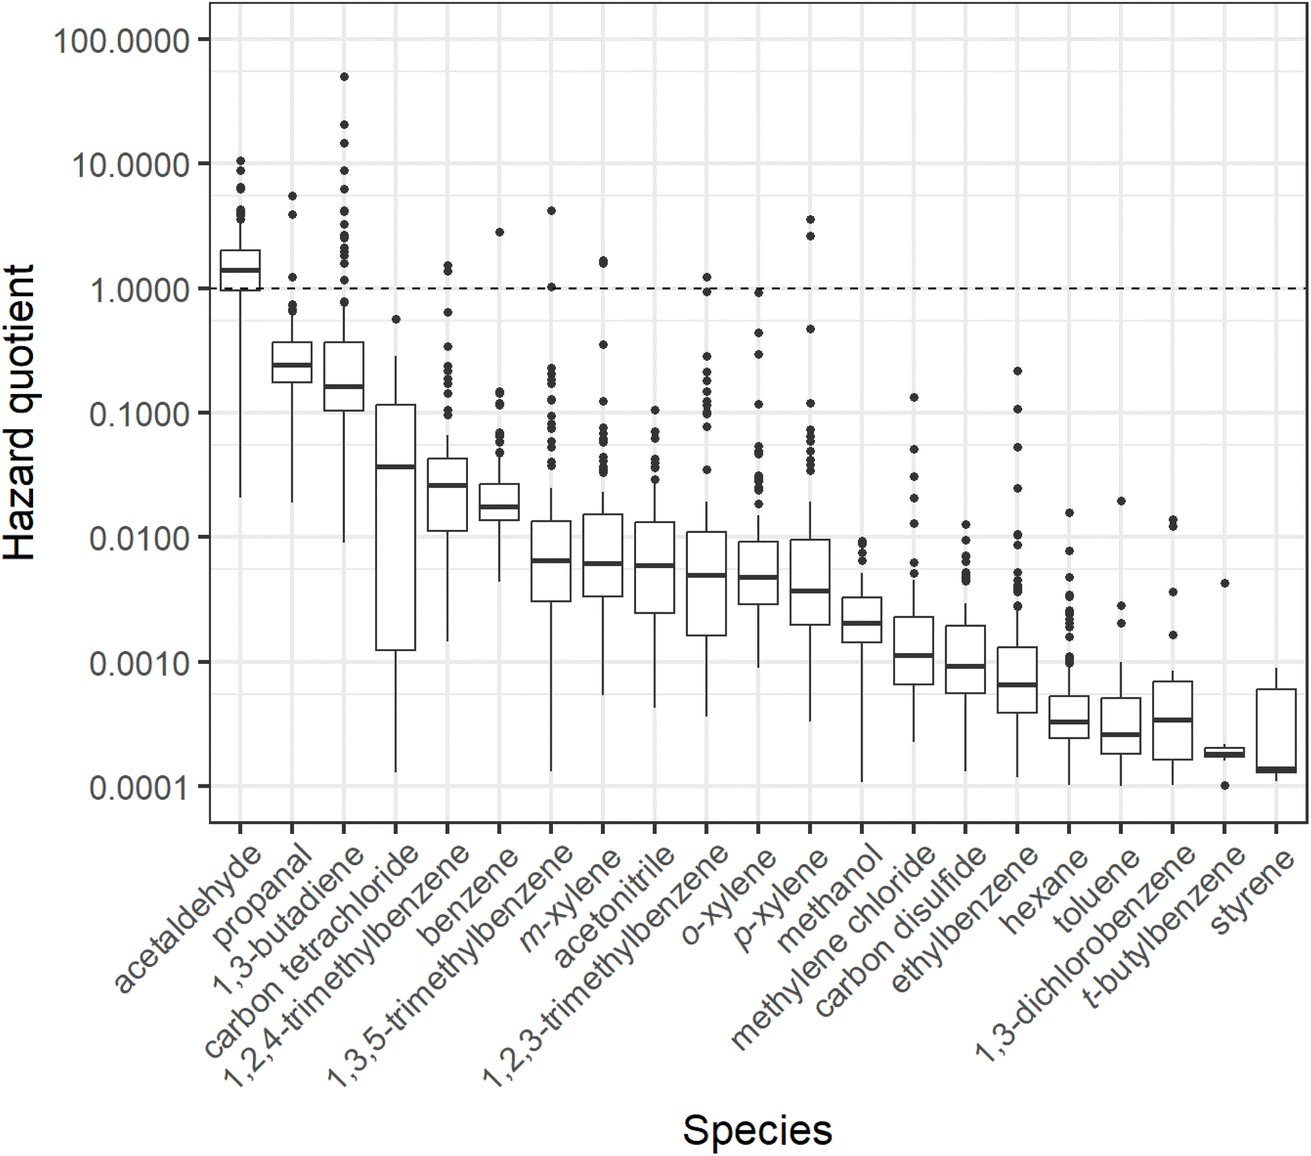 | ||
| Fig. 4 Calculated hazard quotients (HQs) for the VOCs measured in this study with available reference concentration data from the integrated risk information system (IRIS). A horizontal dotted line is placed at HQ = 1, above which a home occupant could develop symptoms based on a lifetime exposure to the exposure factor-adjusted concentration for the displayed VOC. Boxplots show values in the order of (from bottom-to-top): lower outliers, 5th percentile, 25th percentile, median value, 75th percentile, 95th percentile, and upper outliers. The y-axis has been logarithmically transformed to aid presentation. | ||
3.2 Air change rates
Fig. 5 illustrates inferred ACR across the four seasons: winter (December, January, February), spring (March, April, May), summer (June, July, August), and autumn (September, October, November). The data reveal two distinct phases: an increase in ACR during spring and summer, followed by a decline in autumn and winter. | ||
| Fig. 5 The inferred air change rates (h−1) by season. Boxplots show values in the order of (from bottom-to-top): lower outliers, 5th percentile, 25th percentile, median value, 75th percentile, 95th percentile, and upper outliers. The green diamonds indicate seasonal mean ACR. Error bars are calculated as 95% confidence intervals for the mean value using 1000 bootstrap resamples of the data. | ||
Meteorological data gathered from UK Met Office (Fig. S3(a) and (b), ESI†) shows that autumn had higher mean maximum (14.6 °C) and minimum (8.4 °C) temperatures in Bradford compared to spring (max mean 13.1 °C, min mean 5.2 °C). The gradual warming in spring, following the extended winter cold, likely heightened sensitivity to rising temperatures, prompting increased ventilation via open windows. Additionally, spring had more sunshine hours (mean 139.6 h per month) than autumn (mean 91.1 h per month), potentially leading to higher solar heating of buildings and warmer indoor temperatures, which may have contributed to the higher ACR in spring through windows and doors potentially being opened for longer.
Meteorological data for June 2023 indicated Bradford's highest mean temperature of the year (21.6 °C), while summer saw the most sunshine (mean 177 h per month). These meteorological patterns likely explain the elevated ACR observed in spring, which remained high throughout the summer as outdoor temperatures rose. The wider error bars for the mean summer ACR in Fig. 5 reflect greater variability in ACR during the summer months.
3.3 Seasonality in VOC emissions
Indoor VOC concentrations are primarily influenced by VOC emission rates, diluent room volume, and ACR. However, the observed seasonality in ACR suggested that raw indoor concentrations may not have fully captured the dynamics of indoor VOC exposure. Since VOC exposure is unique to the occupants of each sampled house, normalising concentrations by room volume and inferred ACR to calculate time-averaged VOC emission rates enables more robust comparisons across the cohort.Fig. 6 shows a comparison between the seasonal TVOC concentrations in Fig. 6(a), with Fig. 6(b) showing seasonal total VOC time-averaged emission rates. There were no patterns in indoor TVOC concentration over the seasons (Fig. 6(a)), but clear seasonality in total indoor VOC emissions (Fig. 6(b)). Seasonality for individual VOC emissions is shown in Fig. S4, ESI.† In general, time-averaged emission rates were at a minimum in winter and a maximum in summer, as seen in total time-averaged emission rates in Fig. 6(b).
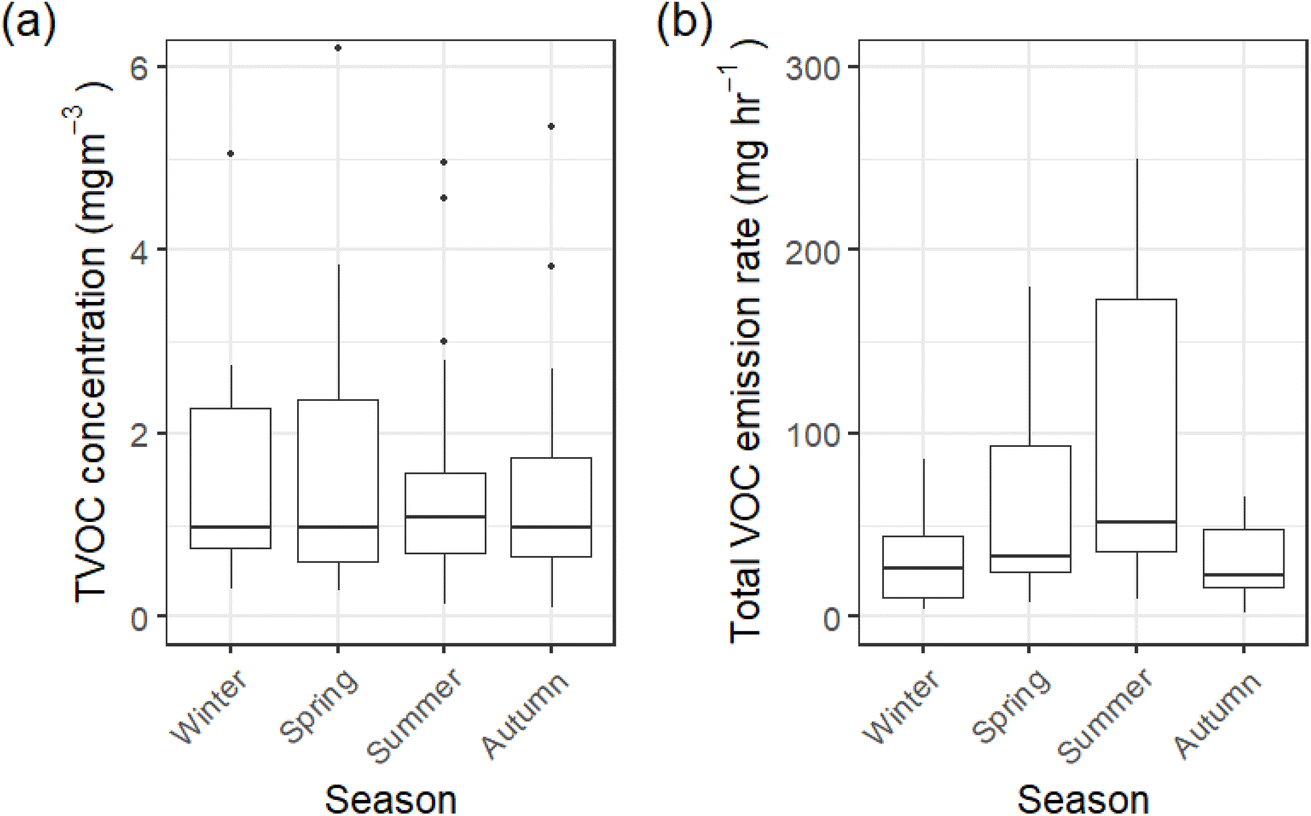 | ||
| Fig. 6 (a) Indoor TVOC concentrations by season, and (b) total indoor VOC emission rates by season. Boxplots show values in the order of (from bottom-to-top): lower outliers, 5th percentile, 25th percentile, median value, 75th percentile, 95th percentile, and upper outliers. | ||
Total monoterpene time-averaged emission rates displayed the opposite seasonality however (Fig. S4, ESI†), with a low in summer and autumn months (median 492 μg h−1 and 380 μg h−1 respectively), and a high in winter and spring months (median 731 μg h−1 and 966 μg h−1 respectively). This was most likely driven by heightened emission rates of limonene in winter months, which was the single biggest contributor to the total monoterpene time-averaged emission rate metric. The reported elevated median use of fragrance products in winter months (Fig. S5, ESI†) is a likely source of elevated limonene emission rates in winter. A similar winter-high, summer-low pattern was seen in isopropanol, indicating the potential for common emission sources. However, emission sources are complex with variable dynamics, such as building materials which have variable rates of VOC off-gassing.36,92
As with indoor concentrations, indoor time-averaged emission rates were dominated by ethanol, butane and propane (Fig. S4, ESI†). However, the seasonality in time-averaged emission rates for these species does not match with the product use patterns (ESI Fig. S5†). It is noted that in a small subset of homes (n = 13), portable space heaters were used including those using bottled gas, which could be a non-typical source of indoor butane and propane. The use of bottled gas for cooking stoves is not common in the UK and was not found in this study. We further note that product use behaviours were consolidated in the questionnaires. For example, daily usage statistics of room fragrance products, such as air fresheners, electric diffusers and candles were grouped together. As a result, the grouping of product use behaviours provided a broader overview of behaviour, rather than allowing a highly specific breakdown of each product type.
Time-averaged emission rates of ethanol were markedly higher in summer months compared to others, with the summer median time-averaged emission rate (30510 μg h−1) being more than three times the next highest median time-averaged emission rate in spring (9698 μg h−1). While inferred ACRs were higher in summer, there did not appear to be a significant seasonality in ethanol concentrations outdoors, and so higher outdoor air exchange in summer was unlikely to be the source of this trend.93
To account for single dominant time-averaged emission rates such as ethanol, propane and butane, VOC time-averaged emission rates were normalised on a scale of 0 to 1 using eqn (5), where  is the normalised time-averaged emission rate value of VOC a, Xa is the original time-averaged emission rate of VOC a (g h−1), and Xa,max and Xa,min are the maximum and minimum time-averaged emission rates of VOC a (g h−1), respectively. Normalised values were then summed together, as shown in Fig. 7 along with summed normalised monoterpene time-averaged emission rates.
 | (5) |
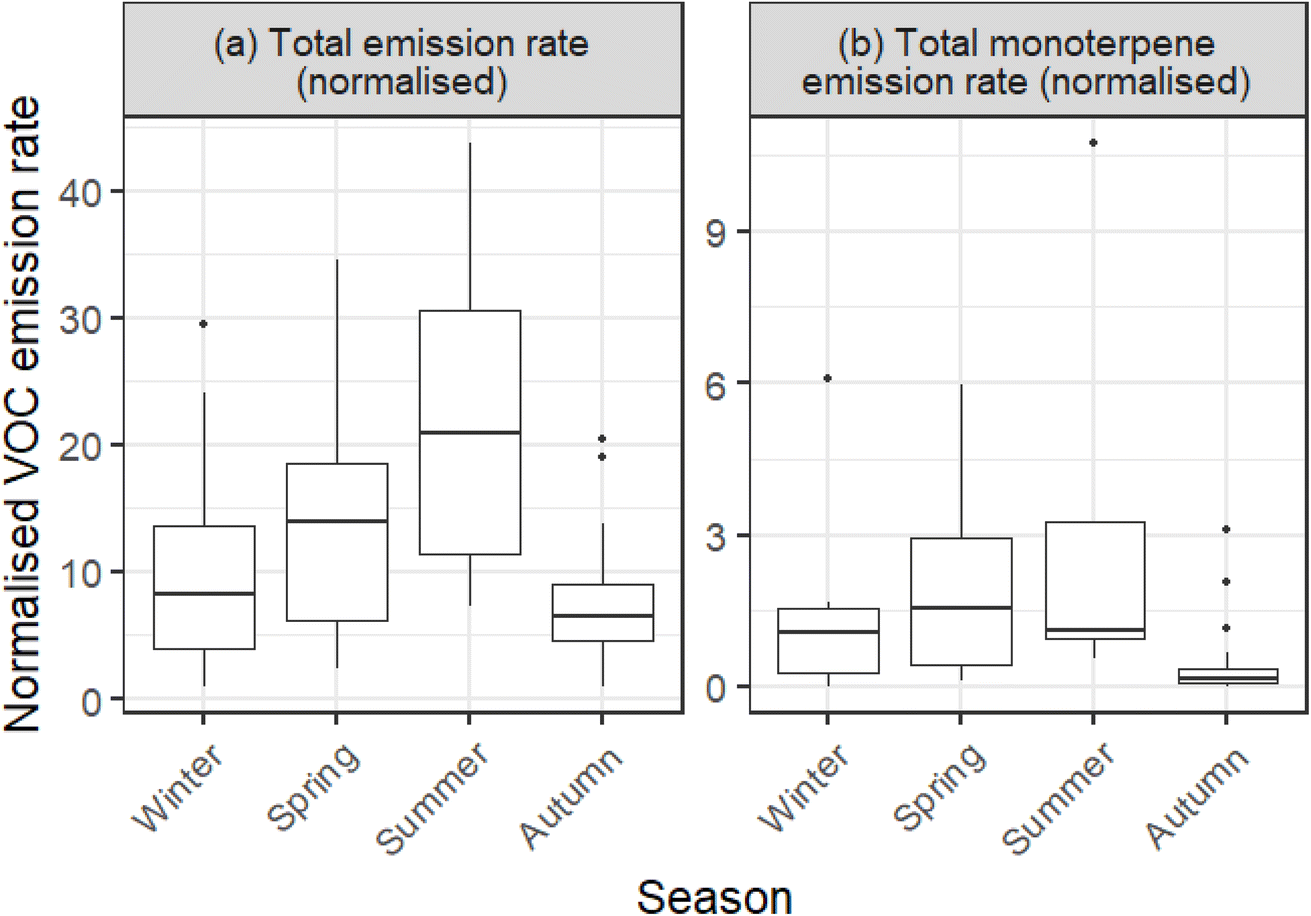 | ||
| Fig. 7 (a) Seasonality in the summed normalised total VOC emissions, and (b) the summed normalised monoterpene emissions. Boxplots show values in the order of (from bottom-to-top): lower outliers, 5th percentile, 25th percentile, median value, 75th percentile, 95th percentile, and upper outliers. | ||
Total normalised VOC time-averaged emission rates were at their highest in summer and lowest in autumn. While Kruskal–Wallis testing on the non-normalised time-averaged emission rate data set indicated no significant change in total VOC time-averaged emission rates across the seasons, significance in total normalised VOC time-averaged emission rate and total normalised monoterpene time-averaged emission rate seasonality was observed. Post hoc Dunn tests revealed significant differences between autumn – summer and autumn – spring for both total normalised time-averaged emission rates and normalised monoterpene time-averaged emission rates. p-Values for the post hoc Dunn tests are displayed as a matrix in Fig. S6, ESI.† Normalised data analysis highlighted that dominance from specific VOC emissions could potentially skew results when comparing raw time-averaged emission rates. Among the possible sources of increased time-averaged emission rates in this study, two emerged as likely causes. Firstly, during the summer months, especially in late-July and August, children are at home more due to school holidays and as such, parents are likely to be at home more too. This could result in an increase in VOC emission rates. Secondly, it has been noted in other studies that emission rates of surface-partitioned VOCs increase with an increase in temperature.17,94 Over colder months, it has been suggested that there may be a cumulative increase in surface-bound VOC concentrations, which resulted in increased off-gassing as temperatures increase in warmer seasons.
4. Conclusions
The time-integrated concentrations of >120 VOCs were measured in the main living area of 124 homes in Bradford, UK. It was found, as in other studies,3,14,95 that indoor concentrations rarely showed any associations with factors such as product use. However, evaluation and estimation of personal VOC exposure using simple indoor concentrations against LCR benchmarks showed exceedances for all measured species against the US EPA 1 in 1000000 threshold, with exceedances in >75% of homes for acetaldehyde, carbon tetrachloride and 1,3-butadiene. HQ assessment showed an exceedance above an HQ of 1 in 75% of homes for acetaldehyde, and there were measured exceedances in HQ for propanal, 1,3-butadiene, trimethylbenzenes, benzene and xylenes. While not the aim of this paper to make direct claims regarding the health prospects of the participants of this study, there was a clear pattern of elevated concentrations of VOCs that have been shown to be harmful to health.
Of particular interest is carbon tetrachloride. As an ozone-depleting substance, as well as a hepatotoxic suspected human carcinogen, the inclusion of this VOC in any product has been phased out in many countries including the UK through the Montreal Protocol. However, the variation seen in this study (min 4.83 μg m−3, max 81 μg m−3, median 15.5 μg m−3) suggests that carbon tetrachloride has at least one secondary emission source indoors, likely as an atmospheric by-product of bleach or other chlorinated-product use. Previous studies have shown that carbon tetrachloride is a measurable emission from the use of bleach or other chlorinated-product use indoors.86,87 Further investigation into indoor production of carbon tetrachloride, other halogenated hydrocarbons and other VOCs from the use of household products would therefore be warranted.44
Once the effects of short-term emissions of BTEX species from painting and decorating had been accounted for, indoor BTEX species had higher median concentrations in urban homes than in rural homes, with xylene concentrations being significantly higher in urban homes (rural median concentration 1.22 μg m−3, urban median concentration 2.35 μg m−3). Additionally, there was a generally lower I/O ratio in urban houses for BTEX species compared with rural houses, indicating generally higher concentrations of BTEX species in urban outdoor areas. Indoor concentrations appeared to be impacted by outdoor concentrations with higher indoor concentrations for BTEX seen in urban homes compared to rural.
ACR was inferred using an adjusted method from Warburton et al. (2023)14 through CO2 exchange and room diluent volume. ACR was at a high in summer with a median ACR of 1.2 h−1 and at a low in winter with a median ACR of 0.7 h−1. ACR itself was most variable in summer, and presented a study-wide range of between 0.41 h−1 and 3.05 h−1.
Once seasonal changes in inferred ACR and individual room sizes were accounted for through the calculation of time-averaged emission rates, then highest VOC time-averaged emission rates were found for the summer months. Summer had the highest median total VOC time-averaged emission rate (51950 μg h−1), while autumn had the lowest median total VOC time-averaged emission rate (22760 μg h−1), closely followed by winter (26161 μg h−1). Additionally, the variability in total VOC time-averaged emission rates rose to a maximum in summer (min 9472 μg h−1, max 249300 μg h−1). This trend could not be attributed solely to any seasonality in product use in this study. This was likely a product of increased surface-adsorbed VOCs off-gassing as ambient temperature increased, as well as increased occupancy times over the summer months with parents and children spending more time in the homes.
4.1 Limitations and strengths
In calculating LCRs and HQs for indoor VOCs, assumptions must be made regarding expected lifetimes, residential times as well as a greater assumption that the sampled concentration of VOC is indicative of the concentration an occupant will always be exposed to. By nature, these calculations must make these assumptions, and the resulting values are only meant to be regarded as indicative values and not absolute.
Within the scope of the larger INGENIOUS study, participants answered several large questionnaires gathering information on many aspects of the occupants and their home. As such, aspects of the questionnaires had to be consolidated, such as product use. The resulting groupings were therefore relatively coarse.
This study offers a comprehensive dataset of indoor VOC concentrations and time-averaged emission rates across a large sample of homes (n = 124), serving as a valuable resource for the air pollution research community. The wide range of VOC species measured provides a detailed understanding of the factors shaping indoor air quality. By incorporating seasonal and spatial analyses, this work identifies key drivers of indoor VOC exposure, such as outdoor air ingress and emission variability throughout the year.
A key strength of this study is its contribution to understanding indoor VOC dynamics. For instance, the observed increase in ACR during warmer months suggests greater ventilation-driven transport of VOCs from indoors to the immediate outdoor environment. When scaled across millions of homes, this process may represent a significant and largely unaccounted-for source of outdoor VOC pollution. Currently, most outdoor air pollution models do not adequately consider indoor VOC emissions, yet this study demonstrates that indoor spaces could play a major role in shaping outdoor VOC concentrations.
4.2 Future work
Further in-home studies should attempt to specify product use as much as possible. The realities of widely variable product formulation and composition will naturally result in assumptions having to be made when considering source apportionment of VOCs to specific groups of products, however. Future indoor air analyses should consider the effects of ACR and diluent room volume on indoor VOC concentrations. While indoor concentrations can be used to compare against benchmarks, the effects of intra-study ACR and volume variability on measured concentrations may result in difficulty in drawing conclusions from concentration data across and within studies. Compounding this with sampling and analytical differences between studies, transformation of indoor concentrations into emission rates may allow for better VOC exposure comparison between studies. Additional consideration of the potential for increased VOC-surface partitioning in colder months and increased off-gassing of surface-bound VOCs in warmer months would provide additional insight into population exposure to VOCs.Future studies should also consider the impact indoor air pollution may have on outdoor air pollution. As is evident from this study, indoor VOC concentrations can be orders of magnitude higher than outdoor concentrations, and activities such as cooking and cleaning are known to give rise to substantial VOC emissions. Indoor reactions appear capable of producing halocarbons of significance to stratospheric ozone depletion such as carbon tetrachloride, species that are not used as raw ingredients in product formulation, but may still be emitted due to unaccounted for indoor chemistry. Mitigating indoor VOC exposure by increased ventilation will directly lead to elevated outdoor VOC concentrations in the immediate surroundings of the indoor area, and the magnitude of this effect should be further studied and quantified.
Data availability
All sampled data from this study is freely available from https://doi.org/10.15124/24fd1762-0e98-4773-a74c-7dd87ef59aa8.Authors contribution
TW – methodology, investigation, visualisation, data curation, formal analysis, validation, writing-original draft, writing-review & editing. ACL – conceptualisation, methodology, writing-review & editing, funding acquisition. JFH – conceptualisation, methodology, writing-review & editing, funding acquisition. RMCM – conceptualisation, methodology, investigation, writing-review & editing, funding acquisition. TCY – methodology, investigation, writing-review & editing. JRH – methodology, writing-review & editing. SJA – methodology, writing-review & editing. NC – conceptualisation, methodology, writing-review & editing, funding acquisition.Conflicts of interest
There are no conflicts of interest to declare.Acknowledgements
We would like to acknowledge funding for the project from NERC through the following grant numbers: NE/W001993/1, NE/W002019/1, NE/W002159/1, NE/W002248/1 and NE/W002256/1. TW's PhD studentship was part-funded through grant number NE/W002256/1. Born in Bradford (BiB) receives funding from by a joint grant from the UK Medical Research Council (MRC) and UK Economic and Social Science Research Council (ESRC) [MR/N024391/1]; the British Heart Foundation [CS/16/4/32482]; a Wellcome Infrastructure Grant [WT101597MA]; The National Institute for Health Research under its Applied Research Collaboration for Yorkshire and Humber [NIHR200166]. The views expressed are those of the author(s), and not necessarily those of the NHS, the NIHR or the Department of Health and Social Care. The authors acknowledge that BiB is only possible because of the enthusiasm and commitment of the children and parents in BiB. We are grateful to all the participants, health professionals, schools and researchers who have made BiB happen.References
- A. Bergomi, C. Mangia, P. Fermo, A. Genga, V. Comite, S. Guadagnini and P. Ielpo, Outdoor trends and indoor investigations of volatile organic compounds in two high schools of southern Italy, Air Qual., Atmos. Health, 2024, 17(6), 1325–1340 CrossRef CAS.
- B. Son, P. Breysse and W. Yang, Volatile organic compounds concentrations in residential indoor and outdoor and its personal exposure in Korea, Environ. Int., 2003, 29, 79–85 CrossRef CAS PubMed.
- A. C. Heeley-Hill, S. K. Grange, M. W. Ward, A. C. Lewis, N. Owen, C. Jordan, G. Hodgson and G. Adamson, Frequency of use of household products containing VOCs and indoor atmospheric concentrations in homes, Environ. Sci.: Processes Impacts, 2021, 23, 699–713 RSC.
- T. J. Carter, D. R. Shaw, D. C. Carslaw and N. Carslaw, Indoor cooking and cleaning as a source of outdoor air pollution in urban environments, Environ. Sci.: Processes Impacts, 2024, 26(6), 975–990 RSC.
- A. M. Yeoman, M. Shaw and A. C. Lewis, Estimating person-to-person variability in VOC emissions from personal care products used during showering, Indoor Air, 2021, 31, 1281–1291 CrossRef CAS PubMed.
- E. Harding-Smith, D. R. Shaw, M. Shaw, T. J. Dillon and N. Carslaw, Does green mean clean? Volatile organic emissions from regular versus green cleaning products, Environ. Sci.: Processes Impacts, 2024, 26, 436–450 RSC.
- A. M. Yeoman and A. C. Lewis, Global emissions of VOCs from compressed aerosol products, Elementa, 2021, 9(1), 1–15 CrossRef.
- K. Kristensen, D. M. Lunderberg, Y. Liu, P. K. Misztal, Y. Tian, C. Arata, W. W. Nazaroff and A. H. Goldstein, Gas–Particle Partitioning of Semivolatile Organic Compounds in a Residence: Influence of Particles from Candles, Cooking, and Outdoors, Environ. Sci. Technol., 2023, 57, 3260–3269 CrossRef CAS PubMed.
- J. L. Mauderly and J. C. Chow, Health Effects of Organic Aerosols, Inhalation Toxicol., 2008, 20, 257–288 CrossRef CAS PubMed.
- C. M. Long, H. H. Suh, P. J. Catalano and P. Koutrakis, Using Time- and Size-Resolved Particulate Data To Quantify Indoor Penetration and Deposition Behavior, Environ. Sci. Technol., 2001, 35, 2089–2099 CrossRef CAS PubMed.
- U. Pamuk, H. A. Gürsu, S. Emeksiz, Y. Özdemir-Sahan and İ. Çetin, A rare cause of fatal cardiac arrhythmia: Inhalation of butane gas, Turk. J. Pediatr., 2018, 60, 755–756 CrossRef PubMed.
- K. Abraham, H. Mielke, W. Huisinga and U. Gundert-Remy, Elevated internal exposure of children in simulated acute inhalation of volatile organic compounds: effects of concentration and duration, Arch. Toxicol., 2005, 79, 63–73 CrossRef CAS PubMed.
- C. M. Wang, B. Barratt, N. Carslaw, A. Doutsi, R. E. Dunmore, M. W. Ward and A. C. Lewis, Unexpectedly high concentrations of monoterpenes in a study of UK homes, Environ. Sci.: Processes Impacts, 2017, 19, 528–537 RSC.
- T. Warburton, S. K. Grange, J. R. Hopkins, S. J. Andrews, A. C. Lewis, N. Owen, C. Jordan, G. Adamson and B. Xia, The impact of plug-in fragrance diffusers on residential indoor VOC concentrations, Environ. Sci.: Processes Impacts, 2023, 25, 805–817 RSC.
- C. Shrubsole, S. Dimitroulopoulou, K. Foxall, B. Gadeberg and A. Doutsi, IAQ guidelines for selected volatile organic compounds (VOCs) in the UK, Build. Sci., 2019, 165, 106382 Search PubMed.
- J. C. Ditto, L. R. Crilley, M. Lao, T. C. Vandenboer, J. P. D. Abbatt and A. W. H. Chan, Indoor and outdoor air quality impacts of cooking and cleaning emissions from a commercial kitchen, Environ. Sci.: Processes Impacts, 2023, 25, 964–979 RSC.
- H. N. Huynh, J. C. Ditto, J. Yu, M. F. Link, D. Poppendieck, D. K. Farmer, M. E. Vance and J. P. D. Abbatt, VOC emission rates from an indoor surface using a flux chamber and PTR-MS, Atmos. Environ., 2024, 338, 120817 CrossRef CAS.
- J. Yu, F. Wania and J. P. D. Abbatt, A New Approach to Characterizing the Partitioning of Volatile Organic Compounds to Cotton Fabric, Environ. Sci. Technol., 2022, 56, 3365–3374 CrossRef CAS PubMed.
- H. L. Davies, C. O'Leary, T. Dillon, D. R. Shaw, M. Shaw, A. Mehra, G. Phillips and N. Carslaw, A measurement and modelling investigation of the indoor air chemistry following cooking activities, Environ. Sci.: Processes Impacts, 2023, 25, 1532–1548 RSC.
- W. Liu, L. Zhou, W. Yuan, L. Ruan, X. Wang, Y. Guo, Z. Xie, Q. Liu and C. Wang, Tracking indoor volatile organic compounds with online mass spectrometry, TrAC, Trends Anal. Chem., 2024, 171, 117514 CrossRef CAS.
- W.-H. Cheng, Y.-C. Chen and S.-Y. Shih, Volatile Organic Compound Emissions from Indoor Fragrance Diffusers, Atmosphere, 2023, 14, 1012 CrossRef CAS.
- W. Bruchard, A. Bajracharya and N. A. C. Johnston, Volatile Organic Compound Emissions from Disinfectant Usage in the Home and Office, Environ. Health Perspect., 2023, 131, 047701 CrossRef CAS PubMed.
- F. Klein, S. M. Platt, N. J. Farren, A. Detournay, E. A. Bruns, C. Bozzetti, K. R. Daellenbach, D. Kilic, N. K. Kumar, S. M. Pieber, J. G. Slowik, B. Temime-Roussel, N. Marchand, J. F. Hamilton, U. Baltensperger, A. S. H. Prévôt and I. El Haddad, Characterization of Gas-Phase Organics Using Proton Transfer Reaction Time-of-Flight Mass Spectrometry: Cooking Emissions, Environ. Sci. Technol., 2016, 50, 1243–1250 CrossRef CAS PubMed.
- H. Zhang, X. Wang, X. Shen, X. Li, B. Wu, G. Li, H. Bai, X. Cao, X. Hao and Q. Zhou, Chemical characterization of volatile organic compounds (VOCs) emitted from multiple cooking cuisines and purification efficiency assessments, J. Environ. Sci., 2023, 130, 163–173 CrossRef CAS PubMed.
- S. Park, N. Kagi, W. Umishio, K. Hasegawa, T. Mitamura and J. Tamura, VOC concentrations in houses in Japan: correlations with housing characteristics and types of ventilation, J. Asian Archit. Build. Eng, 2024, 1–17, DOI:10.1080/13467581.2024.2325463.
- A. T. Hodgson, D. Faulkner, D. P. Sullivan, D. L. Dibartolomeo, M. L. Russell and W. J. Fisk, Effect of outside air ventilation rate on volatile organic compound concentrations in a call center, Atmos. Environ., 2003, 37, 5517–5527 CrossRef CAS.
- W. J. Fisk and D. Faulkner, Air exchange effectiveness in office buildings: measurement techniques and results, presented in part at International Symposium on Room Air Convection and Ventilation Effectiveness, Tokyo, 1992 Search PubMed.
- M. S. Breen, B. D. Schultz, M. D. Sohn, T. Long, J. Langstaff, R. Williams, K. Isaacs, Q. Y. Meng, C. Stallings and L. Smith, A review of air exchange rate models for air pollution exposure assessments, J. Exposure Sci. Environ. Epidemiol., 2014, 24, 555–563 CrossRef CAS PubMed.
- A. Rackes and M. S. Waring, Do time-averaged, whole-building, effective volatile organic compound (VOC) emissions depend on the air exchange rate? A statistical analysis of trends for 46 VOCs in U.S. offices, Indoor Air, 2016, 26, 642–659 CrossRef CAS PubMed.
- L. Du, S. Batterman, C. Godwin, Z. Rowe and J. Y. Chin, Air exchange rates and migration of VOCs in basements and residences, Indoor Air, 2015, 25, 598–609 CrossRef CAS PubMed.
- D. Thickett, F. David and N. Luxford, Air exchange rate - the dominant parameter for preventive conservation?, The Conservator, 2005, 29, 19–34 CrossRef.
- N. Carslaw, A new detailed chemical model for indoor air pollution, Atmos. Environ., 2007, 41, 1164–1179 CrossRef CAS.
- M. T. R. Hill, C. Dimitroulopoulou, M. R. Ashmore and K. Batty, Measurement and Modelling of Short-Term Variations in Particle Concentrations in UK Homes, Indoor Built Environ., 2002, 10, 132–137 CrossRef.
- C. Zhou, Y. Zhan, S. Chen, M. Xia, C. Ronda, M. Sun, H. Chen and X. Shen, Combined effects of temperature and humidity on indoor VOCs pollution: Intercity comparison, Build. Sci., 2017, 121, 26–34 Search PubMed.
- Y. Zhu, S. Guo and W. Liang, A literature review investigating the impact of temperature and humidity on volatile organic compound emissions from building materials, Build. Sci., 2024, 262, 111845 Search PubMed.
- S. B. Holøs, A. Yang, M. Lind, K. Thunshelle, P. Schild and M. Mysen, VOC emission rates in newly built and renovated buildings, and the influence of ventilation – a review and meta-analysis, Int. J. Vent, 2019, 18, 153–166 Search PubMed.
- J. Xu, M. Szyszkowicz, B. Jovic, S. Cakmak, C. C. Austin and J. Zhu, Estimation of indoor and outdoor ratios of selected volatile organic compounds in Canada, Atmos. Environ., 2016, 141, 523–531 CrossRef CAS.
- R. D. Edwards, J. Jurvelin, K. Saarela and M. Jantunen, VOC concentrations measured in personal samples and residential indoor, outdoor and workplace microenvironments in EXPOLIS-Helsinki, Finland, Atmos. Environ., 2001, 35, 4531–4543 CrossRef CAS.
- N. Carslaw and D. Shaw, Secondary product creation potential (SPCP): a metric for assessing the potential impact of indoor air pollution on human health, Environ. Sci.: Processes Impacts, 2019, 21, 1313–1322 RSC.
- A. Lee, A. H. Goldstein, M. D. Keywood, S. Gao, V. Varutbangkul, R. Bahreini, N. L. Ng, R. C. Flagan and J. H. Seinfeld, Gas-phase products and secondary aerosol yields from the ozonolysis of ten different terpenes, J. Geophys. Res.:Atmos., 2006, 111(D7), 1–18 CrossRef.
- A. Lee, A. H. Goldstein, J. H. Kroll, N. L. Ng, V. Varutbangkul, R. C. Flagan and J. H. Seinfeld, Gas-phase products and secondary aerosol yields from the photooxidation of 16 different terpenes, J. Geophys. Res.:Atmos., 2006, 111(D17), 1–25 CrossRef.
- P. H. Chowdhury, Q. He, T. Lasitza Male, W. H. Brune, Y. Rudich and M. Pardo, Exposure of Lung Epithelial Cells to Photochemically Aged Secondary Organic Aerosol Shows Increased Toxic Effects, Environ. Sci. Technol. Lett., 2018, 5, 424–430 CrossRef CAS.
- U. Baltensperger, J. Dommen, M. R. Alfarra, J. Duplissy, K. Gaeggeler, A. Metzger, M. C. Facchini, S. Decesari, E. Finessi and C. Reinnig, Combined determination of the chemical composition and of health effects of secondary organic aerosols: The POLYSOA project, J. Aerosol Med. Pulm. Drug Delivery, 2008, 21, 145–154 CrossRef CAS PubMed.
- N. Carslaw, J. Aghaji, S. H. Budisulistiorini, D. C. Carslaw, L. Chatzidiakou, R. W. Cheung, T. J. Dillon, P. Edwards, D. Genes, C. Giorio, J. F. Hamilton, E. Ikeda, R. L. Jones, J. Lee, A. C. Lewis, A. Kumar, R. McEachan, G. McFiggans, T. Murrels, N. Pleace, A. Ruangkanit, Y. Shao, S. P. O'Meara, D. R. Shaw, M. Shaw, D. Waiblinger, T. Warburton, S. West, C. Wood and T. Yang, The INGENIOUS project: towards understanding air pollution in homes, Environ. Sci.: Processes Impacts, 2025, 27, 355–372 RSC.
- C. o. B. M. D. Council, Population | Understanding Bradford District, https://ubd.bradford.gov.uk/about-us/population/, (accessed December 03, 2024).
- T. F. Mebrahtu, G. Santorelli, T. C. Yang, J. E. Tate, S. Jones, J. Wright, R. R. C. McEachan, L. Bojke, M. Bryant, S. Islam, J. McQuaid, K. Pickett, K. Pringle and S. Walker, Impact of an urban city-wide Bradford clean air plan on health service use and nitrogen dioxide 24 months after implementation: An interrupted time series analysis, Environ. Res., 2025, 270, 120988 CrossRef CAS PubMed.
- R. B. Ellison, S. Greaves and D. A. Hensher, Five years of London’s low emission zone: effects on vehicle fleet composition and air quality, Transp. Res. D, 2013, 23, 25–33 CrossRef.
- H. Hajmohammadi and B. Heydecker, Evaluation of air quality effects of the London ultra-low emission zone by state-space modelling, Atmos. Pollut. Res., 2022, 13, 101514 CrossRef CAS.
- L. Jinghua, Regional Specialization and Urban Development in England during the Industrial Revolution, Soc. Sci. China, 2018, 39, 199–216 CrossRef.
- R. Rowthorn, Combined and Uneven Development: Reflections on the North–South Divide, Spat. Econ. Anal., 2010, 5, 363–388 CrossRef.
- D. Walsh, M. Taulbut and P. Hanlon, The aftershock of deindustrialization—trends in mortality in Scotland and other parts of post-industrial Europe, Cent. Eur. J. Public Health, 2009, 20, 58–64 CrossRef PubMed.
- L. Telford, ‘There is nothing there’: Deindustrialization and loss in a coastal town, Compet. Change, 2022, 26, 197–214 CrossRef.
- H. Ramadan, C. Patterson, S. Maguire, I. Melvin, K. Kain, E. Teale and A. Forster, Incidence of first stroke and ethnic differences in stroke pattern in Bradford, UK: Bradford Stroke Study, Int. J. Stroke, 2018, 13, 374–378 CrossRef PubMed.
- A. Elhakeem, G. L. Clayton, A. G. Soares, K. Taylor, L. Maitre, G. Santorelli, J. Wright, D. A. Lawlor and M. Vrijheid, OP125 Socioeconomic differences in pregnancy metabolic profiles: evidence from the multi-ethnic Born in Bradford cohort study, Journal of Epidemiology and Community Health, 2023, 77, A122–A123 Search PubMed.
- D. Buck and D. Maguire, Inequalities in life expectancy, Changes over Time and Implications for Policy. London: The King’s Fund, 2015 Search PubMed.
- M. Warburton, M. L. Wood, K. Sohal, J. Wright, M. Mon-Williams and A. L. Atkinson, Risk of not being in employment, education or training (NEET) in late adolescence is signalled by school readiness measures at 4–5 years, BMC Public Health, 2024, 24(1375), 1–10 Search PubMed.
- C. O. B. M. D. Council, Ethnicity and religion | Understanding Bradford District, https://ubd.bradford.gov.uk/about-us/ethnicity-and-religion/, (accessed December 03, 2024).
- N. R. Gray, A. C. Lewis and S. J. Moller, Deprivation based inequality in NOx emissions in England, Environ. Sci.:Adv., 2023, 2, 1261–1272 CAS.
- H. Brunt, J. Barnes, S. J. Jones, J. W. S. Longhurst, G. Scally and E. Hayes, Air pollution, deprivation and health: understanding relationships to add value to local air quality management policy and practice in Wales, UK, J. Public Health, 2016, 39, 485–497 Search PubMed.
- S. Morrison, F. M. Fordyce and E. M. Scott, An initial assessment of spatial relationships between respiratory cases, soil metal content, air quality and deprivation indicators in Glasgow, Scotland, UK: relevance to the environmental justice agenda, Environ. Geochem. Health, 2014, 36, 319–332 CrossRef CAS PubMed.
- A. Namdeo and C. Stringer, Investigating the relationship between air pollution, health and social deprivation in Leeds, UK, Environ. Int., 2008, 34, 585–591 CrossRef CAS PubMed.
- F. United Kingdom Department for Environment, and Rural Affairs, Automatic Urban and Rural Network (AURN) - Defra, UK, https://uk-air.defra.gov.uk/networks/network-info?view=aurn, (accessed October 29, 2024).
- E. Ikeda, J. Hamilton, C. Wood, L. Chatzidiakou, T. Warburton, A. Ruangkanit, Y. Shao, D. Genes, D. Waiblinger, T. C. Yang, C. Giorio, G. McFiggans, S. P. O'Meara, P. Edwards, E. Bates, D. R. Shaw, R. L. Jones, N. Carslaw and R. McEachan, Understanding the patterns and health impact of indoor air pollutant exposures in Bradford, UK: a study protocol, BMJ Open, 2023, 13, e081099 CrossRef PubMed.
- R. R. C. McEachan, G. Santorelli, A. Watmuff, D. Mason, S. E. Barber, D. D. Bingham, P. K. Bird, L. Lennon, D. Lewer, M. Mon-Williams, K. A. Shire, D. Waiblinger, J. West, T. C. Yang, D. A. Lawlor, K. E. Pickett and J. Wright, Cohort Profile Update: Born in Bradford, Int. J. Epidemiol., 2024, 53(2), dyae037 CrossRef PubMed.
- S. Cui, M. Cohen, P. Stabat and D. Marchio, CO2 tracer gas concentration decay method for measuring air change rate, Build. Sci., 2015, 84, 162–169 Search PubMed.
- R. Claude-Alain and F. Foradini, Simple and Cheap Air Change Rate Measurement Using CO2Concentration Decays, Int. J. Vent, 2002, 1, 39–44 Search PubMed.
- I. Khajehzadeh and B. Vale, presented in part at The 49th International Conference of the Architectural Science Association, Melbourne, 2015 Search PubMed.
- I. Khajehzadeh, B. Vale and N. Isaacs, Time-use in different rooms of selected New Zealand houses and the influence of plan layout, Indoor Built Environ., 2018, 27, 19–33 CrossRef.
- S. Batterman, Review and Extension of CO2-Based Methods to Determine Ventilation Rates with Application to School Classrooms, Int. J. Environ. Res. Public Health, 2017, 14, 145 CrossRef PubMed.
- A. Manuja, J. Ritchie, K. Buch, Y. Wu, C. M. A. Eichler, J. C. Little and L. C. Marr, Total surface area in indoor environments, Environ. Sci.: Processes Impacts, 2019, 21, 1384–1392 RSC.
- A. Persily and L. De Jonge, Carbon dioxide generation rates for building occupants, Indoor Air, 2017, 27, 868–879 CrossRef CAS PubMed.
- S. K. Lim, H. S. Shin, K. S. Yoon, S. J. Kwack, Y. M. Um, J. H. Hyeon, H. M. Kwak, J. Y. Kim, T. H. Kim, Y. J. Kim, T. H. Roh, D. S. Lim, M. K. Shin, S. M. Choi, H. S. Kim and B.-M. Lee, Risk Assessment of Volatile Organic Compounds Benzene, Toluene, Ethylbenzene, and Xylene (BTEX) in Consumer Products, J. Toxicol. Environ. Health, Part A, 2014, 77, 1502–1521 CrossRef CAS PubMed.
- B. Iglewicz and D. C. Hoaglin, in How to Detect and Handle Outliers, ed. E. F. Mykytka, American Society for Quality Control, Wisconsin, USA, 1993 Search PubMed.
- G. Sarwar, R. Corsi, Y. Kimura, D. Allen and C. J. Weschler, Hydroxyl radicals in indoor environments, Atmos. Environ., 2002, 36, 3973–3988 CrossRef CAS.
- United States Environmental Protection Agency, Basic Information about the Integrated Risk Information Systemhttps://www.epa.gov/iris/basic-information-about-integrated-risk-information-system, (accessed June 28, 2024).
- U. S. E. P. Agency, IRIS Assessments, https://iris.epa.gov/AtoZ/?list_type=alpha, (accessed October 26, 2024).
- Agency for Toxic Substances and Disease Registry, Guidance for Inhalation Exposures, https://www.atsdr.cdc.gov/pha-guidance/resources/ATSDR-EDG-Inhalation-508.pdf, (accessed June 28, 2024).
- Office for National Statistics, Average hours worked and economic growth, UK: 1998 to 2022https://www.ons.gov.uk/economy/grossdomesticproductgdp/articles/averagehoursworkedandeconomicgrowth/2024-01-22, (accessed June 28, 2024).
- X. Tang, P. K. Misztal, W. W. Nazaroff and A. H. Goldstein, Volatile Organic Compound Emissions from Humans Indoors, Environ. Sci. Technol., 2016, 50, 12686–12694 CrossRef CAS PubMed.
- A. M. Yeoman, A. C. Heeley-Hill, M. Shaw, S. J. Andrews and A. C. Lewis, Inhalation of VOCs from facial moisturizers and the influence of dose proximity, Indoor Air, 2022, 32(1), 1–12 CrossRef PubMed.
- R. Liu, D. L. Bohac, L. A. Gundel, M. J. Hewett, M. G. Apte and S. K. Hammond, Assessment of risk for asthma initiation and cancer and heart disease deaths among patrons and servers due to secondhand smoke exposure in restaurants and bars, Tob. Control., 2014, 23, 332–338 CrossRef PubMed.
- N. Ramírez, M. Z. Özel, A. C. Lewis, R. M. Marcé, F. Borrull and J. F. Hamilton, Exposure to nitrosamines in thirdhand tobacco smoke increases cancer risk in non-smokers, Environ. Int., 2014, 71, 139–147 CrossRef PubMed.
- S. N. Sax, D. H. Bennett, S. N. Chillrud, J. Ross, P. L. Kinney and J. D. Spengler, A Cancer Risk Assessment of Inner-City Teenagers Living in New York City and Los Angeles, Environ. Health Perspect., 2006, 114, 1558–1566 CrossRef CAS PubMed.
- H. Guo, S. C. Lee, L. Y. Chan and W. M. Li, Risk assessment of exposure to volatile organic compounds in different indoor environments, Environ. Res., 2004, 94, 57–66 CrossRef CAS PubMed.
- N. J. Farren, N. Ramírez, J. D. Lee, E. Finessi, A. C. Lewis and J. F. Hamilton, Estimated Exposure Risks from Carcinogenic Nitrosamines in Urban Airborne Particulate Matter, Environ. Sci. Technol., 2015, 49, 9648–9656 CrossRef CAS PubMed.
- M. Odabasi, Halogenated Volatile Organic Compounds from the Use of Chlorine-Bleach-Containing Household Products, Environ. Sci. Technol., 2008, 42, 1445–1451 CrossRef CAS PubMed.
- M. Odabasi, T. Elbir, Y. Dumanoglu and S. C. Sofuoglu, Halogenated volatile organic compounds in chlorine-bleach-containing household products and implications for their use, Atmos. Environ., 2014, 92, 376–383 CrossRef CAS.
- T. Salthammer, Acetaldehyde in the indoor environment, Environ. Sci.: Atmos., 2023, 3, 474–493 CAS.
- W. Liu, J. Zhang, L. Zhang, B. J. Turpin, C. P. Weisel, M. T. Morandi, T. H. Stock, S. Colome and L. R. Korn, Estimating contributions of indoor and outdoor sources to indoor carbonyl concentrations in three urban areas of the United States, Atmos. Environ., 2006, 40, 2202–2214 CrossRef CAS.
- P. Gustafson, L. Barregard, B. Strandberg and G. Sällsten, The impact of domestic wood burning on personal, indoor and outdoor levels of 1,3-butadiene, benzene, formaldehyde and acetaldehyde, J. Environ. Monit., 2007, 9, 23–32 RSC.
- L. N. Huy, S. C. Lee and Z. Zhang, Human cancer risk estimation for 1,3-butadiene: An assessment of personal exposure and different microenvironments, Sci. Total Environ., 2018, 616–617, 1599–1611 CrossRef CAS PubMed.
- A. Hodgson, A. Rudd, D. Beal and S. Chandra, Volatile organic compound concentrations and emission rates in new manufactured and site-built houses, Indoor Air, 2000, 10, 178–192 CrossRef CAS PubMed.
- R. E. Dunmore, L. K. Whalley, T. Sherwen, M. J. Evans, D. E. Heard, J. R. Hopkins, J. D. Lee, A. C. Lewis, R. T. Lidster, A. R. Rickard and J. F. Hamilton, Atmospheric ethanol in London and the potential impacts of future fuel formulations, Faraday Discuss., 2016, 189, 105–120 RSC.
- T. Braish, L. Tinel, L. Depelchin, V. Gaudion, Y. Andres, C. Caudron, E. Antczak, F. Brachelet and N. Locoge, Evaluation of the seasonal variation of VOC surface emissions and indoor air concentrations in a public building with bio-based insulation, Build. Sci., 2023, 238, 110312 Search PubMed.
- R. E. Dodson, J. I. Levy, E. A. Houseman, J. D. Spengler and D. H. Bennett, Evaluating methods for predicting indoor residential volatile organic compound concentration distributions, J. Exposure Sci. Environ. Epidemiol., 2009, 19, 682–693 CrossRef CAS PubMed.
Footnote |
| † Electronic supplementary information (ESI) available. See DOI: https://doi.org/10.1039/d4em00756e |
| This journal is © The Royal Society of Chemistry 2025 |