
 Open Access Article
 This Open Access Article is licensed under a
 Creative Commons Attribution 3.0 Unported Licence
Highly efficient electrogenerated chemiluminescence of an oligofluorene-truxene star-shaped compound incorporating 2,1,3-benzothiadiazole units†
Zahera
Mohsan
a,
Alexander L.
Kanibolotsky
ab,
Alasdair J.
Stewart
a,
Anto Regis
Inigo
a,
Lynn
Dennany
*a and
Peter J.
Skabara
*a
aWestCHEM, Department of Pure and Applied Chemistry, University of Strathclyde, Glasgow, G1 1XL, UK. E-mail: peter.skabara@strath.ac.uk; lynn.dennany@strath.ac.uk
bInstitute of Physical-Organic Chemistry and Coal Chemistry, 83114 Donetsk, Ukraine
First published on 5th December 2014
Abstract
The incorporation of 2,1,3-benzothiadiazole units within the arms of a trigonal quarterfluorene–truxene star-shaped system leads to a monodisperse material with stable multi-electron p- and n-doped states and highly efficient yellow electrogenerated chemiluminescence (ECL). The quantum yield for ECL is 7 times greater than that of the common blue ECL emitter 9,10-diphenylanthracene (DPA).
Electrogenerated chemiluminescence (ECL) involves a unique type of electron transfer that generates excited states, namely by the reaction of radical ions.1 When these excited states relax to a lower-level state, the emission of a photon is detected at a particular wavelength which is determined by the energy gap between the two states.2 An ECL response by the ion annihilation pathway is achieved only if the compound being investigated is able to electrochemically produce a sufficient amount of stable radical cations and anions.3 The produced radical ions are annihilated by the oppositely charged radical ions to generate the excited state of the compound, and depending on the energy available in an ion annihilation, the generated excited state can either be the singlet state species (energy sufficient system) or populate the triplet state species (energy deficient system).1 Another way to achieve an ECL response is by the co-reactant pathway,4 which requires the addition of a strong oxidizing or strong reducing agent that reacts with the intermediate, to generate ECL. Usually this method is employed if cations or anions of the compound are unstable or if there is a limitation of the potential window. The use of the co-reactant pathway has also been utilised for many sensor applications, in basic terms, by detecting the presence of the co-reactant.5–7 Over the conventional phenomenon of chemiluminescence, ECL is a remarkable, versatile, highly sensitive and selective technique that has emerged in various research fields.4,8,9 Particularly fascinating ECL properties have been discovered for various conjugated oligomers with fluorene derivatives as emitters.1
Oligofluorene-truxene trigonal systems T1–T4 (Fig. 1, x = m = 0, n = 1–4) are a fascinating class of the efficient blue emitters with a virtually “no core” star-shaped structure.10,11 The 2-D architecture of these molecules provides excellent film-forming properties upon solution processing, giving an amorphous morphology of the film and a high PLQY in the solid phase. Being trapped in an isotropic amorphous state with glass-transition temperatures above 100 °C, the T4 and T3 members of the series prove to be efficient optically pumped lasing media with low lasing thresholds12 and wide emission wavelength tunability.13 The C3 symmetry of these star-shaped molecules provides an interesting example of electronic communication between the arms in the excited state.14
 | ||
| Fig. 1 Structure of DPA and the generic structure of truxene-quarterfluorenes (Tn) and T4BT series; x = 1, n = 1, m = 3 for T4BT-B. | ||
The OLED application of the star-shaped systems is also considered to be promising.15 ECL studies of monodisperse oligofluorene-truxenes T1–T4 have been reported previously.16 Within this series, T4 demonstrated an ECL efficiency of 80% of the common standard 9,10-diphenylanthracene (DPA). The compound in this study differs from the original T4 structure, in that there are additional 2,1,3-benzothiadazole (BT) units inserted in the middle of each of the oligofluorene arms. We note here that BT-containing conjugated linear17–19 and polymer20 materials have been studied previously for their ECL properties. For our choice of star-shaped BT-containing material for ECL studies, we excluded T4BT-E due to the comparatively low PLQY of this compound.21 The quantum yields for all other members are essentially the same within the error of the experiment, so we would not expect any significant differences in ECL efficiencies for T4BT-A–T4BT-D members. Besides, the choice of T4BT-B was based on the position of the BT unit which provides better isolation of both the LUMO and HOMO within the arms, leading to true multi-electron electrochemical behaviour.
The locations of the BT units have a fundamental influence on the optical characteristics of the compound and a series of isomers has been synthesised and studied, in which the BT units are incorporated at each of 5 possible positions in the structure (see Fig. 1).21
We report here for the first time the electrochemical, spectroelectrochemical and photophysical characterisation as well as the ECL of a compound (T4BT-B) from the T4BT series shown in Fig. 1.
The synthesis of T4BT-B has been described in our previous paper.21 All cyclic voltammetry (CV) and ECL studies were carried out in a mixture of acetonitrile (50%): benzene (33%): toluene (17%) in order to have conditions similar to those used for the ECL quantum yield determination of DPA.22 For comparison the results of CV measurements in dichloromethane (CH2Cl2) are reported in the ESI (Table S1, Fig. S1†).
The CV studies of T4BT-B carried out in acetonitrile (50%): benzene (33%): toluene (17%), at a scan rate of 0.1 V s−1, showed three oxidation waves (Fig. 2). The first oxidation wave at ∼+0.81 V is reversible and is followed by two quasi-reversible waves. Reduction of T4BT-B shows a single reversible wave centered at −1.85 V vs. Fc/Fc+. All anodic and cathodic peak potentials, Epa, Epc, are highlighted in Table 1. The cyclic voltammograms of T4BT-B and DPA in CH2Cl2 are very similar to those in the mixture of acetonitrile (50%): benzene (33%): toluene (17%) and they are presented in the ESI section (Fig. S1 and Table S1†).
 | ||
| Fig. 2 Solution-state cyclic voltammograms of DPA (dashed line) and T4BT-B (solid line). Experimental conditions: scan rate 0.1 V s−1, solvent acetonitrile (50%), benzene (33%), toluene (17%), supporting electrolyte 0.1 M tetrabutylammonium hexafluorophosphate ((TBA)PF6), 2 mm platinum disc working electrode. We have annotated the positions of the potentials between which the ion annihilation ECL experiments were performed. | ||
| Oxidation peaks (V vs. Fc/Fc+) | HOMOb eV | Reduction peaks (V vs. Fc/Fc+) | LUMOb eV | Diffusion coefficientcD (cm2 s−1) | ||||
|---|---|---|---|---|---|---|---|---|
| First oxidation peak | Second oxidation peak | Third oxidation peak | First reduction peak | |||||
| a All electrochemical measurements were performed with a 2 mm Pt disc electrode in a mixture of acetonitrile (50%): benzene (33%): toluene (17%). The system was purged with argon for 15 minutes prior to taking measurements. Epa is the anodic peak potential, Epc is the cathodic peak potential and n is the number of electrons involved in the electron transfer. b HOMO and LUMO levels are calculated from the E1/2 of the first peak of the corresponding redox wave and referenced to ferrocene. c The active area of the electrode, which was used for diffusion coefficient calculations, was estimated by calibration with Fc in acetonitrile and assuming DFc = 2.28 × 10⁻⁵ cm2 s−1.25 (see ESI, Fig. S2). | ||||||||
| T4BT-B | E pa | +0.85 | +0.96 | +1.10 | 5.6 | −1.82 | 2.95 | — |
| E pc | +0.76 | +0.89 | +1.01 | — | −1.89 | — | 2.78 × 10⁻⁶ | |
| n | — | — | — | — | 3 | — | — | |
| DPA | E pa | +0.84 | — | — | 5.6 | −2.36 | 2.4 | 2.99 × 10⁻⁵ |
| E pc | +0.78 | — | — | — | −2.42 | — | — | |
| n | 1 | — | — | — | 1 | — | — | |
The diffusion coefficient, D, of T4BT-B was determined using the cathodic peak of the reduction wave by plotting the peak current (ip) versus the square root of the scan rate (ν1/2) (see ESI Fig. S2†) and applying the Randles–Sevcik equation:23,24

It was shown previously21 that the LUMO in molecules of the T4BT series were localised mostly on the BT units. Therefore, the interactions between anion radicals sites on different arms of the molecule is expected to be minimal which allows the reduction of different arms to be at the same potential. On the basis of this argument, the number of electrons n is assumed to be 3 for the single reduction wave of T4BT-B. A similar situation was observed for 2- and 4-fold anthracene functionalised bimesitylenes that showed 2- and 4-electron transfer for both reduction and oxidation waves.26 The value of the diffusion coefficient (Table 1) estimated for this value of n was found to be within the range of the D values reported for the parent T3 and T4 compounds.16 The three successive one-electron reduction steps with close values of reduction potential are assumed, so using Randels–Sevcik equation with n = 3 gives the lowest estimate for the value of D.
Star-shaped oligofluorenes with truxene cores (T1–T4) are known to be efficient blue fluorescent emitters in the solution state.10,27 The absorption and emission spectra of T4BT-B (Fig. 3) were taken in the same solvent used for electrochemical experiments. The corresponding spectra of DPA are shown in Fig. S3.† The absorption-emission data are summarised in Table 2. In contrast to the parent compound T4, which exhibited blue fluorescence and ECL, the luminescence of T4BT-B was observed in the green/yellow region of the spectrum, which is attributed to the presence of the BT units.21 The corresponding spectra in CH2Cl2 are very similar and are presented in Fig. S4.†
 | ||
| Fig. 3 Absorption (blue), normalised PL (red) and ECL (green and black for smoothed spectrum) spectra of T4BT-B in a mixture of acetonitrile (50%): benzene (33%): toluene (17%). The concentration of the sample for absorption is 8.4 × 10⁻⁷ M. | ||
| Emission, λmax (nm) | Absorption, λmax (nm) | Optical HOMO–LUMO gap, Eg (eV) | Electrochemical HOMO–LUMO gap (eV) | ECL, λmax (nm) | ECL efficiencya, ϕECL (%) | |
|---|---|---|---|---|---|---|
| a The ECL efficiency of DPA was obtained from the literature.16 | ||||||
| T4BT-B | 545 | 357, 423 | 2.54 | 2.52 | 566 | 19.3 |
| DPA | 412, 429 | 339, 355 | 2.99 | 3.04 | 430 | 2.8 |
| — | 374, 394 | — | — | — | — | |
The ion annihilation ECL was generated by continually pulsing the Pt working electrode between the positive E+ (+1.19 V for T4BT-B and +1.45 V for DPA vs. Ag wire pseudo-reference) and negative E− (−1.85 V for T4BT-B and −2.25 V for DPA vs. Ag wire pseudo-reference) potentials with a pulse width of 0.1 s and under the same conditions as those used for the electrochemical studies.
The positions of the step potential are shown in Fig. 2. In the case of T4BT-B, the oxidation CV comprises 3 closely positioned waves. In order to avoid the formation of deeply oxidised species (i.e. dication or higher), which can change the distribution between peak intensities on the anodic and cathodic pulses of ECL transients,17 the potential of the positive pulse was chosen very close to the first oxidation wave (∼50 mV higher than its anodic peak potential). In the case of DPA the E+ potential was ∼250 mV higher than the anodic peak potential of its oxidation wave. Both for DPA and for T4BT-B the E− potential was ∼240 mV more negative than the cathodic peak potential of the reduction wave. The ECL emission of T4BT-B was easily observed with the naked eye in ambient conditions and is shown in the ESI section (Fig. S5†). An ECL spectrum of T4BT-B was taken with a charge-coupled device (CCD) camera and is shown in Fig. 3. The ECL maximum at around 566 nm was red-shifted compared to that of the fluorescence spectrum (λmax = 545 nm). This shift of the ECL maximum in comparison to the fluorescence spectrum is due to the multiple sequences of reabsorption/re-emission processes in a more concentrated solution used for ECL studies.22 A similar red shift of ECL, compared to fluorescence, was observed in the case of a ruthenium-containing polymer immobilised on the surface of an electrode.28 It is interesting to note that in CH2Cl2 (Fig. S4†) the bathochromic shift of the ECL peak (λmax = 560 nm) compared to the emission maximum of the PL spectrum (λmax = 551 nm) is not so pronounced. The more substantial shift of the ECL peak in acetonitrile (50%): benzene (33%): toluene (17%) mixture is attributed to the higher degree of self-absorption in this solvent system due to a greater overlap between absorption and emission profiles. The ECL spectra for DPA are shown in the ESI section† for solutions in both CH2Cl2 (Fig. S4,† top panel) and the mixture of acetonitrile (50%): benzene (33%): toluene (17%) (Fig. S3†). The latter solvent system was used for a comparison of the T4BT-B ECL efficiency with that of DPA. The results are summarised in Table 2.
The ECL intensity – time behaviour was monitored by a photomultiplier tube (PMT) within a time interval of 32 s (160 cycles). The transient of DPA ECL comprises only peaks from cathodic pulses, which can be due to the unstable nature of the DPA anion-radical. The change in the peak intensity with time is shown in the ESI section (Fig. S6†). The ECL behaviour of T4BT-B is much more interesting. Fig. 4 presents different time intervals for one of the ECL intensity–time experiments. At the beginning of an ECL transient both anodic and cathodic cycles reveal ECL peaks with growing intensity. The intensity of the peaks on anodic cycles are higher, reaching a maximum at ∼1 s (Fig. 4a) and decreasing after that. At ∼2.8 s the peak values of the PMT response on cathodic and anodic cycles become equal (Fig. 4b). At ∼10 s ECL intensity on the cathodic cycles becomes dominant and reaches its maximum (Fig. 4c). After this it subsides until the end of the experiment up to 66% from its maximum value. The ECL response at anodic cycles almost disappears after 20 s. The dynamics of the change in values for peak maxima of ECL transients for T4BT-B and DPA are shown in Fig. S6.†
 | ||
| Fig. 4 Transient of annihilation ECL (red-solid line) and charge–discharge current (blue-dashed line) of T4BT-B. | ||
The ECL of T4BT-B decreased notably after 100 s of pulsing, perhaps due to the deposition of T4BT-B on the working electrode. However, upon cleaning the Pt electrode and purging the system with argon, the ECL emission was restored. The relative ECL efficiency of T4BT-B (ϕT4BTB) was obtained by using the following equations:22,29
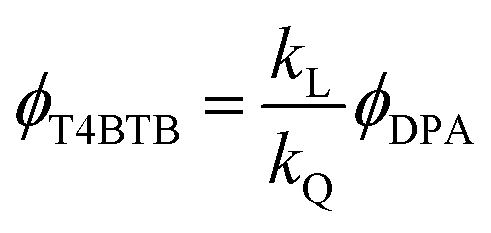


where kL is the ratio of photons produced upon ion annihilation during ECL of T4BT-B and DPA, kQ is the ratio of the number of electrochemical events that produced anion-radicals for T4BT-B and DPA, ϕDPA is the ECL efficiency of DPA, IT4BTB(DPA)(t) is a PMT current response upon ion annihilation ECL of T4BT-B (DPA),
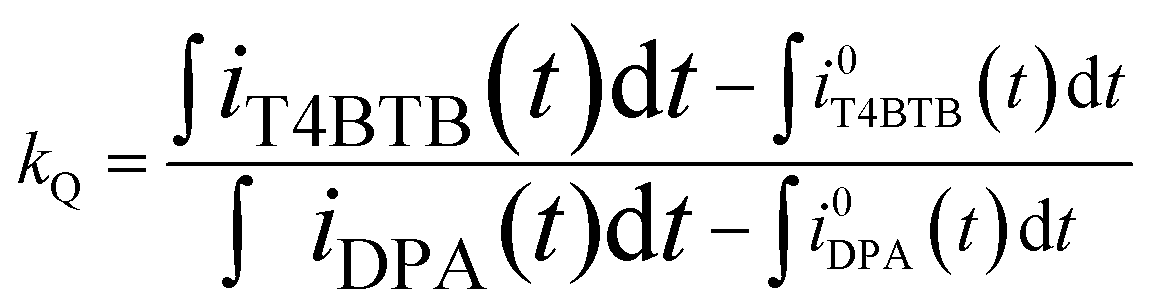
![[small phi variant, Greek, macron]](https://www.rsc.org/images/entities/i_char_e0d7.gif) T4BTB(DPA) is the quantum efficiency of the PMT averaged across the ECL spectrum of T4BT-B (DPA) and found to be 16.21% for T4BT-B and 14.45% for DPA, φPMT(λ) is a PMT spectral response quantum yield function (see ESI Fig. S7†), IT4BTB(DPA)(λ) is an ECL spectrum of T4BT-B (DPA), iT4BTB(DPA)(t) is the cathodic current from negative pulses for T4BT-B (DPA), iT4BTB(DPA)(t) is the non-Faradaic cathodic current from negative pulses for T4BT-B (DPA) estimated by performing potential steps between the aforementioned positive potential (E+) and the “foot” of the reduction wave (E0−) (Fig. 2) as described in the literature.22 The potential E0− was chosen to be −1.38 V for T4BT-B and −1.7 V for DPA (vs. Ag wire pseudo-reference electrode).
T4BTB(DPA) is the quantum efficiency of the PMT averaged across the ECL spectrum of T4BT-B (DPA) and found to be 16.21% for T4BT-B and 14.45% for DPA, φPMT(λ) is a PMT spectral response quantum yield function (see ESI Fig. S7†), IT4BTB(DPA)(λ) is an ECL spectrum of T4BT-B (DPA), iT4BTB(DPA)(t) is the cathodic current from negative pulses for T4BT-B (DPA), iT4BTB(DPA)(t) is the non-Faradaic cathodic current from negative pulses for T4BT-B (DPA) estimated by performing potential steps between the aforementioned positive potential (E+) and the “foot” of the reduction wave (E0−) (Fig. 2) as described in the literature.22 The potential E0− was chosen to be −1.38 V for T4BT-B and −1.7 V for DPA (vs. Ag wire pseudo-reference electrode).
For integration over wavelength, we used the following ranges: from 398 to 600 nm for DPA and from 481 to 800 nm for T4BT-B. The whole time range from 0 to 32 s was used for integration over time in order to estimate an average value of efficiency. The ECL efficiency of T4BT-B was found to be almost 7 times higher than that of DPA, as shown in Table 2.
The ECL results are consistent with a greater difference between ΔHann and Es for T4BT-B than that of DPA (see Table 3). The general constant, ΔGann (Gibbs free energy) is specific to ion annihilation. Es is the singlet energy which is calculated from the emission spectra. Immediately after the ion annihilation reaction, the emission spectrum of the same solution was taken and was found to be identical to the spectrum taken before the ECL experiment, suggesting there were no side reactions to produce any fluorescing by-products, which is consistent with good stability of the radical ions of T4BT-B.
ECL can also be generated by reduction or oxidation alone by using a co-reactant, a compound that is able to produce strong oxidising30 or reducing agents from a reaction that follows the electrochemical electron-transfer reaction.1 These agents must be energetic enough to react with the cation radicals of the emissive compound to produce excited states, eqn (1)–(4). Light emission is triggered by this energetic electron-transfer reaction. The co-reactant used for oxidation was tri-n-propylamine (TPrA), which oxidises to produce a strong reducing agent. This type of co-reactant has a wide range of applications because the generated ECL lasts longer since one only requires the application of positive potentials and the generation of potentially unstable anion-radicals is avoided.
| T4BT-B − e− → (T4BT-B)˙+ | (1) |
| TPrA − e− → TPrA˙+ | (2) |
| TPrA˙+ − H+ → TPrA˙ | (3) |
(T4BT-B)+ + TPrA˙ → (T4BT-B)* + Pr2N+![[double bond, length as m-dash]](https://www.rsc.org/images/entities/char_e001.gif) CHEt CHEt | (4) |
| (T4BT-B)* → T4BT-B + hν | (5) |
T4BT-B and DPA are able to generate ECL by this method, however the light intensity for T4BT-B is much greater, as shown in Fig. 5.
 | ||
| Fig. 5 Intensity–potential curve for co-reactant ECL for compound T4BT-B (continuous line) and DPA (dashed line). Same experimental conditions as solution-state CV with additional 2 mM of co-reactant. | ||
In summary, the oligofluorene-truxene compound with 2,1,3-benzothiadazole units shows good electrochemical behaviour both in CH2Cl2 and a solvent mixture of acetonitrile (50%): benzene (33%): toluene (17%), with excellent stability of both the anion and cation radicals. The single reversible 3-electron reduction wave allowed for the reliable determination of the diffusion coefficient. T4BT-B shows intense yellow emission that is visible to the naked eye under ambient conditions when generated by ion annihilation, by pulsing potentials between the first oxidation and reduction potentials, and also by using TPrA as a co-reactant, that generate upon oxidation the strong reducing agent, TPrA˙.4 The ECL spectra produced were similar to those of standard fluorescence. All experiments carried out with T4BT-B were compared to the well-known ECL emitter, DPA, under the same conditions. The results of the paper allow us to claim T4BT-B as a promising candidate for future ECL sensing applications due to its unique electrochemical and optical properties. The reversible multi-electron redox behaviour of T4BT-B, the highly luminescent nature of the oligofluorene–BT conjugated system and the greater difference between ΔHann and Es lead to high ECL efficiency, almost 7 times higher than that of DPA. Moreover, the beneficial position of the T4BT-B ECL spectrum which is close to the maximum spectral sensitivity of most PMTs can further decrease the detection limit in future ECL sensing applications (T4BTB = 16.21% vs. DPA = 14.45% for the PMT used in this work). The small degree of ECL instability mentioned above (deposition of material on the electrode), might be circumvented by the introduction of solubilising groups that will allow the use of the material in more polar solvents, thereby avoiding its deposition on the electrode.
Given the high ECL efficiencies observed for the T4BT-B compound, there are numerous opportunities for ECL applications. Within the current system this would most likely take the form of film based applications, detecting the presence of a specific target molecule thereby allowing for extremely low levels of detection, without the need for enhancement strategies.31–33 This can also open up the opportunity for multiplexed systems either combining the T4BT-B molecule with other ECL-active materials or other truxenes that emit at different wavelengths. Such strategies open up promising paths for the development of highly sensitive ECL sensors and ultimately multiplexed sensors.
Acknowledgements
PJS thanks the Royal Society for a Wolfson Research Merit Award and ALK thanks the EPSRC for funding (EP/I029141). LD thanks the European Union for funding under the FP7 Marie Curie Reintegration Grants (PIRG-2010-268236).Notes and references
- A. J. Bard, Electrogenerated Chemiluminescence, Marcel Dekker, New York, 2004 Search PubMed.
- R. J. Forster, P. Bertoncello and T. E. Keyes, in Annual Review of Analytical Chemistry, 2009, vol. 2, p. 359 Search PubMed.
- K. A. Fähnrich, M. Pravda and G. G. Guilbault, Talanta, 2001, 54, 531 CrossRef.
- W. Miao, Chem. Rev., 2008, 108, 2506 CrossRef CAS PubMed.
- P. Bertoncello, A. J. Stewart and L. Dennany, Anal. Bioanal. Chem., 2014, 406, 5573–5587 CrossRef CAS PubMed.
- A. Devadoss, L. Dennany, C. Dickinson, T. E. Keyes and R. J. Forster, Electrochem. Commun., 2012, 19, 43 CrossRef CAS PubMed.
- L. Dennany, E. J. O'Reilly, T. E. Keyes and R. J. Forster, Electrochem. Commun., 2006, 8, 1588 CrossRef CAS PubMed.
- E. Rampazzo, S. Bonacchi, D. Genovese, R. Juris, M. Marcaccio, M. Montalti, F. Paolucci, M. Sgarzi, G. Valenti, N. Zaccheroni and L. Prodi, Coord. Chem. Rev., 2012, 256, 1664 CrossRef CAS PubMed.
- L. Dennany, E. J. O'Reilly, P. C. Innis, G. G. Wallace and R. J. Forster, Electrochim. Acta, 2008, 53, 4599 CrossRef CAS PubMed.
- A. L. Kanibolotsky, R. Berridge, P. J. Skabara, I. F. Perepichka, D. D. C. Bradley and M. Koeberg, J. Am. Chem. Soc., 2004, 126, 13695 CrossRef CAS PubMed.
- M. Moreno Oliva, J. Casado, J. T. Lopez Navarrete, R. Berridge, P. J. Skabara, A. L. Kanibolotsky and I. F. Perepichka, J. Phys. Chem. B, 2007, 111, 4026 CrossRef PubMed.
- G. Tsiminis, Y. Wang, P. E. Shaw, A. L. Kanibolotsky, I. F. Perepichka, M. D. Dawson, P. J. Skabara, G. A. Turnbull and I. D. W. Samuel, Appl. Phys. Lett., 2009, 94, 243304 CrossRef PubMed.
- Y. Wang, G. Tsiminis, Y. Yang, A. Ruseckas, A. L. Kanibolotsky, I. F. Perepichka, P. J. Skabara, G. A. Turnbull and I. D. W. Samuel, Synth. Met., 2010, 160, 1397 CrossRef CAS PubMed.
- N. A. Montgomery, G. J. Hedley, A. Ruseckas, J.-C. Denis, S. Schumacher, A. L. Kanibolotsky, P. J. Skabara, I. Galbraith, G. A. Turnbull and I. D. W. Samuel, Phys. Chem. Chem. Phys., 2012, 14, 9176 RSC.
- A. L. Kanibolotsky, I. F. Perepichka and P. J. Skabara, Chem. Soc. Rev., 2010, 39, 2695 RSC.
- K. M. Omer, A. L. Kanibolotsky, P. J. Skabara, I. F. Perepichka and A. J. Bard, J. Phys. Chem. B, 2007, 111, 6612 CrossRef CAS PubMed.
- M. Shen, J. Rodríguez-López, J. Huang, Q. Liu, X.-H. Zhu and A. J. Bard, J. Am. Chem. Soc., 2010, 132, 13453 CrossRef CAS PubMed.
- M. Shen, X. H. Zhu and A. J. Bard, J. Am. Chem. Soc., 2013, 135, 8868 CrossRef CAS PubMed.
- K. M. Omer, S.-Y. Ku, K.-T. Wong and A. J. Bard, J. Am. Chem. Soc., 2009, 131, 10733 CrossRef CAS PubMed.
- S. Guo, O. Fabian, Y.-L. Chang, J.-T. Chen, W. M. Lackowski and P. F. Barbara, J. Am. Chem. Soc., 2011, 133, 11994 CrossRef CAS PubMed.
- C. R. Belton, A. L. Kanibolotsky, J. Kirkpatrick, C. Orofino, S. E. T. Elmasly, P. N. Stavrinou, P. J. Skabara and D. D. C. Bradley, Adv. Funct. Mater., 2013, 23, 2792 CrossRef CAS.
- C. P. Keszthelyi, N. E. Tokeltakvoryan and A. J. Bard, Anal. Chem., 1975, 47, 249 CrossRef CAS.
- J. E. B. Randles, Trans. Faraday Soc., 1948, 44, 327 RSC.
- R. S. Nicholson and I. Shain, Anal. Chem., 1965, 37, 178 CrossRef CAS.
- D. P. Valencia and F. J. Gonzalez, J. Electroanal. Chem., 2012, 681, 121 CrossRef CAS PubMed.
- J. Suk, P. Natarajan, J. N. Moorthy and A. J. Bard, J. Am. Chem. Soc., 2012, 134, 3451 CrossRef CAS PubMed.
- N. A. Montgomery, J.-C. Denis, S. Schumacher, A. Ruseckas, P. J. Skabara, A. Kanibolotsky, M. J. Paterson, I. Galbraith, G. A. Turnbull and I. D. W. Samuel, J. Phys. Chem. A, 2011, 115, 2913 CrossRef CAS PubMed.
- L. Dennany, C. F. Hogan, T. E. Keyes and R. J. Forster, Anal. Chem., 2006, 78, 1412 CrossRef CAS PubMed.
- W. L. Wallace and A. J. Bard, J. Phys. Chem., 1979, 83, 1350 CrossRef CAS.
- L. Dennany, M. Gerlach, S. O'Carroll, T. E. Keyes, R. J. Forster and P. Bertoncello, J. Mater. Chem., 2011, 21, 13984 RSC.
- A. Devadoss, L. Dennany, C. Dickinson, T. E. Keyes and R. J. Forster, Electrochem. Commun., 2012, 19, 43 CrossRef CAS PubMed.
- J. Wang, Y. Shan, W. W. Zhao, J. J. Xu and H. Y. Chen, Anal. Chem., 2011, 83, 4004 CrossRef CAS PubMed.
- Y. Y. Zhang, H. Zhou, P. Wu, H. R. Zhang, J. J. Xu and H. Y. Chen, Anal. Chem., 2014, 86, 8657 CrossRef PubMed.
Footnote |
| † Electronic supplementary information (ESI) available: Materials and methods, details of absorption, emission and diffusion coefficient measurements. See DOI: 10.1039/c4tc02638a |
| This journal is © The Royal Society of Chemistry 2015 |