
Pre-localized MWCNT network for a low percolation threshold in MWCNT/ABS nanocomposites: experiment and theory
S. K. Sharma,
R. P. Tandon and
V. K. Sachdev*
Department of Physics and Astrophysics, University of Delhi, Delhi-110007, India. E-mail: vk_sachdev@yahoo.com
First published on 20th October 2014
Abstract
Nanocomposites of well-dispersed multi walled carbon nanotubes (MWCNTs) in an acrylonitrile–butadiene–styrene (ABS) matrix were prepared by dry tumble mixing and a subsequent hot compression technique. The preparation method is analysed here to assist in the explanation and understanding of the experimental observations. The vision of the processing method has been confirmed using scanning electron microscopy. As a result of decent dispersion and pre-localization of MWCNTs in the ABS matrix, the electrical conductivity of the nanocomposite as a function of filler content exhibits a distinctive percolation behavior with a percolation threshold of only 0.0005 volume fraction. The high aspect ratio of MWCNTs enables the creation of interconnected networks within the ABS matrix at a very low nanofiller loading, while their high inherent electrical conductivity yields nanocomposites with a high bulk electrical conductivity. To explain the conductivity behaviour, statistical percolation theory and GEM theory are employed. The model parameters elaborated show that both models can adequately describe the behaviour. A comparative analysis of the applicability of percolation theory and GEM theory for expressing the conductivity behavior of the MWCNT/ABS composites with other research works has been performed. Finally, the electrical conductivity of MWCNTs based on the data in this work and elsewhere is evaluated. The universal exponent t is found to be 1.93 for a best-fit value of percolation threshold of 0.000485 vol. fraction of MWCNTs in this work. The D shore hardness results have revealed a random increase in hardness and density with an increasing MWCNT content.
1. Introduction
The advancement of nanofillers has opened an unlimited potential for exploitation to cultivate new generations of materials with multifunctional features. With so many choices available today regarding polymeric materials, selection is one of the fundamental features that would decide the prospective success or failure of a product. It is imperative that anyone involved in product design or material selection should know its properties and that how it affects the end product performance, part design and manufacturability. A thorough understanding of the immediate and persistent properties of the potential material is essentially desired to make the best selection. This research work outlines some of the thoughts and backups related to electrical conductivity that needs to be made while selecting an appropriate material.Some reviews while discussing polymeric composites based on carbon nanotubes (CNTs) have made known their extraordinary tensile strength, electrical and thermal conductivity, and dimensional stability as a result of high aspect ratio.1–5 The usage of CNT as a filler has been given significant importance because of its exceptional physical and chemical properties; moreover, it exhibits superior conductivity over other conducting fillers. The enriched electrical performance of the nanocomposites makes it an important material for use in many applications such as electromagnetic interference shielding, electrostatic charge dissipation, and photo-voltaic devices. However, the wide commercial use of such nanostructured composite materials is stuck by the basic factors associated with the high production costs of nanocomposites originated by unique processing and functionalization, which are essential for the meaningful dispersion of nanofillers within the polymer matrix. In order to formulate networks within the matrix at a very low nanofiller loading, a good dispersion of the nanofiller in the composite is vital for electrical and thermal applications. The low loading is desirable to retain some of the polymer's valued properties and to significantly reduce the nanocomposite cost. In most nanocomposites, the dispersion of CNTs is opposed because of the strong van der Waals forces that tend to keep the CNTs in agglomerates, i.e., jumbled collections. To increase the nanofiller dispersion or to prevent re-agglomeration during nanocomposite compounding, techniques such as ultrasonication, polymer grafting, nanofiller functionalization and use of a suitable solvent are frequently used.2,3,6 To achieve good dispersion, ultra-sonication of the nanofiller in low viscosity solutions is an effective method. However, too much or even trivial prolonged sonication can lead to defects and a decline in the nanofiller aspect ratio.7 The decay of the nanofiller electrical conductivity by converting the crystalline graphene layers into amorphous carbon under excessive sonication has been reported.8 As documented,6 functionalization and grafting were found to enhance the mechanical properties of nanocomposite materials by improving the dispersion and adhesion between the nanofiller and the polymer matrix,3,7 but on the other hand, the formation of an insulating layer either by physical adsorption or covalent bonding of the functional material on the surface of the conductive nanofiller degrades the nanocomposites electrical properties.3,9
In this work, the focus is on the design of conductive polymer nanocomposites with the lowest possible electrical percolation threshold, which is a critical concentration required for the transition of a nanocomposite from the insulating state to the semi-conductive or conductive state. At the percolation threshold point, the nanocomposite electrical conductivity increases by several orders of magnitude. To achieve this objective, a system of multi walled carbon nanotubes (MWCNTs) and acrylonitrile–butadiene–styrene (ABS) was studied. ABS based composite materials have been of significant concern until now. MWCNTs were selected as the conductive nanofiller because of its high aspect ratio and electrical conductivity, besides its comparatively lower cost of production relative to single wall carbon nanotubes. ABS is a widely used engineering thermoplastic and an insulator that offers easy processability, superior chemical properties, lower cost, reliable notch impact resistance and good dimensional stability. The high aspect ratio of MWCNTs facilitates the formation of interconnected networks within the polymer matrix at a very low nanofiller loading, while the high intrinsic electrical conductivity produces nanocomposites with a high volumetric electrical conductivity. The nanocomposites were prepared by means of tumble mixing of MWCNTs and ABS in a dry powder state with a subsequent hot compaction technique,10 which enables a conducting network via pre-localization of the conducting filler MWCNTs in the ABS polymer.
2. Experimental
2.1 Materials
ABS-92 used in this work was procured from Lanxess ABS Ltd., Baroda, India. MWCNTs were obtained from Sigma Aldrich Ltd. Catalog number: 677248-5G. Specification: >99% carbon basis, inner diameter, outer diameter, length and density were ∼2–6 nm, ∼10–15 nm, 0.1–10 micron and 1.7–2.1 g mL−1 at 25 °C, respectively. MWCNTs were used in this work without any further purification/modification.2.2 Sample preparation
Granules of ABS were pulverized cryogenically. The particle size of ABS powder, estimated using scanning electron microscopy (SEM), was found to be ∼1–5 microns. The SEM micrograph is presented in Fig. 2(a). The ABS powder was heated in a piston cylinder assembly at 115 °C for some time, brought back to 90 °C, and then compacted to a pellet shape at 75 MPa pressure for 15 min. The density and DC electrical conductivity of the ABS pellets were found to be 0.9583 g cm−3 and 1.149 × 10⁻¹⁴ S cm−1, respectively.In literature, the main techniques referred to produce CNT/polymer nanocomposites11–14 are based on the addition of CNTs into a melted polymer matrix or polymer solution, followed by mechanical mixing and a chemical reaction between the modified CNTs and polymer matrix. However, these approaches suffer from some limitations such as a difficulty in dispersion due to the viscosity of the polymer melts15 and re-agglomeration of the nanotubes during the drying process.16,17 The preparation process of MWCNT/ABS composites in this work involves coating of a MWCNTs layer on the ABS particles and subsequent compacting by compression molding. Conductive MWCNTs will remain localized at the interfacial place between the ABS particles in the absence of any shear, and hence build up a network of conductive pathways. The technique of sample preparation of the MWCNT/ABS nanocomposite is the same as used earlier.18 Composites with networked MWCNTs are found to be much superior to the distributed MWCNTs (solution PS mixing) in terms of lower electrical resistivity and higher compressive strength.18 A stepwise schematic diagram of sample preparation is illustrated in Fig. 1.
 | ||
| Fig. 1 Schematic diagram for the preparation of MWCNT/ABS nanocomposites. | ||
The powders of MWCNTs and ABS were mixed in the tumbler for 300 min. An initial low speed was followed by a high speed. The idea is, first to open the jumbled MWCNT agglomerates at a low speed and subsequently disperse the MWCNTs in the ABS matrix by means of a high speed. The mixture powder of ABS and MWCNTs was subjected to dispersal due to impacts with the stirrer and the walls of the tumbler. The embedding/filming of the MWCNTs onto the ABS particles by high impact forces and the friction heat are obvious. Prolonged tumble mixing is supposed to evenly disperse the MWCNTs in the ABS matrix, besides coating the ABS particles, and thus realizing strong interfacial bonding between the MWCNTs and the matrix. The resultant mixture was hot compressed in a piston cylinder assembly for 15 min, similar to the preparation of virgin ABS pellets. The philosophy behind the preparation of ABS nanocomposites with networked MWCNTs is clarified through the SEM micrographs displayed in Fig. 2. The morphologies of pure ABS (powder) and MWCNTs are shown in Fig. 2(a) and (b), respectively.
 | ||
| Fig. 2 SEM micrographs of (a) pristine ABS powder; (b) MWCNTs as obtained; (c) ABS particles embedded/coated with MWCNTs; (d) ABS nanocomposite with 0.05 wt% MWCNTs; (e) ABS nanocomposite with 0.2 wt% MWCNTs; and (f) pristine ABS pellet. | ||
The lumps of ABS are comprised of particles of irregular shape having sizes estimated to be ∼1–5 microns. The surfaces of particles do not appear smooth (Fig. 2(a)). The MWCNTs (as obtained from Sigma Aldrich Ltd) are in jumbled form (Fig. 2(b)). Prolonged tumble mixing of ABS and MWCNTs places a MWCNTs coating on the surface of the ABS particles. Fig. 2(c) confirms the embedding/filming of the MWCNTs onto the ABS particles. Shortened/broken MWCNTs during the process are noticed in the micrograph. Fig. 2(d) and (e) are the micrographs (transection view) of the freeze fractured ABS nanocomposites with 0.05 wt% and 0.2 wt% MWCNTs. Localized MWCNTs at the interfacial places between ABS particles are seen and are assumed to be a part of electric conduction mechanism in the samples. In Fig. 2(d), partially broken networks of MWCNTs pathways are noticed. Thus, the conductivity in this sample, which is in close vicinity of the percolation threshold is supported by inter-MWCNTs contacts as well as electrons hopping/tunneling across the gaps between conducting MWCNTs in the ABS matrix. A nearly complete network of MWCNTs in the micrograph Fig. 2(e) for the 0.2 wt% MWCNTs ensures the dominant inter-MWCNTs contacts mechanism for conductivity.
A series of pellets with 0.05–5 wt% MWCNTs content in ABS were prepared. Three pellets of each composition were made ready. The disc shaped pellets were 1.3 cm in diameter with thicknesses between 2 and 3 mm. Electrical measurements of the specimen pellets were carried out in sandwich geometry. SEM grade silver was painted on both the surfaces for electrodes. For resistances below 200 M Ohm, Keithley 2400 source meter was used, while the very high resistance of the ABS pellets was measured using Keithley 4200 SCS setup. For pellets with resistance <1 kΩ, Kelvin's four wires connection system was used; since in the two-wire method, the resistance of test leads significantly contributes to the measurements, whereas the four wire technique reduces the effect of the test leads. A fixture with a spring loaded pressure contact was used as the sample holder.
The density of ABS pellets and composites were determined by considering the ratio of its weight to volume. D shore hardness tester was utilized for hardness measurements. The data reported here are the mean values.
3. Results and discussion
3.1 Density
Specimen composites of all compositions were characterized for density and hardness. Fig. 3 illustrates the variation of bulk density of MWCNT/ABS composites with the increasing mass fraction of MWCNTs.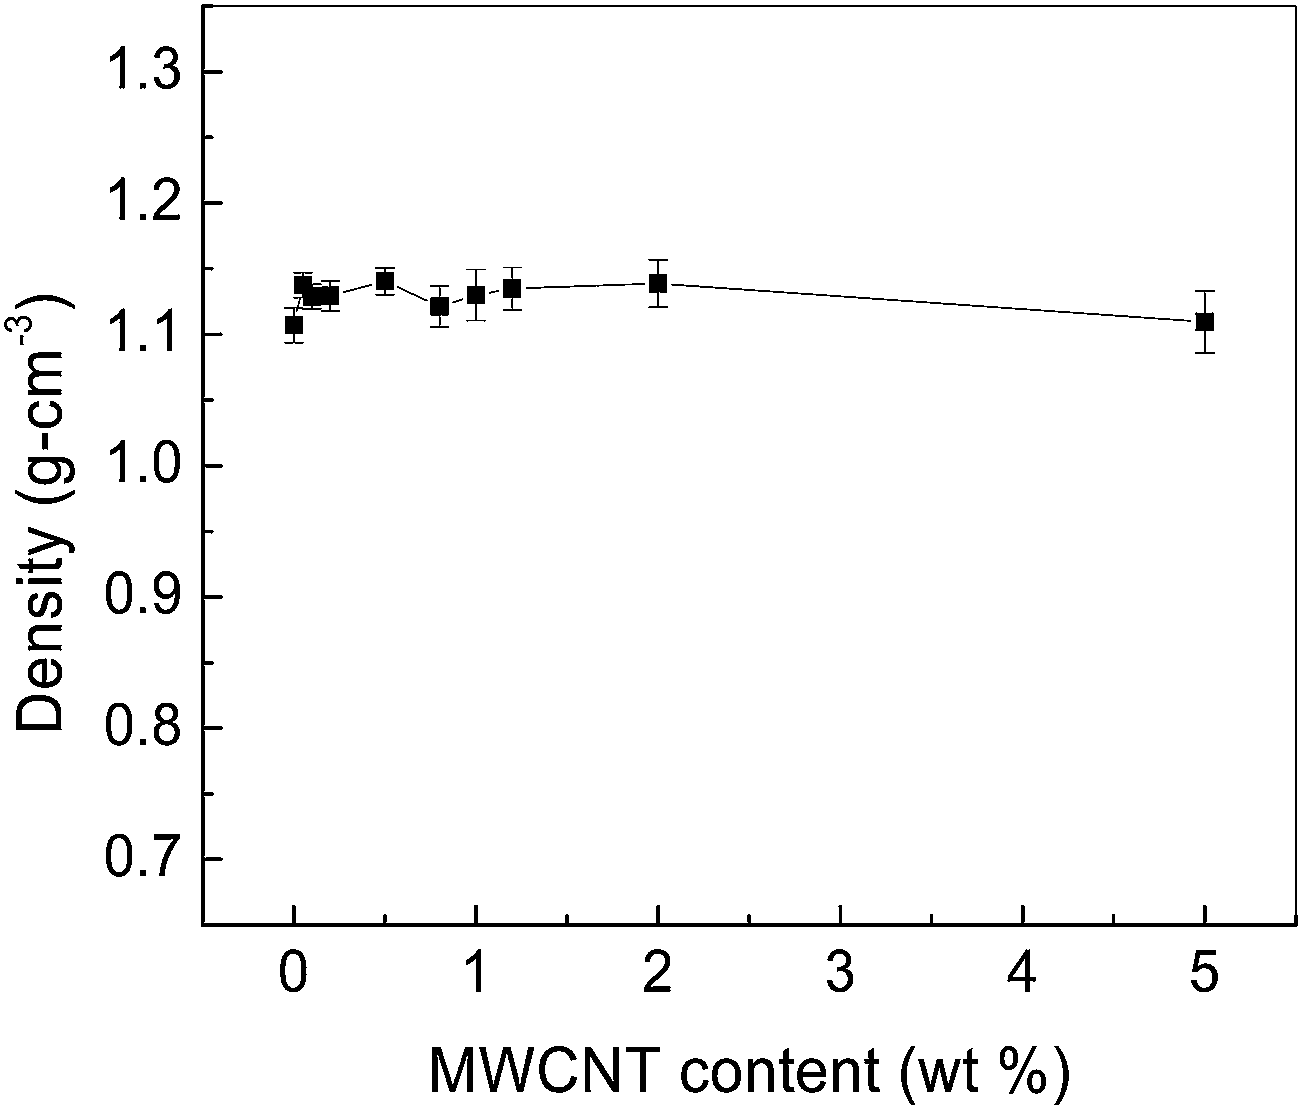 | ||
| Fig. 3 Density variation of the MWCNT/ABS composites as a function of MWCNT content. | ||
The bulk density of the composite referred here indicates the ratio of its weight to volume, despite some air voids inside, if any. It was evaluated precisely from the testing results of the micro-level measurement of the sample volume and weight. The observed density of the ABS pellet (0.9583 g cm−3) is lower than the density of the MWCNTs (1.7–2.1 g cm−3). On inclusion of filler particles of higher density (MWCNT) in the ABS composites, a random increase in the density between 1.1071 and 1.1387 g cm−3 with a maximum rise of 18.8% upon addition of 2 wt% MWCNTs was noticed.
3.2 D shore hardness
All the pellets were tested for hardness. Measurements were taken on the 100 scale of D shore hardness. Hardness behaviour with an increasing mass fraction of MWCNTs is shown in Fig. 4. Similar to density, increase in the hardness of the ABS nanocomposites is arbitrary on inclusion of the MWCNTs. The maximum hardness observed is 15.6% upon addition of 2 wt% MWCNTs. | ||
| Fig. 4 Variation of the MWCNT/ABS composite hardness as a function of MWCNT content. | ||
3.3 Conductivity
It is worthwhile to mention that these composites have been prepared through extensive tumble mixing of dry powders of MWCNTs and ABS, with subsequent hot compaction. ABS particles were evidently seen to be coated with a layer of MWCNTs (Fig. 2c). On compaction at an elevated temperature, the MWCNTs are assumed to be placed at the interfacial spaces between the ABS particles. The position of the MWCNTs within the insulating ABS matrix would contribute toward the improvement of the electrical properties of the composites.In this work, the emphasis is on the development of a conductive polymer nanocomposite with the lowest possible electrical percolation threshold while retaining its mechanical strength for product applications. The low loading of nanofiller is necessary to retain some of the polymer's valuable properties and to realistically reduce the nanocomposite cost. The behavior of experimentally determined dc conductivity (σ) of the MWCNT/ABS nanocomposite specimens as a function of the MWCNT loading is shown by hollow circle symbols in Fig. 5.
 | ||
| Fig. 5 Conductivity behavior of the MWCNT/ABS nanocomposite as a function of MWCNT content. | ||
On inclusion of 0.2 wt% (0.001 vol. frac.) MWCNTs, the σ of ABS increases abruptly by ten orders of magnitude from 1.15 × 10⁻¹⁴ S cm−1 to 1.24 × 10⁻⁴ S cm−1. A major rise of seven orders of magnitude in σ (2.29 × 10⁻⁷ S cm−1) occurs upon addition of 0.1 wt% (0.0005 vol. frac.) MWCNTs under the semiconducting range, and upsurges to 1.24 × 10⁻⁴ S cm−1 on inclusion of 0.001 vol. frac. Therefore, the percolation threshold can safely be considered near to 0.0005 vol. frac. of MWCNTs. Such a low value for the percolation threshold is suggestive of the excellent dispersion of the high aspect ratio MWCNTs in the nanocomposites besides the formation of a network of conductive pathways/channels and quantum mechanical tunneling of electrons therein. These conductive channels consist of MWCNTs. The electrical conduction is supposed to take place by inter-MWCNTs contacts, as well as electrons hopping/tunneling across the gaps or energy barriers between the conducting MWCNTs in the ABS matrix. The σ tends to saturate at a higher concentration of MWCNT. The addition of MWCNTs from 0.5 wt% (0.0025 vol. frac.) to 5 wt% (0.025 vol. frac.) flattens the σ curve with a marginal rise from 0.001 S cm−1 to 0.18 S cm−1. This suggests that the conductive components within the ABS matrix are in direct contact.
3.4 I–V characteristics
The mechanism of conductivity at the percolation concentration has been recognized by studying the current–voltage (I–V) relationship.6 The I–V behavior for the MWCNT/ABS nanocomposites are shown in Fig. 6. Direct contact between the filler particles and tunneling are the mechanisms for electron transfer in composite materials. At filler concentrations above the percolation threshold, conductivity is supposed to be mainly due to the direct contact between the filler particles [Fig 6(a) and (b)], and conduction between the MWCNT particles is considered to be by a linear I–V relationship, i.e., Ohmic behavior. However, at a filler concentration slightly around the percolation threshold, where the conductive network has not been formed fully, conduction might be due to tunneling in addition to direct contacts [Fig. 6(c) and (d)]. SEM studies of the micrographs of Fig. 2(d) and (e) corroborate these statements. Theoretically, when the distance between conductive components within the matrix is close to an edge value <10 nm, tunneling is expected to take place.19 The non-linear I–V relationship follows the power law. At concentrations well below the percolation threshold, where the filler particles are apart from each other, even tunneling cannot occur. | ||
| Fig. 6 I–V characteristics of the MWCNT/ABS nanocomposites with MWCNTs content of (a) 0.2 wt%; (b) 0.5 wt%; (c) 0.05 wt%; and (d) 0.1 wt%. | ||
3.5 Power-law model
The conductivity performance of the MWCNT/ABS composites investigated in this work above percolation could be explained by the power-law model σ = σh(Φ − Φc)t, where σ, σh, Φ, Φc and t have their usual meanings: the conductivity of the composite, the conductivity of filler, the filler volume fraction, the critical volume fraction at which percolation takes place and the critical index of conductivity, respectively.19,20 This model is usually restricted to the cases in which either the insulating medium has a zero conductance value or the conducting filler has zero resistance.19 In the present MWCNT/ABS system, since the resistivity is finite, the above equation with the scaling parameter t will be valid. A best linear fit obtained for log![[thin space (1/6-em)]](https://www.rsc.org/images/entities/char_2009.gif) σ vs. log(Φ − Φc) by Φc = 4.85 × 10⁻⁴ volume fraction of MWCNTs is illustrated in the inset of Fig. 5. The value of the critical index t as estimated from the slope of the linear fit is 1.93 ± 0.05. However, the theoretical values of t obtained by Kirkpatrick21 and Straley22 are 1.5 ± 0.2 and 1.75 ± 0.1, respectively. For single percolation, the critical exponent depends solely on the dimensionality of the system. For a well-dispersed high aspect ratio filler, t values around 2.0 were reported for many nanocomposites.23–26 The value of σh (conductivity of MWCNT) was found to be ∼275.76 S cm−1 from the equation. In Fig. 5, above Φc (vol. fraction of MWCNT), a good quantitative correspondence between the experiment and theory based on the power law has been identified. The maximum rms deviation between the calculated and experimental values is found to be 1.7 × 10⁻². Earlier, a comparison of Φc and t for some polymer composites with different filler shapes was made.27 The value of t for all composites was closer to the widely accepted value of ∼2.0. The Φc for composites with MWCNTs was lowest among all, endorsed to its nanostructure having a high aspect ratio. McLachlan refers that the low percolation threshold often corresponds to the use of filler particles with an elongated geometry.28 The geometry of MWCNT has been correlated to that of an elongated geometry. The relationship of MWCNT geometry in addition to size and processing technique in favor of conducting paths/channels at a low percolation threshold has been documented.27
σ vs. log(Φ − Φc) by Φc = 4.85 × 10⁻⁴ volume fraction of MWCNTs is illustrated in the inset of Fig. 5. The value of the critical index t as estimated from the slope of the linear fit is 1.93 ± 0.05. However, the theoretical values of t obtained by Kirkpatrick21 and Straley22 are 1.5 ± 0.2 and 1.75 ± 0.1, respectively. For single percolation, the critical exponent depends solely on the dimensionality of the system. For a well-dispersed high aspect ratio filler, t values around 2.0 were reported for many nanocomposites.23–26 The value of σh (conductivity of MWCNT) was found to be ∼275.76 S cm−1 from the equation. In Fig. 5, above Φc (vol. fraction of MWCNT), a good quantitative correspondence between the experiment and theory based on the power law has been identified. The maximum rms deviation between the calculated and experimental values is found to be 1.7 × 10⁻². Earlier, a comparison of Φc and t for some polymer composites with different filler shapes was made.27 The value of t for all composites was closer to the widely accepted value of ∼2.0. The Φc for composites with MWCNTs was lowest among all, endorsed to its nanostructure having a high aspect ratio. McLachlan refers that the low percolation threshold often corresponds to the use of filler particles with an elongated geometry.28 The geometry of MWCNT has been correlated to that of an elongated geometry. The relationship of MWCNT geometry in addition to size and processing technique in favor of conducting paths/channels at a low percolation threshold has been documented.27
3.6 General effective media theory
McLachlan's general effective media (GEM) theory27,29 combines the best features of percolation30 and effective media theory, as projected by Bruggeman.31 The disadvantage of effective media has been overcome in aggregate structure models.32 The GEM equation is an interpolation between Bruggeman's symmetric and asymmetric theories. The layout of the equation is same as that of the percolation equation of conductivity when the ratio of conductivities of the two components is infinitely large. The benefit of this equation is its applicability to all volume fractions and not only near the insulator–conductor transition as in the percolation theory. Based on previous researches29,33 the GEM equation for electrical conductivity of binary system:
Here, the symbols have their usual meanings. Subscripts l, m and h stand for low, medium and high, respectively. σm describes the conductivity of the binary composite system. Using an analytical solution33 for the GEM equation, the appearance of the equation becomes:
| AM2 − [AL − H + ϕ(H − L)(A + L)]M − HL = 0; |
| A2M2 + A(H + L)M + HL ≠ 0 |
 .
.
The conductivity of the composite corresponds to σm = Mt.
Fig. 7 shows a comparative analysis of the experimental and theoretical (using GEM equation) information of the MWCNT/ABS composites. Relative changes in the conductivity of the composites has been considered for normalization. ABS conductivity is varied from different sources. The fitting parameters of the GEM equation for the present work and other works6,34,35 are shown in the Table 1.
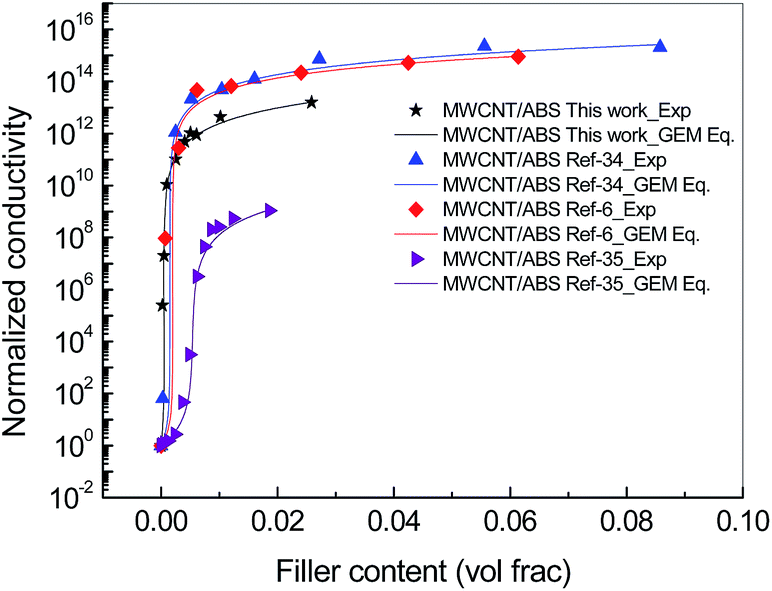 | ||
| Fig. 7 Conductivity versus MWCNT content for the MWCNT/ABS composites (Experimental and GEM theory). | ||
| Sample | MWCNT length and diam. | Average aspect ratio | σl (S cm−1) | σh (S cm−1) power law | σh (S cm−1) GEM eq | t | Φc exp. | Φc best fit power law | Φc theory ref. 35 and 37 |
|---|---|---|---|---|---|---|---|---|---|
| MWCNT/ABS this work | L = 0.1 to 10 μm, D = 10 to 15 nm | ∼404 | 1.15 × 10⁻¹⁴ | 275.76 | 223.01 | 1.93 | 0.000504 | 0.000485 | 0.000074 |
| MWCNT/ABS ref. 34 | L = 1.34–1.5 μm, D = 9.5 nm | ∼150 | 8.88 × 10⁻¹⁶ | 239.17 | 176.37 | 1.75 | 0.00248 | 0.0015 | 0.0002 |
| MWCNT/ABS ref. 6 | L = 1.34–1.5 μm, D = 9.5 nm | ∼150 | 8.88 × 10⁻¹⁶ | 103.48 | 78.54 | 1.61 | 0.00301 | 0.002 | 0.0002 |
| MWCNT/ABS ref. 35 | L = 1.34–1.5 μm, D = 9.5 nm | ∼150 | 1.37 × 10⁻¹¹ | 230.12 | 138.22 | 2.1 | 0.00491 | 0.0054 | 0.0002 |
The values of σl are the experimental values of conductivity of ABS (specimen pellet) and read from the graphs.6,34,35 σh and t are as obtained from the fitting of the power law model. Qualitatively, the character of experimental and theoretical curves is identical. Quantitatively, the rms deviations between the experiment and theory for the MWCNT/ABS composites of various investigators are 0.0172 (this work), 0.5416, 0.1173 and 0.00535. There is a good agreement between the experiment and theory for all MWCNT/ABS composites from different sources. The conductivity of MWCNTs, σh calculated from the power law and GEM equations are in reasonable agreement, as revealed in the Table column 8 and 9. σh lies between 2.76 × 10² and 0.785 × 10² based on the data in this work and elsewhere. The value of σh evaluated via the power law and GEM theory has the least variation, based on the data in this work. σh, considered as a pre-factor, depends on the details of the transport process.36 In the case of composites with ultra-high molecular weight polyethylene filled with MWCNTs, the dependence of σh on their diameters, helicity degree, and presence of defects has been stated.37,38 The difference in the value of t in the table6,34,35 can be ascribed to issues, such as the source of ABS, dispersion technique, aspect ratio of MWCNT and carbon purity. The effect of change of solvent6,34 on σh and t, besides some variation in Φc, can be noticed. In the present work, such a low value of Φc achieved for the MWCNT/ABS nanocomposite is indicative of the excellent dispersion of MWCNTs in the ABS matrix. Theoretically, the value of Φc may be calculated using the relationship35 between Φc and L/D of the filler based on Balberg et al.39 recommendation for nanocomposites filled with a stick-like randomly distributed filler, having length (L) and diameter (D). The relationship can be stated as:
| L/D = 3/Φc |
An aspect ratio (L/D) by use of an average length and diameter of ∼404 yields Φc = 0.000074 vol. fraction, which is lower as compared to the experimental value (0.0005 vol. fraction) and best fit value (0.000485 vol. fraction) found by the power law. Such discrepancy in the theoretical and experimental/best fit values can be endorsed to the reduction of the aspect ratio due to the breakage of MWCNTs length during the tumble mixing process. Moreover, the nanotubes were assumed to correspond to rigid rod-like shapes for theoretical investigations39. The breaking of MWCNTs length during the sample process has been observed in SEM micrograph-Fig. 2(c) and also mentioned above. The high aspect ratio related to MWCNTs facilitates in achieving a very low Φc. The percolation threshold-aspect ratio curve for evenly dispersed nanotubes simulated from theory is displayed in Fig. 8. Φc from our experimental measurements is the lowermost compared to others owing a high aspect ratio.
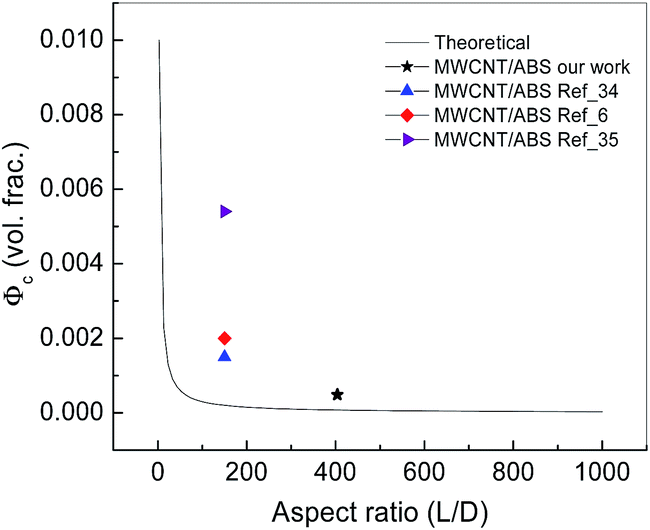 | ||
| Fig. 8 Variation of Φc as a function of aspect ratio: theoretical and experimental. | ||
4. Conclusion
The lowermost experimental percolation threshold for MWCNT/ABS, reported in this work, yields values very close to the best concerns. The conductivity of MWCNT has been evaluated through the power law and GEM theory. There is a good agreement between the values obtained using the data in this work and elsewhere. The lowest value of percolation threshold observed here is endorsed to prolonged dry mixing of the agglomerate of high aspect ratio MWCNTs in the ABS matrix, subjected to even dispersal by impacts with stirrer and the walls of tumbler during processing. Subsequent hot compaction of the composite mixture localizes the MWCNTs at interfacial spaces between the ABS particles and results in a network of conductive pathways. SEM studies directly support the theory of MWCNTs coating on the ABS particles and validate the interpretations on the corresponding nanocomposites. This method of composite preparation does not involve any solvent and modified MWCNTs, and hence can be considered as an industrially viable technique to prepare ABS/MWCNT nanocomposites on a bulk scale. In addition, well controlled processing parameters would be easy to manipulate. For quality control, riders on some specific steps would be significant.References
- R. Bogue, Assembly Autom., 2011, 31, 106 CrossRef.
- Z. Han and A. Fina, Prog. Polym. Sci., 2011, 36, 914 CrossRef CAS PubMed.
- M. H. Al-Saleh and U. Sundararaj, Carbon, 2009, 47, 2 CrossRef CAS PubMed.
- M. H. Al-Saleh and U. Sundararaj, Composites, Part A, 2011, 42, 2126 CrossRef PubMed.
- W. Bauhofer and J. Z. Kovacs, Compos. Sci. Technol., 2009, 69, 1486 CrossRef CAS PubMed.
- M. H. Al-Saleh, H. K. Al-Anid and Y. A. Hussain, Composites, Part A, 2013, 46, 53 CrossRef CAS PubMed.
- P. C. Ma, N. A. Siddiqui, G. Marom and J. K. Kim, Composites, Part A, 2010, 41, 1345 CrossRef PubMed.
- K. Mukhopadhyay, C. D. Dwivedi and G. N. Mathur, Carbon, 2002, 40, 1373 CrossRef CAS.
- N. G. Sahoo, S. Rana, J. W. Cho, L. Li and S. H. Chan, Prog. Polym. Sci., 2010, 35, 837 CrossRef CAS PubMed.
- V. K. Sachdev, K. Patel, S. Bhattacharya and R. P. Tandon, J. Appl. Polym. Sci., 2011, 120, 1100 CrossRef CAS.
- J. N. Coleman, M. Cadek, R. Blake, V. Nicolosi, K. P. Ryan, C. Belton, A. Fonseca, J. B. Nagy, Y. K. Gun'ko and W. J. Blau, Adv. Funct. Mater., 2004, 14, 791 CrossRef CAS.
- G. Jell, R. Verdejo, L. Safinia, M. S. P. Shaffer, M. M. Stevens and A. Bismarck, J. Mater.Chem., 2008, 18, 1865 RSC.
- R. Andrews, D. Jacques, M. Minot and T. Rantell, Macromol. Mater. Eng., 2002, 287, 395 CrossRef CAS.
- S. Wang, R. Liang, B. Wang and C. Zhang, Carbon, 2007, 45, 3047 CrossRef CAS PubMed.
- K. A. Narh, L. Jallo and K. Y. Rhee, Polym. Compos., 2008, 29, 809 CrossRef.
- T. Chatterjee, K. Yurekli, V. G. Hadjiev and R. Krishnamoorti, Adv. Funct. Mater., 2005, 15, 1832 CrossRef CAS.
- T. G. Gopakumar, M. Xanthos and M. Xanthos, Polym. Compos., 2006, 27, 368 CrossRef CAS.
- V. K. Sachdev, S. Bhattacharya, K. Patel, S. K. Sharma, N. C. Mehra and R. P. Tandon, J. Appl. Polym. Sci., 2014, 131, 40201 CrossRef.
- R. Strumpler and J. Glatz-Reichenbach, J. Electroceram., 1999, 3, 329 CrossRef CAS.
- V. K. Sachdev, N. K. Shrivastav, V. Panwar, H. Singh, N. C. Mehra and R. M. Mehra, Phys. Status Solidi A, 2006, 203, 3754 CrossRef CAS.
- S. Kirkpatrick, Rev. Mod. Phys., 1973, 45, 574 CrossRef.
- J. Straley, Phys. Rev. B: Solid State, 1977, 15, 5733 CrossRef CAS.
- I. C. Finegan and G. G. Tibbetts, J. Mater. Res., 2001, 16, 1668 CrossRef CAS.
- S. A. Gordeyev, F. J. Macedo, J. A. Ferreira, F. W. J. Van Hattum and C. A. Bernardo, Phys. B, 2000, 279, 3 CrossRef.
- N. Li, Y. Huang, F. Du, X. B. He, X. Lin and H. J. Gao, Nano Lett., 2006, 6, 1141 CrossRef CAS PubMed.
- M. B. Bryning, M. F. Islam, J. M. Kikkawa and A. G. Yodh, Adv. Mater., 2005, 17, 1186 CrossRef CAS.
- S. Bhattacharya, R. P. Tandon and V. K. Sachdev, J. Mater. Sci., 2009, 44, 2430 CrossRef CAS.
- D. S. Mclachlan, J. Electroceram., 2000, 5, 93 CrossRef CAS.
- D. S. McLachlan, M. Blaszkiewicz and R. E. Newnham, J. Am. Ceram. Soc., 1990, 73, 2187 CrossRef CAS PubMed.
- X. B. Chen, J. Devaux, J. P. Issi and D. Billaud, Polym. Eng. Sci., 1995, 35, 637 CAS.
- F. Brouers, Journal of Physics C: Solid State Physics, 1986, 19, 7183 CrossRef.
- J. Liang and Q. Yang, J. Appl. Phys., 2007, 102, 083508 CrossRef PubMed.
- S. Liu and R. A. Dougal, J. Mater. Sci. Lett., 1999, 18, 1929 CrossRef CAS.
- M. H. Al-Saleh, W. H. Saadeh and U. Sundararaj, Carbon, 2013, 60, 146 CrossRef CAS PubMed.
- N. K. Shrivastava, S. Suin, S. Maiti and B. B. Khatua, RSC Adv., 2014, 4, 24584 RSC.
- W. Y. Hsu, W. G. Holtje and J. R. Barkley, J. Mater. Sci. Lett., 1988, 7, 459 CrossRef CAS.
- M. O. Lisunova, Y. P. Mamunya, N. I. Lebovka and A. V. Melezhyk, Eur. Polym. J., 2007, 43, 949 CrossRef CAS PubMed.
- R. Z. Ma, C. L. Xu, B. Q. Wei, J. Liang, D. H. Wu and D. J. Li, Mater. Res. Bull., 1999, 34, 741 CrossRef CAS.
- I. Balberg, C. H. Anderson, S. Alexander and N. Wagner, Phys. Rev. B: Condens. Matter Mater. Phys., 1984, 30, 3933 CrossRef.
| This journal is © The Royal Society of Chemistry 2014 |