DOI:
10.1039/C3RA44309D
(Paper)
RSC Adv., 2014,
4, 7786-7794
Construction of Pt nanoparticle-decorated graphene nanosheets and carbon nanospheres nanocomposite-modified electrodes: application to ultrasensitive electrochemical determination of cefepime†
Received
12th August 2013
, Accepted 25th November 2013
First published on 27th November 2013
Abstract
A novel ultrasensitive modified electrode was fabricated with a graphene nanosheets and carbon nanospheres (GNS–CNS)-based nanocomposite film as a powerful platform. Pt nanoparticles (PtNPs) were simply electrodeposited onto the GNS–CNS-coated glassy carbon electrode creating a PtNPs/GNS–CNS hybrid nanocomposite modified electrode. Scanning electron microscopy, energy dispersive X-ray spectroscopy and linear sweep voltammetry (LSV) techniques were used for the characterization of the prepared modified electrode. The results of investigation of electrochemical response characteristics of cefepime (CP) revealed a considerable improvement in the oxidation peak current of CP on PtNPs/GNS–CNS/GCE compared to GNS–CNS/GCE or PtNPs/GCE. The observation of a synergistic effect between GNS–CNS and PtNPs is related to the electroactivity enhancement of PtNPs in the constructed nanostructured composite due to high electron-transfer ability of GNS–CNS. Under optimal conditions, the modified electrode showed high sensitivity (b(CP) = dIp,a(CP)/d[CP] = 1747.2 nA nM−1), a low detection limit (LOD (CP) = 1.2 nM, S/N = 3) and a wide linear dynamic range (8 nM to 6 μM) for the voltammetric determination of CP. The prepared electrode was successfully applied for the accurate determination of trace amounts of CP in pharmaceutical and clinical samples.
1. Introduction
Discovered by Novoselov and Geim in 2004,1 graphene is known as a basic building block for graphitic materials of all other dimensionalities.2 Graphene is composed of a perfect monolayer of sp2-hybridized carbon atoms packed into a two-dimensional honeycomb lattice.3 Graphene as a unique nanostructure has attracted enormous attention due to its unique nanostructure and a variety of fascinating properties such as large surface area, excellent conductivity, high electrocatalytic activities, and strong mechanical strength. Such properties make graphene a very promising material for electrode modification.1,2 However, the application of graphene in designing modified electrodes is limited because of its weak dispersibility in most solvents as a result of strong π–π stacking and van der Waals interactions between the pure graphene nanosheets.4 On the other hand, the mentioned interactions accelerate the re-aggregation of graphene nanosheets and decrease the stability of graphene suspensions. The presence of dispersive reagents containing –OH and –COOH groups can effectively minimize this problem by increasing the hydrophilicity of the functionalized and defective graphene sheets thereupon producing graphene suspensions with long-term stability.5 Recently, hybrids of metal nanoparticles and graphene have found applications in electrochemical analysis due to their distinctive advantages such as ultra large effective surface area, mass transport enhancement, and catalysis.6,7 In addition, their high conductivity, which effectively accelerates the electron transfer between target molecule and electrode, and the adsorption ability of target analytes, with the aid of a strong π–π stacking interaction with aromatic rings, make them unique candidates for the modification of electrode surfaces in electroanalytical applications.8–11
Cephalosporins, used since 1948, are a large family of antibiotics manifesting a broad spectrum of antimicrobial and antibacterial activity.12 Based on their activity against penicillin-resistant microorganisms, they are administered for treatment of penicillinic-allergic patients.13 They show high intrinsic microbiological activities and a favorable safety profile, which made them applicable in antimicrobial therapy.14 Cefepime (Scheme 1), a fourth-generation parenteral cephalosporin, shows superior activity against Gram-positive and Gram-negative bacteria such as Pseudomonas aeruginosa, Nosocomial pneumonia, Febrile neutropenia, Staphylococcus aureus, Streptococcus pneumoniae and Pneumococci.15–17 It has been used since 1994 and manifested higher antibacterial activity than third-generation agents.18 In comparison to other cephalosporins, cefepime shows extra stability against β-lactamase enzymes produced by many bacteria, which provide strong activity towards Enterobacteriaceae, due to the combination of the syn-configuration of the methoxyimino moiety and the aminothiazolyl ring in its skeleton.19 However, prior to using these drugs in different formulations their purity and safety must be proved. On the other hand, appropriate analytical procedures are required in order to perform pharmacokinetic studies with sufficient speed.
 |
| | Scheme 1 Chemical structures of cefepime (CP). | |
In this study, according to previous works,20,21 the mixture of graphene nanosheets and carbon nanospheres (GNS–CNS) was prepared. The desired dispersibility and long time dispersion stability of GNS–CNS, due to the presence of carbon nanospheres, with a green preparation procedure, encouraged us to apply them for electrode modification. Taking into account the outstanding performances of graphene and Pt nanoparticles in electroanalysis, in this work we attempted to fabricate a PtNPs/GNS–CNS-modified glassy carbon electrode (GCE) for CP determination using the linear sweep voltammetry technique with outstanding qualities such as simple electrode preparation, wide linear range, low detection limit and remarkable stability of modifier suspension and modifier film on the electrode surface.
2. Experimental
2.1. Chemicals and reagents
Cefepime powder, (>99.0% purity), was purchased from Jaber Ebne Hayyan pharmaceutical Co. (Tehran, Iran). High purity graphite rods (99.999%) were purchased from Alfa Aesar. All other chemicals were of analytical reagent grade from Merck. In this work, a stock Britton–Robinson (BR) buffer solution was prepared which was 0.04 M of each of glacial acetic acid, orthophosphoric acid and boric acid. Buffer solutions of varying pH were then prepared by the addition of 0.2 M sodium hydroxide. All aqueous solutions were prepared with doubly distilled deionized water. Stock solutions of CP (100 μM) were prepared in BR buffer solution and kept in the dark in a refrigerator. The required concentration of CP in aqueous buffer solutions was then prepared from the stock solution diluted by 0.1 M of appropriate buffer solutions. Voltammetric experiments were carried out in the buffered solutions of CP, deoxygenated by purging with pure nitrogen gas (99.999% from Roham Gas Company). CP vials (2 g per vial), supplied by Loghman Pharmaceutical & Hygienic Co., was purchased from local pharmacies.
2.2. Apparatus
Voltammetric experiments were performed using a Metrohm potentiostat/galvanostat model 757VA. A conventional three-electrode system was used with a glassy carbon working electrode (unmodified or modified), an Ag/AgCl (saturated KCl) reference electrode and a Pt wire counter electrode. GCEs (d = 2.0 mm) were purchased from Azar electrode co, Urmia, I. R. Iran. The electrolysis of the graphite rod was performed at regulated DC power supply JPS-403D (Afzar Azma, Iran). A digital pH/mV/Ion meter (Metrohm, 827 pH lab) was used for preparation of the buffer solutions. The scanning electronic microscopy (SEM) and energy dispersive X-ray spectroscopy (EDS) were performed on a VEGA\\TESCAN SEM and RONTEC, QUANTAX, respectively. A Raman spectrum was obtained using a SENTERRA Dispersive Raman Microscope (BRUKER, Germany) with 785 nm diode laser excitation.
2.3. Preparation of GNS–CNS nano-mixtures
The mixture of GNS–CNS was synthesized according to a previous report.21 In brief, two high-purity graphite rods as electrodes were inserted into 2.0 M KNO3 solution prepared with the deionized water. First, a constant current of 0.2 A was applied to graphite electrodes for 2 h, and then the constant current was changed to 1.0 A, thereupon a lot of black precipitation was participated at the bottom of the reactor as a result of the rapid corrosion of the anode graphite rod. During the electrolysis process, strong oxidants such as hydroxyl (˙OH) and oxygen radicals (˙O), formed from oxidation of water, can attack the graphite edge planes to generate hydroxylation or carboxylation of graphite.22 Prior to the expansion of the graphite electrode, the corrosion process occurs initially at edge sites, grain boundaries, or defect sites. Moreover, NO3− can be reduced at the cathode to form NO2− and OH−.23 Then, the H+ or OH− or NO2− or NO3− in solution can intercalate the inter-lamination of the graphite anode to make it expand. Finally, the black slurry of graphene sheets and carbon nanospheres containing some hydroxyl and carboxyl groups (which are peeled off from expanded graphite) is prepared. After 3 h, the obtained precipitate was separated from the electrolyte solution, washed thoroughly with distilled water, and then dried at 60 °C in an oven for 6 h. The obtained product was named as GNS–CNS mixture.
2.4. Preparation of the modified GCE
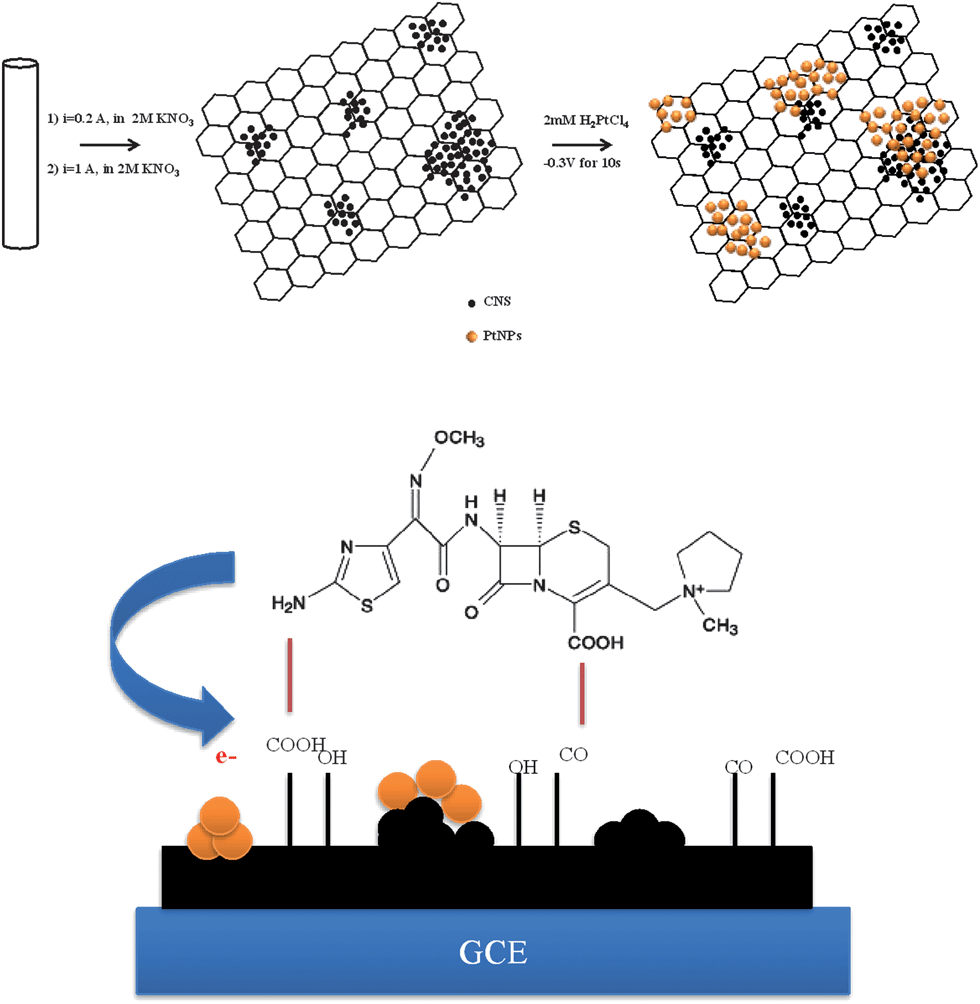
Before modification, the GCE was polished with 0.05 μm alumina slurry on a polishing cloth, rinsed thoroughly with water, and sonicated in water for 5 min. The modifier suspension was prepared by dispersing 5.0 mg of the GNS–CNS in 5.0 mL doubly distilled water under ultrasonication for 1 h. The modified GCE was prepared by casting 1 μL of GNS–CNS dispersion on the GCE surface using a micropipette and letting the solvent evaporate at 50 °C in an oven. The prepared electrode, denoted as GNS–CNS/GCE, was stored under ambient conditions. The PtNPs/GNS–CNS/GCE was fabricated by soaking the GNS–CNS/GCE in 0.5 M H2SO4 aqueous solution containing 2 mM hexachloroplatinic acid (H2PtCl6) and the electrochemical deposition of the PtNPs on the GNS–CNS/GCE surface through applying a potential of −0.3 V (versus Ag/AgCl as reference electrode) for 10 s. The Scheme 2 shows the preparation steps for the PtNPs/GNS–CNS/GCE. The PtNPs/GCE was also prepared in the same way by direct electrodeposition of PtNPs on the bare GCE surface. Before the voltammetric measurements, the modified electrode was cycled between 0.0 and 1.0 V (scan rate 100 mV s−1) in a BR buffer solution pH 5 for several times until reproducible responses were acquired. When required, renewal of the electrode surface was easily accomplished with the aforementioned process.
 |
| | Scheme 2 Schematic preparation of PtNPs/GNS–CNS. | |
3. Results and discussion
3.1. Morphological characterization of PtNPs/GNS–CNS/GCE
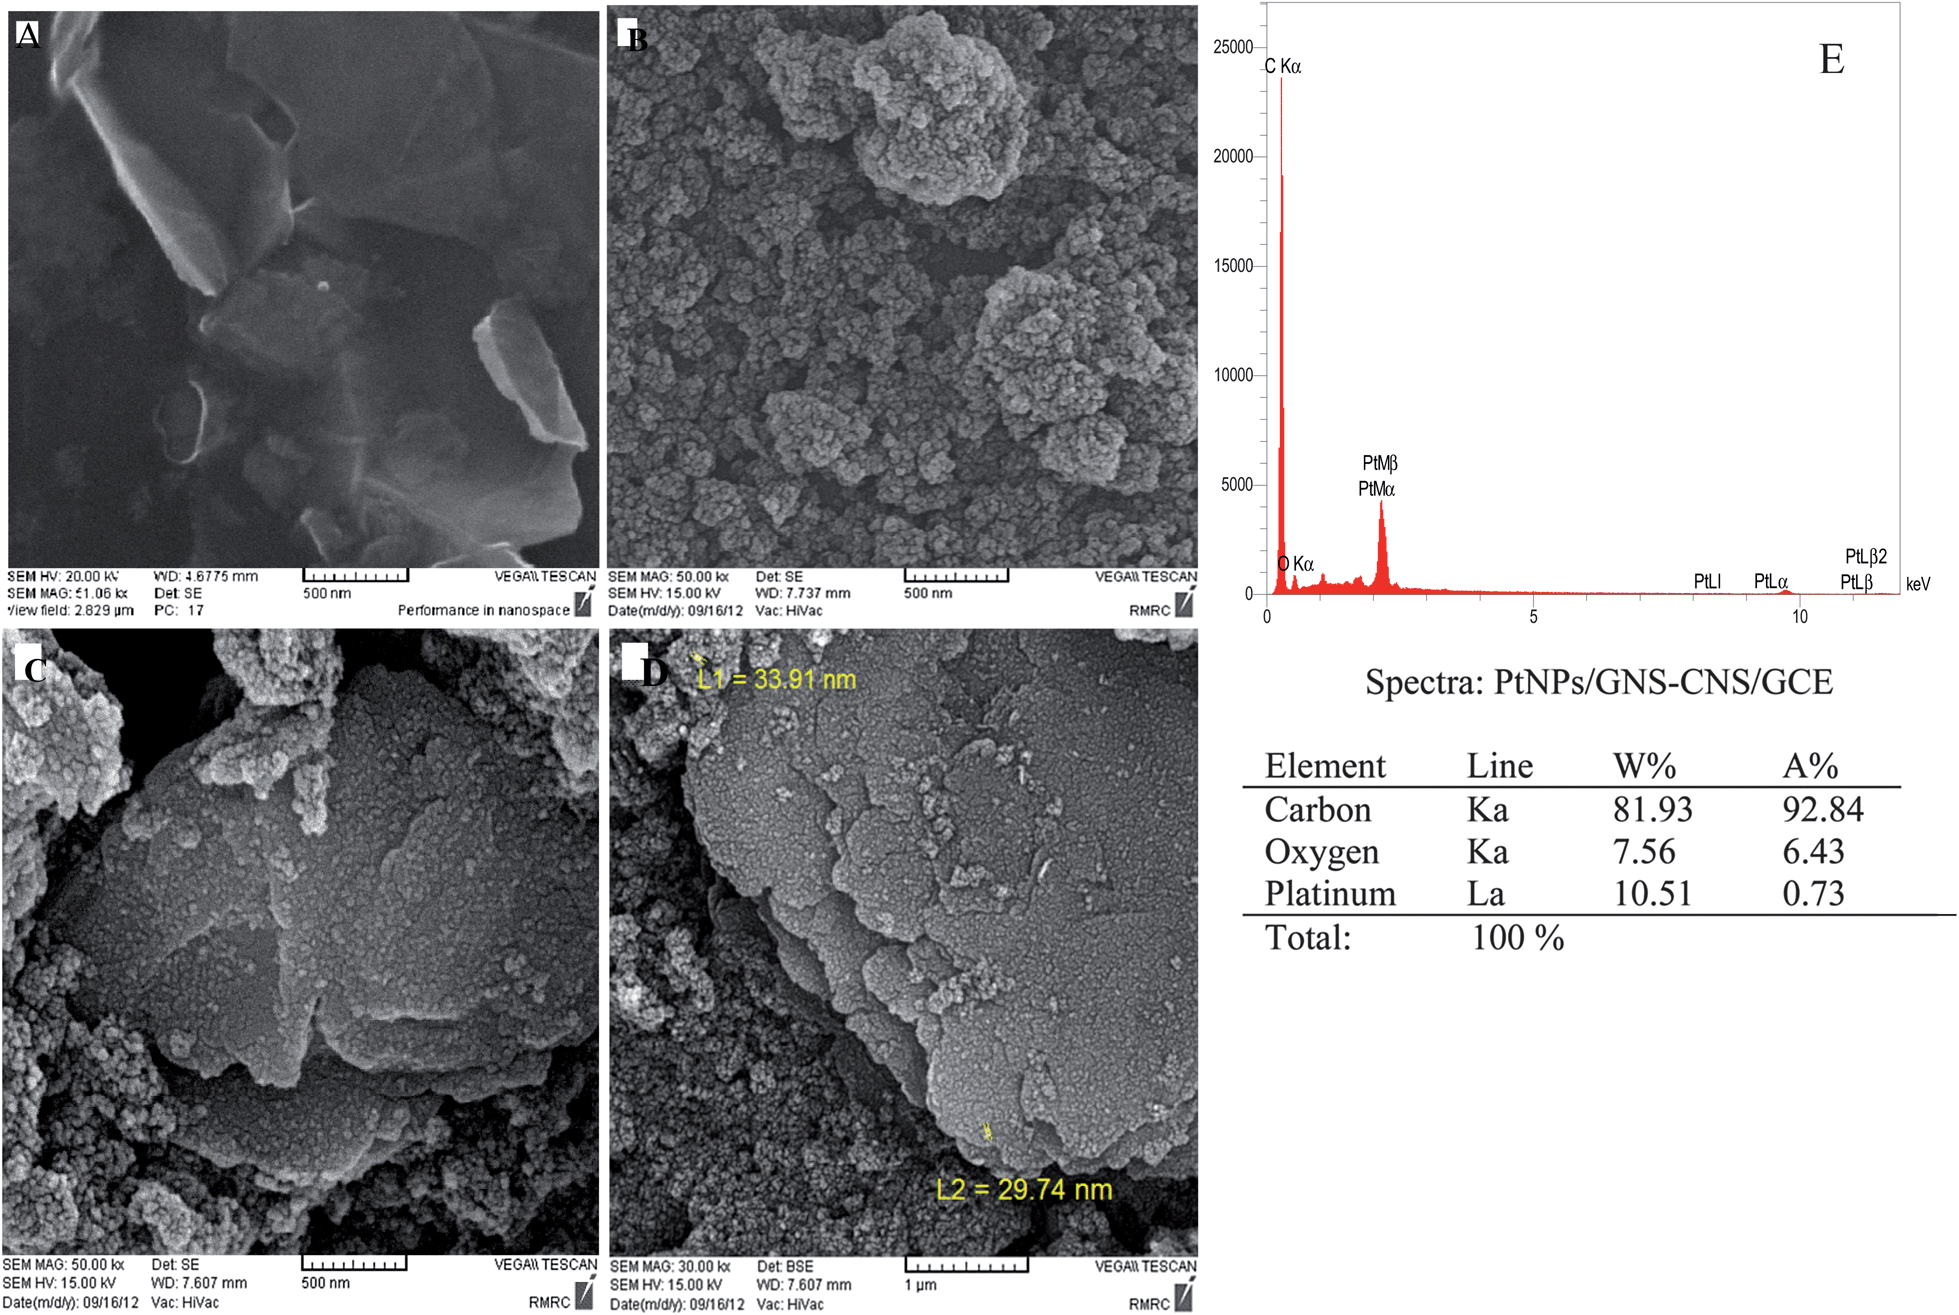
The morphology of GNS, CNS, GNS–CNS and PtNPs/GNS–CNS film coated on the surface of GCE can be seen in the Fig. 1. The Fig. 1A indicates flake-like shapes and wrinkled surface morphology for the graphene sheets. The SEM image of GNS–CNS/GCE (Fig. 1C) shows the typical layered structure of graphene sheets as well as aggregated carbon nanospheres in which, graphene sheets were coated with carbon nanospheres. From Fig. 1D, it is clearly observable that the deposited PtNPs, white dots, were uniformly covered the GNS–CNS. This image confirms successful preparation of PtNPs/GNS–CNS/GC modified electrode. Energy dispersive spectrometer (EDS) analysis was performed for evaluation of the elemental compositions for the PtNPs/GNS–CNS sample revealing the existence of 10.51 wt% of PtNPs (Fig. 1E). Also, Raman spectroscopy was employed to evaluate the synthesized GNS–CNS (Fig. S1†). Presence of the D band at 1320.92 cm−1, originating from sp3 hybridized carbon, as well as the G band at 1587.23 cm−1, related to in-phase vibration of the graphite lattice, in Raman spectrum confirms successful synthesis of graphene sheets.24,25
 |
| | Fig. 1 (A) SEM image of GNS (B) CNS (C) GNS–CNS (D) PtNPs/GNS–CNS/GCE SEM image and (E) the EDS pattern of PtNPs/GNS–CNS/GCE. | |
3.2. Electrochemical characterizations
The electrochemical response of PtNPs/GCE and PtNPs/GNS–CNS/GCE was investigated in purged N2 BR buffer solution pH 5.0 (Fig. S2†). A reduction peak was observed on the surface of the electrodes at about 0.02 V, which is corresponds to the reduction of platinum oxide species present on the surface of the modified electrode.26 An absence of mentioned reduction peak in CVs of bare GCE and GNS–CNS/GCE (under the same conditions), obviously confirms decoration of GNS–CNS/GCE with PtNPs (inset of Fig. S2†).
Afterward, the effective surface area of the differently modified electrodes were obtained by recording CVs of ferricyanide (K3Fe(CN)6) as a probe at different potential scan rates. By assuming reversibility and linear diffusion, the effective surface area (A) PtNPs/GNS–CNS/GCE, GNS–CNS/GCE for films was estimated based on the Randles-Sevcik equation:
| | |
Ip,a = (2.69 × 10⁵)n3/2D1/2υ1/2AC
| (1) |
where
n is the number of transferred electrons for the redox reaction (
n = 1),
D is the diffusion coefficient (6.70 (±0.02) × 10
−6 cm
2 s
−1),
C is the ferricyanide molar concentration (1 mM),
υ is the scan rate (V s
−1) and
A is the effective electrode surface area (cm
2). The surface area of the PtNPs/GNS–CNS/GCE, GNS–CNS/GCE PtNPs/GCE and the bare electrode were 0.574, 0.287, 0.143 and 0.039 cm
2, respectively. The obtained results illustrated that the microscopic area of the PtNPs/GNS–CNS/GCE was enhanced significantly compared to a bare electrode.
3.3. Electrochemical behaviors of CP on the various electrodes
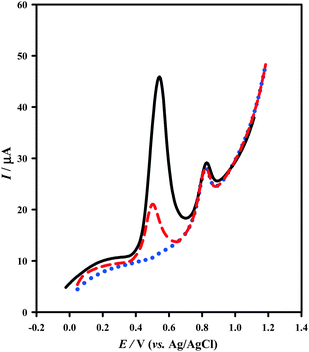
Cyclic voltammograms of 4 μM CP were recorded in BR buffer solution (pH = 5.0) at GCEs modified with PtNPs, GNS–CNS and PtNPs/GNS–CNS films, and also at the bare GCE at a scan rate of 100 mV s−1 (Fig. 2A). At the bare electrode, a very small anodic peak was found for CP within the potential window from 0.0 to 1.0 V. However, the peak current was enhanced approximately by a factor of 9, 3 and 13 at the GNS–CNS/GCE, PtNPs/GCE and PtNPs/GNS–CNS/GCE, respectively, compared to that at the bare GCE. By considering the slight shift in the peak potential, with respect to the bare GCE, the observed enhancement in voltammetric responses at modified electrodes is attributed to the increased electrode surface area and the adsorption of CP on the surface of the modified electrode as a consequence of the modifier coatings. In these experiments, no cathodic peak was observed for CP during the reverse scan, suggesting a totally irreversible behavior for the electrode process.
 |
| | Fig. 2 (A) CVs of 4 μM CP at the PtNPs/GNS–CNS/GCE (solid line  ), GNS–CNS/GCE (dotted line ), GNS–CNS/GCE (dotted line  ), PtNPs/GCE (dashed line ), PtNPs/GCE (dashed line  ) and GCE (double dot-dashed line ) and GCE (double dot-dashed line  ) in 0.04 M BR buffer solution (pH 5.0); scan rate 100 mV s−1 and accumulation time 250 s. (B) CVs of 4 μM CP at the PtNPs/GNS–CNS/GCE at different scan rates in 0.04 M BR buffer solution (pH 5.0). ) in 0.04 M BR buffer solution (pH 5.0); scan rate 100 mV s−1 and accumulation time 250 s. (B) CVs of 4 μM CP at the PtNPs/GNS–CNS/GCE at different scan rates in 0.04 M BR buffer solution (pH 5.0). | |
3.4. Optimization of experimental conditions
The nature of the electro-oxidation of CP occurring at the PtNPs/GNS–CNS/GCE was investigated by recording cyclic voltammograms of 4 μM CP in BR buffer solution (pH = 5.0) at various scan rates (10–240 mV s−1) (Fig. 3B). The log(Ip,a) was directly proportional to the log(ν) corresponding to eqn (1) (Fig. S3A†), which suggests an adsorption-controlled process on the surface of the modified electrode. On the other hand, a superior linearity was observed between Ep,a (the oxidation peak potential) and log(ν), eqn (2), as Ep,a shifted positively with increasing scan rate, which confirms an irreversible process for the electro-oxidation of CP at the modified electrode (Fig. S2B†).| |
log![[thin space (1/6-em)]](https://www.rsc.org/images/entities/char_2009.gif) Ip,a/μA = 0.8948logν/(V s−1) − 1.7183/μA, (R2 = 0.9948) Ip,a/μA = 0.8948logν/(V s−1) − 1.7183/μA, (R2 = 0.9948)
| (2) |
| | |
Ep,a/mV = 59.909logν/(mV s−1) + 678.48, (R2 = 0.9971)
| (3) |
 |
| | Fig. 3 (A) LSVs of 4 μM CP at the PtNPs/GNS–CNS/GCE in various pHs (from 2 to 8: 2.0, 3.0, 4.0, 5.0, 6.0, 7.0, 7.5, 8.0) of buffer solution, the dependence of (B) the oxidation peak potential (Ep,a) and (C) the oxidation peak current (Ip,a) on pH of the solution; scan rate 100 mV s−1 and accumulation time 250 s. | |
Regarding eqn (3) which has been reported by Wang27 for a totally irreversible electro-oxidation process, a value of 0.49 was obtained for the term (1 − α)na.
| | |
Ep,a/mV = (1/2)blogν/(mV s−1) + a, (b = 2.303RT/(1 − α)naF)
| (4) |
By considering α = 0.5, the value of na was estimated to be 1, which indicates that one electron is involved in the rate determining step of the electro-oxidation of CP.
It was observed that application of PtNPs/GNS–CNS nanocomposite as a modifier on the surface of GCE can significantly improve the electro-oxidation characteristics of CP. Both the kinetics of the electrode process and the mass transfer process through the modifier layer can be affected by the modifier thickness. Therefore, the amount of used nanocomposite should be optimized. Here, the modifier film thickness was controlled by casting various volumes of GNS–CNS suspension on the surface of GCE, and after electrodeposition of PtNPs on the electrode surface, the electrochemical response toward CP was studied via LSV. The results showed that the maximum electrode response can be achieved when 1 μL of the modifier suspension was cast on the surface of GCE (Fig. S4A†). Further increase caused an increase in background current with a gradual decrease in the electro-oxidation response of CP, which arises from the sluggish mass and electron transfer process through produced thick modifier film. As a result, 1 μL of modifier suspension was selected as an optimum volume for preparation of the modified electrode.
In the case of adsorption-controlled processes, applying an accumulation step works as a simple and effective way to improve the sensitivity of the determination. Regarding the adsorption behavior of CP at the PtNPs/GNS–CNS/GCE, its accumulation time under an open circuit was optimized in a buffered solution containing 4 μM of CP. By increasing accumulation time up to 250 s, the peak currents increased due to more adsorption of CP on the electrode surface (Fig. S4B†). Meanwhile, an accumulation time of more than 250 s leads to desorption of CP from the modified electrode, which decreased the peak current; thus, the optimal time was set at 250 s.
3.5. Influence of pH
The linear sweep voltammograms of the modified electrode in 4 μM CP at different pH values in the range of 2.0 to 8.0 were recorded (Fig. 3A). The peak potential shifted to less positive potentials with increasing pH (confirming participation of H+ in the oxidation process) corresponding to the eqn (5) (Fig. 3B).| | |
Ep,a (mV) = −38.8pH + 1016.4, (R2 = 0.9936, 8 points)
| (5) |
The resulting slope for variation of Ep versus pH indicates that the ratio of the electrons to the protons involved in the electro-oxidation of CP on the surface of the modified electrode is 2:1. Since the maximum peak current found at BR buffer solution with pH 5.0, this was used as a supporting electrolyte in all voltammetric determinations (Fig. 3C).
A few reports have dealt with oxidation and the anodic response of CP for its determination. As reported for the cephalosporins, the oxidation of this class of antibiotic is because of the oxidation of an aminothiazole substituent on their side chain in which amino group is oxidized by a one-electron step to the imino radical cation. Thus, the anodic peak appearing in the voltammogram can be related to the oxidation of this functional group.28–35 In the following step, coupling of the formed radicals and monomer could be accompanied by losing a proton.34
3.6. Linear sweep voltammetric (LSV) determinations
Under the optimized experimental conditions, the LSVs for various concentrations of CP were obtained on the surface of PtNPs/GNS–CNS/GCE (Fig. 4A). These showed that the oxidation peak currents were proportional to the CP concentrations in the range of 8.0 nM to 6.0 μM in 0.04 M BR buffer solution (pH 5.0), eqn (5), and the detection limit was estimated to be 1.2 nM (based on S/N = 3) (Fig. 4B).| | |
Ip,a/μA = 1.7472[CP]/μM + 0.2802, (R2 = 0.9981)
| (6) |
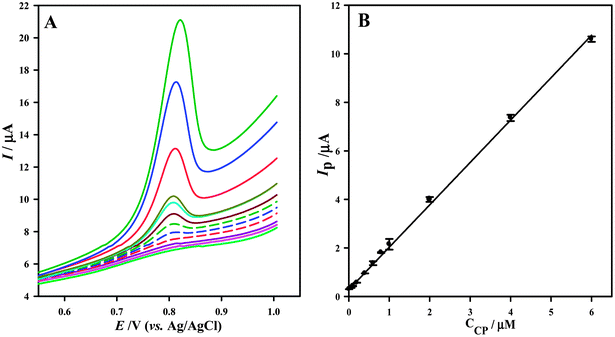 |
| | Fig. 4 (A) LSVs for various concentrations of CP in the range of (bottom to top), 8.0 nM to 6.0 μM in 0.04 M BR buffer solution (pH 5.0). (B) Corresponding linear calibration curve of peak current versus CP concentration; scan rate 100 mV s−1 and accumulation time 250 s. | |
Two effective factors in analytical applications, reproducibility and repeatability of the prepared electrode, were evaluated separately. The reproducibility of the modification procedure was examined by construction of four individual modified electrodes based on the same fabrication procedure. The RSD value for the peak current of 4 μM CP with prepared electrodes was obtained as 7.75%. In addition, the RSD of the LSV peak currents for 5 replicate measurements using the same electrode in 4 μM CP was 2.25%. These results confirm an acceptable reproducibility and repeatability of the fabricated modified electrode in both the preparation procedure and voltammetric determinations. Under the optimal experimental conditions, the modified electrode was applied for determination of 0.1 μM CP in the presence of 10 μM UA or AA. The results revealed that the presence of AA or UA causes no interference in the CP response. This confirms that the proposed method showed superior selectivity to the CP (Fig. 5).
 |
| | Fig. 5 LSVs of 0.1 μM CP ( ) and binary mixture of 0.1 μM CP and 10 μM UA ( ) and binary mixture of 0.1 μM CP and 10 μM UA ( ) or AA ( ) or AA ( ) at the PtNPs/GNS–CNS/GCE in 0.04 M BR buffer solution (pH 5.0) and accumulation time 250 s. ) at the PtNPs/GNS–CNS/GCE in 0.04 M BR buffer solution (pH 5.0) and accumulation time 250 s. | |
Various techniques have been reported for the analytical determination of CP in plasma and pharmaceutical formulations including: high performance liquid chromatography (HPLC),36–41 liquid chromatography-tandem mass spectrometry (LC-MS/MS),42 capillary zone electrophoresis (CZE),43 micellar electrokinetic chromatography (MEKC) with UV detection,44 spectrophotometry,45–47 and also, electrochemistry.34,48–51 Table 1 illustrates the results of the detection limit and linear range obtained for CP determinations using various methods. In comparison to the previous works, the electro-analytical procedure in the present work exhibits a very low detection limit as well as a wide linear range. Furthermore, PtNPs/GNS–CNS/GCE presents the remarkable advantages such as high sensitivity, high stability, relatively short analysis times, simplicity in practice and low cost. Therefore, the prepared modified electrode can be considered as a suitable alternative to the mentioned methods for the determination CP.
Table 1 Comparison of performance of various analytical methods for CP determination
| Method |
Linear range (μM) |
Detection limit (μM) |
References |
| High performance liquid chromatography. Liquid chromatography-tandem mass spectrometry (LC-MS/MS). Capillary zone electrophoresis. Micellar electrokinetic chromatography (MEKC). Carbone electrode. Hanging mercury drop electrode (HMDE). Pt microelectrodes. Solid silver mercury amalgam electrodes (AgSAEs). |
| HPLCa |
1.04–416 |
0.21 |
36 |
| HPLC |
1.04–1040 |
0.31 |
37 |
| HPLC |
2.08–104 |
1.73 |
38 |
| HPLC |
1.04–208 |
0.42 |
39 |
| HPLC |
0–418 |
1.04 |
40 |
| HPLC |
20–416 |
2.1 |
41 |
| LC-MS/MSb |
0.208–104 |
0.104 |
42 |
| CZEc |
118–1188 |
4.16 |
43 |
| MEKCd |
10.4–208 |
4.18 |
44 |
| Spectrophotometry |
10–83 |
— |
45 |
| Spectrophotometry |
10.4–104 |
— |
46 |
| Spectrophotometry |
0.58–15.0 |
— |
47 |
| Electrochemistry using CEe |
1.0–100 |
— |
34 |
| Electrochemistry using HMDEf |
0.001–0.1 |
0.00048 |
48 |
| Electrochemistry using PtMEg |
20–150 |
15 |
49 |
| Electrochemistry using HMDE |
0.085–15.0 |
0.046 |
50 |
| Electrochemistry using AgSAEsh |
0.3–2.1 |
0.00851 |
51 |
| Electrochemistry using PtNPs/GNS–CNS/GCE |
0.008–6.0 |
0.0012 |
This work |
3.7. Analytical applications
3.7.1. Determination of CP in pharmaceutical preparations. The PtNPs/GNS–CNS/GCE was employed for determination of CP content in pharmaceutical preparations to evaluate the applicability and reliability of the proposed method. Ampoules containing a labeled amount of 2.0 g CP were precisely weighted and dissolved in the 0.04 M BR buffer solution (pH 5.0), filtered into a 500 mL volumetric flask and diluted with the same BR buffer solution. Afterward, a desired portion of the prepared solution was transferred to a 25 mL volumetric flask and spiked with the standard CP solution in the range of 0.5–6.0 μM. Fig. S5† shows the LSVs for various spiked solutions of CP and the corresponding calibration plot of the peak current vs. the CP concentration. The following equation represents the obtained linear relationship:| | |
Ip,a/μA = 1.482[CP]/μM + 0.627, (R2 = 0.995)
| (7) |
By employing the standard addition method, the CP content was determined to be 1.97 g with a RSD of 3.01% (n = 2) per ampoules, which is very close to the labeled amount of 2.0 g CP per ampoules. Additionally, the recovery range between 95.88% and 102.01% was obtained for different concentrations of the spiked CP to the pharmaceutical solutions. According to the obtained results, the ampoules matrix causes no significant interference with the accurate electrochemical determination of CP, which confirms applicability of proposed method for the determination of CP in pharmaceutical samples.
3.7.2. Determination of CP in human blood serum. Fresh frozen plasma samples were obtained from Iranian Blood Transfusion Organization and stored frozen until the assay time. First, methanol was added to the plasma sample (2% v/v) and mixed thoroughly to precipitate the blood proteins, which were separated by centrifuging at 10000 rpm for 10 min. Next, the resulting clear supernatant was diluted 10 times with BR buffer solution (pH 5.0). Finally, the diluted serum sample was spiked in different amounts of standard CP and the LSV were recorded using the modified electrode (Table 2). The results of recovery evaluations showed an average recovery of 93.85% for CP added to the serum samples.
Table 2 Results of the recovery analysis of CP spiked in human serum samples
| No. |
Spiked (μM) |
Founda (μM) |
Recovery (%) |
| Average of three replicate measurements (rounded). |
| 1 |
6 |
5.96 |
99.43 |
| 2 |
4 |
3.58 |
89.42 |
| 3 |
3 |
2.93 |
97.67 |
| 4 |
0.8 |
0.73 |
91.01 |
| 5 |
0.4 |
0.37 |
91.70 |
4. Conclusions
In this study, a novel electrochemical sensor with high sensitivity based on the PtNPs/GNS–CNS/GCE was constructed for the voltammetric determination of CP. The synergistic effects of the high electronic conductivity and specific surface area of PtNPs and GNS–CNS were applied to improve the current response and the sensitivity of the sensor. The prepared electrode showed remarkable adsorption ability as a result of π–π interactions between GNSs and CP molecules which significantly improved the peak current of CP. The excellent sensitivity (d(Ip,a(CP))/d[CP] = 1.7472 μA μM−1), high reproducibility and improved detection limit (LOD (CP) = 1.2 nM) of the PtNPs/GNS–CNS/GCE together with its facile and low cost preparation strategy are promising for the determination of trace amounts of CP in pharmaceutical and clinical preparations.
Acknowledgements
The authors gratefully acknowledge the support of this work by the Research Council and the Center of Excellence for Nanostructures of the Sharif University of Technology, Tehran, Iran.
References
- K. S. Novoselov, A. K. Geim, S. V. Morozov, D. Jiang, Y. Zhang, S. V. Dubonos, I. V. Grigorieva and A. A. Firsov, Science, 2004, 306, 666–669 CrossRef CAS PubMed.
- A. K. Geim and K. S. Novoselov, Nat. Mater., 2007, 6, 183–191 CrossRef CAS PubMed.
- C. Nethravathi and M. Rajamathi, Carbon, 2008, 46, 1994–1998 CrossRef CAS PubMed.
- J. Liu, J. Tang and J. J. Gooding, J. Mater. Chem., 2012, 22, 12435–12452 RSC.
- S. Choudhary, H. P. Mungse and O. P. Khatri, J. Mater. Chem., 2012, 22, 21032–21039 RSC.
- J. Tang, D. Tang, Q. Li, B. Su, B. Qiu and G. Chen, Anal. Chim. Acta, 2011, 697, 16–21 CrossRef CAS PubMed.
- B. Luo, S. Xu, X. Yan and Q. Xue, Electrochem. Commun., 2012, 23, 72–75 CrossRef CAS PubMed.
- S. K. Kim, D. Kim and S. Jeon, Sens. Actuators, B, 2012, 174, 285–291 CrossRef CAS PubMed.
- Y. Li, L. Tang and J. Li, Electrochem. Commun., 2009, 11, 846–849 CrossRef CAS PubMed.
- D. Lu, S. Lin, L. Wang, X. Shi, C. Wang and Y. Zhang, Electrochim. Acta, 2012, 85, 131–138 CrossRef CAS PubMed.
- B. Unnikrishnan, S. Palanisamy and S.-M. Chen, Biosens. Bioelectron., 2013, 39(1), 70–75 CrossRef CAS PubMed.
- D. Yahav, M. Paul, A. Fraser, N. Sarid and L. Leibovici, Lancet Infect. Dis., 2007, 7(5), 338–348 CrossRef CAS.
- K. Balaji, K. Reddaiah, T. M. Reddy and S. R. J. Reddy, Port. Electrochim. Acta, 2011, 29(3), 177–185 CrossRef CAS.
- P. Garzone, J. A. Lyon and V. L. Yu, Drug Intell. Clin. Pharm., 1983, 17, 507–515 CAS.
- R. H. Barbhaiya, C. A. Knupp, S. T. Forgue, G. R. Matzke, C. E. Halstenson, J. A. Opsahl and K. A. Pittman, Drug Metab. Dispos., 1991, 19, 68–73 CAS.
- R. E. Hancock and F. Bellido, J. Antimicrob. Chemother., 1992, 29(Suppl A), 1–6 CrossRef CAS PubMed.
- T. M. Chapman and C. M. Perry, Am. J. Respir. Med., 2003, 2(1), 75–107 CrossRef CAS.
- L. B. Barradell and H. M. Bryson, Drugs, 1994, 47(3), 471–505 CrossRef CAS PubMed.
- H. S. Sader, A. Hsiung, T. R. Fritsche and R. N. Jones, Diagn. Microbiol. Infect. Dis., 2007, 57, 341–344 CrossRef CAS PubMed.
- M. Ghalkhani and S. Shahrokhian, Sens. Actuators, B, 2013, 185, 669–674 CrossRef CAS PubMed.
- J. Wang, H. Yin, X. Meng, J. Zhu and S. Ai, J. Electroanal. Chem., 2011, 662, 317–321 CrossRef CAS PubMed.
- J. Lu, J. Yang, J. Wang, A. Lim, S. Wang and K. P. Loh, ACS Nano, 2009, 3, 2367–2375 CrossRef CAS PubMed.
- M. Bergmann and J. Rollin, Catal. Today, 2007, 124, 198–203 CrossRef CAS PubMed.
- J. M. Jian, Y. Y. Liu, Y. L. Zhang, X. S. Guo and Q. Cai, Sensors, 2013, 13, 13063–13075 CrossRef PubMed.
- M. Chao, X. Ma and X. Li, Int. J. Electrochem. Sci., 2012, 7, 2201–2213 CAS.
- Y. Song, Y. Ma, Y. Wang, J. Di and Y. Tu, Electrochim. Acta, 2010, 55, 4909–4914 CrossRef CAS PubMed.
- J. Wang, Analytical Electrochemistry, John Wiley & Sons, Inc., Hoboken, New Jersey, 3rd edn, 2006, ch. 2, p. 34 Search PubMed.
- E. Bishop and W. Hussein, Analyst, 1984, 109, 913–915 RSC.
- M. D. Blanchin, W. Th. Kok and H. Fabre, Chromatographia, 1984, 24, 625–627 Search PubMed.
- A. Golcu, B. Doganb and S. Ozkanb, Talanta, 2005, 67, 703–712 CrossRef CAS PubMed.
- R. Ojani, J. Raoof and S. Zamani, Talanta, 2005, 81, 1522–1528 CrossRef PubMed.
- H. Ciftci, H. N. Testereci and Z. Oktem, Polym. Bull., 2011, 66, 747–776 CrossRef CAS PubMed.
- R. N. Goyal, A. Minocha and A. P. Nautiya, J. Electroanal. Chem., 1986, 200, 119–125 CrossRef CAS.
- S. A. Özkan, B. Uslu and P. Zuman, Anal. Chim. Acta, 2002, 457, 265–274 CrossRef.
- S. Shahrokhian, N. Hosseini-Nassab and Z. Kamalzadeh, J. Solid State Electrochem., 2014, 18, 77–88 CrossRef CAS PubMed.
- D. Breilh, C. Lavallee, A. Fratla, D. Ducint, P. Cony-Makhoul and M. C. Saux, J. Chromatogr. B: Biomed. Sci. Appl., 1999, 734(1), 121–127 CrossRef CAS.
- B. Caloharra, M. A. Campanero, B. Sadaba and J. R. Azana, Biomed. Chromatogr., 1999, 13(4), 272–275 CrossRef.
- F. N. Valassis, M. Parissi-Poulau and P. Mecharas, J. Chromatogr. B: Biomed. Sci. Appl., 1999, 721(2), 249–255 CrossRef.
- N. Cheriti, J. M. Kinowski, J. Y. Lefrant and F. Bressolle, J. Chromatogr. B: Biomed. Sci. Appl., 2001, 754(2), 377–386 CrossRef.
- T. Kitahashi and I. Furuta, Curr. Pharm. Anal., 2006, 2, 17–21 CrossRef CAS.
- J. A. Ocaña González, F. J. Jiménez Palacios, M. CallejónMochón and F. J. Barragán de la Rosa, J. Pharm. Biomed. Anal., 2004, 36, 117–123 CrossRef PubMed.
- T. Ohmori, A. Suzuki, T. Niwa, H. Ushikoshi, K. Shirai, S. Yoshida, S. Ogura and Y. Itoh, J. Chromatogr. B: Anal. Technol. Biomed. Life Sci., 2011, 879, 1038–1042 CrossRef CAS PubMed.
- H. Liu and V. B. Sundarland, J. Liq. Chromatogr. Relat. Technol., 2005, 27(19), 3065–3076 CrossRef PubMed.
- Y. R. Chen, S. J. Lin, Y. W. Chou, H. L. Wu and S. H. Chen, J. Sep. Sci., 2005, 28, 2173–2179 CrossRef CAS.
- D. Gowarisankar, M. V. Krishna, D. V. S. P. Kumar and P. V. M. Latha, Asian J. Chem., 2005, 17(3), 2028–2030 Search PubMed.
- A. Raval, B. Patel, J. Patel, K. Parmar and M. Patel, IJPI's Journal of Analytical Chemistry, 2011, 1(2), 7–11 Search PubMed.
- D. M. Chafle, Pharma Chem., 2013, 5(2), 127–132 CAS.
- F. J. Palacios, M. C. Moehon, J. C. Sancher and J. H. Carranza, J. Pharm. Sci., 2003, 92(99), 1854–1859 CrossRef CAS PubMed.
- P. Nigam and H. C. Joshi, Instrum. Sci. Technol., 2010, 38(5), 376–383 CrossRef CAS.
- K. Balaji, K. Reddaiah, T. M. Reddy and S. R. J. Reddy, Port. Electrochim. Acta, 2011, 29(3), 177–185 CrossRef CAS.
- A. M. J. Barbosa, T. A. de Araujo, M. A. G. Trindade and V. S. Ferreira, J. Electroanal. Chem., 2012, 681, 127–132 CrossRef CAS PubMed.
Footnote |
| † Electronic supplementary information (ESI) available. See DOI: 10.1039/c3ra44309d |
|
| This journal is © The Royal Society of Chemistry 2014 |
Click here to see how this site uses Cookies. View our privacy policy here. 

 ), GNS–CNS/GCE (dotted line
  ), PtNPs/GCE (dashed line
  ) and GCE (double dot-dashed line
  ) in 0.04 M BR buffer solution (pH 5.0); scan rate 100 mV s−1 and accumulation time 250 s. (B) CVs of 4 μM CP at the PtNPs/GNS–CNS/GCE at different scan rates in 0.04 M BR buffer solution (pH 5.0).


 ) and binary mixture of 0.1 μM CP and 10 μM UA (
 ) or AA (
 ) at the PtNPs/GNS–CNS/GCE in 0.04 M BR buffer solution (pH 5.0) and accumulation time 250 s.