 Open Access Article
Creative Commons Attribution 3.0 Unported Licence
Thermal deprotonation and condensation of melamine in the presence of indium(III)chloride†
Elaheh
Bayat
a,
Markus
Ströbele
 a,
David
Enseling
b,
Thomas
Jüstel
 b and
H.-Jürgen
Meyer
 *a
*a
aSection for Solid State and Theoretical Inorganic Chemistry, Institute of Inorganic Chemistry, University of Tübingen, Auf der Morgenstelle 18, 72076 Tübingen, Germany. E-mail: juergen.meyer@uni-tuebingen.de
bDepartment of Chemical Engineering, Münster University of Applied Science, Stegerwaldstraße 39, 48565 Steinfurt, Germany
First published on 18th June 2024
Abstract
The thermal condensation of melamine into molecules melam, melem, and the one-dimensional polymer melon has already been reported. An interesting question arises about the impact of other compounds being present in this process of thermal conversion. The solid-state reaction of C3N6H6 with InCl3 leads to a novel compound featuring deprotonated melam units in a supramolecular assembly, based on the [C12N20H8]4− anion that is interconnected in the structure via N–In–N bonding. The reaction pathway of the formation of this compound is investigated by thermal analysis and the crystal structure of unique (NH4)[(InCl2)3(C12N20H8)]·⅔[InCl3(NH3)] is reported as well as its photoluminescence properties.
Introduction
Melamine, also known as 2,4,6-triamino-s-triazine, was first discovered by the German chemist Justus von Liebig in the 1830s.1 Commercial manufacture of urea increased its widespread availability.2–4 Later, in the early twentieth century, the recognition of its properties, particularly its thermal stability, contributed to a better understanding of the compound. Although Liebig and Gmelin1,5 initially proposed the condensation product of melamine, known as heptazine compounds, only elemental analysis was performed during that period.4,6,7The exact molecular structure of these compounds was later proposed by Linus Pauling about a century ago.8 In the subsequent studies, conducted by various scientists,9,10 the mechanism of the condensation reactions was explored, leading to the characterization of intermediates such as melam, melem, and melon formed during thermal treatment. B. Lotsch's investigations further disclosed that melem and melam could be obtained by heating melamine, cyanamide, dicyanamide, or ammonium cyanamide.11 This implies that at slightly elevated temperatures, any of these precursors have the potential to transform into melamine. Moreover, the formation of melem was previously postulated by May,12 who elucidated a decomposition process in which some melamine is decomposed to produce cyanamide at temperatures ranging from 300 to 320 °C. Following this, cyanamide condenses with melamine, giving rise to the formation of melam, and subsequently melem, by eliminating two ammonia molecules.12
Melem and melemium salts are famous for their potential as highly effective flame retardants,13 excellent polymer compatibility, and their status as halogen-free compounds.6 However, melem faces limitations in practical applications due to its insolubility and chemical stability.6 Despite these challenges, melem can be dissolved in mineral acid solutions to isolate melemium salts such as melem-phosphoric acid adducts C6N7(NH2)3·H3PO4,14 melemium perchlorate [HC6N7(NH2)3]ClO4·H2O,14 melemium-melem perchlorate HC6N7(NH2)3ClO4·C6N7(NH2)3,15etc.
Recent investigations propose that the formation of melam is dependent on specific heating conditions, including temperature, pressure, and duration.16,17 Furthermore, melam is only stable in a small temperature range. Notably, it is recognized as a minor by-product in the condensation of melamine to melem, observed under specific conditions.17–19 The crystal structure of this intermediate has recently been characterized,17,20 indicating its potential significance in the development of new compounds with applications extending beyond flame retardancy. Several groups of melam-based compounds have been identified, including melamium salts such as melamium perchlorate (C6N11H11(ClO4)2·2H2O),21 melamium bromide (C6N11H10Br),3,22 melamium iodide (C6N11H10I),22 and melamium chloride ammonium chloride (C6N11H10Cl0.5NH4Cl).20 Additionally, melamium adduct compounds like melamium thiocyanate melamine (C6N11H10SCN·2C3N6H6)23 and melamium thiocyanate melam (1![[thin space (1/6-em)]](https://www.rsc.org/images/entities/char_2009.gif) :
:![[thin space (1/6-em)]](https://www.rsc.org/images/entities/char_2009.gif) 1) adduct (C6N11H10SCN·C6N11H9) have been discovered.3 Our research group has also uncovered new sets of compounds involving LiBr-melam, LiI-melam, CuX (Cl, Br, I)-melam, Cu3Cl2-melam, and Cu3Cl3-melam.24 These compounds exhibit a distinctive feature where a metal halide is linked to inner nitrogen atoms in all structures. Furthermore, in the latter two structures, (Cu3Cl2-melam, and Cu3Cl3-melam), outer nitrogen atoms are also connected to metal halides. These findings introduce a new array of metal-containing melam compounds, suggesting potential applications across a wide spectrum of chemistry25 and biochemistry.26
1) adduct (C6N11H10SCN·C6N11H9) have been discovered.3 Our research group has also uncovered new sets of compounds involving LiBr-melam, LiI-melam, CuX (Cl, Br, I)-melam, Cu3Cl2-melam, and Cu3Cl3-melam.24 These compounds exhibit a distinctive feature where a metal halide is linked to inner nitrogen atoms in all structures. Furthermore, in the latter two structures, (Cu3Cl2-melam, and Cu3Cl3-melam), outer nitrogen atoms are also connected to metal halides. These findings introduce a new array of metal-containing melam compounds, suggesting potential applications across a wide spectrum of chemistry25 and biochemistry.26
Exploring the realm of C/H/N chemistry, melamine, protonated melamine, and melaminate compounds present intriguing aspects.27,28 Melamine exhibits the ability to coordinate with metal halides, forming compounds like [Cu3Cl3(C3N6H6)]n,29 [Cu2Br2(C3N6H6)]n,29 the silver complex [Ag(C3N6H6)(H2O)(NO3)]n,30 [Ag(C3H6N6)]NO3,31 and the mercury compound (C3N6H7)(C3N6H6)HgCl3.25 However, compounds involving deprotonated melamine are of heightened interest compared to these adducts. Noteworthy examples include K(C3N6H5)·NH3, Rb(C3N6H5)·½NH3,32 K3(C3N6H3),33 Cu3(C3N6H3),27 SbCl4(C9N18H19), (SbCl4(C6N12H13))2, and SbCl(C3N6H4).28
In this context, we present a new compound featuring melam units in a captivating supramolecular porphyrin-like design with indium chloride. We have investigated the solid-state synthesis, infrared (IR) spectroscopy, stability assessed through thermogravimetric analysis (TGA), stability in air, X-ray diffraction (XRD), crystal structure analysis, and photoluminescent properties of this compound. This exploration establishes an unprecedented avenue for the development of additional compounds that could hold significant applications. Additionally, it offers novel insights into the chemistry of melamine, and melam-based compounds, revealing their potential to be deprotonated and used as a ligand.
Results and discussion
The new compound (NH4)[(InCl2)3(C12N20H8)]·⅔[InCl3(NH3)] and the hitherto unknown side-phases of (NH4)2[InCl5(NH3)], and (NH4)3InCl6 are obtained on heating equimolar amounts of indium(III) chloride and melamine at 250 °C. The inner nitrogen (1) atoms of melam (shown in Scheme 1a) form connections with an indium atom in the center of the ring-shaped molecule (Scheme 1b). Two terminal nitrogen atoms (2) are completely deprotonated and interconnect two melam units and form N–In bonding displayed in Fig. 1, while the remaining nitrogen atom (3) undergoes complete deprotonation, forming N–In bonding instead. Alternatively, one can envision this structure as comprising four melaminate units (deprotonated four times), interconnected through nitrogen linkages, resembling a porphyrin-like assembly (Scheme 1b). The side phases sublimed off during the reaction and were removed from the main product. All crystal structures were refined by single-crystal X-ray refinement.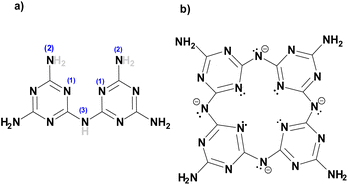 | ||
| Scheme 1 (a) Structure of melam (C6N11H9) with H atoms that are subjected to deprotonation drawn in grey and (b) the [C12N20H8]4− anion centered and surrounded by indium atoms. | ||
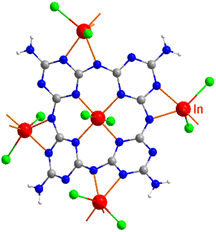 | ||
| Fig. 1 Surrounding and connectivity of the (C12N20H8)4− ion with indium(III) ions as [(InCl2)(InCl2)4/2(C12N20H8)]− (In is shown red, Cl green, C gray, and N in blue). | ||
Crystal structure
The crystal structure of (NH4)[(InCl2)3(C12N20H8)]· ⅔[InCl3(NH3)] was solved and refined with a transparent yellow single-crystal based on X-ray diffraction data in the cubic space group I![[4 with combining macron]](https://www.rsc.org/images/entities/char_0034_0304.gif) 3d (Table 1). The characteristic motif in the structure is the molecular [C12N20H8]4− anion that is interconnected by indium atoms into a three-dimensional network structure. Indium(III) ions in the [(InCl2)(InCl2)4/2(C12N20H8)]− fragment are surrounded octahedrally in two different ways. One type of indium is centered within the [C12N20H8]4− ion and four indium atoms surrounding the [C12N20H8]4− ion having distorted octahedral (–N)4-InCl2 arrangements, displayed in Fig. 1. Indium in the center of the (C12N20H8)4− anion is connected by dative bonding coming from the electron pairs of four nitrogen atoms, and two chloride ligands in the trans position. Four other indium atoms are showing cis-arrangements of their (–N)4InCl2 polyhedra, thereby inducing a tilted –N–In–N– connectivity between adjacent (C12N20H8)4− moieties in the structure (Fig. 2).
3d (Table 1). The characteristic motif in the structure is the molecular [C12N20H8]4− anion that is interconnected by indium atoms into a three-dimensional network structure. Indium(III) ions in the [(InCl2)(InCl2)4/2(C12N20H8)]− fragment are surrounded octahedrally in two different ways. One type of indium is centered within the [C12N20H8]4− ion and four indium atoms surrounding the [C12N20H8]4− ion having distorted octahedral (–N)4-InCl2 arrangements, displayed in Fig. 1. Indium in the center of the (C12N20H8)4− anion is connected by dative bonding coming from the electron pairs of four nitrogen atoms, and two chloride ligands in the trans position. Four other indium atoms are showing cis-arrangements of their (–N)4InCl2 polyhedra, thereby inducing a tilted –N–In–N– connectivity between adjacent (C12N20H8)4− moieties in the structure (Fig. 2).
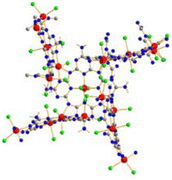 | ||
| Fig. 2 Section of the structure showing the tilted connectivity pattern between one (C12N20H8)4− unit with four adjacent ones via –N–In–N– bonding. | ||
| Empirical formula | C36 N71H66 In11Cl24 |
| CCDC | 2333063 |
| Formula weight (g mol−1) | 3607.41 |
| Wavelength (Cu-Kα) (Å) | 1.54184 |
| Crystal system | Cubic |
| Space group |
I![[4 with combining macron]](https://www.rsc.org/images/entities/char_0034_0304.gif) 3d 3d |
| Unit cell dimensions (Å) | 28.1902(2) |
| Volume (Å3) | 22402.4(5) |
| Z | 8 |
| Density (calculated) (g cm−3) | 2.139 |
| Absorption coefficient (mm−1) | 23.580 |
| Final R indices (I > 2σ(I)a) | R 1 = 0.0284, wR2 = 0.0792 |
| R indices (all data) | R 1 = 0.0296, wR2 = 0.0798 |
| GOOF | 1.058 |
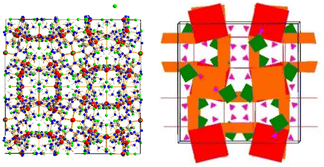
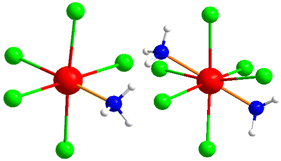
The bridging connectivity of indium(III) ions in the structure involves In–N distances ranging between 204.2(2) pm and 228.1(6) pm. This connectivity leads to a complex structure, in which one central moiety connects to four adjacent [C12N20H8]4− moieties and so on. The ammonium ions and [InCl3(NH3)] molecules occupy voids in the arrangement of the (NH4)[(InCl2)3(C12N20H8)]− network, as shown in Fig. 3 on the right. These molecules are very similar to those of the obtained side phase in the reaction, which is characterized as (NH4)2[InCl5(NH3)], with its [InCl5(NH3)]2− ion displayed in Fig. 4, in comparison to the neutral [InCl3(NH3)] in the title compound. The crystal structure of the side phase (NH4)2[InCl5(NH3)] consists of indium, coordinated to five chloride ions and one ammonia molecule, arranged in a distorted octahedral geometry, with ammonium ions serving as counter ions to balance the charge. In the other side phase ((NH4)3InCl6), indium is coordinated to six chloride ions and three ammonium ions act as counterions.
Thermoanalytic studies
The reaction of a 1.2![[thin space (1/6-em)]](https://www.rsc.org/images/entities/char_2009.gif) :
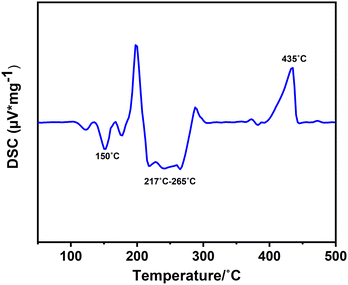
:![[thin space (1/6-em)]](https://www.rsc.org/images/entities/char_2009.gif) 1 molar mixture of InCl3 and melamine was examined through differential scanning calorimetry (DSC) at a heating and cooling rate of 2 °C min−1 within the temperature range from room temperature to 500 °C (Fig. 5). The DSC curve revealed two distinct exothermic regions at 150 °C and a broad peak at around 217–265 °C, each indicative of a reaction between the reactants. To discern each reaction, we interrupted the process at each peak and studied the X-ray diffraction (XRD) patterns obtained from each experiment. The first peak at around 150 °C shows the formation of intermediate unknown phases. Multiple exothermic peaks in the range of 217–265 °C indicate the formation of the (NH4)[(InCl2)3(C12N20H8)]·⅔[InCl3(NH3)] compound, and the side phases of (NH4)2[InCl5(NH3)] and (NH4)3InCl6. It's important to note that there are also multiple peaks within this temperature range, which can be assigned to by-products produced at this temperature range. These side phases could be separated by temperature gradient. The decomposition of the product is evident at the endothermic peak (435 °C) and has been further analysed in the TGA and stability sections.
1 molar mixture of InCl3 and melamine was examined through differential scanning calorimetry (DSC) at a heating and cooling rate of 2 °C min−1 within the temperature range from room temperature to 500 °C (Fig. 5). The DSC curve revealed two distinct exothermic regions at 150 °C and a broad peak at around 217–265 °C, each indicative of a reaction between the reactants. To discern each reaction, we interrupted the process at each peak and studied the X-ray diffraction (XRD) patterns obtained from each experiment. The first peak at around 150 °C shows the formation of intermediate unknown phases. Multiple exothermic peaks in the range of 217–265 °C indicate the formation of the (NH4)[(InCl2)3(C12N20H8)]·⅔[InCl3(NH3)] compound, and the side phases of (NH4)2[InCl5(NH3)] and (NH4)3InCl6. It's important to note that there are also multiple peaks within this temperature range, which can be assigned to by-products produced at this temperature range. These side phases could be separated by temperature gradient. The decomposition of the product is evident at the endothermic peak (435 °C) and has been further analysed in the TGA and stability sections.
X-ray powder diffraction
As part of the investigation into reaction products, we conducted a PXRD analysis. The XRD pattern for (NH4)[(InCl2)3 (C12N20H8)]·⅔[InCl3(NH3)] is shown in Fig. S1† These recorded patterns were then compared with calculated counterparts obtained through structure refinement based on single-crystal data. The compound was successfully obtained with a yield of 58%. Since the by-products crystallized at the top of the ampule, characterization was also conducted through single-crystal diffraction, leading to the characterization of the yet unknown adducts of (NH4)2[InCl5(NH3)], and (NH4)3InCl6 (CCDC 2301094 and 2334831). The XRD taken from side-phases sublimated on the top of the ampule is depicted in Fig. S2† along with the crystal structures data provided in Table S1.†Infrared spectroscopy (IR)
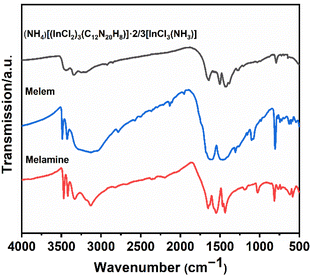
The experimental IR spectrum of the (NH4)[(InCl2)3 (C12N20H8)]·⅔[InCl3(NH3)] compound has been compared with that of melamine and melem as shown in Fig. 6. Table S2† provides information on the frequencies linked to individual vibrational modes of these molecules, along with the corresponding assignments of bonds. This comparison helps us understand the (NH4)[(InCl2)3(C12N20H8)]·⅔[InCl3(NH3)] compound's spectral features by relating them to the well-known vibrational patterns of melamine, and melem.17 As shown in Fig. 6, infrared spectra were recorded for three compounds in the range of 4000 to 500 cm−1. Given that all the compounds contain NH2 groups, it is not surprising that they exhibit similar patterns in the regions between 3500–3200 cm−1 and 1580–1600 cm−1, ascribed to NH stretching and bending vibrations, respectively.17,28 However, apart from slight variations in relative intensities and splitting, there is a distinctive difference in (NH4)[(InCl2)3(C12N20H8)]·⅔[InCl3(NH3)] compound compared to melem, and melamine in these regions. In fact, in the spectrum of the (NH4)[(InCl2)3 (C12N20H8)]·⅔[InCl3(NH3)] compound, the band at around 3500–3200 cm−1 appears broader and slightly less intense compared to the two others, which can signify differences in structures, especially the number of NH2 groups present in this structure. As expected, the compounds show a similar spectrum in the regions around 800 cm−1 and 1400–1550 cm−1, which are related to ring out-of-plane bending and side chain C–N breathing, respectively.28Stability of (NH4)[(InCl2)3(C12N20H8)]·⅔[InCl3(NH3)]
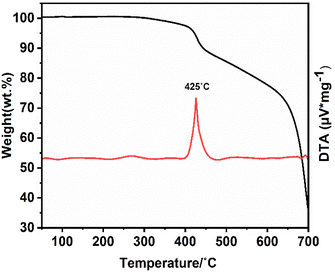
The (NH4)[(InCl2)3 (C12N20H8)]·⅔[InCl3(NH3)] compound has been kept for two months outside of the glove box inside an open container, and XRD measurements taken from the crystalline powder shown in Fig. S3† show the high stability of this compound in air. The thermal stability of this compound has also been studied with TGA analysis, as can be seen in Fig. 7. The decomposition starts at around 425 °C and continues to 700 °C until the compound is finally converted into indium carbodiimide, In2.24(NCN)3.34 The XRD pattern taken from the final product which appears to be indium carbodiimide, is shown in Fig. S4.†Photoluminescence measurements
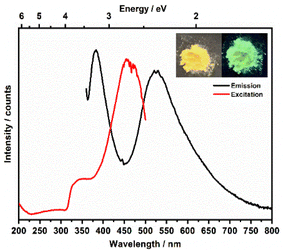
Metal–organic complexes with indium metal centers were reported before to have photoluminescent properties.35–38 In fact, complexes with a d10 metal center have been considered as luminescent materials.39 Furthermore, the luminescence and photochemistry of porphyrin and phthalocyanine complexes with group 13 metals have been reported in several studies.40,41 Therefore, the solid-state luminescence of the synthesized material was investigated at ambient temperature (Fig. 8). The emission spectra depicted two broad bands at 380 and 530 nm, while the corresponding excitation bands are at 350 and 460 nm, respectively. The 530 nm emission causes greenish luminescence as displayed in the inset in Fig. 8. To further analyse the photoluminescence behaviour, decay curves of the emission spectra excited at 350 nm were recorded (Fig. 9a and b). The decay curves indicated emission lifetimes τ1 = 604 μs and τ1 = 325 μs for the emission bands at 358 nm and 530 nm, respectively. In some of indium metal–organic compounds, the ligands alone doesn't show any photoluminescent property meaning that rather the ligand-to-metal charge transfer is responsible for the observed photoluminescence.38 In this study, the emission band of 530, and also the calculated decay times fall in the region of similar works on indium-based complexes.35,37,42–44 The observed luminescence of this compound is most likely due to ligand-to-metal charge transfers (LMCT) or metal-centered transitions, as the decay times are in the microsecond range. This is inconsistent with ligand-centered processes such as π–π* transitions, which typically decay within the nanosecond range.45 The transitions are most likely caused by an LMCT, since In3+ can easily take up one or two electrons, which yields the monovalent ion s2 ion (In+) as an excited state.45 Additionally, metal-centered transitions in In3+ ([Kr]4d10) comprising materials are known and could explain the observed emission spectrum.36,37,45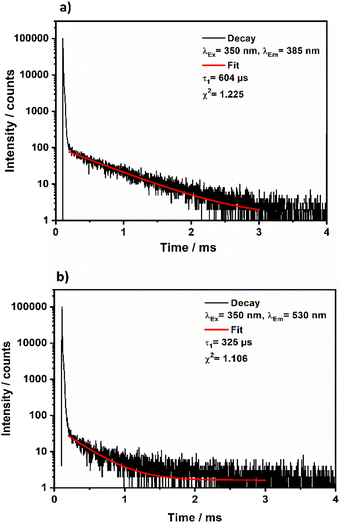 | ||
| Fig. 9 Decay curves obtained for crystalline (NH4)[(InCl2)3(C12N20H8)]·⅔[InCl3(NH3)] upon excitation at 350 nm and monitoring the emission band at 358 nm (a) or monitoring the emission at 530 nm (b). | ||
Conclusion
This research work introduces a novel, simple solid-state synthesis for creating supramolecular and porphyrin-like assemblies from the thermal condensation of melamine. The compound, denoted as (NH4)[(InCl2)3(C12N20H8)]·⅔[InCl3(NH3)] results from the reaction between indium(III) chloride and melamine, featuring a unique supramolecular assembly of deprotonated melamine or deprotonated melam interconnected with indium chloride centers. This study introduces the first compound made from four times deprotonation of melamine, with the [C12N20H8]4− anion. Our findings highlight that this compound is also stable under ambient conditions, indicating its potential for further research and exploration. Infrared spectroscopy, X-ray diffraction analysis, thermal gravimetric analysis (TGA), and differential scanning calorimetry (DSC) analyses confirm its stability and reveal its structural characteristics. Analogous to porphyrins and metal–organic assemblies with d10 metal centres, this supramolecular arrangement has the potential to exhibit luminescence attributable to ligand-to-metal charge transfers (LMCT) or metal-centered transitions. The luminescent color under UV radiation originates from an interconnected structure binding to the metal core. Overall, the synthesized compound not only holds promise for advancing deprotonation ligands derived from melamine and its condensation products but also offers valuable insights into supramolecular C/H/N chemistry, and their properties.Experimental section
Materials and methods
The starting substances, melamine (2,4,6-triamino-1,3,5-triazine, purchased from Sigma-Aldrich, 99%), and indium(III) chloride (Sigma-Aldrich, 99%), were utilized without additional purification. The reaction mixtures were prepared in a glovebox under an argon atmosphere with moisture and oxygen levels maintained below 1 ppm. Subsequently, the prepared mixtures were transferred into handmade silica tubing (length: 6 cm, inner diameter: 7 mm) and sealed under a vacuum. The reactions were conducted in Simon–Müller furnaces.Synthesis of (NH4)[(InCl2)3(C12N20H8)]·⅔[InCl3(NH3)]
Indium(III) chloride and melamine in a molar ratio of 1.2![[thin space (1/6-em)]](https://www.rsc.org/images/entities/char_2009.gif) :
:![[thin space (1/6-em)]](https://www.rsc.org/images/entities/char_2009.gif) 1, respectively were ground together in an agate mortar as precursors. The resulting mixture weighing approximately 50 is vacuum-sealed. This ampule was subsequently placed horizontally in a Simon–Müller furnace, heated to 250 °C for 20 h with a heating rate of 2 °C min−1, and cooling at a rate of 0.5 °C min−1. The reaction yielded a yellow crystalline product at the ampule's bottom, achieving a yield of 58% relative to the precursors. The separation of the product from by-products is primarily influenced by the temperature gradient.
1, respectively were ground together in an agate mortar as precursors. The resulting mixture weighing approximately 50 is vacuum-sealed. This ampule was subsequently placed horizontally in a Simon–Müller furnace, heated to 250 °C for 20 h with a heating rate of 2 °C min−1, and cooling at a rate of 0.5 °C min−1. The reaction yielded a yellow crystalline product at the ampule's bottom, achieving a yield of 58% relative to the precursors. The separation of the product from by-products is primarily influenced by the temperature gradient.
Instrumentation
X-ray powder diffraction
The powder diffractometer (STOE Darmstadt, STADIP, Ge-monochromator) was utilized to record the X-ray diffraction patterns of the prepared powders. The radiation employed was Cu-Kα1 (λ = 1.540598 Å), and data was collected within the 5 < 2θ < 100° range. Match3! Software was used to compare these patterns with those of the relevant crystal structures.Single-crystal X-ray diffraction
Single crystals of the product were chosen and positioned on a light-yellow single-crystal X-ray diffractometer (Rigaku XtaLab Synergy-S) utilizing Cu-Kα radiation (λ = 1.54184 Å) and a mirror monochromator at either 150 or 220 K. The crystal structures were determined through direct methods (SHELXT),46 followed by full-matrix least-squares structure refinements (SHELXL-2014).46 X-ray intensity absorption correction was carried out using numerical methods with the CrysAlisPro 1.171.41.92a software (Rigaku Oxford Diffraction). Hydrogen atoms were identified in the difference map and refined isotopically based on their positions.Infrared spectra
The infrared (IR) spectra for the samples were obtained utilizing a Bruker VERTEX 70 FT-IR spectrometer, covering a spectral range from 400 to 4000 cm−1. KBr tablets were employed as the background during the spectroscopic measurements.Optical measurements
The fluorescence spectrometer FLS920 (Edinburgh Instruments) equipped with a 450 W xenon discharge lamp (OSRAM) was utilized to capture the emission and excitation spectra of (NH4)[(InCl2)3(C12N20H8)]·⅔[InCl3(NH3)]. Inside the sample chamber, a mirror optic designed for powder samples was incorporated. For detection purposes, an R2658P single-photon-counting photomultiplier tube manufactured by Hamamatsu was utilized. Photoluminescence spectra were recorded with a spectral resolution of 1 nm, a dwell time of 0.5 seconds at 1 nm intervals, and 2 repetitions. The photoluminescence decay curves were recorded using the same spectrometer but with a 445 nm picosecond laser as a pulsed excitation source.Thermoanalytic studies
Differential scanning calorimetry (DSC) experiments were conducted utilizing a DSC 204 F1 Phoenix instrument (Fa. Netzsch, Selb, Germany). The initial components were sealed in a glovebox under an argon atmosphere and placed in gold-plated (5 μm) steel autoclaves with a 100 μl volume (Bächler Feintech AG in Hölstein, Switzerland). The reaction between InCl3 and melamine was investigated on 1.2![[thin space (1/6-em)]](https://www.rsc.org/images/entities/char_2009.gif) :
:![[thin space (1/6-em)]](https://www.rsc.org/images/entities/char_2009.gif) 1 ratio, covering a temperature range from room temperature to 500 °C. The heating and cooling processes were performed at a rate of 2 °C min−1.
1 ratio, covering a temperature range from room temperature to 500 °C. The heating and cooling processes were performed at a rate of 2 °C min−1.
The TGA experiments were conducted using a Netzsch Jupiter STA 449 F3 apparatus. The final product was transferred under argon into an open-ended custom silica container and exposed to gradual heating and cooling at a rate of 2 K min−1. This enabled stability analysis of the product across the temperature spectrum from room temperature to 700 °C.
Data availability statement
The data that support the findings of this study are openly available in CCDC.(NH4)2[InCl5(NH3)]: CCDC 2301094.
(NH4)3InCl6 : CCDC 2334831.
(NH4)[(InCl2)3(C12N20H8)]·⅔[InCl3(NH3)]: CCDC 2333063.†
Data are available within the article or its ESI.†
The data that support the findings of this study are available on request from the corresponding author, H.-J. Meyer.
Author contributions
H.-J. M.: conceptualization, supervision, funding acquisition, review, and editing. E. B.: synthesis, PXRD, and IR, writing. M. S.: X-ray diffraction refinements and structure solutions. T. J. and D. E.: photoluminescence spectroscopy. All authors have read and agreed to the published version of the manuscript.Conflicts of interest
The authors declare no conflict of interest.Acknowledgements
We gratefully acknowledge the support provided by the Deutsche Forschungsgemeinschaft (DFG-Bonn) for this research project (ME 914/34-1) and Keno Kraut (Univ. Tübingen) for his preparative work within the framework of an advanced lab course. Sincere thank you to Mike Healey Smith for his English revisions and proofreading of this article.References
- J. Liebig, Ann. Pharm., 1834, 10, 1–47 CrossRef
.
-
G. M. Crews, W. Ripperger, D. B. Kersebohm, T. Güthner and B. Mertschenk, Ullmann's Encyclopedia of Industrial Chemistry, 2000 Search PubMed
.
-
F. K. Keßler, Ph.D. Thesis, Ludwig Maximilian University of Munich, 2019
.
- P. Klason, J. Prakt. Chem., 1886, 33, 285–289 CrossRef
.
- L. Gmelin, Ann. Pharm., 1835, 15, 252–258 CrossRef
.
- A. Schwarzer, T. Saplinova and E. Kroke, Coord. Chem. Rev., 2013, 257, 2032–2062 CrossRef CAS
.
- E. C. Franklin, J. Am. Chem. Soc., 1922, 44, 486–509 CrossRef CAS
.
- L. Pauling and J. Sturdivant, Proc. Natl. Acad. Sci. U. S. A., 1937, 23, 615–620 CrossRef CAS PubMed
.
- T. Komatsu, Macromol. Chem. Phys., 2001, 202, 19–25 CrossRef CAS
.
- H. Schroeder and E. Kober, J. Org. Chem., 1962, 27, 4262–4266 CrossRef CAS
.
- B. V. Lotsch, M. Döblinger, J. Sehnert, L. Seyfarth, J. Senker, O. Oeckler and W. Schnick, Chem. – Eur. J., 2007, 13, 4969–4980 CrossRef CAS PubMed
.
- H. May, J. Appl. Chem., 1959, 9, 340–344 CrossRef CAS
.
- T. Saplinova, C. Lehnert, U. Böhme, J. Wagler and E. Kroke, New J. Chem., 2010, 34, 1893–1908 RSC
.
- A. Sattler, L. Seyfarth, J. Senker and W. Schnick, Z. Anorg. Allg. Chem., 2005, 631, 2545–2554 CrossRef CAS
.
- A. Sattler and W. Schnick, Z. Anorg. Allg. Chem., 2008, 634, 457–460 CrossRef CAS
.
- E. Wirnhier, M. B. Mesch, J. Senker and W. Schnick, Chem. – Eur. J., 2013, 19, 2041–2049 CrossRef CAS PubMed
.
- V. L. Bettina and W. Schnick, Chem. – Eur. J., 2007, 13, 4956–4968 CrossRef PubMed
.
-
B. V. Lotsch, Doctoral dissertation, Ludwig Maximilian University of Munich, 2006
.
- A. Sattler, S. Pagano, M. Zeuner, A. Zurawski, D. Gunzelmann, J. Senker, K. Müller-Buschbaum and W. Schnick, Chem. – Eur. J., 2009, 15, 13161–13170 CrossRef CAS PubMed
.
- N. E. Braml, A. Sattler and W. Schnick, Chem. – Eur. J., 2012, 18, 1811–1819 CrossRef CAS PubMed
.
- M. M. Zhao and P. P. Shi, Acta Crystallogr., Sect. E: Struct. Rep. Online, 2010, 66, o1463–o1463 CrossRef CAS PubMed
.
- F. K. Kessler, T. J. Koller and W. Schnick, Z. Anorg. Allg. Chem., 2018, 644, 186–192 CrossRef CAS
.
- F. K. Kessler, A. M. Schuhbeck and W. Schnick, Z. Anorg. Allg. Chem., 2019, 645, 840–847 CrossRef CAS
.
-
P. Kallenbach, Master dissertation, Eberhard Karls Universität Tübingen, 2021
.
- Z. Bai, J. Lee, H. Kim, C. L. Hu and K. M. Ok, Small, 2023, 2301756 CrossRef CAS PubMed
.
- L. Liu, Y. Wu, L. Ma, G. Fan, W. Gao, W. Wang and X. Ma, J. Struct. Chem., 2022, 63, 302–309 CrossRef CAS
.
- P. Kallenbach, E. Bayat, M. Ströbele, C. P. Romao and H.-J. R. Meyer, Inorg. Chem., 2021, 60, 16303–16307 CrossRef CAS PubMed
.
- E. Bayat, M. Ströbele and H.-J. Meyer, Chemistry, 2023, 5, 1465–1476 CrossRef CAS
.
- L. Zhang, J. Zhang, Z.-J. Li, J.-K. Cheng, P.-X. Yin and Y.-G. Yao, Inorg. Chem., 2007, 46, 5838–5840 CrossRef CAS PubMed
.
- A. Rana, M. Bera, D. S. Chowdhuri, D. Hazari, S. K. Jana, E. Zangrando and S. Dalai, J. Inorg. Organomet. Polym. Mater., 2012, 22, 360–368 CrossRef CAS
.
- K. Sivashankar, A. Ranganathan, V. Pedireddi and C. Rao, J. Mol. Struct., 2001, 559, 41–48 CrossRef CAS
.
- A. L. Görne, T. Scholz, D. Kobertz and R. Dronskowski, Inorg. Chem., 2021, 60, 15069–15077 CrossRef PubMed
.
- W. Schnick and H. Huppertz, Z. Anorg. Allg. Chem., 1995, 621, 1703–1707 CrossRef CAS
.
- R. Dronskowski, Z. Naturforsch., B: J. Chem. Sci., 1995, 50, 1245–1251 CrossRef CAS
.
- S. Herrera, K. I. Rivero, A. Guzmán, J. Cedeño, J. Miksovska and R. G. Raptis, Dalton Trans., 2022, 51, 14277–14286 RSC
.
- S. H. Lee, N. Shin, S. W. Kwak, K. Hyun, W. H. Woo, J. H. Lee, H. Hwang, M. Kim, J. Lee and Y. Kim, Inorg. Chem., 2017, 56, 2621–2626 CrossRef CAS PubMed
.
- C. H. Ryu, S. W. Kwak, H. W. Lee, J. H. Lee, H. Hwang, M. Kim, Y. Chung, Y. Kim, M. H. Park and K. M. Lee, Inorg. Chem., 2019, 58, 12358–12364 CrossRef CAS PubMed
.
- Y.-Q. Zhang, W.-L. Ma, W.-Z. Li, Y.-L. Lan, Y. Liu, Y.-N. Zhao and J. Luan, J. Mol. Struct., 2024, 1301, 137380 CrossRef CAS
.
- X. Du, R. Fan, X. Wang, L. Qiang, P. Wang, S. Gao, H. Zhang, Y. Yang and Y. Wang, Cryst. Growth Des., 2015, 15, 2402–2412 CrossRef CAS
.
- V. S. Thoi, J. R. Stork, D. Magde and S. M. Cohen, Inorg. Chem., 2006, 45, 10688–10697 CrossRef CAS PubMed
.
- S. Ito, M. Gon, K. Tanaka and Y. Chujo, Natl. Sci. Rev., 2021, 8, nwab049 CrossRef CAS PubMed
.
- P. C. Teeuwen, Z. Melissari, M. O. Senge and R. M. Williams, Molecules, 2022, 27, 6967 CrossRef CAS PubMed
.
- O. T. Alexander, M. M. Duvenhage, R. E. Kroon, A. Brink and H. G. Visser, New J. Chem., 2021, 45, 2132–2140 RSC
.
- Q. Gao, F.-L. Jiang, M.-Y. Wu, Y.-G. Huang, L. Chen, W. Wei and M.-C. Hong, J. Solid State Chem., 2009, 182, 1499–1505 CrossRef CAS
.
- G. Blasse, Chem. Phys. Lett., 1990, 175, 237–241 CrossRef CAS
.
- G. Sheldrick, Acta Crystallogr., Sect. A: Cryst. Phys., Diffr., Theor. Gen. Crystallogr., 1984, 40, C440–C440 Search PubMed
.
Footnote |
| † Electronic supplementary information (ESI) available. CCDC 2333063. For ESI and crystallographic data in CIF or other electronic format see DOI: https://doi.org/10.1039/d4dt01029a |
| This journal is © The Royal Society of Chemistry 2024 |

