 Open Access Article
Creative Commons Attribution 3.0 Unported Licence
A highly durable catalyst system for hydrogen production from dimethyl ether†
Robert
Stöber
a,
Franziska
Seidl
a,
Emanuel
Hoffmann
a,
Peter
Wasserscheid
abc and
Patrick
Schühle
 *a
*a
aLehrstuhl für Chemische Reaktionstechnik, Friedrich-Alexander-Universität Erlangen-Nürnberg, Egerlandstr. 3, 91058 Erlangen, Germany. E-mail: Patrick.Schuehle@fau.de
bForschungszentrum Jülich, Helmholtz-Institute Erlangen-Nürnberg for Renewable Energy (IEK 11), Egerlandstr. 3, 91058 Erlangen, Germany
cForschungszentrum Jülich, Institute for a Sustainable Hydrogen Economy, Am Brainergy Park 4, 52428 Jülich, Germany
First published on 15th March 2024
Abstract
Dimethyl ether (DME) is a promising vector for the transportation of hydrogen over long distances and from point to point. However, a major challenge to the large-scale application of this technology has been the notoriously unstable nature of the so far applied steam reforming catalysts. In this paper, we describe a physical mixture of γ-Al2O3 and zirconia-supported In2O3 as a highly stable catalyst system for the steam reforming of dimethyl ether (SRD). Our work shows that the use of 3 wt% In2O3 on ZrO2 provides the highest activity and hydrogen yield in the temperature range of 350–400 °C. In addition, the developed catalyst system shows excellent stability over an operating time of 425 h with a DME conversion of nearly 100% and a hydrogen yield of about 90%. To maximize the hydrogen yield further, a water–gas shift reactor was operated downstream of the SRD reactor, but at lower temperatures, to reduce the CO concentration in the product mixture to its thermodynamic equilibrium concentration. This synergetic operation led to a maximum hydrogen yield of 95%.
Introduction
With the goal to achieve net zero greenhouse gas emissions by 2050, Europe will heavily depend on hydrogen imports from countries with higher renewable energy potential to satisfy its energy demand.1 Germany for example has engaged into several hydrogen cooperation agreements with overseas countries, such as Australia or Namibia, for the import of green hydrogen.1 For hydrogen transport over such long distances, there is no alternative to shipping.2,3 The transport of elemental hydrogen as pressurized gas (GH2) or cryogenic liquid (CH2) is very challenging due to the necessary high investments in ships and harbour infrastructures, and more specifically due to the low volumetric density of pressurized hydrogen and the significant boil-off losses in the case of cryogenic hydrogen.4 Therefore, chemical hydrogen storage in liquids or easily liquefiable substances is in the focus of current research. Ammonia, methanol, LOHC systems or methane are most widely discussed in this context.5,6The application of dimethyl ether (DME) as a hydrogen transport vector has only attracted attention in recent years.7,8 DME is the simplest ether, non-toxic and liquefiable at −24.8 °C (1 atm) or 5.1 bar(a) (20 °C) with a low GWP100 of 0.3 CO2-eq. (in contrast to 30 CO2-eq. for CH4).9,10 Recently, some of us have published a techno-economic study11 highlighting the potential of the DME/CO2 storage cycle, which comprises DME synthesis in energy rich regions, overseas transport of DME, hydrogen release at the point of demand and recycling/back shipping of CO2 for the next storage cycle.11 The key advantages of this cycle are as follows: (1) DME and CO2 have similar physical properties, both favourable for ship transport in classical LPG tank vessels with low hazard potential; (2) only half of the releasable hydrogen has to be transported, while the other half is supplied by water added at the location of hydrogen need; (3) the back-transportation of the released by-product CO2 in the same ship used for the transport of DME can replace most of the costly direct air capture operation at the place of hydrogen export.12,13 Furthermore, the technical hydrogen capacity (ratio of hydrogen mass released to carrier weight) of DME is 26.1 gH2 gDME−1 and thus clearly exceeds that of methanol (18.8 gH2 gMeOH−1) and ammonia (17.8 gH2 gNH3−1).11
The production of DME from syngas via direct or indirect (methanol synthesis followed by dehydration) synthesis routes is well established.14–16 With the first CO2-to-methanol production plant starting operation in 2022 it was also shown that technical DME production from CO2 is feasible at least using the indirect two step production route.17 In contrast, steam reforming of DME (SRD) to release hydrogen at the point of energy demand is much less mature. The most important hurdle for commercial SRD is the lack of durable catalysts, making SRD the bottleneck of the otherwise highly promising DME/CO2 cycle for hydrogen transport. The typical reaction conditions of SRD range between 250 and 450 °C, near ambient pressures and steam to DME ratios of 3![[thin space (1/6-em)]](https://www.rsc.org/images/entities/char_2009.gif) :
:![[thin space (1/6-em)]](https://www.rsc.org/images/entities/char_2009.gif) 1 (stoichiometric, see eqn (3)) to 5
1 (stoichiometric, see eqn (3)) to 5![[thin space (1/6-em)]](https://www.rsc.org/images/entities/char_2009.gif) :
:![[thin space (1/6-em)]](https://www.rsc.org/images/entities/char_2009.gif) 1.7 The SRD reaction comprises two steps. First, DME is cleaved to methanol via hydrolysis according to (1).
1.7 The SRD reaction comprises two steps. First, DME is cleaved to methanol via hydrolysis according to (1).
| CH3OCH3 + H2O ⇌ 2CH3OH | (1) |
This reaction is thermodynamically limited at the above mentioned reaction conditions to DME conversions below 40%.18 Subsequently, the formed methanol is converted to hydrogen in methanol steam reforming (MSR) (2), resulting in the overall net eqn (3).
| CH3OH + H2O ⇌ 3H2 + CO2 | (2) |
| CH3OCH3 + 3H2O ⇌ 6H2 + 2CO2 | (3) |
To catalyse both consecutive reactions, two catalytic functionalities are needed according to the literature,7 namely acidic centres for DME hydrolysis and metallic centres for MSR. The two catalytic functions can be realized by either using a bifunctional catalyst material or using a physical mixture of two catalysts. Executing the reaction sequence of (1) and (2) with a mixed catalyst bed allows the shift of the thermodynamic equilibrium of DME hydrolysis by the subsequent consumption of methanol through MSR.
Most commonly, zeolites in a protonated form or γ-alumina are used as catalysts for reaction (1) depending on the applied operation temperature. While Brønsted acidic zeolites (e.g. H-ZSM-5 or mordenite) are preferred in the low temperature range of 250 to 350 °C, γ-alumina is the material of choice for temperatures above 350 °C. This catalyst selection is made to reduce undesired side reactions, such as the formation of hydrocarbons via the methanol-to-olefins route (4)19 or DME decomposition (5)20 to a minimum.
| 2CH3OH ⇌ CH3OCH3 + H2O ⇌ (CH2)2 + 2H2O | (4) |
| CH3OCH3 ⇌ CH4 + CO + H2 | (5) |
Catalyst research for reaction (2) in a SRD reactor is different from the typical conditions of methanol steam reforming (MSR). Operation of the SRD reaction is characterized by higher reaction temperatures and higher water partial pressures compared to typical MSR conditions. This difference leads to the fact that typical MSR catalyst materials suffer from deactivation under these harsher SRD conditions. Most prominent among the catalysts tested for step (2) in the SRD sequence are Cu/ZnO/Al2O3 (CZA),21–23 Cu spinels24–27 or metal oxide supported PGM group metals.28–30 High DME conversions and hydrogen yields of above 90% have been achieved25,31,32 with common side reactions being methanol decomposition (6), reverse water–gas-shift reaction (7) and methanation (8).33 However, deactivation due to sintering or coking, e.g. by the CO disproportionation reaction (9), was observed regardless of the active metal or morphology.23,34,35
| CH3OH ⇌ 2H2 + CO | (6) |
| H2 + CO2 ⇌ CO + H2O | (7) |
| COx + (2 + x)H2 ⇌ CH4 + xH2O | (8) |
| 2CO ⇌ C + CO2 | (9) |
Only a few catalysts have been reported to be stable in SRD but also they have been studied for no longer than 12 hours time-on-stream.28,36
This study aims at developing an active, highly durable and technically applicable SRD catalyst characterized by low methane and CO formation to maximize the obtained hydrogen yield. We found that a physical mixture of γ-Al2O3 and In2O3 supported on metal oxide supports combines these very attractive features. In2O3 catalysts have been previously studied for CO2 hydrogenation to methanol.37–41 Indium oxide has also been used as a structural promotor and support in Pd- or Pt-catalyzed MSR.42–48 The use of In2O3 in the MSR reaction has been investigated experimentally and in DFT calculations.49–52 To the best of our knowledge, no reports on the In2O3 catalyzed SRD reaction have been published so far.
Experimental and methodology
Materials
In2O3 catalysts were prepared using indium nitrate hydrate (Thermo Fischer Scientific, Puratronic®, 99.999% metals basis). Commercially available, cylindrical metal oxide pellets with a 3 mm (1/8′′) diameter were applied as a support for the indium oxide phase. Titanium oxide (mean pore diameter 140 Å) was obtained from Alfa Aesar. Aluminium oxide used as a support as well as a DME hydrolysis catalyst (γ-phase, bimodal pore size distribution, and high surface area), silicon oxide (high surface area), and zirconium oxide were purchased from Thermo Fischer Scientific. A commercial copper-based methanol synthesis catalyst (Alfa Aesar) and self-synthesized PdZn/γ-Al2O3 (for the preparation protocol see the ESI†) were used as reference catalysts.Catalyst preparation and characterization
The catalysts used in this work were prepared by wet impregnation. The indium nitrate hydrate precursor was dissolved in 20 mL distilled water. Afterwards the metal oxide pellets were added to the aqueous solution. The solvent was removed at 100 mbar, 60 °C and a rotation speed of 90 rpm to avoid abrasion of the catalyst pellets. Subsequently the catalyst was dried for 12 h at 110 °C and calcined over 3 h in air at 400 °C with a heating rate of 2 °C min−1.The support materials and catalysts were characterized by ammonia and CO2-TPD, H2-TPR, N2-physisorption (BET), X-ray diffraction and ICP-AES. The mass related acidity was measured with a Thermo Scientific TPDRO 1100 equipped with a thermal conductivity detector (TCD). Samples were degassed at 550 °C under a constant helium flow prior to treatment with a 10 vol% NH3 in He mixture at 100 °C. Afterwards, ammonia was desorbed by heating the sample up to 900 °C with a rate of 5 K min−1. The end temperature was maintained for 1 h. The mass related basicity was determined with a Micromeritics AutoChem II equipped with a TCD. For pretreatment and measurement, the same conditions were chosen as for the ammonia TPD, except for the fact that pure CO2 was used as the probe molecule and a pretreatment temperature of 70 °C was used. The reducibility of selected indium oxide materials was investigated by H2-TPR using a Micromeritics AutoChem II device. The samples were degassed at 400 °C under a constant helium flow. After cooling down to room temperature, the materials were heated (5 K min−1) to 400 °C and kept at this temperature for 1 h. Following the degassing of the samples for 12 h at 250 °C, the total surface area (SBET), the total micro- and meso-porous volume (vp,tot), and the average pore size (đp) of the support material and the prepared catalysts were determined by N2-physisorption at −196 °C using a Quantachrome Quadrasorb SI-MP-8. The total surface area of the samples was calculated using the BET model. The indium content and the overall composition of the prepared catalyst samples were determined by ICP-AES analysis using a Perkin Elmer Plasma 400. Powder X-ray diffraction (XRD) was conducted to determine the crystal structure of the synthesized catalysts using a Philips X'Pert Pro diffractometer. Diffraction patterns were recorded by application of Cu-Kα radiation, using an angular step size of 0.017° with 100 s per step and scan angles of 10–90°. The average crystallite size (dc) of In2O3 was estimated from the Scherrer equation (for further information see the ESI†).
Evaluation of the catalytic performance
Prior to the catalytic studies, the synthesized In2O3 materials were physically mixed with the 3 mm γ-Al2O3 pellets. The SRD experiments were conducted in a stainless steel, fixed bed reactor (Halmosi, 30 mm inner diameter) equipped with a basket to hold the catalyst mixture. Unless stated otherwise, the reaction conditions, used in our SRD experiments, were kept constant at p = 2 bar(a), T = 350 °C and a steam-to-DME ratio of 5 (with 20 mol% N2 as a diluent). For experiments targeting the improvement of the catalyst composition, a mixture of 3 g In2O3/MxOy + 3 g γ-Al2O3 was used, correlating with a GHSV of around 2500 h−1. A higher catalyst mass of 36 g In2O3/ZrO2 + 9 g γ-Al2O3 was applied to maximise the hydrogen yield (GHSV = 550 h−1).The reactants were dosed separately into the reactor (see Fig. S1 in the ESI† for details). Distilled water was fed with a HPLC pump (TechLab), evaporated in a total evaporator (ParTeQ), and subsequently mixed with DME vapour (Air Liquide, purity 99.9 wt%). The product mixture leaving the SRD reactor was first directed to a condenser for methanol and water separation at approx. 5 °C. The remaining gas mixture was analysed with an Agilent 490 Micro GC (for the method and set-up see Table S1 in the ESI†). To calculate the volume flow of the product gas, the DME–water reactant mixture was diluted with nitrogen (Air Liquide, purity 99.999%) as an inert tracer.
DME conversion (XDME) and hydrogen yield (YH2) were calculated as follows:
 | (10) |
 | (11) |
Y H2 relates the amount of hydrogen produced in the SRD experiment to the maximum molar amount of releasable hydrogen per mol of DME according to (3). Selectivities are calculated in two different ways depending on the mode of operation. For experiments with DME conversions close to 100%, a global selectivity for all C1 products (methanol, CO, CO2, and CH4) is calculated (see (12)). In cases with low DME conversions, e.g. in the support variation experiments, only CO, CO2 and CH4 are considered as final products (excluding the intermediate product methanol) to emphasize the effects of the methanol steam reforming catalyst (13).
 | (12) |
 | (13) |
The formation of any C2+ products was not observed in the experiments and is therefore not considered.
Results and discussion
Catalyst composition – support influence
In a first set of experiments, we studied the influence of the support material used with the In2O3-based catalyst on the catalyst performance in the SRD reactor. For this variation, commercially available γ-Al2O3 (also used as a catalyst for the hydrolysis step), SiO2 and TiO2 (cylindrical form, dcylinder = 3 mm) were impregnated as purchased to yield materials with an indium content of 6 wt%. These materials were characterized by X-ray diffraction and the results are shown in Fig. 1. The characteristic reflexes of the In2O3 crystalline phase at 30.5°, 34.5°, 51.0° and 60.6° are clearly discernible for γ-Al2O3 and SiO2 supports. For ZrO2, only the reflex with the highest intensity at 30.5° is perceptible, shouldered by the zirconia reflex at 31.4°. For TiO2, no In2O3 signal is observed, most likely due to the dominant reflexes of the titania support and the high dispersion of the In2O3 particles on the surface. This phenomenon has been reported previously in the literature for In2O3/TiO2 materials.53,54 However, the formation of a crystalline In2O3 phase could not be conclusively confirmed for the In2O3/TiO2 material under investigation.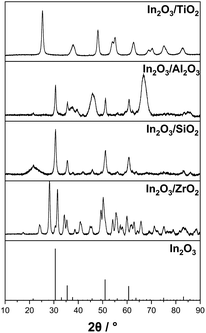 | ||
| Fig. 1 X-ray diffraction measurements of self-synthesized In2O3 on different metal oxide supports with 6 wt% indium content and the reference diffractogram of pure In2O3. | ||
Our SRD experiments were performed with a mixture of 3 g In2O3/MxOy (6 wt% indium content) and 3 g of γ-Al2O3 at 2 bar(a) using a molar ratio of DME![[thin space (1/6-em)]](https://www.rsc.org/images/entities/char_2009.gif) :
:![[thin space (1/6-em)]](https://www.rsc.org/images/entities/char_2009.gif) H2O
H2O![[thin space (1/6-em)]](https://www.rsc.org/images/entities/char_2009.gif) :
:![[thin space (1/6-em)]](https://www.rsc.org/images/entities/char_2009.gif) N2 of 1
N2 of 1![[thin space (1/6-em)]](https://www.rsc.org/images/entities/char_2009.gif) :
:![[thin space (1/6-em)]](https://www.rsc.org/images/entities/char_2009.gif) 5
5![[thin space (1/6-em)]](https://www.rsc.org/images/entities/char_2009.gif) :
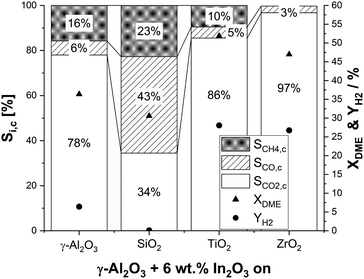
:![[thin space (1/6-em)]](https://www.rsc.org/images/entities/char_2009.gif) 1.5 and with a GHSV of around 2500 h−1. In line with the optimum temperature range for γ-Al2O3 in DME hydrolysis as stated in the literature,55 a reaction temperature of 350 °C was chosen. Typical time-on-stream in our experiments was 18 h. Looking on our results (Fig. 2), the highest YH2 of 28% and 27% was achieved with the TiO2 and ZrO2 supports, followed by γ-Al2O3 (6%). Surprisingly, In2O3/SiO2 showed no activity with a negligible YH2 < 0.1%. In line with the observed trend of the hydrogen yields for In2O3/MxOy, the highest conversions of 52% and 47% were obtained by titania and zirconia , respectively. With the less active alumina (XDME = 36%) and silica (XDME = 32%) supports, DME conversion was close to the thermodynamic equilibrium conversion of 32% at 350 °C.
1.5 and with a GHSV of around 2500 h−1. In line with the optimum temperature range for γ-Al2O3 in DME hydrolysis as stated in the literature,55 a reaction temperature of 350 °C was chosen. Typical time-on-stream in our experiments was 18 h. Looking on our results (Fig. 2), the highest YH2 of 28% and 27% was achieved with the TiO2 and ZrO2 supports, followed by γ-Al2O3 (6%). Surprisingly, In2O3/SiO2 showed no activity with a negligible YH2 < 0.1%. In line with the observed trend of the hydrogen yields for In2O3/MxOy, the highest conversions of 52% and 47% were obtained by titania and zirconia , respectively. With the less active alumina (XDME = 36%) and silica (XDME = 32%) supports, DME conversion was close to the thermodynamic equilibrium conversion of 32% at 350 °C.
Regarding selectivity, pronounced methane and CO formation was observed on alumina (SCH4,c = 16%; SCO,c = 6%) and titania (SCH4,c = 10%; SCO,c = 5%). In contrast, CH4 production on ZrO2 was negligible. Moreover, only a low CO selectivity of 3% was observed, which makes ZrO2 a very suitable support material. Note that CO is a less critical side product compared to methane as it can be converted to CO2 by an additional water–gas-shift (WGS) reaction step under comparably mild reaction conditions.
To shed light on the blank activity of the different support materials under investigation, their activity (in combination with the hydrolysis catalyst γ-Al2O3) was investigated (for conversions and selectivities see Table S2 in the ESI†) without any In2O3 present. The blank supports showed no noteworthy activity for steam reforming, with YH2 < 0.1% and XDME = 32% (equal to the equilibrium conversion of DME hydrolysis at 350 °C). However, methane formation was observed over pure γ-Al2O3, with a PCH4 of around 56 μmol g−1 h−1. As methane is accompanied by traces of H2, CO and CO2 (indicating a slight activity for the WGS reaction), its formation presumably proceeds via the DME decomposition route. Negligible methane productivities were observed in the experiments with SiO2 (1 μmol g−1 h−1) and ZrO2 (5 μmol g−1 h−1) after subtraction of PCH4,γ-Al2O3, indicating that γ-Al2O3 present in all experiments is the main source for methane formation with these supports. In contrast, TiO2 shows a fivefold PCH4 of around 264 μmol g−1 h−1. After impregnation with In2O3, methane formation increased for γ-Al2O3 to 1070 μmol g−1 h−1 and TiO2 to 3000 μmol g−1 h−1, while no noteworthy changes in PCH4 were observed for In2O3/SiO2 (1 μmol g−1 h−1) and In2O3/ZrO2 (14 μmol g−1 h−1).
Furthermore, the support materials as well as the most promising catalyst of this series, In2O3/ZrO2, were characterized by NH3- and CO2-TPD. N2-physisorption was conducted, comparing the as-bought supports with their In2O3 loaded forms (see Table S3†). Additionally, H2-TPR and XRD were performed on In2O3/ZrO2 after the reaction. No direct correlation between acidity or basicity and the activity for the MSR step was observed for the tested catalyst materials. Impregnation with In2O3 resulted in a reduction in the number of basic sites for ZrO2. The number of acid sites of In2O3/ZrO2, however, remained unchanged compared to the pure zirconia. BET analysis shows a reduction of the surface area, total pore volume and average pore diameter for all materials, after In2O3 loading. The H2-TPR profile of In2O3/ZrO2 (see Fig. S2†) shows reduction peaks at around 120 °C and 190 °C. Consequently, the indium catalyst is reduced at a SRD reaction temperature of 350 °C, at least if pure hydrogen gas is applied. After the TPR experiment, the characteristic yellow coloration of the catalyst changed to metallic grey, indicating the formation of In0. However, indium catalysts after the SRD reaction remained yellow and maintained their In2O3 structure as XRD measurements confirm (see Fig. S3†). Based on these findings, we conclude that due to the presence of the oxidants H2O and CO2, the complete reduction of In2O3 is prevented during SRD. These findings are supported by the work of Wang et al.,49 who proposed a redox mechanism for MSR over In2O3 catalysts.
Catalyst composition – variation of indium content
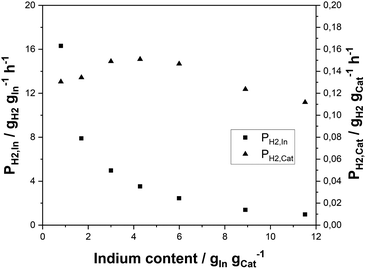
Having identified the In2O3/ZrO2 system as very promising in terms of selectivity and activity for SRD, the question of the optimum indium content was pursued. For this purpose, the indium content on ZrO2 was varied between 0.8 and 11.5 wt%. All as-prepared In2O3/ZrO2 catalysts were compared concerning their hydrogen productivity per gram indium, PH2,In, and their productivity per catalyst mass, PH2,cat (for DME conversion, H2 yield and selectivities see Fig. S4† in the ESI). For the series, a constant catalyst mass of 3 g was maintained.Fig. 3 illustrates an exponential decrease in PH2,In with increasing indium content. PH2,cat, however, reaches a maximum at indium contents between 3 and 4.5 wt% and declines slightly at higher loadings. A possible explanation is given in the literature on In2O3/ZrO2 catalysts in methanol synthesis,56,57 where the authors claimed that the active sites of the In2O3/ZrO2 catalysts are situated at the interfaces of the two metal oxides. Therefore, an initial increase of PH2,cat is expected by increasing the In loading as the number of In2O3 particles rises until an optimum surface coverage is obtained. From thereon, the number of In2O3–ZrO2 interface sites is reduced due to particle growth and agglomeration. To shed light on the matter, the average crystallite size (dc) of the In2O3 particles was estimated from the diffraction patterns of the materials (see Fig. S5†) with the Scherrer equation (see Table S4†). Only the catalysts with indium contents of 3 wt% and higher were considered as the characteristic reflex of In2O3 at 30.6° is too insignificant at lower loadings. As expected, an increase in dc is observed from 8.4 nm at 3 wt% to 12.4 nm at 11.5 wt% indium content. These values are in good agreement with those reported elsewhere.58–60 Further characterisation of the materials with N2-physisorption shows that the catalyst surface, pore volume and average pore diameter decrease with increasing indium content (see Fig. S6 in the ESI†).
Role of the pore diffusion limitation
For technical use in a fixed-bed reactor, only pelletized catalysts can be employed to limit the pressure drop in the reactor. However, the use of catalyst pellets can cause pore diffusion limitations, which in turn limit the observed reaction rate in the system. To find out whether such limitations occur in the case of our SRD application, we applied the Weisz–Prater criterion assuming a first order reaction and found the result in the same order of magnitude as the threshold value of 1,61 indicating the possibility of limiting influences by pore diffusion. For further experimental validation, a variation of the catalyst particle size was carried out. In2O3/ZrO2 with an indium content of 2.3 wt% was prepared on 3 mm zirconia pellets and tested under reference conditions (p = 2 bar(a); T = 350 °C; nH2O![[thin space (1/6-em)]](https://www.rsc.org/images/entities/char_2009.gif) :
:![[thin space (1/6-em)]](https://www.rsc.org/images/entities/char_2009.gif) nDME
nDME![[thin space (1/6-em)]](https://www.rsc.org/images/entities/char_2009.gif) :
:![[thin space (1/6-em)]](https://www.rsc.org/images/entities/char_2009.gif) nN2 = 5
nN2 = 5![[thin space (1/6-em)]](https://www.rsc.org/images/entities/char_2009.gif) :
:![[thin space (1/6-em)]](https://www.rsc.org/images/entities/char_2009.gif) 1
1![[thin space (1/6-em)]](https://www.rsc.org/images/entities/char_2009.gif) :
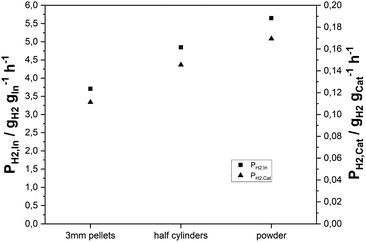
:![[thin space (1/6-em)]](https://www.rsc.org/images/entities/char_2009.gif) 1.5; mMSR-cat = 3 g; mγ-Al2O3 = 3 g; treaction = 24 h; GHSV = 2500 h−1). Afterwards, the pellets were mechanically split to yield half cylinders with an average radial diameter of 1.5 mm. To obtain an even lower catalyst size, the pellets were subsequently crushed into powder. Fig. 4 shows the hydrogen productivities achieved, when applying the three catalyst particle sizes. An increase in hydrogen productivity from 0.11 gH2 gcat−1 h−1 to 0.15 gH2 gcat−1 h−1 was observed by splitting the pellets. PH2,cat was further enhanced to 0.17 gH2 gcat−1 h−1 for the catalyst powder, giving further evidence to pore diffusion limitation.
1.5; mMSR-cat = 3 g; mγ-Al2O3 = 3 g; treaction = 24 h; GHSV = 2500 h−1). Afterwards, the pellets were mechanically split to yield half cylinders with an average radial diameter of 1.5 mm. To obtain an even lower catalyst size, the pellets were subsequently crushed into powder. Fig. 4 shows the hydrogen productivities achieved, when applying the three catalyst particle sizes. An increase in hydrogen productivity from 0.11 gH2 gcat−1 h−1 to 0.15 gH2 gcat−1 h−1 was observed by splitting the pellets. PH2,cat was further enhanced to 0.17 gH2 gcat−1 h−1 for the catalyst powder, giving further evidence to pore diffusion limitation.
Reaction conditions for optimized hydrogen yield
This study aims to optimize the SRD reaction in the context of technical hydrogen transport scenarios. We were therefore interested in conducting experiments targeting full DME conversion and maximum H2 yield. We mixed 36 g of our 3 wt% In2O3 on the ZrO2 catalyst with 9 g γ-Al2O3 and tested this mixture at 350 °C, 2 bar(a) and a molar feed ratio of DME![[thin space (1/6-em)]](https://www.rsc.org/images/entities/char_2009.gif) :
:![[thin space (1/6-em)]](https://www.rsc.org/images/entities/char_2009.gif) H2O
H2O![[thin space (1/6-em)]](https://www.rsc.org/images/entities/char_2009.gif) :
:![[thin space (1/6-em)]](https://www.rsc.org/images/entities/char_2009.gif) N2 in a ratio of 1
N2 in a ratio of 1![[thin space (1/6-em)]](https://www.rsc.org/images/entities/char_2009.gif) :
:![[thin space (1/6-em)]](https://www.rsc.org/images/entities/char_2009.gif) 5
5![[thin space (1/6-em)]](https://www.rsc.org/images/entities/char_2009.gif) :
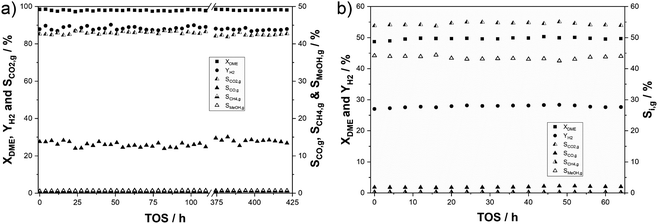
:![[thin space (1/6-em)]](https://www.rsc.org/images/entities/char_2009.gif) 1.5. Under these conditions, a DME conversion of 98% was obtained with a hydrogen yield of 88%. A CO2 selectivity of 85% was achieved, while CO selectivity was determined to be 13%. This indicates that that rWGS is promoted under the applied conditions due to high H2 and CO2 partial pressures. Additionally, methane and methanol residues were detected in the product gas mixture amounting to SMeOH = 0.65% and SCH4 = 0.5%. In the timeframe indicated by the interception starting at around 120 h time on stream in Fig. 5a, parameter variations were conducted to test the influence of temperature, feed gas composition and residence time on catalyst stability. No changes in conversion, selectivities and hydrogen yield have been observed comparing the first 110 h and 55 h at the end of the experiment. This demonstrates an exceptional robustness of the catalyst in SRD over the entire time of 425 h on stream. To verify that deactivation is not hidden by a surplus of active centres under these conditions, an additional stability experiment was conducted at a reduced conversion of 50% (see Fig. 5b). Under the same reaction conditions, a catalyst mixture of 3 g In2O3/ZrO2 (3 wt% indium content) and 3 g γ-Al2O3 maintained a stable hydrogen yield of 28% over 64 h time-on-stream. A constant CO2 selectivity of SCO2,g = 54% (SCO2,c > 96%) indicates that side reactions are less dominant at lower conversions. The selectivities of the other C1 products amounted to 43% for methanol, 1.9% for CO (SCO,c = 3.3%) and 0.2% for CH4 (SCH4,c = 0.4%). For comparison, a commercial CZA catalyst and a self-synthesized 1 wt% PdZn/Al2O3 were tested as well (see Fig. S7a–d in the ESI†). Hydrogen yields of 23% and 33% were achieved here with 3 g of the Cu and Pd catalysts, respectively. While very selective for the desired H2/CO2 product mixture, the CZA loses around 15% of its initial activity over 48 h TOS, showing the expected deactivation as described in the literature. Applying the PdZn catalyst, in contrast, resulted in significant by-product formation with high selectivities to CO (SCO,g > 66%) and CH4 (SCH4,g > 2%). The observed deactivation over this catalyst in comparison to CZA is even stronger with YH2 dropping by 28% relative to the start of the reaction. The stability of pure alumina was also investigated for the hydrolysis step at 400 °C with no decline in DME conversion over more than 90 h (see Fig. S8 in the ESI†).
1.5. Under these conditions, a DME conversion of 98% was obtained with a hydrogen yield of 88%. A CO2 selectivity of 85% was achieved, while CO selectivity was determined to be 13%. This indicates that that rWGS is promoted under the applied conditions due to high H2 and CO2 partial pressures. Additionally, methane and methanol residues were detected in the product gas mixture amounting to SMeOH = 0.65% and SCH4 = 0.5%. In the timeframe indicated by the interception starting at around 120 h time on stream in Fig. 5a, parameter variations were conducted to test the influence of temperature, feed gas composition and residence time on catalyst stability. No changes in conversion, selectivities and hydrogen yield have been observed comparing the first 110 h and 55 h at the end of the experiment. This demonstrates an exceptional robustness of the catalyst in SRD over the entire time of 425 h on stream. To verify that deactivation is not hidden by a surplus of active centres under these conditions, an additional stability experiment was conducted at a reduced conversion of 50% (see Fig. 5b). Under the same reaction conditions, a catalyst mixture of 3 g In2O3/ZrO2 (3 wt% indium content) and 3 g γ-Al2O3 maintained a stable hydrogen yield of 28% over 64 h time-on-stream. A constant CO2 selectivity of SCO2,g = 54% (SCO2,c > 96%) indicates that side reactions are less dominant at lower conversions. The selectivities of the other C1 products amounted to 43% for methanol, 1.9% for CO (SCO,c = 3.3%) and 0.2% for CH4 (SCH4,c = 0.4%). For comparison, a commercial CZA catalyst and a self-synthesized 1 wt% PdZn/Al2O3 were tested as well (see Fig. S7a–d in the ESI†). Hydrogen yields of 23% and 33% were achieved here with 3 g of the Cu and Pd catalysts, respectively. While very selective for the desired H2/CO2 product mixture, the CZA loses around 15% of its initial activity over 48 h TOS, showing the expected deactivation as described in the literature. Applying the PdZn catalyst, in contrast, resulted in significant by-product formation with high selectivities to CO (SCO,g > 66%) and CH4 (SCH4,g > 2%). The observed deactivation over this catalyst in comparison to CZA is even stronger with YH2 dropping by 28% relative to the start of the reaction. The stability of pure alumina was also investigated for the hydrolysis step at 400 °C with no decline in DME conversion over more than 90 h (see Fig. S8 in the ESI†).
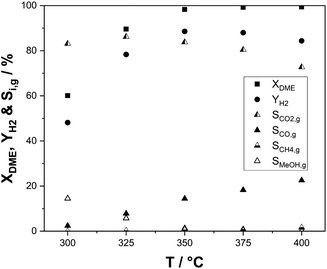
As the SRD reaction is endothermic, it constantly requires heat input at the temperature level of the reaction. From the aspect of heat integration between hydrogen release from DME and energetic hydrogen utilization, the temperature of the SRD reaction and its influence on selectivity and productivity are therefore of great interest. The results of our temperature variation experiments are shown in Fig. 6. DME conversion was not complete at temperatures below 350 °C with 60% at 300 °C and around 90% at 325 °C. Accordingly, hydrogen yields are low (48% at 300 °C and 77% at 325 °C) and more unreacted methanol was present in the product mixture leaving the reactor. This demonstrates the limited SRD activity of the γ-Al2O3–In2O3/ZrO2 catalyst mixture at temperatures below 350 °C. Over the whole temperature range of 300–400 °C, the CO selectivity steadily increases from 2.4% to 23% reflecting the increasing dominance of the rWGS reaction. CO2 selectivity and hydrogen yield consequently decrease above 350 °C. Note that high CO selectivities are not considered as a major concern in the context of SRD as CO can be easily converted in a low temperature WGS step to CO2 and additional hydrogen. Methane, the only other by-product, is regarded as more problematic, since its reforming would require much harsher conditions. Therefore, a subsequent conversion of methane to hydrogen is not feasible. In this context, it is remarkable that the here-reported catalyst system shows only very low selectivities to methane (0.1–1.6%), despite the almost full DME and methanol conversion.
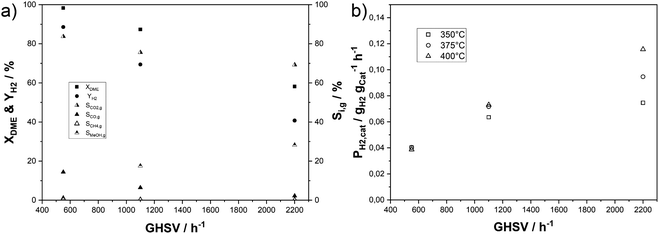
In our next set of experiments, we increased the gas hourly space velocity (GHSV) by two- and four-fold at a temperature of 350 °C, a measure that simultaneously lowers the residence time in the catalyst bed (see Fig. 7a). As expected, the DME conversion declines with shorter residence time, amounting to 58% at the highest GHSV. The selectivity to CO2, CO and CH4 decreases, while the share of unreacted methanol increases with higher GHSV. The same experiments were conducted at 375 °C and 400 °C yielding similar results (see Fig. S9 in the ESI†). An important difference is that DME conversions still exceed 96% under these elevated temperatures and a GHSV of 1100 h−1. Methanol selectivities of around 12% for both elevated temperatures show that the activity of the MSR component is limiting the hydrogen yield with the applied physical catalyst mixture even though the mass ratio of In2O3/ZrO2 to γ-Al2O3 was 4. A comparison of hydrogen productivities for the temperature and GHSV variation is depicted in Fig. 7b. Similar productivities of 0.040 gH2 gcat−1 h−1 are achieved at low GHSV for all temperatures with only a slightly lower PH2,cat of 0.037 gH2 gcat−1 h−1 at 400 °C due to increased by-product formation. Doubling the GHSV results in an almost twofold PH2,cat of 0.073 gH2 gcat−1 h−1 at 400 and 375 °C, while the rise at 350 °C is slightly lower. After further increasing the GHSV to 2200 h−1PH2,cat increases further, but the effect is stronger with higher temperature. The highest PH2,cat of 0.116 gH2 gcat−1 h−1 is reached at 400 °C, while the combination of 2200 h−1 and 350 °C results in a productivity of 0.064 gH2 gcat−1 h−1. While full DME conversion is reached at the lowest GHSV, the observed split-up of productivities at higher GSHV is due to the more pronounced decrease in conversion with lower temperature.
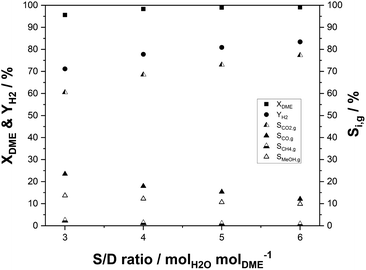
For hydrogen release by SRD, water needs to be evaporated to react with DME in the gas phase. Therefore, excess steam can push the DME conversion and hydrogen yield thermodynamically and kinetically. In contrast, the high heat capacity and evaporation enthalpy make the process energetically less attractive, if high amounts of steam are applied. In order to optimize this important tradeoff, it is crucial to investigate catalytic effects as a function of different molar steam-to-DME (S/D) ratios. In our experiments, this ratio was varied from stoichiometric (S/D = 3) to twofold overstoichiometric (S/D = 6). The variation was carried out at 400 °C at a GHSV of 1100 h−1. The results are shown in Fig. 8. Increasing S/D leads to rising hydrogen yields and selectivities. Undesired side reactions like rWGS, DME decomposition or methanation are effectively suppressed with higher water partial pressures, as indicated by dropping CO (from 23% at S/D = 3 to 12% at S/D = 6) and CH4 selectivities (2.3% to 0.7%). Following the trend observed in Fig. 8 even higher S/D would further increase the hydrogen yield. However, due to the energy and cost intensive steam generation, there is an optimum S/D ratio that depends on the availability of steam at the specific site of operation.
Maximizing H2 yield by coupling with a water–gas-shift reactor
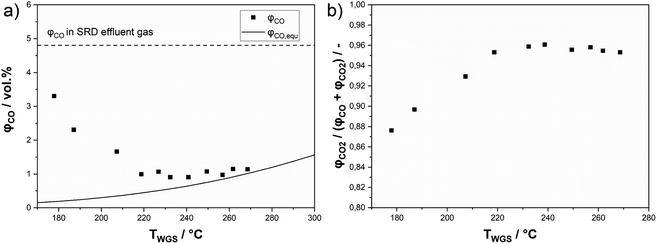
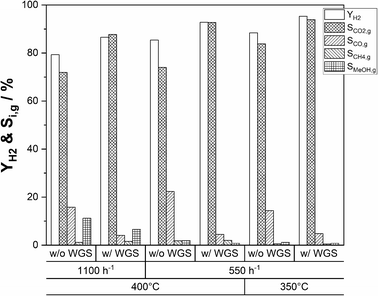
An alternative approach to maximize the hydrogen yield from DME reforming is to operate a sequence of SRD and WGS. This approach allows the operation of the WGS reactor at lower temperatures compared to the SRD reactor to convert more of CO to hydrogen for achieving low CO concentrations in the final product mixture. To test this approach, we integrated a shift reactor containing 10 g of a commercial WGS catalyst (Südchemie, ShiftMax® 240) into our SRD laboratory plant (see Fig. S1 in the ESI†). Additionally, a fresh batch of In2O3/ZrO2 with a slightly higher indium content of 3.6 wt% was applied to reduce the concentration of unreacted methanol in the product mixture leaving the SRD reactor. Prior to the temperature variation in the WGS reactor, the CO concentration leaving the SRD reactor was determined to be 4.8 vol% (dotted line in Fig. 9a) under SRD conditions of 400 °C and a GHSV of 1100 h−1. The higher temperature was chosen to better demonstrate the influence of the WGS step on the final CO content. From the measured concentrations in the product gas leaving the SRD reactor, the composition of the gas stream entering the WGS reactor was calculated. The WGS equilibria were simulated based on that feed composition as a function of temperature using an Aspen Plus V10 and are represented in Fig. 9a as a solid line. Lastly, Fig. 9a also shows the as-measured points of the experimentally obtained CO concentrations at the outlet of the SRD + WGS combination. The WGS reactor was operated at temperatures between 170 and 270 °C and at 1 atm. In the whole temperature range, a significant reduction of the CO concentration was observed through the subsequent WGS operation. However, while decreasing temperature is beneficial for CO conversion due to its exothermal nature, the WGS reaction is not fast enough to reach equilibrium at temperatures below 220 °C in our setup. From 230 °C upwards, CO concentrations are close to the equilibrium indicating sufficiently high WGS rates. Note that an alternative way to reach equilibrium in the WGS at lower temperatures would be to increase the WGS reaction volume. For our setup, the optimum temperature at around 230–240 °C resulted in a minimum CO concentration of 0.9 vol% and a selectivity to CO2 of 96% (see Fig. 9b). Thus, with the addition of the WGS reactor, the hydrogen yield was boosted from 79 to 87%. As mentioned before, methanol is not completely converted at the given GHSV (1100 h−1) used for the WGS temperature variation. Moreover, the chosen temperature of 400 °C in SRD promotes methane formation, limiting the hydrogen yield. Therefore, to increase YH2, first the GHSV was decreased to 550 h−1 at 400 °C to increase methanol conversion. In a second step, a temperature of 350 °C was used for the SRD reactor to decrease methane selectivity. For both experiments, 240 °C was maintained in the WGS reactor. Fig. 10 shows the influence of these parameter optimization experiments. A reference is given for operation without a WGS bed for all stationary points.By decreasing the GHSV to 550 h−1 at 400 °C without WGS, YH2 increases from 79% to 85% as a result of increasing methanol conversion. The same effect leads to a YH2 of 92% with use of the WGS reactor. The temperature reduction to 350 °C results in a peak hydrogen yield of 95% (without WGS: YH2 = 88%) due to the reduced SCH4,g that decreases from 2% at 400 °C to only 0.5% at 350 °C. Lastly, we studied the stability of the SRD + WGS sequence at a GHSV of 550 h−1 with 400 °C in the SRD and 240 °C (see Fig. S10 in the ESI†). Over 64 h, no changes in hydrogen yield (92%), conversions or selectivities were observed, implying that the WGS catalyst and the SRD catalyst mixture are stable under the applied reaction conditions.
Conclusions
In this work, we have successfully developed a highly selective and long-term stable catalyst system for hydrogen production from DME via SRD. We show that a physical mixture of γ-Al2O3 and zirconia-supported In2O3 is suitable to realize high hydrogen yields from DME, thus enabling the further technical exploitation of the highly promising DME/CO2 hydrogen storage cycle for long distance point-to-point hydrogen transport. Our screening of different metal oxide supports and variation of the indium content revealed that 3–4.5 wt% In2O3 on ZrO2 provides the best performance in SRD. The physical mixture of pelletized In2O3/ZrO2 and γ-Al2O3 maintained a constant hydrogen yield of 88% over 425 h at 350 °C. The fact that stability was fully maintained even after variation of the process temperature, GHSV and steam-to-DME ratio demonstrates excellent catalyst stability. Pore diffusion limitations were shown to negatively affect hydrogen productivity in the pelletized catalyst system. Strategies to decrease the influence of mass transport limitations include using catalyst pellets with smaller diameters, the synthesis and application of core shell catalyst pellets, the usage of coated structures or monoliths and the application of powder catalysts in a fluidized bed reactor.Our parameter variation studies indicate that a temperature of 350 °C and over-stoichiometric S/D ratios (≥4) are beneficial for maximizing the hydrogen yield with methane being the most critical side-product to be avoided. CO formation, which is significant in the SRD temperature range (SCO,g up to 23% at 400 °C), limits hydrogen production from DME. To increase the hydrogen yield of the overall process, CO in the product stream of the SRD reactor can be further converted to hydrogen via low-temperature WGS as demonstrated in our two reactor setup. Accordingly, the CO concentration was reduced to 0.9 vol%, resulting in a YH2 of 95% under optimized process conditions. In more sophisticated future setups, partial separation of hydrogen in-between the SRD and the WGS step could further enhance hydrogen yields towards complete utilization of the very attractive hydrogen capacity offered by DME for transportation and storage.
Author contributions
Conceptualisation and methodology: RS and PS; investigation: RS, FS, and EH; project administration and supervision: PW and PS; visualisation and writing of the original draft: RS; review and editing: PW and PS.Conflicts of interest
There are no conflicts to declare.Notes and references
- International Energy Agency, Global Hydrogen Review 2023, https://www.iea.org/reports/global-hydrogen-review-2023, accessed 19.10.2023.
- R. d'Amore-Domenech, V. L. Meca, B. G. Pollet and T. J. Leo, Energy, 2023, 267, 126621 CrossRef.
- A. Okunlola, T. Giwa, G. Di Lullo, M. Davis, E. Gemechu and A. Kumar, Int. J. Hydrogen Energy, 2022, 47, 6453–6477 CrossRef CAS.
- M. Al-Breiki and Y. Bicer, Energy Convers. Manage., 2020, 209, 112652 CrossRef CAS.
- P. Preuster, A. Alekseev and P. Wasserscheid, Annu. Rev. Chem. Biomol. Eng., 2017, 8, 445–471 CrossRef CAS PubMed.
- H. Kim, A. Kim, M. Byun and H. Lim, Renewable Energy, 2021, 180, 552–559 CrossRef CAS.
- E. Catizzone, C. Freda, G. Braccio, F. Frusteri and G. Bonura, J. Energy Chem., 2021, 58, 55–77 CrossRef CAS.
- E. Pawelczyk, N. Łukasik, I. Wysocka, A. Rogala and J. Gębicki, Energies, 2022, 15, 4964 CrossRef CAS.
- D. A. Good, J. S. Francisco, A. K. Jain and D. J. Wuebbles, J. Geophys. Res.: Atmos., 1998, 103, 28181–28186 CrossRef CAS.
- P. Balcombe, J. F. Speirs, N. P. Brandon and A. D. Hawkes, Environ. Sci.: Processes Impacts, 2018, 20, 1323–1339 RSC.
- P. Schühle, R. Stöber, M. Semmel, A. Schaadt, R. Szolak, S. Thill, M. Alders, C. Hebling, P. Wasserscheid and O. Salem, Energy Environ. Sci., 2023, 16, 3002–3013 RSC.
- M. Fasihi, O. Efimova and C. Breyer, J. Cleaner Prod., 2019, 224, 957–980 CrossRef CAS.
- N. McQueen, K. V. Gomes, C. McCormick, K. Blumanthal, M. Pisciotta and J. Wilcox, Prog. Energy, 2021, 3, 032001 CrossRef.
- Z. Azizi, M. Rezaeimanesh, T. Tohidian and M. R. Rahimpour, Chem. Eng. Process., 2014, 82, 150–172 CrossRef CAS.
- S. Banivaheb, S. Pitter, K. H. Delgado, M. Rubin, J. Sauer and R. Dittmeyer, Chem. Ing. Tech., 2022, 94, 240–255 CrossRef CAS.
- G. Bonura, S. Todaro, C. Cannilla and F. Frusteri, in The Carbon Chain in Carbon Dioxide Industrial Utilization Technologies, ed. D. Wawrzyńczak, I. Majchrzak-Kucęba, C. Pevida, G. Bonura, R. Nogueira and M. De Falco, CRC Press, Boca Raton, 1st edn, 2022, ch. 5, vol. 1, pp. 83–97 Search PubMed.
- Carbon Recycling International, World's largest CO2-to-Methanol plant starts production, https://www.carbonrecycling.is/news-media/worlds-largest-co2-to-methanol-plant-starts-production, accessed 10.11.2023.
- T. A. Semelsberger and R. L. Borup, J. Power Sources, 2005, 152, 87–96 CrossRef CAS.
- A. G. Gayubo, J. Vicente, J. Ereña, L. Oar-Arteta, M. J. Azkoiti, M. Olazar and J. Bilbao, Appl. Catal., A, 2014, 483, 76–84 CrossRef CAS.
- K. Faungnawakij, R. Kikuchi, T. Matsui, T. Fukunaga and K. Eguchi, Appl. Catal., A, 2007, 333, 114–121 CrossRef CAS.
- Z.-C. Shao, L. Wang, M.-L. Zhu, C. Liu and Z.-W. Liu, Catalysts, 2022, 12, 1355 CrossRef CAS.
- S.-S. Wang, Y.-H. Song, Y.-H. Zhao, C. Liu, Y.-S. Xiao, Q. Zhang, Z.-T. Liu and Z.-W. Liu, Catal. Today, 2020, 351, 68–74 CrossRef CAS.
- J. Vicente, J. Ereña, L. Oar-Arteta, M. Olazar, J. Bilbao and A. G. Gayubo, Ind. Eng. Chem. Res., 2014, 53, 3462–3471 CrossRef CAS.
- K. Faungnawakij, N. Shimoda, T. Fukunaga, R. Kikuchi and K. Eguchi, Appl. Catal., A, 2008, 341, 139–145 CrossRef CAS.
- K. Faungnawakij, N. Shimoda, T. Fukunaga, R. Kikuchi and K. Eguchi, Appl. Catal., B, 2009, 92, 341–350 CrossRef CAS.
- Y. Tanaka, R. Kikuchi, T. Takeguchi and K. Eguchi, Appl. Catal., B, 2005, 57, 211–222 CrossRef CAS.
- L. Oar-Arteta, A. Remiro, F. Epron, N. Bion, A. T. Aguayo, J. Bilbao and A. G. Gayubo, Ind. Eng. Chem. Res., 2016, 55, 3546–3555 CrossRef CAS.
- H. Yoshida, N. Iwasa, H. Akamatsu and M. Arai, Int. J. Hydrogen Energy, 2015, 40, 5624–5627 CrossRef CAS.
- C. Ledesma, U. S. Ozkan and J. Llorca, Appl. Catal., B, 2011, 101, 690–697 CrossRef CAS.
- R. Inagaki, R. Manabe, Y. Hisai, Y. Kamite, T. Yabe, S. Ogo and Y. Sekine, Int. J. Hydrogen Energy, 2018, 43, 14310–14318 CrossRef CAS.
- X. Deng, T. Yang, Q. Zhang, Y. Chu, J. Luo, L. Zhang and P. Li, Int. J. Hydrogen Energy, 2019, 44, 2417–2425 CrossRef CAS.
- X. Long, Y.-H. Song, Z.-T. Liu and Z.-W. Liu, Int. J. Hydrogen Energy, 2019, 44, 21481–21494 CrossRef CAS.
- X. Wang, X. Pan, R. Lin, S. Kou, W. Zou and J.-X. Ma, Int. J. Hydrogen Energy, 2010, 35, 4060–4068 CrossRef CAS.
- C. Ledesma and J. Llorca, J. Phys. Chem. C, 2011, 115, 11624–11632 CrossRef CAS.
- L. Oar-Arteta, A. Remiro, J. Vicente, A. T. Aguayo, J. Bilbao and A. G. Gayubo, Fuel Process. Technol., 2014, 126, 145–154 CrossRef CAS.
- J. Vicente, A. G. Gayubo, J. Ereña, A. T. Aguayo, M. Olazar and J. Bilbao, Appl. Catal., B, 2013, 130–131, 73–83 CrossRef CAS.
- P. Schühle, S. Reichenberger, G. Marzun and J. Albert, Chem. Ing. Tech., 2021, 93, 585–593 CrossRef.
- M. S. Frei, C. Mondelli, A. Cesarini, F. Krumeich, R. Hauert, J. A. Stewart, D. Curulla Ferré and J. Pérez-Ramírez, ACS Catal., 2019, 10, 1133–1145 CrossRef.
- O. Martin, A. J. Martin, C. Mondelli, S. Mitchell, T. F. Segawa, R. Hauert, C. Drouilly, D. Curulla-Ferre and J. Perez-Ramirez, Angew. Chem., Int. Ed. Engl., 2016, 55, 6261–6265 CrossRef CAS PubMed.
- P. Schühle, M. Schmidt, L. Schill, A. Riisager, P. Wasserscheid and J. Albert, Catal. Sci. Technol., 2020, 10, 7309–7322 RSC.
- K. Lau, P. Schühle, S.-X. Liang, F. de Kock, J. Albert and S. Reichenberger, ACS Appl. Energy Mater., 2021, 4, 9206–9215 CrossRef CAS.
- N. Köwitsch, L. Thoni, B. Klemmed, A. Benad, P. Paciok, M. Heggen, I. Köwitsch, M. Mehring, A. Eychmüller and M. Armbrüster, ACS Catal., 2020, 11, 304–312 CrossRef.
- R. L. Barbosa, V. Papaefthimiou, Y. T. Law, D. Teschner, M. Hävecker, A. Knop-Gericke, R. Zapf, G. Kolb, R. Schlögl and S. Zafeiratos, J. Phys. Chem. C, 2013, 117, 6143–6150 CrossRef CAS.
- N. Iwasa and N. Takezwwa, Top. Catal., 2003, 22, 215–224 CrossRef CAS.
- D. Liu, Y. Men, J. Wang, G. Kolb, X. Liu, Y. Wang and Q. Sun, Int. J. Hydrogen Energy, 2016, 41, 21990–21999 CrossRef CAS.
- K. Ploner, L. Schlicker, A. Gili, A. Gurlo, A. Doran, L. Zhang, M. Armbrüster, D. Obendorf, J. Bernardi, B. Klötzer and S. Penner, Sci. Technol. Adv. Mater., 2019, 20, 356–366 CrossRef CAS PubMed.
- L. Thoni, N. Metzkow and A. Eychmüller, J. Sol-Gel Sci. Technol., 2022, 107, 218–226 CrossRef.
- M. Wichert, R. Zapf, A. Ziogas, G. Kolb and E. Klemm, Chem. Eng. Sci., 2016, 155, 201–209 CrossRef CAS.
- J. Wang, H. Wang and P. Hu, Sci. China: Chem., 2017, 61, 336–343 CrossRef.
- S. Lin and D. Xie, Chin. J. Chem., 2012, 30, 2036–2040 CrossRef CAS.
- E.-M. Köck, M. Kogler, M. Grünbacher, C. Zhuo, R. Thalinger, D. Schmidmair, L. Schlicker, A. Gurlo and S. Penner, J. Phys. Chem. C, 2016, 120, 15272–15281 CrossRef.
- H. Lorenz, W. Jochum, B. Klötzer, M. Stöger-Pollach, S. Schwarz, K. Pfaller and S. Penner, Appl. Catal., A, 2008, 347, 34–42 CrossRef CAS.
- M. Tahir and N. S. Amin, Chem. Eng. J., 2016, 285, 635–649 CrossRef CAS.
- M. Tahir, B. Tahir, N. A. Saidina Amin and H. Alias, Appl. Surf. Sci., 2016, 389, 46–55 CrossRef CAS.
- T. A. Semelsberger, K. C. Ott, R. L. Borup and H. L. Greene, Appl. Catal., B, 2005, 61, 281–287 CrossRef CAS.
- X. Zhang, A. V. Kirilin, S. Rozeveld, J. H. Kang, G. Pollefeyt, D. F. Yancey, A. Chojecki, B. Vanchura and M. Blum, ACS Catal., 2022, 12, 3868–3880 CrossRef CAS.
- W. G. Cui, Q. Zhang, L. Zhou, Z. C. Wei, L. Yu, J. J. Dai, H. Zhang and T. L. Hu, Small, 2023, 19, 2204914 CrossRef CAS PubMed.
- X. Jiang, X. Nie, Y. Gong, C. M. Moran, J. Wang, J. Zhu, H. Chang, X. Guo, K. S. Walton and C. Song, J. Catal., 2020, 383, 283–296 CrossRef CAS.
- A. Wesner, P. Kampe, N. Herrmann, S. Eller, C. Ruhmlieb and J. Albert, ChemCatChem, 2023, 15, e202301125 CrossRef CAS.
- J. Wang, A. Zhang, X. Jiang, C. Song and X. Guo, J. CO2 Util., 2018, 27, 81–88 CrossRef CAS.
- P. B. Weisz and C. D. Prater, in Advances in Catalysis, ed. W. G. Frankenburg, V. I. Komarewsky and E. K. Rideal, Academic Press, 1954, vol. 6, pp. 143–196 Search PubMed.
Footnote |
| † Electronic supplementary information (ESI) available. See DOI: https://doi.org/10.1039/d4se00059e |
| This journal is © The Royal Society of Chemistry 2024 |

