Multifunctional tunable Cu2O and CuInS2 quantum dots on TiO2 nanotubes for efficient chemical oxidation of cholesterol and ibuprofen†
Nilem
Khaliq
abe,
Ghafar
Ali
 *c,
Muhammad Asim
Rasheed
 *a,
Maaz
Khan
 c,
Yi
Xie
 d,
Patrik
Schmuki
 *e,
Sung Oh
Cho
 f and
Shafqat
Karim
c
aDepartment of Physics and Applied Mathematics, Pakistan Institute of Engineering and Applied Sciences (PIEAS), Islamabad 45650, Pakistan. E-mail: masimr22@gmail.com
bDepartment of Physics, Women University Swabi, Swabi, Khyber Pakhtunkhwa, Pakistan
cNanomaterials Research Group (NRG), Physics Division, PINSTECH, Islamabad 44000, Pakistan. E-mail: ghafarali@kaist.ac.kr
dState Key Laboratory of Silicate Materials for Architectures, Wuhan University of Technology, No. 122, Luoshi Road, Wuhan 430070, China
eDepartment of Materials Science and Engineering, University of Erlangen-Nuremberg, Martensstrasse 7, D-91058 Erlangen, Germany. E-mail: schmuki@ww.uni-erlangen.de
fDepartment of Nuclear and Quantum Engineering (NQe), Korea Advanced Institute of Science and Technology (KAIST), Daejeon 34141, Republic of Korea
First published on 24th May 2024
Abstract
In this study, a CuInS2/Cu2O/TiO2 nanotube (TNT) heterojunction-based hybrid material is reported for the selective detection of cholesterol and ibuprofen. Anodic TNTs were co-decorated with Cu2O and CuInS2 quantum dots (QDs) using a modified chemical bath deposition (CBD) method. QDs help trigger the chemical oxidation of cholesterol by cathodically generating hydroxyl radicals (˙OH). The small size of QDs can be used to tune the energy levels of electrode materials to the effective redox potential of redox species, resulting in highly improved sensing characteristics. Under optimal conditions, CuInS2/Cu2O/TNTs show the highest sensitivity (∼12![[thin space (1/6-em)]](https://www.rsc.org/images/entities/char_2009.gif) 530 μA mM−1 cm−2, i.e. up to 11-fold increase compared to pristine TNTs) for cholesterol detection with a low detection limit (0.013 μM) and a fast response time (1.3 s). The proposed biosensor was successfully employed for the detection of cholesterol in real blood samples. In addition, fast (4 s) and reliable detection of ibuprofen (with a sensitivity of ∼1293 μA mM−1 cm−2) as a water contaminant was achieved using CuInS2/Cu2O/TNTs. The long-term stability and favourable reproducibility of CuInS2/Cu2O/TNTs illustrate a unique concept for the rational design of a stable and high-performance multi-purpose electrochemical sensor.
530 μA mM−1 cm−2, i.e. up to 11-fold increase compared to pristine TNTs) for cholesterol detection with a low detection limit (0.013 μM) and a fast response time (1.3 s). The proposed biosensor was successfully employed for the detection of cholesterol in real blood samples. In addition, fast (4 s) and reliable detection of ibuprofen (with a sensitivity of ∼1293 μA mM−1 cm−2) as a water contaminant was achieved using CuInS2/Cu2O/TNTs. The long-term stability and favourable reproducibility of CuInS2/Cu2O/TNTs illustrate a unique concept for the rational design of a stable and high-performance multi-purpose electrochemical sensor.
Introduction
Multifunctional nanomaterials integrated in a single device have gained considerable interest in the recent advancement of technology in biosensing applications for monitoring food and water quality (environment applications), for the detection of disease biomarkers (healthcare applications), and in genomics.1,2 A variety of nanomaterials such as metal oxides (TiO2, ZnO, MgO, etc.), metal sulphides (CdS), polymers and carbon-based materials (carbon nanotubes (CNTs) and graphene) have been widely investigated as dual-analyte biosensing platforms for the detection of multiple biological analytes such as cholesterol, H2O2, glucose, and pharmaceutical drugs.1 In these applications, the surface of the biosensor was immobilized with two different enzymes for the selective detection of corresponding analytes.3–5 However, owing to the intrinsic instability and expensive nature of enzymes, these biosensors are far away from practical use in point-of-care applications. Non-enzymatic biosensors consisting of hybrid materials can be used as an alternative approach to overcome the above limitations. These sensors provide many beneficial features such as low cost, ease of operation, long shelf life, and resistance to variable sensitivity.6–8 In recent years, the incorporation of functional materials on the surface of matrix elements (TNTs), constituting a hybrid nanostructure, has attracted considerable attention.9–12 For instance, an electrode material with high catalytic activity and few charge recombination sites is desirable.13 In order to obtain this objective, electrodes can be decorated with a combination of functional materials (which, for example, are composed of a matrix material and two different catalysts, usually QDs) with high catalytic activity, which is highly promising.11,14,15 The higher electrochemical activity of QDs can firstly be attributed to their small size, which results in a large surface area. Moreover, the size of QDs can be tuned in the range of quantum confinement effects in such a way that a minimum resistance is encountered by electrons at the surface of the biosensor.16 Another benefit is that the comparable dimensions of QDs and bio-elements offer rapid electronic communication between the QDs and specific recognition sites of the biomolecule during the electrocatalytic process.17The electrochemical performance of the non-enzymatic biosensor is mainly governed by the catalytic activity of the active material as well as the physiochemical properties of the substrate.18 Thus, the selection of the substrate material is as critically important as selecting the active material. Recently, anodic TNTs have gained considerable interest as substrate materials in biosensing due to their various intrinsic properties such as chemical stability, low cost, and excellent biocompatibility.19,20 One advantage of the self-organised nanotubular structure formed on a Ti foil via anodization is its good adhesion to the Ti substrate, which can greatly reduce and simplify the otherwise often tedious process of the modified electrode fabrication. Moreover, the well-aligned nanotubular structure has copious space for the loading of active materials.
Cholesterol detection is of scientific and technological importance due to its role in predicting ever-increasing coronary heart diseases and strokes.21 Numerous efforts have been devoted to the development of highly sensitive, efficient, and reliable cholesterol sensors for real-time detection.22,23 Among them, electrochemical sensing of cholesterol is highly promising for application in rapid and high-throughput biological assays.24,25 Limited reports are available on the non-enzymatic sensing of cholesterol using various electrode systems, hence providing a huge room for further improvement. For instance, a macro-porous gold electrode modified with Pt nanoparticles (NPs) was utilized for enzyme-free cholesterol detection with a sensitivity of 226.2 μA mM−1 cm−2.26 Another study reports27 a sensitivity of ∼62.5 μA mM−1 cm−2 for a cholesterol biosensor composed of flower-like Cu2S nanoplates grown on a Cu rod. Non-enzymatic cholesterol biosensors based on the deposition of Pt NPs on a CNT thin film achieved a sensitivity up to 8.7 μA mM−1 cm−2.28 Recently, our group has reported a non-enzymatic cholesterol sensor using Cu2O NP-decorated TNTs with a maximum sensitivity of around 6034.04 μA mM−1 cm−2, which is much higher than the values reported earlier.29 It might be due to the fact that decorating TNTs with Cu2O NPs leads to the formation of p–n junctions on the surface of TNTs, which suppress the electron–hole pair recombination. The sensitivity of the biosensor can further be increased by tailoring the morphology of Cu2O QDs and using another suitable co-catalyst. CuInS2 with a band gap of ∼1.5 eV is an efficient co-catalyst. Most of the work reported till date exploits the optical properties of CuInS2 QDs in many applications including environmental monitoring, optics, electronics, and energy conversion and storage.14,30–32 However, no report is available to explore the sensing aspects of CuInS2 QDs for biological species.
The presence of pharmaceutical wastes in original forms or as metabolites in water streams is an emerging form of water pollution increasing the concern about on-site analysis of these drugs to check the water quality. Ibuprofen, a non-steroidal and anti-inflammatory drug, is a widely used, and serves as a first choice to treat fever and pain in humans.33,34 About 90% of this drug is metabolized by the liver in the form of hydroxyl and carboxyl species, while the remaining 10% of the drug is excreted via urine unaffected.35–37 The inevitable use of ibuprofen and its discharge in pharmaceutical industries, hospital effluents and human metabolites necessitates the development of novel analytical techniques, procedures and protocols for its detection in waste water.35–40 Owing to the smaller size of ibuprofen, nanomaterials (particularly QDs) as electrode materials can play a vital role in the analysis of ibuprofen and produce a significant response when it interacts with the surface of the sensor.
Herein, we report the synthesis of CuInS2/Cu2O/TNT hybrid nanostructures as biosensing platforms for cholesterol and ibuprofen detection. Anodic TNTs were decorated with Cu2O and CuInS2 QDs by a modified CBD method to achieve more active sites at the surface of the electrode for electrochemical redox reactions and generate a maximum reduction current as a readout signal, thereby obtaining a sensor for cholesterol detection. The Cu2O and CuInS2 QDs help facilitate the chemical oxidation of cholesterol by cathodically generating ˙OH. This approach of co-decoration with multiple functional QDs can effectively amplify the sensing response. The fabricated electrode was further employed for the detection of ibuprofen in waste water. The higher sensitivity of the biosensor for cholesterol and ibuprofen leads to the advancement of the biosensing technology towards dual-analyte biosensor in both diagnostic and environmental applications.
Experimental
Materials and methods
Titanium sheets of 0.1 mm thickness and 99.6% purity were procured from GoodFellow, England, UK. Highly pure ethylene glycol (EG), ammonium fluoride (NH4F), copper sulfate (CuSO4), copper(II) chloride (CuCl2), sodium sulfide (Na2S), indium fluoride (InF3), sodium thiosulfate pentahydrate (H10Na2O8S2), and sodium hydroxide (NaOH) were purchased from Sigma-Aldrich, USA. Other chemicals such as cholesterol, urea, ascorbic acid (A.A.), glucose, and L-cysteine were supplied by Sinopharm Chemical Regent Co. Ltd, China. The aforementioned chemicals were used as received without further purification and de-ionized (DI) water was used in all experiments.Fabrication of non-enzymatic biosensors
![[thin space (1/6-em)]](https://www.rsc.org/images/entities/char_2009.gif) :
:![[thin space (1/6-em)]](https://www.rsc.org/images/entities/char_2009.gif) 4) aqueous solution for 10 s at room temperature, subsequently washed with DI water and then immersed in 0.5 M NaOH for another 10 s at 70 °C. Finally, the modified TNT samples were rinsed with DI water to remove the residual salts. This four-step immersion and rinsing process is considered as one cycle. This process was repeated for 10 cycles to increase the loading density of Cu2O QDs on TNTs.
4) aqueous solution for 10 s at room temperature, subsequently washed with DI water and then immersed in 0.5 M NaOH for another 10 s at 70 °C. Finally, the modified TNT samples were rinsed with DI water to remove the residual salts. This four-step immersion and rinsing process is considered as one cycle. This process was repeated for 10 cycles to increase the loading density of Cu2O QDs on TNTs.
Characterization
A field emission scanning electron microscope (Hitachi FE-SEM S4800, Japan) was used to study the morphology of the samples. A high-resolution transmission electron microscope (HRTEM, Tecnai G2 F20 S-Twin, FEI, USA) equipped with an energy-dispersive X-ray (EDX) spectrometer was employed to obtain the detailed structural and elemental compositions of the samples. An X-ray photoelectron spectrometer (XPS, PHI 5600, US) and an X-ray diffractometer (XRD, X'pert Philips PMD, CuKα 1.54056 Å) were used to determine the chemical bonding and crystal structure of the samples, respectively.Electrochemical measurements
Electrochemical impedance spectroscopy (EIS) was performed using a Zahner (IM6EX, Germany) in the frequency range of 1 MHz to 10 mHz at an open circuit potential, while cyclic voltammetry (CV) and amperometry were performed using an electrochemical workstation (Biologic SP-300, France) with a three-electrode configuration. TNTs, Cu2O/TNTs, CuInS2/TNTs, and CuInS2/Cu2O/TNTs were used as the working electrodes with an exposed area of 0.35 cm2, a saturated calomel (Hg/Hg2Cl2) electrode as the reference electrode and a Pt foil as the counter electrode. All electrochemical experiments were conducted in a 0.1 M phosphate buffer solution (PBS) with a pH of ∼7.5. For cholesterol sensing, a 5 mM stock solution was prepared by dissolving cholesterol in 2 ml of 2-propanol, which was then diluted in 0.1 M PBS as per requirement.A stock solution of ibuprofen was prepared by weighing and crushing 10 tablets of commercial ibuprofen using a mortar and pestle. Then, 10.31 mg of ibuprofen powder was dissolved in 20 ml of methanol and filtered using a 20 μM pore size filter paper. The filtered solution was further diluted in methanol up to 100 ml to obtain a stock solution. In the experiment, 0.1 M PBS with pH 5.5 was used as an electrolyte for all electrochemical measurements.
Results and discussion
Scanning electron microscopy
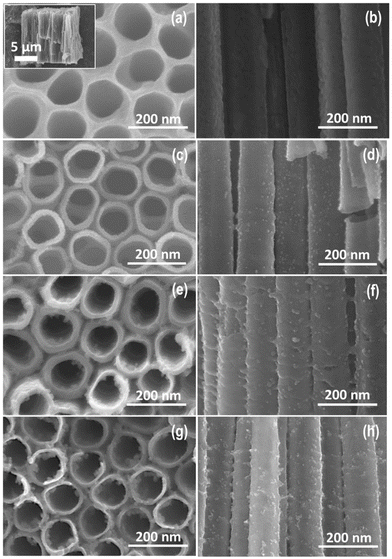
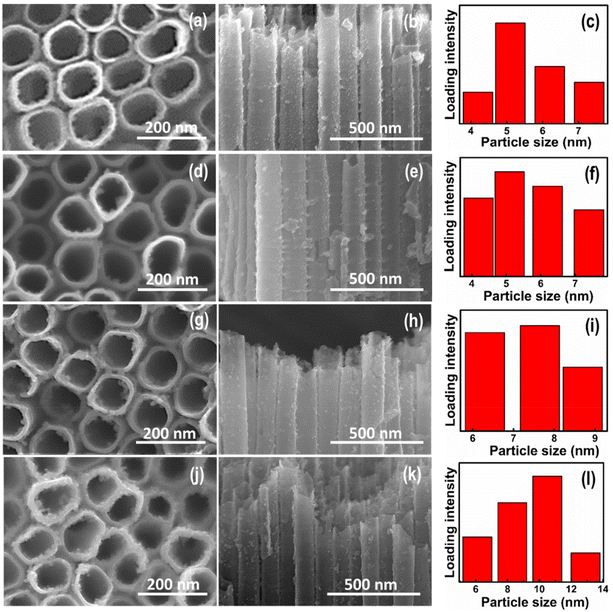
Fig. 1(a–h) shows the typical top and cross-sectional view of FESEM images of the pristine TNTs, Cu2O/TNTs, CuInS2/TNTs, and CuInS2/Cu2O/TNTs. The FESEM images show that the pristine TNTs possess self-organised and vertically oriented nanotubular structures that are orderly grown on a Ti substrate, as shown in Fig. 1(a and b). It can be observed that the opening of the pristine TNTs is circular in shape with an inner diameter of ∼100 nm and a wall thickness of ∼15 nm. The nanotube length was found to be around 10 μm (inset of Fig. 1a). The FESEM images of Cu2O QDs/TNTs heterojunctions prepared for 10 CBD cycles are shown in Fig. 1(c and d). The Cu2O QDs with an average size of about 5 nm can be seen on the top and inner surfaces of the nanotubes in addition to the interface of TNTs. The FESEM images of CuInS2 QD-loaded TNTs for 6 CBD cycles are presented in Fig. 1(e and f). The uniformly dispersed CuInS2 QDs with an average size of around 4–6 nm can be observed at the top as well as along the cross-sectional surfaces of the nanotubes. The top view of the hybrid CuInS2(6)/Cu2O/TNT system is shown in Fig. 1g. Interestingly, in spite of the high loading density of QDs, the nanotube opening is not blocked. Fig. 1h depicts the cross-sectional view of TNTs loaded with both Cu2O and CuInS2(6) QDs. It is clear from the images that the surface of TNTs has become much rough, as the amount of QDs on nanotubes has increased. These results also show that the sonication-assisted CBD method did not destroy the morphology of the vertically oriented nanotubes. Fig. 2(a–l) shows the FESEM images of the CuInS2/Cu2O/TNT hybrid system, along with the estimated QD size, for different loading cycles of CuInS2 QDs while keeping the loading content of Cu2O QDs fixed to 10 cycles. It can be seen that the CuInS2 QD content increases with the increase in deposition cycles. Furthermore, the presence of QDs onto the inner surface and interface of TNTs can also be seen in the corresponding cross-sectional FESEM images (Fig. 2(b, e, h and k)). The bar diagrams in Fig. 2(c, f, i and l) show the distribution of QD sizes for CuInS2(2)/Cu2O/TNTs, CuInS2(4)/Cu2O/TNTs, CuInS2(6)/Cu2O/TNTs and CuInS2(8)/Cu2O/TNTs estimated from their corresponding cross-sectional SEM images. The average QD size increases from 4.9 nm to 9.5 nm with the increase in deposition cycles for the loading of CuInS2 QDs. It is also evident that a particle size distribution with a QD size of about 7 nm is homogeneous for CuInS2(6)/Cu2O/TNTs (Fig. 2i). It should be noted that these sizes fall in the range where the quantum size effects for CuInS2 NPs can be observed.41,42 These results can also be confirmed from the high-resolution SEM images of the same samples, as shown in Fig. S2(a–d),† where the QD size distribution shows variation in the size of QDs from 5.4 to 9.2 nm. In the case of Cu2O QD/TNT electrode system, the same procedure was followed to optimize the loading efficiency and size of the QDs. The FESEM cross-sectional images are provided in the ESI in Fig. S3(a–e)† along with the size distribution of the QDs. For 10 deposition cycles of Cu2O, uniform and homogeneous distributions of Cu2O QDs were observed with a particle size of ∼5 nm. From these data along with electrochemical impedance and sensing results in subsequent sections, the deposition cycles of 10 (Cu2O) and 6 (CuInS2) represent an optimum condition for loading of Cu2O and CuInS2 QDs respectively.Transmission electron microscopy
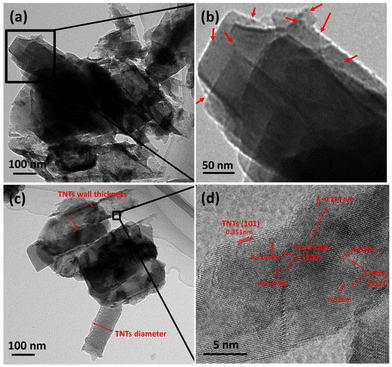
In order to get more detailed morphological and structural insights into the CuInS2/Cu2O/TNTs, HRTEM was performed. Fig. 3a and b shows the TEM images of the sample, demonstrating the successful deposition of uniformly dispersed Cu2O and CuInS2 QDs over the nanotube walls, as pointed by arrows. Fig. 3c shows the smooth morphology of the tube walls with a thickness of about 15 nm and a tube diameter of around 100 nm. The HRTEM images (Fig. 3d) show three different lattice spacings. A lattice spacing of ∼0.35 nm is assigned to TNTs, which corresponds to the (101) plane of anatase TiO2. The QDs with a size of about 3 nm and a lattice spacing of 0.32 nm can be assigned to the (112) lattice planes of CuInS2. The other type of QDs with a comparable size of about 4 nm and a lattice spacing of 0.214 nm is ascribed to Cu2O QDs with preferred orientation along the (200) crystal plane. These results can be further confirmed from the XRD data. Furthermore, the elemental mapping along with energy-dispersive X-ray spectra of the same sample (from the top view with a scanning area of 2 μm) for Ti, O, Cu, In, and S is shown in Fig. S4(a–f).† Fig. S4(a–e)† depicts the uniform distribution of Cu2O and CuInS2 QDs on the TNT matrix. Moreover, the presence of well-defined peaks of Ti, O, Cu, In and S are evident from Fig. S4f† and their atomic weight% illustrates the formation of a good stoichiometric hybrid system.X-ray diffraction
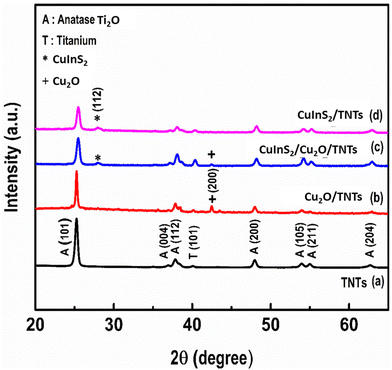
The XRD patterns of the pristine TNTs, Cu2O/TNTs, CuInS2/TNTs, and CuInS2/Cu2O/TNTs are presented in Fig. 4. The main diffraction peak at about 25.27° can be indexed to the (101) anatase TiO2 phase43 (Fig. 4a), which agrees well with the literature (JCPDS card #01-071-1166). After the formation of heterojunctions due to the decoration of Cu2O QDs on TNTs, an additional well-defined peak at 42.47° was observed that is attributed to the (200) plane of Cu2O (Fig. 4b).44,45 This peak can be indexed to the cubic crystal structure according to JCPDS card #00-034-1354. The XRD pattern of CuInS2 QDs decorated on TNTs is presented in Fig. 4d. In addition to the typical peaks of anatase, a peak at 27.95° corresponding to the (112) crystal plane of CuInS2 has been observed that can be indexed according to JCPDS card #85-1575. However, the lower peak intensity may be due to the relatively lower amount and smaller size of the QDs (Fig. 4d). Fig. 4c shows the XRD pattern of the CuInS2/Cu2O/TNT hybrid nanostructure. The diffraction peaks in the XRD pattern of the aforementioned composite system can be attributed to anatase TiO2, Cu2O and CuInS2 QDs. Furthermore, it was found that the diffraction peak of Cu2O located at around 42.47° was less prominent in the case of hybrid nanostructures (after decoration of Cu2O QD/TNT with CuInS2 QDs). This may be due to the deposition of CuInS2 QDs on the Cu2O QD/TNT sample. No obvious impurity peaks were observed, suggesting the high purity of the synthesized samples.X-ray photoelectron spectroscopy
The chemical composition and valence state of the CuInS2(6)/Cu2O/TNT system were investigated by XPS. Fig. 5(a–e) shows the high-resolution spectra of O 1s, Ti 2p, Cu 2p, In 3d, and S 2p respectively. The deconvoluted spectra of O 1s (Fig. 5a) consists of a main peak at a binding energy of around 529.9 eV, which corresponds to the oxygen atom in Ti–O–Ti and the small peak at ∼531.3 eV can be attributed to surface hydroxyl ions.43 In the case of core-level spectra of Ti 2p (Fig. 5b), the two peaks located at binding energies of about 458.7 eV and 464.4 eV can be assigned to Ti 2p3/2 and Ti 2p1/2 respectively which confirms the existence of the Ti4+ state in the material.46 The XPS spectrum of Cu 2p is deconvoluted into four peaks (Fig. 5c), where the two main peaks can be attributed to the Cu 2p3/2 (931.6 eV) and Cu 2p1/2 (951.6 eV) spectra, corresponding to the Cu1+ state. The other two small peaks at 932.7 eV and 953.2 eV are due to the traces of Cu2+ within the sample, which could be due to the exposure of the sample to the atmosphere. It is also worth noting that the Cu 2p satellite peaks related to Cu2+ oxidation state,43,46 which are usually located at ∼942 eV and 962 eV, did not appear in the spectra.47 Therefore, it can be concluded that the majority of Cu2+ has been reduced to Cu1+ during the course of reactions, as shown in the ESI (Fig. S5†). At the initial stage of electrode fabrication when only Cu2O QDs were deposited on TNTs, a significant amount of Cu2+ is also present in the system, as indicated by the satellite peaks in Fig. S5a.† However, by depositing CuInS2 QDs, the traces of Cu2+ are significantly reduced (Fig. S5c†). The In 3d5/2 and In 3d3/2 peaks (shown in Fig. 5d) were located at around 444.9 eV and 452.4 eV with a peak splitting of 7.5 eV, which agrees well with the reported values for In3+.48,49 The S 2p has doublet peaks of S 2p1/2 and S 2p3/2 due to spin–orbit coupling, which can be assigned to the S2− oxidation state.48,49 The first peak of S 2p (Fig. 5e) is located at ∼161.5 eV, which can be attributed to the Cu–S bond, while the other peak at ∼162.6 eV is from In–S.30 Based on the XRD, FESEM, HRTEM, and XPS results, it is concluded that Cu2O and CuInS2 QDs have been successfully deposited on TNTs by our facile sonication-assisted CBD method.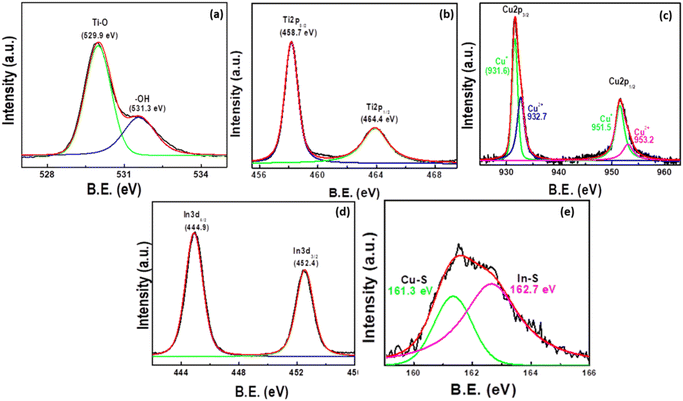 | ||
| Fig. 5 High-resolution XPS spectra of CuInS2(6)/Cu2O/TNT samples showing (a) O 1s, (b) Ti 2p, (c) Cu 2p, (d) In 3d and (e) S 2p states. | ||
Electrochemical impedance spectroscopy (EIS)
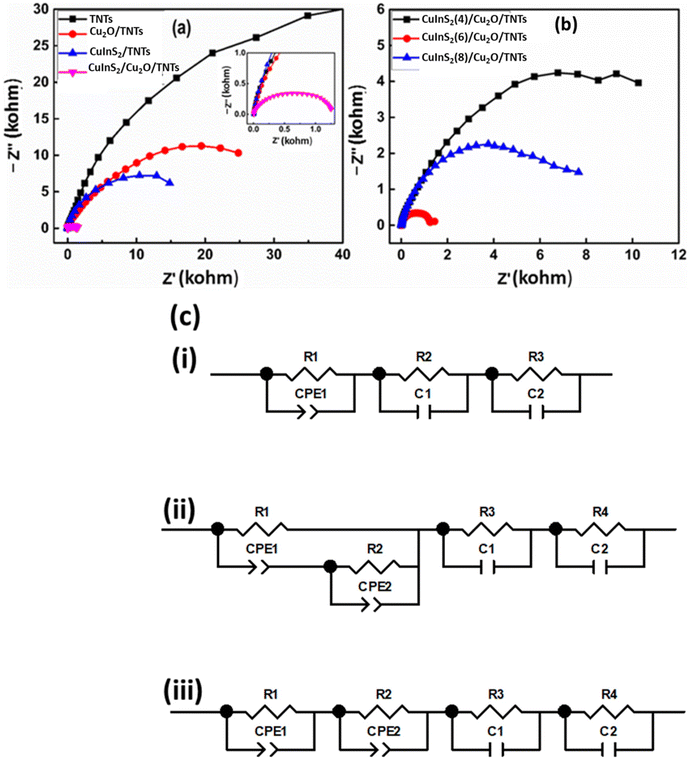
Electrochemical impedance spectroscopy was employed to evaluate the charge transport and transfer properties of the optimized electrode in a relevant electrolyte. Fig. 6a shows the Nyquist plots of the EIS for different electrode configurations in the frequency range of 1 MHz to 10 mHz at an open circuit potential. These plots consist of a semicircle region at higher frequencies that corresponds to the electron transfer limited process. The diameter of the semicircle gives the values of charge transfer resistance (Rct) at the interface of the electrode. As shown in the figure, an abrupt decrease in the area of the semicircle is observed after decorating TNTs with Cu2O QDs, indicating the improved electron transfer ability. Furthermore, the diameter of the semicircle decreases even more due to the deposition of CuInS2 co-catalysts on Cu2O/TNTs. The inset of Fig. 6a shows the magnified view of Nyquist plots at higher frequencies. To find the equivalent circuit for each curve, the fitting of the EIS data was performed using the ZView 2 software. The equivalent circuit for all samples is illustrated in Fig. 6c, and the fitted data are presented in Fig. S6(a–f).† For most of the samples, it is observed that the impedance data is suitably fitted using a series combination of R–C (R and C in parallel) and R–CPE units. Here CPE denotes the constant phase element, R denotes the electric charge transfer resistance and C denotes the double-layer capacitance.50,51Fig. 6c(i) shows the equivalent circuit for TNTs. R1 represents the charge transfer resistance at the TiO2/electrolyte interface, CPE (also called non-ideal double-layer capacitance) is due to the diffusion of electrolytes within nanotubes, R2 and C1 correspond to the Ti/TNT interface and R3 and C2 for the Helmholtz layer.50Fig. 6c(ii) corresponds to the equivalent circuit of the Cu2O/TNT and CuInS2/TNT samples. R1 and CPE1 correspond to the TNT–electrolyte interface and R2 and CPE2 to the TiO2/Cu2O (or CuInS2/TiO2) junction. The third (R3, C1) and fourth (R4, C2) units correspond to the Cu2O–electrolyte (or CuInS2–electrolyte) interface and Helmholtz layer respectively. Fig. S6† also shows the fitting parameters for all the samples. It is observed that the decoration of Cu2O and CuInS2 on TNTs greatly decrease the values of charge transfer resistance. The decrease in the impedance value observed in the Nyquist plots can be ascribed to the efficient catalytic activity of the co-catalyst and small (and adjustable) size of the QDs.16 Both CuInS2 and Cu2O QDs offer a higher interface area with suitable band positions for the efficient electron transfer, which strongly enhances the electron transfer kinetics of redox reaction at the surface of the hybrid material. It should be noted that the smallest area of the semicircle for the CuInS2/Cu2O/TNTs electrode indicates an efficient electrical network through CuInS2 and Cu2O QDs even for this complex hybrid structure. As a result of this configuration, the overall electro-oxidation rate can be greatly improved. The Nyquist plots for different loading cycles of CuInS2 QDs are shown in Fig. 6b. The diameter of the semicircle decreases due to the increase in the loading of QDs up to 6 deposition cycles. A further increase in the deposition cycles subsequently increases the impedance. This enhancement in impedance can be attributed to the increase in the size of QDs and will be discussed in the section of cyclic voltammetry. The equivalent circuit in Fig. 6c(iii) shows the circuit units corresponding to the TNT–electrolyte, TNT–CuInS2 and TNT–Cu2O junctions in addition to the Helmholtz layer (fourth unit).The Mott–Schottky (MS) technique was employed to measure the properties (e.g. carrier densities, flat band potential and conduction type) of the electrode material at the electrode–electrolyte interface. These measurements were performed in a 1 mM NaOH solution using a three-electrode electrochemical cell with Ag/AgCl (in saturated KCl) as the reference electrode, a platinum foil as the counter electrode, and TNTs, Cu2O/TNTs and CuInS2/Cu2O/TNTs as the working electrodes. The carrier densities Nd in different heterostructures can be accurately measured using the following Mott–Schottky equation:
The + and − signs are used for n-type and p-type semiconductors respectively. C is the interfacial capacitance, ε is the dielectric constant of the semiconductor electrode (for TiO2 its 76), ε0 is the vacuum permittivity (8.854 × 10⁻¹² F m−1), e is the electron charge (1.603 × 10⁻¹⁹ C), Vfb is the flat band potential, Nd is the carrier density, A is the electrode area (here the measured area of working electrode is 1.0 cm2), V is the applied voltage, kB is the Boltzmann constant (1.38 × 10⁻²³ J K−1), and T is the absolute temperature.
Fig. 7 shows the derived 1/C2–V MS curves for TNT, Cu2O/TNT and CuInS2/Cu2O/TNT electrodes. The carrier density Nd for TNTs, Cu2O/TNTs and CuInS2/Cu2O/TNTs can be determined by plotting the tangent to the linear portion of the Mott–Schottky curve (as shown in Fig. S7a–c†) and using the following equation:
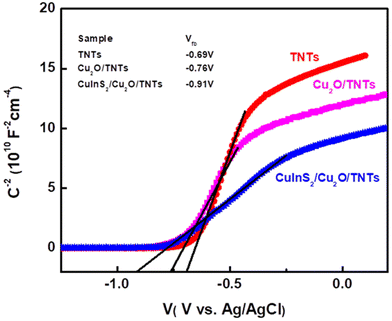 | ||
| Fig. 7 Mott–Schottky curves and the respective flat band values of TNTs, Cu2O/TNTs and CuInS2/Cu2O/TNTs. | ||
| Sample | Slope (m) | Carrier density Nd (cm−3) | Flat band potential Vfb (V) |
|---|---|---|---|
| TNTs | 51.26 × 10¹⁰ | 0.275 × 10¹⁹ | −0.69 |
| Cu2O/TNTs | 35.35 × 10¹⁰ | 0.399 × 10¹⁹ | −0.76 |
| CuInS2/Cu2O/TNTs | 15.31 × 10¹⁰ | 0.92 × 10¹⁹ | −0.91 |
The value of the flat band potential plays a significant role in determining the charge transfer process in heterostructures. The flat band potential (Vfb) can be obtained from the intercept of the liner portion of the Mott–Schottky cure on the x-axis. The values of the flat band potential for different samples are listed in Table 1. The flat band potential for TNTs is −0.68, and is shifted towards a more negative potential by incorporating Cu2O and CuInS2 into TNTs. The flat band potential can also be used to determine the conduction (ECB) or the valence band (EVB) edges for TNTs. Once Vfb is known, ECB can be calculated from the following relation:
where
 is 0.199.
The calculated values of ECB and EVB for TNTs are −0.51 eV and 2.71 eV respectively. These values are in line with the values determined from the Brus model. However, in case of composite structures, the exact values of ECB and EVB for Cu2O and CuInS2 cannot be determined from the MS plots. Therefore, the cyclic voltammetry data and Brus model were used to estimate the band edge positions of Cu2O and CuInS2.
Cyclic voltammetry
A key aspect for the enhanced electrochemical and catalytic performance is the size-dependent variation in the electronic structure of the QDs and surface states, which may affect the charge transport properties of the biosensors. Therefore, the correlation between the electronic structure and the sizes of the QDs is highly desirable to obtain an optimum electrode configuration.Cyclic voltammetry (CV) has been considered as an effective approach for finding the electronic band gap and energy band positions (e.g. conduction band (CB) and valence band (VB)); however, the interpretation of the surface states can be an intricate process. Charge transfer between QDs occur through electrons and holes, which manifests as reduction and oxidation peaks in CV. As the size of the QDs deceases, the reduction and oxidation peaks shift towards more negative and positive potentials respectively (due to quantum size-induced variations in the band gap). Thus, the charge transfer across QDs can be tuned and investigated by observing the oxidation and reduction peaks with their intensity dependent on the alignment with redox levels in the electrolyte.52 For this reason, we investigated the influence of the QD size on the conduction band (ECB) and valence band (EVB) positions by utilizing the size-dependent voltammetric response, as shown in Fig. S8(a and b).† The investigations were carried out on Cu2O/TNTs and CuInS2/Cu2O/TNTs electrode systems by varying the deposition cycles of the QDs. The size and loading density of both the QDs increase by increasing the deposition cycles. Both parameters can be estimated and extracted from the SEM micrographs, as shown in the ESI (Fig. S3(a–e)†) for the Cu2O/TNT electrode system and in Fig. 2(a–l) for the CuInS2/Cu2O/TNTs electrode. In the case of Cu2O/TNTs (Fig. S8a†), a pair of well-defined reduction (−0.42 V) and oxidation (−0.06 V) peaks along with an additional complementary reduction peak at −0.58 V can be observed. Ideally, this oxidation and reduction peak can be assigned to the electron transfer process through the EVB and ECB energy levels inside Cu2O QDs. However, the true separation is of a more complex form given by the Marcus–Gerischer approach53 as an overlay of the state distributions in the solid and liquid. It is evident from Fig. S8a† that the oxidation and reduction peaks gradually shift towards more positive and negative potentials respectively, while the redox peak separation is increased by decreasing the size of the QDs from 12.5 nm to 4 nm. This suggests that the size of the QDs plays a dominant role in the overall charge transfer. Fig. S8b† shows the CV response of the CuInS2/Cu2O/TNT electrode for different loading cycles of CuInS2 QDs (by keeping the deposition of Cu2O QDs fixed to 10 cycles). An additional reduction peak (−0.85 V) and a corresponding small oxidation peak (−0.6 V) appears along with the pair of previously observed redox peaks (for the Cu2O/TNT electrode). However, the complementary reduction peak at −0.58 V (observed in Fig. S8a†) related to Cu1+/Cu(0) seems to merge with the reduction peak for Cu2+/Cu1+, as evident from the peak broadening. Moreover, an obvious peak shifting appears, with the decrease in the QD size, for all redox peak potentials towards positive and negative values corresponding to oxidation and reduction peaks, respectively. In Fig. S8(b),† the magnitude of the redox peak current increases by increasing the loading of CuInS2 QDs (up to 6 cycles) with an average CuInS2 particle size of ∼7.5 nm. However, a further increase in the deposition cycles increases the particle size up to 9.5 nm, which reduces the redox peaks current. These results show that the smaller and larger sized QDs exhibit much lower peak current intensities than the mid-sized/(optimum-sized) QDs. These results are in agreement with the understanding that the smaller and bigger QDs have more defect sites on the surface, due to a relatively short reaction time, compared to those with an intermediate size (likely to experience an improvement in surface defects).54 The larger QDs are usually formed by the Ostwald ripening process, which can result in the generation of defects. Hence, the redox process can be influenced by the surface trap states. Moreover, the initial increase and then a substantial decrease in redox current with the increase in QD size are ascribed to the energy band alignment and shielding of Cu2O QDs by CuInS2 QDs, which may reduce the synergistic effect of Cu2O QDs, resulting in decreased electrochemical performance. Therefore, a balance between the loading density and size of the QDs along with the corresponding redox current density is required. Thus, the loadings of 10 Cu2O QDs and 6 CuInS2 QDs on the CuInS2/Cu2O/TNT electrode during deposition cycles were taken as optimum values because of the higher loading density and enhanced electrochemical activity. The band gap energies of various sizes of Cu2O and CuInS2 QDs were calculated to further elaborate the concept of quantum confinement. Our previous results showed that the onset values of the redox potential for both systems (Cu2O and CuInS2 QDs) may not reflect the actual positions of the VB and CB. Therefore, the Brus model has been utilized for calculating the band gap energy of QDs of various sizes according to the following equation:55,56
| E(R) = Ebulkg + (h2π2/2eR2)(1/me + 1/mh) |
Furthermore, the VB and CB positions of Cu2O and CuInS2 QDs of different sizes were calculated individually using the following relations:
| EVB = χ + 0.5Eg − Ec |
| ECB = EVB − Eg |
| Sample | Electronegativity χ (eV) | Particle size (nm) | Conduction band energy ECB (eV) | Valence band energy EVB (eV) | Band gap energy Eg (eV) |
|---|---|---|---|---|---|
| Cu2O/TNTs | 5.3 | 3.5 | −0.79 | 1.95 | 2.73 |
| 5 | −0.70 | 1.86 | 2.56 | ||
| 6.5 | −0.67 | 1.82 | 2.49 | ||
| 8.5 | −0.65 | 1.80 | 2.46 | ||
| 12.5 | −0.63 | 1.79 | 2.43 | ||
| CuInS2/TNTs | 4.9 | 5 | −0.82 | 1.19 | 2.02 |
| 5.5 | −0.74 | 1.11 | 1.85 | ||
| 7.5 | −0.71 | 1.02 | 1.73 | ||
| 9.5 | −0.66 | 0.98 | 1.64 |
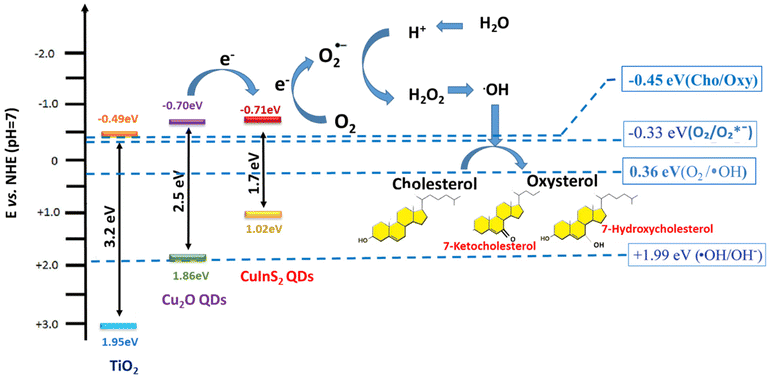
The charge transfer mechanism in CuInS2/Cu2O/TNT biosensors is illustrated in Scheme 1. The band gap of anatase TNTs is about 3.2 eV, while the band gaps of 5 nm Cu2O QDs and 7.5 nm CuInS2 QDs are 2.5 eV and 1.7 eV respectively. It can be seen in Scheme 1 that the CB of CuInS2 QDs lies higher than that of Cu2O QDs and TiO2, where the CB of all these three active electrode materials align in such a way to follow the order from higher to lower position as CuInS2 > Cu2O > TiO2. The corresponding VB position of these materials follows the reverse order. As previously observed, the large CB energy offset will increase the electron injection rate from CuInS2 to Cu2O and then to TiO2. However, applying a sufficiently negative potential causes the electrode to donate electrons to the reducing species in the electrolyte. Moreover, Scheme 1 further illustrates the proposed mechanism for the chemical oxidation of cholesterol. The initiation of cholesterol chemical oxidation was carried by the electro-reduction of adsorbed O2 on the surface of the electrode. The electrode gets polarized at a sufficiently negative potential; generally known as the oxygen reduction reaction (ORR) that produces hydroxyl radicals (˙OH).57–59 These hydroxyl radicals are critical to initiate the cholesterol chemical oxidation to produce oxysterols (7b-ketocholesterol, 7a-hydroxycholesterol and 7b-hydroxycholesterol).60 In addition, the presence of Cu1+ in CuInS2 QDs is also evidenced in breaking the O–O bond of H2O2 to generate ˙OH radicals, that cause a dramatic increase in the reduction current.61 This may greatly improve the performance of the biosensing platform.
The order of decoration of TNTs with Cu2O and CuInS2 QDs also plays a significant role in the electrochemical performance of the biosensor. The cascade band gap alignment of TiO2 with Cu2O and CuInS2 QDs show the reduced electron transfer recombination rate; however, by switching the decoration order from CuInS2/Cu2O/TNTs to Cu2O/CuInS2, QD/TNT may reduce the electrode conductivity.
Electrocatalytic oxidation of cholesterol by cathodically generated reactive oxygen species (ROS)
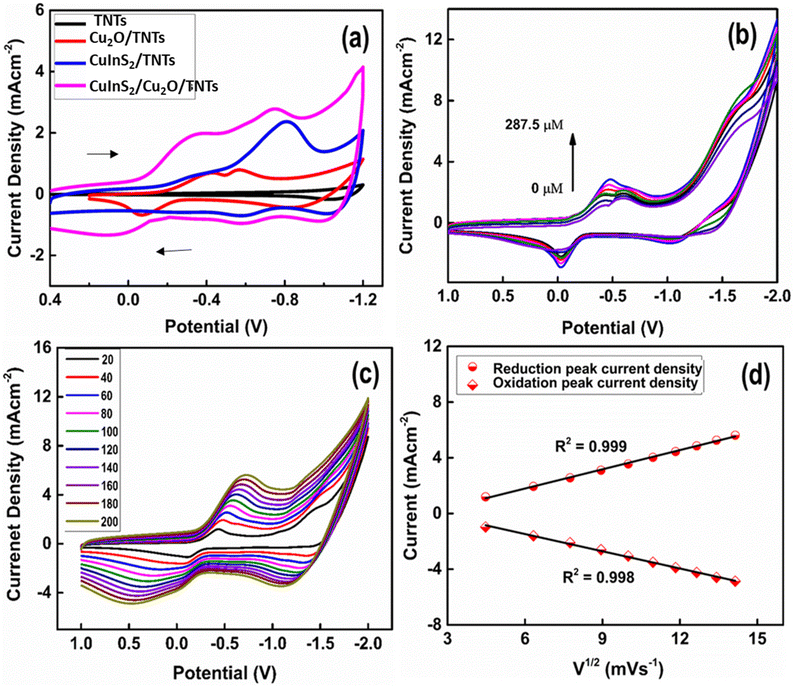
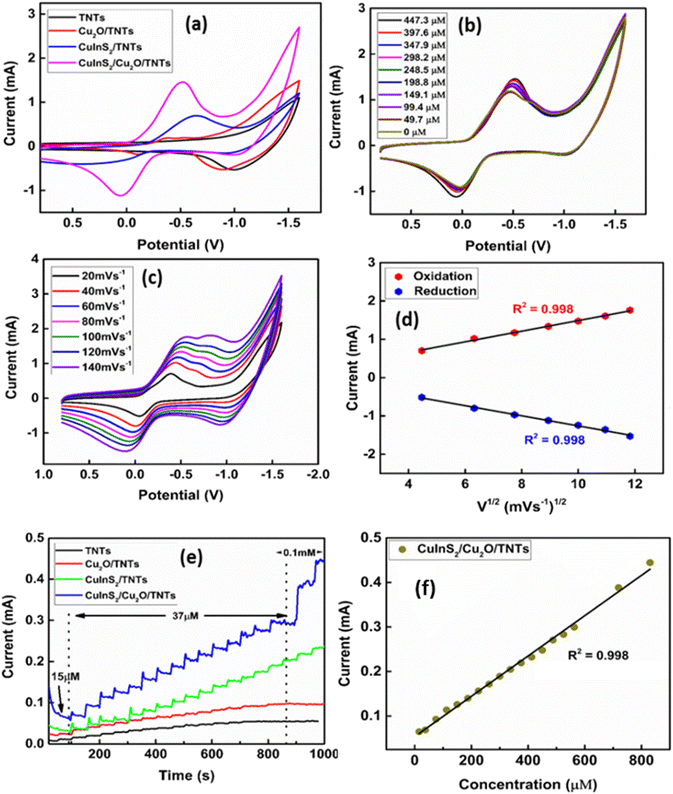
To investigate the electrocatalytic oxidation of cholesterol by the CuInS2(6)/Cu2O/TNT electrode, cyclic voltammetry was performed. Fig. 8a presents the CV scans of different electrode configurations in 0.1 M PBS recorded at a scan rate of 50 mV s−1 by sweeping the potential from positive to negative values. Since the first sweep has been scanned in the negative direction (following the US convention), the working electrode increases its capacity to donate electrons to chemical species, thus obtaining a cathodic/reduction current (positive current), which is represented in the upper branch of cyclic voltammograms (CV). While the current density is obtained when the potential is scanned in the positive direction, the anodic/oxidation current is negative.Fig. 8a shows no redox peak in the case of the pristine TNT electrode, whereas a pair of well-defined quasi reversible redox peaks were found for all other electrodes. For instance, Cu2O QD-decorated TNTs show an abrupt increase in the current density along with reduction and oxidation peaks. The first reduction peak at a potential of ∼−0.41 V corresponds to Cu2+/Cu1+, while the second reduction peak at a potential around −0.50 V is attributed to the Cu1+/Cu(0) redox pair. In the lower half cycle, an oxidation peak is observed at −0.06 V that corresponds to the oxidation of Cu(0) to Cu2+. In order to check the electrochemical response of the CuInS2 QDs deposited on the pristine TNT, the CV of CuInS2(6) QDs/TNTs was also performed (Fig. 8a, blue curve). The electrochemical activity of the CuInS2 QD-loaded TNTs was higher than that of Cu2O/TNTs, with the predominant redox peaks for the reduction and oxidation of CuInS2. The reduction current reaches its highest value after the co-decoration of Cu2O QDs/TNTs with CuInS2 QDs. The composite CuInS2(6)/Cu2O/TNT electrode also shows well-defined redox peaks. The peak at −0.75 V corresponds to the reduction of CuInS2 followed by the corresponding oxidation peak at −0.6 V. The other reduction peak observed at −0.34 V are attributed to the reduction of Cu2+ to Cu1+. Conversely, the broad peak close to 0.1 V is due to the oxidation of Cu(0) to Cu2+. Moreover, in the case of the CuInS2/Cu2O/TNT hybrid electrode, the current density is significantly higher than the other electrode configurations. This is due to the availability of higher catalytic sites as a result of QD deposition and suitable band gap alignment of the QDs with TNTs (Scheme 1). Fig. 8b shows the CV scans of the CuInS2(6)/Cu2O/TNT electrode in response to the increasing cholesterol concentration in the electrolyte. A dramatic increase in the reduction peak current density has been found with the addition of cholesterol in the electrolyte, which is due to the combined catalytic effect of Cu2O and CuInS2 QDs. The maximum reduction current density has been measured in response to the cholesterol concentration of 287.5 μM in the electrolyte. An increase in the current density with the increase in cholesterol concentration is due to its chemical oxidation by the electrochemically generated hydroxyl radicals produced by the composite electrode. For the pristine TNTs, no significant increase in oxidation and reduction current density was observed after the addition of cholesterol in the electrolyte (Fig. S9†), which shows that the TNT/Ti electrode exhibits less electrocatalytic activity towards the cholesterol chemical oxidation. Additionally, a voltammetric peak observed at −1.5 V corresponds to the oxygen reduction process.
The effect of different scan rates on the electrochemical responses of the CuInS2(6)/Cu2O/TNT electrode was recorded in 0.1 M PBS containing 0.25 mM of cholesterol (Fig. 8c). The redox peak current density increases by increasing the scan rates in the range of 20–200 mV s−1, while a shift in the redox peak potential was observed as the scan rate increases. That is, the reduction peak shifts towards more negative potential and the oxidation peak towards positive potential. Fig. 8d shows that the relationship between the reduction and oxidation peak current densities and root mean square of the scan rate is linear with correlation coefficients (R2) of about 0.999 and 0.998 respectively. The observed behaviour indicates that the chemical oxidation of cholesterol on the CuInS2(6)/Cu2O/TNTs electrode is diffusion controlled.
Amperometry
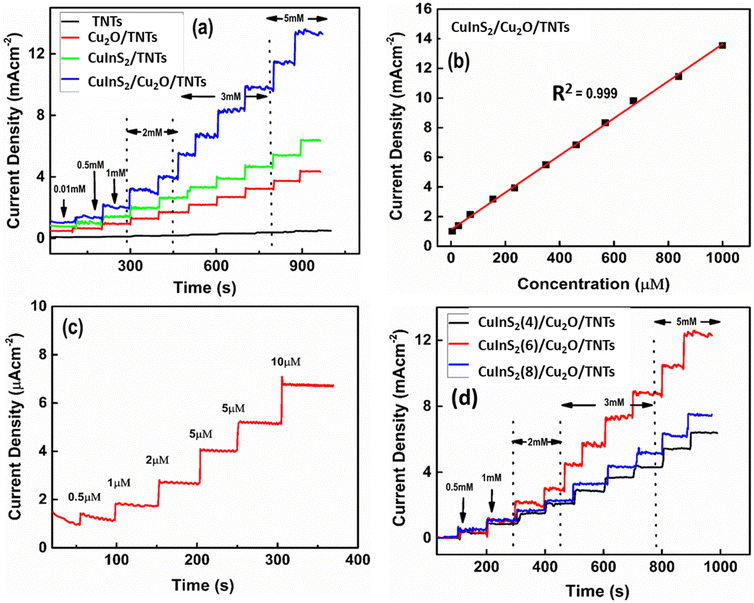
The amperometric curves of the pristine TNT, Cu2O/TNT, CuInS2/TNT, and CuInS2(6)/Cu2O/TNT electrodes were obtained for the successive addition of various concentrations of cholesterol under vigorous stirring conditions (Fig. 9a). For these measurements, a potential of −0.5 V was applied, which gave rise to reduction current. Upon the addition of different cholesterol concentrations, a rapid increase in the current density was observed. It was found that the reduction current of the CuInS2(6)/Cu2O/TNT electrode is much higher than that of the other electrode configurations, which is consistent with the CV results (Fig. 8a). The sequence through which the biosensors exhibit a higher current response is CuInS2/Cu2O/TNTs > CuInS2/TNTs > Cu2O/TNTs > TNTs. The CuInS2/Cu2O/TNT, CuInS2/TNT, and Cu2O/TNT electrodes achieved 95% of the steady-state current within ∼1.3 s, 2.0 s, and 2.5 s, respectively. These values are much lower than the pristine TNTs (10 s). Fig. 9b shows the calibration curve of the CuInS2(6)/Cu2O/TNT electrode. It illustrates the linear dependence of the current response on the cholesterol concentration. The calibration curves for all other electrodes are presented in the ESI (Fig. S10†). These calibration curves were derived from their corresponding amperometric responses by taking into account the dilution factor (due to 40 ml of electrolyte solution) for cholesterol concentration. It is worth mentioning that the linear range of cholesterol detection is much wider for the CuInS2(6)/Cu2O/TNT electrode (0.005–1 mM) compared to the other electrode configurations. Table 3 summarizes the characteristic parameters of all prepared electrodes obtained from their amperometric responses. The sensitivity of the CuInS2/(6)Cu2O/TNTs/Ti electrode is about 12![[thin space (1/6-em)]](https://www.rsc.org/images/entities/char_2009.gif) 530 μA mM−1 cm−2, which is much higher than the values obtained for Cu2O/TNTs (4650 μA mM−1 cm−2), CuInS2/TNTs (6960 μA mM−1 cm−2), and pristine TNTs (1125 μA mM−1 cm−2). The amperometric data of the CuInS2/Cu2O/TNT electrode towards the low concentrations of cholesterol are presented in Fig. 9c. The limit of detection (LOD) of the hybrid electrode (0.013 μM) is much lower than that of Cu2O/TNT and CuInS2/TNT electrodes, as given in Table 3. The low detection limit was obtained by adding the lowest possible concentration of cholesterol, where a considerable rise in the current response was observed. These results demonstrate that the TNT electrode is electrochemically less active for the required redox reaction. Therefore, the decoration of TNTs with Cu2O QDs enhances the cholesterol chemical oxidation process and greatly improves the response current. Moreover, the co-decoration of CuInS2 QDs on the Cu2O QDs/TNTs further amplifies the current response and improves the response time and sensitivity. Fig. 9d illustrates the effect of deposition cycles of CuInS2 QDs on the amperometric responses of the CuInS2/Cu2O/TNT electrodes. It is clear from the figure that the optimized content of CuInS2 QDs with a corresponding maximum current response is obtained for 6 deposition cycles. The comparison of various important parameters related to the cholesterol sensor fabricated in this study (CuInS2/Cu2O/TNTs) with those reported in the literature is given in Table 4.25–28,62–69 It can be seen that the electrode reported here is superior in terms of sensitivity, linear range, response time, and detection limit. This is due to the availability of higher catalytic sites as a result of QD deposition and suitable band gap alignment of the QD with TNTs (Scheme 1).
530 μA mM−1 cm−2, which is much higher than the values obtained for Cu2O/TNTs (4650 μA mM−1 cm−2), CuInS2/TNTs (6960 μA mM−1 cm−2), and pristine TNTs (1125 μA mM−1 cm−2). The amperometric data of the CuInS2/Cu2O/TNT electrode towards the low concentrations of cholesterol are presented in Fig. 9c. The limit of detection (LOD) of the hybrid electrode (0.013 μM) is much lower than that of Cu2O/TNT and CuInS2/TNT electrodes, as given in Table 3. The low detection limit was obtained by adding the lowest possible concentration of cholesterol, where a considerable rise in the current response was observed. These results demonstrate that the TNT electrode is electrochemically less active for the required redox reaction. Therefore, the decoration of TNTs with Cu2O QDs enhances the cholesterol chemical oxidation process and greatly improves the response current. Moreover, the co-decoration of CuInS2 QDs on the Cu2O QDs/TNTs further amplifies the current response and improves the response time and sensitivity. Fig. 9d illustrates the effect of deposition cycles of CuInS2 QDs on the amperometric responses of the CuInS2/Cu2O/TNT electrodes. It is clear from the figure that the optimized content of CuInS2 QDs with a corresponding maximum current response is obtained for 6 deposition cycles. The comparison of various important parameters related to the cholesterol sensor fabricated in this study (CuInS2/Cu2O/TNTs) with those reported in the literature is given in Table 4.25–28,62–69 It can be seen that the electrode reported here is superior in terms of sensitivity, linear range, response time, and detection limit. This is due to the availability of higher catalytic sites as a result of QD deposition and suitable band gap alignment of the QD with TNTs (Scheme 1).
| S. no. | Electrode materials | LOD (μM) | Sensitivity (μA mM−1 cm−2) | Response time (s) | LDR (μM) |
|---|---|---|---|---|---|
| 1 | Pristine TNTs | 4.8 | 1125 | 10 | 4.8–838 |
| 2 | Cu2O/TNTs | 0.05 | 4650 | 2.5 | 27.5–671.4 |
| 3 | CuInS2/TNTs | 0.025 | 6960 | 2 | 27.5–838 |
| 4 | CuInS2/Cu2O/TNTs | 0.013 | 12![[thin space (1/6-em)]](https://www.rsc.org/images/entities/char_2009.gif) 530 530 |
1.3 | 4.8–999 |
| S. no. | Electrode materials | LOD | Sensitivity | Response time (s) | LDR | Ref. |
|---|---|---|---|---|---|---|
| 1 | Grp/β-CD/methylene blue | 1 μM | 0.01 μA μM−1 | 20 | 0.001–0.10 mM | 62 |
| 2 | Cu2S NRS/CRIE | 0.1 μM | 398 μA mM−1 cm−2 | 0.01–6.8 mM | 27 | |
| 3 | 1D porous tubular Ag/GCE | 180 μM | 0.7 μA mM−1 cm−2 | — | 28–0.33 mM | 63 |
| 4 | Pt NPs/CNT | 5 μM | 8.7 μA mM−1 cm−2 | 0.005–10 mM | 28 | |
| 5 | Pt/Au | 15 μM | 226.2 μA mM−1 cm−2 | — | 0.5–3.5 mM | 26 |
| 6 | ChOx/MoS2–AuNPs/GCE | 0.26 μM. | 4460 μA mM−1 cm−2 | 0.5–48 μM | 25 | |
| 7 | PTZ–ChOx-modified SPE | 2.3 μM | 33.1 mA M−1 cm−2 | 0.015–0.15 mM | 68 | |
| 8 | AuPt–Ch/GCE | 10 μM | 90.7 μA mM−1 cm−2 | 7 | 0.05–6.2 mM and 6.2–11.2 mM | 65 |
| 9 | AuE/dithiol/AuNPs/MUA/ChOx | 34.6 μM | 9.02 μA μM−1 | 0.04–0.22 mM | 66 | |
| 10 | CuInS2/Cu2O/TNTs/Ti | 0.013 μM | 12![[thin space (1/6-em)]](https://www.rsc.org/images/entities/char_2009.gif) 530 μA mM−1 cm−2 530 μA mM−1 cm−2 |
1.3 | 4.8–999 μM | Present work |
Selectivity
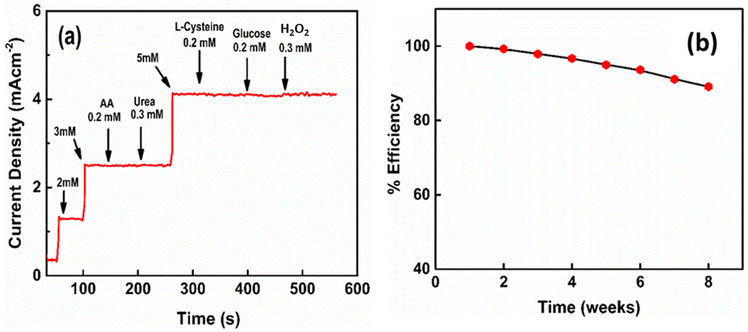
The ability of the biosensor to differentiate between the different interfering species from the target molecule is one of the most important factors in sensing applications. Ascorbic acid, urea, glucose, H2O2, and L-cysteine can be the common interfering species for the electrochemical oxidation of cholesterol. However, most of them are electrochemically active at positive potentials.70–74 Assuming that the concentration of cholesterol in human blood is much higher than the interfering biological species, the amperometric responses of the CuInS2(6)/Cu2O/TNT electrode towards the addition of different concentrations of cholesterol as well as interfering species were recorded (Fig. 10a). The current responses by these interfering species are negligible compared to the sharp current signal towards cholesterol, indicating the excellent selectivity of the proposed sensor for cholesterol detection. The possible reason for such a high selectivity can be the use of negative potential values where the aforementioned interfering species are not electrochemically active.pH response
The pH value of the buffer solution has a strong impact on the electrochemical performance of the biosensor. Therefore, it is important to obtain an optimum value of pH at which the biosensor exhibits its highest current response. For this reason, the pH of the assay solution was varied from 4 to 9. The corresponding responses of the biosensor were measured by CV in the presence of 0.25 mM cholesterol solution, as shown in Fig. S11a.† These results indicate that the electrochemical activity of the biosensor deteriorates in more acidic and basic media. As the pH of the electrolyte decreases to low values, the protonation of Cu2O occurs that results in the formation of its sub-oxides. In the case of CuInS2, the low pH values result in the formation of the predominant Cu2S phase.75 The current density increases with the increase in the pH value of the solution and the highest current response of the biosensor was measured at pH 7.5 due to the stability of the co-catalyst Cu2O and CuInS2 QDs. A further increase in the pH value increases the OH− in the solution which causes the formation of Cu and In hydroxides.76–78 Therefore, for the sensitive analysis of cholesterol, an optimum value of pH 7.5 was chosen for the electrochemical experiments.Thermal stability of biosensors
One of the important factors influencing the practicality of the biosensor is its thermal stability. Fig. S11b† shows the current response of the biosensor in 0.1 M PBS containing 0.25 mM cholesterol in the temperature range of 20–70 °C. The reduction current is found to increase with the temperature owing to a higher reaction rate due to the increased diffusion of redox species. It is demonstrated that the proposed biosensor is highly stable over a temperature range with fast reaction kinetics.CuInS2/Cu2O/TNT electrode shelf life
To evaluate the performance of the biosensor over a period of time, the current responses of the CuInS2(6)/Cu2O/TNT electrode for 0.25 mM cholesterol were measured on weekly basis for 2 months, as shown in Fig. 10b. After each measurement, the used electrode was thoroughly washed with DI water, dried and then stored under ambient conditions. The data collected from the repeated experiments depict that the CuInS2(6)/Cu2O/TNT electrode maintains 89% of its initial current values. This suggests the good long-term stability of the proposed electrode. Moreover, the reproducibility and repeatability of the biosensor was determined by measuring the current responses towards the addition of 0.25 mM cholesterol. Six samples were prepared under similar conditions for reproducibility measurements, and their amperometric responses were measured (Fig. S11c†). A relative standard deviation (RSD) value of 3.9% is obtained, which shows the high reproducibility of the biosensor. The repeatability of the biosensor was evaluated using a single electrode and taking 10 successive CV scans, as shown in Fig. S11d.† The RSD value of 2.8% demonstrates that the electrode was not poisoned by the redox species and can be used repeatedly for the detection of cholesterol.Real-sample analysis
To evaluate the practicality and feasibility of the CuInS2(6)/Cu2O/TNT electrode in clinical diagnostics, the proposed electrode was used to detect cholesterol in human blood serum samples using the standard addition method. Prior to assay, the serum samples were appropriately diluted with PBS (pH 7.5) to bring the cholesterol concentration in the linear calibration range. The cholesterol concentration in serum samples was calculated from the standard calibration curve. The cholesterol content values assessed with the proposed biosensor were compared with those measured by the commercially available cholesterol sensors, as presented in Table 5. The assay results for clinical serum samples are highly correlated with the reference values, with relative errors (REs) ranging from 0.4% to 3.2%. These results indicate that the proposed biosensor has great potential for practical use with good accuracy and precision.| Sample | Commercial sensor (μM) | Proposed sensor (μM) | REs (%) |
|---|---|---|---|
| 1 | 123 | 119 | 3.2 |
| 2 | 232 | 236 | 1.7 |
| 3 | 465 | 463 | 0.4 |
| 4 | 769 | 783 | 1.8 |
Electrochemical detection of ibuprofen
CuInS2/Cu2O/TNT were further employed to study the quality of stream water. Ibuprofen was used as a water contaminant. The efficiency of the electrode as an electrocatalyst for the detection of ibuprofen was determined using CV and amperometry. Fig. 11a shows the cyclic voltammetry of the pristine TNT, Cu2O/TNT, CuInS2/TNT and CuInS2/Cu2O/TNT electrodes. The redox behaviour of the electrodes show similar results as evident from the previous section with the highest redox current attained for CuInS2/Cu2O/TNTs. The increase in the redox peak current is attributed to the combination of the synergic effect of Cu2O and CuInS2 QDs with TNTs. This fact can be due to the availability of more redox species (due to oxidation and reduction of Cu2O and CuInS2 QDs) for the electrochemical oxidation of ibuprofen. The smaller size of QDs contributes or accelerates the oxidation process. Fig. 11b shows the CV curve of the CuInS2/Cu2O/TNT electrode with the gradual addition of different concentrations of ibuprofen within the electrolyte. A proportional increase in the redox current is obtained by increasing the analyte concentration. The variation in the redox peak current over a range of scan rate is shown in Fig. 11c. It is evident from the figure that the variations in the scan rate show an increase in the redox peak current with a gradual shift in the peak positions towards more negative (reduction) and positive (oxidation) potentials. This shifting in the peak positions can be ascribed to the quasi irreversible process of ibuprofen oxidation at the surface of the electrode. Furthermore, the nature of the process can be determined by plotting the peak current with respect to the square root of scan rate (Fig. 11d). The linear fitting of the plot reveals the diffusion-controlled oxidation process at the electrode surface.Fig. 11e shows the amperometric response of the pristine TNT, Cu2O/TNT, CuInS2/TNT, and CuInS2/Cu2O/TNT electrodes at −0.5 V by gradually increasing the concentration of ibuprofen within the electrolyte. The CuInS2/Cu2O/TNT electrode exhibits a rapid increase in the current response towards the addition of each ibuprofen concentration with a response time of 4 s. The linear fitting of the calibration plot, derived from the amperometric data, for all electrodes is shown in Fig. 11f and Fig. S12(a–c).† The CuInS2/Cu2O/TNT electrode shows (Fig. 11f) a higher sensitivity up to 3.694 mA mM−1 cm−2 and a wider linear range of detection (15–825 μM) compared to the CuInS2/TNTs, Cu2O/TNTs and TNTs (Fig. S12(a–c)†), which display rather lower values of sensitivities (summarized in Table 6).
| S. no. | Electrode materials | Sensitivity (μA mM−1 cm−2) |
|---|---|---|
| 1 | Pristine TNTs | 262.76 |
| 2 | Cu2O/TNTs | 349.768 |
| 3 | CuInS2/TNTs | 816 |
| 4 | CuInS2/Cu2O/TNTs | 1293 |
Proposed mechanism for electrochemical oxidation of ibuprofen
The electrochemical oxidation of ibuprofen can be suggested on the basis of naproxen oxidation as both are almost structurally equivalent molecules.39 In the first step, the deprotonation of benzyl radicals and carboxyl radicals of ibuprofen was achieved via single electron oxidation. Second, the elimination of CO2 from both radicals produces a common benzyl radical, which undergoes further oxidation resulting in benzyl cations. The reaction of this benzyl cation with H2O produces alcohol, and a mixture of alcohols and ketones are produced as end products of other subsequent reactions.Selectivity, stability and reproducibility of CuInS2/Cu2O/TNTs for ibuprofen detection
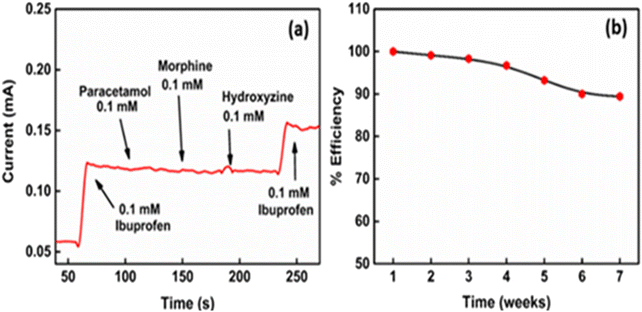
To evaluate the selectivity of CuInS2/Cu2O/TNTs for ibuprofen, a sequence of typical analgesic drugs (e.g. paracetamol, morphine, and hydroxyzine) as possible interferents were added besides ibuprofen and the current response was recorded, as shown in Fig. 12a. The amperometric response of these drugs due to non-specific oxidation is much weaker than the response current induced by ibuprofen, thus indicating the acceptable specificity of the sensor. In Fig. 12b, the stability studies of the CuInS2/Cu2O/TNT electrode show that only 11.6% activity is reduced for the electrode for a time period of two months with an interval of 7 days.The pH of the buffer solution is optimized to obtain a higher electrochemical response via CV by varying the pH from 3.0 to 8.0, as shown in Fig. S13a.† The data are plotted as cathodic current vs. various values of pH. It shows that the peak current reduces by increasing the pH of the electrolyte and very less oxidation of ibuprofen occurs in basic media. Furthermore, the cathodic peak current is significantly high in acidic media. This result thus indicated that reasonable oxidation of ibuprofen is only possible in acidic media. Therefore, pH 5.5 is used for further experiments to keep it close to a natural pH value. The response of increasing temperature in the sensing behaviour of the electrode for ibuprofen detection is shown in Fig. S13b.† The electrode shows the obvious behaviour of increasing the response current due to the increases in the diffusion rate with the temperature. The reproducibility measurements with 5 different samples (Fig. S13c†), fabricated individually, show a narrow range of variation in response current (for 37 μM ibuprofen) with an RSD value of 1.1%. In addition, the biosensor shows a higher repeatability, exhibiting an RSD value of 1.4%, thus showing a slight difference in the response current after 10 cycles (Fig. S13d†). These results reflect that the current technique is within the error limit (within 5%) and reliable for analysis of ibuprofen.
Real-sample analysis of ibuprofen on CuInS2/Cu2O/TNTs
Ibuprofen obtained from a pharmacy was used to prepare the stock solution. Here, instead of a buffer solution, lake water is used as an electrolyte. First, 5 mM of stock solution was introduced into an electrochemical cell by a standard addition method and the corresponding amperometric response current was measured. The relative error value was calculated by comparing the concentrations measured by the proposed method with that measured using a spectrometer, as presented in Table 7. The results revealed a close correspondence between both techniques, which shows that the proposed method can be used for the reliable detection of ibuprofen in on-site analysis of waste water.| Sample | Commercial sensor (μM) | Proposed sensor (μM) | REs (%) |
|---|---|---|---|
| 1 | 298 | 291.3 | 2.3 |
| 2 | 476.2 | 461.5 | 3.1 |
| 3 | 655 | 649 | 0.9 |
| 4 | 812 | 820.7 | 1.1 |
The above-mentioned results indicate a higher electrochemical activity of CuInS2/CdS/TNTs towards cholesterol and ibuprofen. This outstanding performance of the CuInS2/Cu2O/TNT electrode results from the uniform distribution of QDs. The CuInS2 and Cu2O QDs usually produce electrochemically active sites, as confirmed by CV. Both QDs provide pathways to the redox species on the surface of TNTs for efficient charge transport at the interface, as depicted from the reduced diameter of the Nyquist plot for CuInS2/Cu2O/TNTs. Moreover, the higher redox peak current in CV and enhanced amperometric response of CuInS2/Cu2O/TNTs show the significance of the structural design of the biosensor.
Conclusions
An unconventional electroanalytical methodology for simple, selective, and reliable detection of cholesterol and ibuprofen was explored. TNTs as matrix materials were sequentially co-decorated with Cu2O and CuInS2 QDs. The hybrid electrode triggers the chemical oxidation of cholesterol by generating hydroxyl radicals (˙OH). Tuning the size of Cu2O and CuInS2 QDs makes the hybrid electrode more effective for cholesterol detection with a sensitivity of around 12![[thin space (1/6-em)]](https://www.rsc.org/images/entities/char_2009.gif) 530 μA mM−1 cm−2 (for CuInS2/Cu2O/TNTs), which is three times higher than that of the Cu2O/TNT electrode (4650 μA mM−1 cm−2) due to the rapid electronic communication and high surface reactivity. Furthermore, electrochemical analysis of the CuInS2/Cu2O/TNT electrode for ibuprofen shows a higher sensitivity up to 1293 μA mM−1 cm−2. The fabricated electrode showed long-term stability, excellent reproducibility, and low relative error values compared with the commercially available techniques, which verify that the proposed sensing platform provides a convenient multifunctional sensing technique.
530 μA mM−1 cm−2 (for CuInS2/Cu2O/TNTs), which is three times higher than that of the Cu2O/TNT electrode (4650 μA mM−1 cm−2) due to the rapid electronic communication and high surface reactivity. Furthermore, electrochemical analysis of the CuInS2/Cu2O/TNT electrode for ibuprofen shows a higher sensitivity up to 1293 μA mM−1 cm−2. The fabricated electrode showed long-term stability, excellent reproducibility, and low relative error values compared with the commercially available techniques, which verify that the proposed sensing platform provides a convenient multifunctional sensing technique.
Conflicts of interest
There are no conflicts to declare.Acknowledgements
The authors greatly acknowledge the Higher Education Commission (HEC) of Pakistan (Grant No. IRSIP 36 PSc 31) for providing financial support for this research work. Financial support from DFG within the framework of its Excellence Initiative for the Cluster of Excellence “Engineering of Advanced Materials” is thankfully acknowledged. National Research Foundation, Republic of Korea under project no. NRF-2019M2D2A1A02058174 and NRF-2022M2E9A3048435 are also acknowledged for their financial support.References
- M. Ramesh, R. Janani, C. Deepa and L. Rajeshkumar, Nanotechnology-Enabled Biosensors: A Review of Fundamentals, Design Principles, Materials, and Applications, Biosensors, 2023, 13, 1–32, DOI:10.3390/bios13010040.
- P. Mehrotra, Biosensors and Their Applications – A Review, J. Oral Biol. Craniofacial Res., 2016, 6(2), 153–159, DOI:10.1016/j.jobcr.2015.12.002.
- F. Xia, X. Zuo, R. Yang, R. J. White, Y. Xiao, D. Kang, X. Gong, A. A. Lubin, A. Vallée-Bélisle, J. D. Yuen, B. Y. B. Hsu and K. W. Plaxco, Label-Free, Dual-Analyte Electrochemical Biosensors: A New Class of Molecular-Electronic Logic Gates, J. Am. Chem. Soc., 2010, 132(25), 8557–8559, DOI:10.1021/ja101379k.
- M. Liu, M. Yang, M. Wang, H. Wang and J. Cheng, A Flexible Dual-Analyte Electrochemical Biosensor for Salivary Glucose and Lactate Detection, Biosensors, 2022, 12(4), 1–11, DOI:10.3390/bios12040210.
- J. Singh, M. Srivastava, A. Roychoudhury, D. W. Lee, S. H. Lee and B. D. Malhotra, Bienzyme-Functionalized Monodispersed Biocompatible Cuprous Oxide/Chitosan Nanocomposite Platform for Biomedical Application, J. Phys. Chem. B, 2013, 117(1), 141–152 CrossRef CAS PubMed.
- S. Vigneshvar, C. C. Sudhakumari, B. Senthilkumaran and H. Prakash, Recent Advances in Biosensor Technology for Potential Applications – an Overview, Front. Bioeng. Biotechnol., 2016, 4, 1–9, DOI:10.3389/fbioe.2016.00011.
- I. H. Cho, D. H. Kim and S. Park, Electrochemical Biosensors: Perspective on Functional Nanomaterials for on-Site Analysis, Biomater. Res., 2020, 24(1), 1–12, DOI:10.1186/s40824-019-0181-y.
- R. Batool, A. Rhouati, M. H. Nawaz, A. Hayat and J. L. Marty, A Review of the Construction of Nano-Hybrids for Electrochemical Biosensing of Glucose, Biosensors, 2019, 9(1), 1–19, DOI:10.3390/bios9010046.
- M. Asim, R. Rahim, R. Syed, K. Uddin, N. Khaliq and Y. Khan, Role of Temperature and NiO Addition in Improving Photocatalytic Properties of TiO2 Nanotubes, Appl. Nanosci., 2019, 9(8), 1731–1742, DOI:10.1007/s13204-019-00980-z.
- J. Tian, Y. Li, J. Dong, M. Huang and J. Lu, Photoelectrochemical TiO2 Nanotube Arrays Biosensor for Asulam Determination Based on In-Situ Generation of Quantum Dots, Biosens. Bioelectron., 2018, 110, 1–7, DOI:10.1016/j.bios.2018.03.038.
- G. C. Fan, L. Han, J. R. Zhang and J. J. Zhu, Enhanced Photoelectrochemical Strategy for Ultrasensitive DNA Detection Based on Two Different Sizes of CdTe Quantum Dots Cosensitized TiO2/CdS:Mn Hybrid Structure, Anal. Chem., 2014, 86(21), 10877–10884, DOI:10.1021/ac503043w.
- Z. J. Zhou, J. Q. Fan, X. Wang, W. Z. Sun, W. H. Zhou, Z. L. Du and S. X. Wu, Solution Fabrication and Photoelectrical Properties of CuInS2 Nanocrystals on TiO2 Nanorod Array, ACS Appl. Mater. Interfaces, 2011, 3(7), 2189–2194, DOI:10.1021/am200500k.
- U. Saxena and A. B. Das, Nanomaterials towards Fabrication of Cholesterol Biosensors: Key Roles and Design Approaches, Biosens. Bioelectron., 2016, 75, 196–205 CrossRef CAS PubMed.
- C. Chen, G. Ali, S. H. Yoo, J. M. Kum and S. O. Cho, Improved Conversion Efficiency of CdS Quantum Dot-Sensitized TiO2 Nanotube-Arrays Using CuInS2 as a Co-Sensitizer and an Energy Barrier Layer, J. Mater. Chem., 2011, 21(41), 16430–16435, 10.1039/c1jm13616j.
- C. Guo, H. Huo, X. Han, C. Xu and H. Li, Ni/CdS Bifunctional Ti@TiO2 Core-Shell Nanowire Electrode for High-Performance Nonenzymatic Glucose Sensing, Anal. Chem., 2014, 86(1), 876–883, DOI:10.1021/ac4034467.
- J. Jankovic, D. P. Wilkinson and R. Hui, Electrochemical Impedance Spectroscopy of Ba2In2O5: Effect of Porosity, Grain Size, Dopant, Atmosphere and Temperature, J. Electrochem. Soc., 2012, 159(2), 109–120, DOI:10.1149/2.022202jes.
- H. Dhyani, M. Azahar Ali, M. K. Pandey, B. D. Malhotra and P. Sen, Electrophoretically Deposited CdS Quantum Dots Based Electrode for Biosensor Application, J. Mater. Chem., 2012, 22(11), 4970–4976 RSC.
- J. Hopkins, K. Fidanovski, A. Lauto and D. Mawad, All-Organic Semiconductors for Electrochemical Biosensors: An Overview of Recent Progress in Material Design, Front. Bioeng. Biotechnol., 2019, 7, 1–8, DOI:10.3389/fbioe.2019.00237.
- K. S. Mun, S. D. Alvarez, W. Y. Choi and M. J. Sailor, A Stable, Label-Free Optical Interferometric Biosensor Based on TiO2 Nanotube Arrays, ACS Nano, 2010, 4(4), 2070–2076 CrossRef CAS PubMed.
- B. S. Bao, C. M. Li, J. Zang, X. Cui, Y. Qiao and J. Guo, New Nanostructured TiO2 for Direct Electrochemistry and Glucose Sensor Applications, Adv. Funct. Mater., 2008, 18, 591–599 CrossRef.
- F. R. Maxfield and I. Tabas, Role of Cholesterol and Lipid Organization in Disease, Nature, 2005, 438, 612–621 CrossRef CAS PubMed.
- G. Li, J. M. Liao, G. Q. Hu, N. Z. Ma and P. J. Wu, Study of Carbon Nanotube Modified Biosensor for Monitoring Total Cholesterol in Blood, Biosens. Bioelectron., 2005, 20, 2140–2144, DOI:10.1016/j.bios.2004.09.005.
- T. Ahmadraji and A. J. Killard, Measurement of Total Cholesterol Using an Enzyme Sensor Based on a Printed Hydrogen Peroxide Electrocatalyst, Anal. Methods, 2016, 8(13), 2743–2749, 10.1039/c6ay00468g.
- S. Nantaphol, O. Chailapakul and W. Siangproh, Sensitive and Selective Electrochemical Sensor Using Silver Nanoparticles Modified Glassy Carbon Electrode for Determination of Cholesterol in Bovine Serum, Sens. Actuators, B, 2015, 207(Part A), 193–198, DOI:10.1016/j.snb.2014.10.041.
- X. Lin, Y. Ni and S. Kokot, Electrochemical Cholesterol Sensor Based on Cholesterol Oxidase and MoS2-AuNPs Modified Glassy Carbon Electrode, Sens. Actuators, B, 2016, 233, 100–106, DOI:10.1016/j.snb.2016.04.019.
- Y. Lee and J. Park, Nonenzymatic Free-Cholesterol Detection via a Modified Highly Sensitive Macroporous Gold Electrode with Platinum Nanoparticles, Biosens. Bioelectron., 2010, 26, 1353–1358 CrossRef CAS PubMed.
- R. Ji, L. Wang, G. Wang and X. Zhang, Synthesize Thickness Copper(I) Sulfide Nanoplates on Copper Rod and It's Application as Nonenzymatic Cholesterol Sensor, Electrochim. Acta, 2014, 130, 239–244, DOI:10.1016/j.electacta.2014.02.155.
- J. Yang, H. Lee, M. Cho, J. Nam and Y. Lee, Nonenzymatic Cholesterol Sensor Based on Spontaneous Deposition of Platinum Nanoparticles on Layer-by-Layer Assembled CNT Thin Film, Sens. Actuators, B, 2012, 171–172, 374–379 CrossRef CAS.
- N. Khaliq, M. A. Rasheed, G. Cha, M. Khan, S. Karim, P. Schmuki and G. Ali, Development of Non-Enzymatic Cholesterol Bio-Sensor Based on TiO2 Nanotubes Decorated with Cu2O Nanoparticles, Sens. Actuators, B, 2020, 302, 127200, DOI:10.1016/j.snb.2019.127200.
- J. Yuan, P. Wang, C. Hao and G. Yu, Photoelectrochemical Reduction of Carbon Dioxide at CuInS2/Graphene Hybrid Thin Film Electrode, Electrochim. Acta, 2016, 193, 1–6, DOI:10.1016/j.electacta.2016.02.037.
- T. L. Li and H. Teng, Solution Synthesis of High-Quality CuInS2 Quantum Dots as Sensitizers for TiO2 Photoelectrodes, J. Mater. Chem., 2010, 20(18), 3656–3664, 10.1039/b927279h.
- X. Long, F. Zhang, Y. He, S. Hou, B. Zhang and G. Zou, Promising Anodic Electrochemiluminescence of Nontoxic Core/Shell CuInS2/ZnS Nanocrystals in Aqueous Medium and Its Biosensing Potential, Anal. Chem., 2018, 90(5), 3563–3569, DOI:10.1021/acs.analchem.8b00006.
- A. Loudiki, W. Boumya, H. Hammani, H. Nasrellah, Y. El Bouabi, M. Zeroual, A. Farahi, S. Lahrich, K. Hnini, M. Achak, M. Bakasse and M. A. El Mhammedi, Ibuprofen Analysis in Blood Samples by Palladium Particles-Impregnated Sodium Montmorillonite Electrodes: Validation Using High Performance Liquid Chromatography, Mater. Sci. Eng., C, 2016, 69, 616–624, DOI:10.1016/j.msec.2016.07.024.
- L. Ciríaco, C. Anjo, J. Correia, M. J. Pacheco and A. Lopes, Electrochimica Acta Electrochemical Degradation of Ibuprofen on Ti/Pt/PbO2 and Si/BDD Electrodes, Electrochim. Acta, 2009, 54, 1464–1472, DOI:10.1016/j.electacta.2008.09.022.
- A. R. Bakr and S. Rahaman, Electrochemical Efficacy of a Carboxylated Multiwalled Carbon Nanotube Filter for the Removal of Ibuprofen from Aqueous Solutions under Acidic Conditions, Chemosphere, 2016, 153, 508–520, DOI:10.1016/j.chemosphere.2016.03.078.
- S. Amin, M. T. Soomro, N. Memon, A. R. Solangi, T. Qureshi and A. R. Behzad, Monitoring & Management Disposable Screen Printed Graphite Electrode for the Direct Electrochemical Determination of Ibuprofen in Surface Water, Environ. Nanotechnol., Monit. Manage., 2014, 1–2, 8–13, DOI:10.1016/j.enmm.2014.07.001.
- V. J. Nagaraj, M. Jacobs and M. Vattipalli, Environmental Science Nanochannel-Based Electrochemical Sensor for the Detection of Pharmaceutical Contaminants in Water, Environ. Sci.: Processes Impacts, 2014, 16, 135–140, 10.1039/c3em00406f.
- S. C. Chaves, P. N. C. Aguiar, L. M. F. C. Torres, E. S. Gil and R. C. S. Luz, Simultaneous Determination of Caffeine, Ibuprofen, and Paracetamol by Flow-Injection Analysis with Multiple-Pulse Amperometric Detection on Boron-Doped Diamond Electrode, Electroanalysis, 2015, 27, 2785–2791, DOI:10.1002/elan.201500306.
- M. Roushani and F. Shahdost-fard, Covalent Attachment of Aptamer onto Nanocomposite as a High Performance Electrochemical Sensing Platform: Fabrication of an Ultra-Sensitive Ibuprofen Electrochemical Aptasensor, Mater. Sci. Eng., C, 2016, 68, 128–135, DOI:10.1016/j.msec.2016.05.099.
- M. Roushani and F. Shahdost-fard, Talanta Fabrication of an Ultrasensitive Ibuprofen Nanoaptasensor Based on Covalent Attachment of Aptamer to Electrochemically Deposited Gold-Nanoparticles on Glassy Carbon Electrode, Talanta, 2015, 144, 510–516, DOI:10.1016/j.talanta.2015.06.052.
- T. Akdas, J. Walter, D. Segets, M. Distaso, B. Winter, B. Birajdar, E. Spiecker and W. Peukert, Investigation of the Size-Property Relationship in CuInS2 Quantum Dots, Nanoscale, 2015, 7(43), 18105–18118, 10.1039/c5nr04291g.
- C. Xia, W. Wu, T. Yu, X. Xie, C. Van Oversteeg, H. C. Gerritsen and C. De Mello Donega, Size-Dependent Band-Gap and Molar Absorption Coefficients of Colloidal CuInS2 Quantum Dots, ACS Nano, 2018, 12(8), 8350–8361, DOI:10.1021/acsnano.8b03641.
- P. Si, S. Ding, J. Yuan, X. W. Lou and D. H. Kim, Hierarchically Structured One-Dimensional TiO2 for Protein Immobilization, Direct Electrochemistry, and Mediator-Free Glucose Sensing, ACS Nano, 2011, 5(9), 7617–7626, DOI:10.1021/nn202714c.
- Y. Qin, J. Zhang, Y. Wang, X. Shu, C. Yu, J. Cui, H. Zheng, Y. Zhang and Y. Wu, Supercapacitive Performance of Electrochemically Doped TiO2 Nanotube Arrays Decorated with Cu2O Nanoparticles, RSC Adv., 2016, 6(53), 47669–47675, 10.1039/c6ra08891k.
- X. Zou, H. Fan, Y. Tian, X. Yan, M. Zhang and X. Yan, Chemical Bath Deposition of Cu2O Quantum Dots onto ZnO Nanorod Arrays for Application in Photovoltaic Devices, RSC Adv., 2015, 5, 23401–23409, 10.1039/c4ra13776k.
- K. Dong, J. He, J. Liu, F. Li, L. Yu, Y. Zhang, X. Zhou and H. Ma, Photocatalytic Performance of Cu2O-Loaded TiO2/RGO Nanoheterojunctions Obtained by UV Reduction, J. Mater. Sci., 2017, 52(11), 6754–6766, DOI:10.1007/s10853-017-0911-2.
- M. Jung, J. N. Hart, J. Scott, Y. H. Ng, Y. Jiang and R. Amal, Exploring Cu Oxidation State on TiO2 and Its Transformation during Photocatalytic Hydrogen Evolution, Appl. Catal., A, 2016, 521, 190–201, DOI:10.1016/j.apcata.2015.11.013.
- Y. C. Chen, H. H. Chang and Y. K. Hsu, Synthesis of CuInS2 Quantum Dots/In2S3/ZnO Nanowire Arrays with High Photoelectrochemical Activity, ACS Sustainable Chem. Eng., 2018, 6(8), 10861–10868, DOI:10.1021/acssuschemeng.8b02154.
- B. B. Xie, B. B. Hu, L. F. Jiang, G. Li and Z. L. Du, The Phase Transformation of CuInS2 from Chalcopyrite to Wurtzite, Nanoscale Res. Lett., 2015, 10(1), 1–7, DOI:10.1186/s11671-015-0800-z.
- M. Santamaria, G. Conigliaro, F. Di Franco and F. Di Quarto, Photoelectrochemical Evidence of Cu2O/TiO2 Nanotubes Hetero-Junctions Formation and Their Physicochemical Characterization, Electrochim. Acta, 2014, 144, 315–323, DOI:10.1016/j.electacta.2014.07.154.
- Y. Hou, X. Y. Li, Q. D. Zhao, X. Quan and G. H. Chen, Fabrication of Cu2O/TiO2 Nanotube Heterojunction Arrays and Investigation of Its Photoelectrochemical Behavior, Appl. Phys. Lett., 2009, 95(9), 2–5, DOI:10.1063/1.3224181.
- S. K. Haram, A. Kshirsagar, Y. D. Gujarathi, P. P. Ingole, O. A. Nene, G. B. Markad and S. P. Nanavati, Quantum Confinement in CdTe Quantum Dots: Investigation through Cyclic Voltammetry Supported by Density Functional Theory (DFT), J. Phys. Chem. C, 2011, 115(14), 6243–6249, DOI:10.1021/jp111463f.
- I. Azcarate, C. Costentin, C. Méthivier, A. Grimaud, I. Azcarate, C. Costentin, C. Méthivier, C. Laberty-robert, A. Grimaud, I. Azcarate, O. C. Costentin, C. Methivier, C. Laberty-Robert and O. Alexis, Electron Transfer at the Metal Oxide/Electrolyte Interface: A Simple Methodology for Quantitative Kinetics Evaluation, J. Phys. Chem. C, 2018, 122(24), 12761–12770 CrossRef CAS.
- D. Voigt, M. Bredol and A. Gonabadi, A General Strategy for CuInS2 Based Quantum Dots with Adjustable Surface Chemistry, Opt. Mater., 2021, 115, 110994, DOI:10.1016/j.optmat.2021.110994.
- L. Brus, Electronic Wave Functions in Semiconductor Clusters: Experiment and Theory, J. Phys. Chem., 1986, 90(12), 2555–2560, DOI:10.1021/j100403a003.
- Y. Liu, T. Chen, Z. Peng, L. Wu, K. Chen, P. Zhou, L. Wang and W. Chen, Size-Dependent Photoluminescence Dynamics of CuInS2 Quantum Dots and Charge Injection on Titanium Oxide Film, J. Alloys Compd., 2016, 658, 76–84, DOI:10.1016/j.jallcom.2015.10.183.
- J. H. Lee, D. W. Shoeman, S. S. Kim and A. S. Csallany, The Effect of Superoxide Anion in the Production of Seven Major Cholesterol Oxidation Products in Aprotic and Protic Conditions, Int. J. Food Sci. Nutr., 1997, 48(2), 151–159, DOI:10.3109/09637489709006975.
- Q. Li, P. Xu, B. Zhang, H. Tsai, S. Zheng, G. Wu and H. L. Wang, Structure-Dependent Electrocatalytic Properties of Cu2O Nanocrystals for Oxygen Reduction Reaction, J. Phys. Chem. C, 2013, 117, 13872–13878, DOI:10.1021/jp403655y.
- Z. Zheng, B. Huang, Z. Wang, M. Guo, X. Qin, X. Zhang, P. Wang and Y. Dai, Crystal Faces of Cu2O and Their Stabilities in Photocatalytic Reactions, J. Phys. Chem. C, 2009, 113(32), 14448–14453, DOI:10.1021/jp904198d.
- J. W. Morzycki and A. Sobkowiak, Electrochemical Oxidation of Cholesterol, Beilstein J. Org. Chem., 2015, 11, 392–402, DOI:10.3762/bjoc.11.45.
- H. Liu, C. Gu, W. Xiong and M. Zhang, A Sensitive Hydrogen Peroxide Biosensor Using Ultra-Small CuInS2 Nanocrystals as Peroxidase Mimics, Sens. Actuators, B, 2015, 209, 670–676, DOI:10.1016/j.snb.2014.12.052.
- N. Agnihotri, A. D. Chowdhury and A. De, Non-Enzymatic Electrochemical Detection of Cholesterol Using β-Cyclodextrin Functionalized Graphene, Biosens. Bioelectron., 2015, 63, 212–217, DOI:10.1016/j.bios.2014.07.037.
- Y. Li, H. Bai, Q. Liu, J. Bao, M. Han and Z. Dai, A Nonenzymatic Cholesterol Sensor Constructed by Using Porous Tubular Silver Nanoparticles, Biosens. Bioelectron., 2010, 25(10), 2356–2360, DOI:10.1016/j.snb.2012.04.070.
- R. S. Dey and C. R. Raj, Development of an Amperometric Cholesterol Biosensor Based on Graphene-Pt Nanoparticle Hybrid Material, J. Phys. Chem. C, 2010, 114(49), 21427–21433, DOI:10.1021/jp105895a.
- A. Safavi and F. Farjami, Electrodeposition of Gold-Platinum Alloy Nanoparticles on Ionic Liquid-Chitosan Composite Film and Its Application in Fabricating an Amperometric Cholesterol Biosensor, Biosens. Bioelectron., 2011, 26(5), 2547–2552, DOI:10.1016/j.bios.2010.11.002.
- U. Saxena, M. Chakraborty and P. Goswami, Covalent Immobilization of Cholesterol Oxidase on Self-Assembled Gold Nanoparticles for Highly Sensitive Amperometric Detection of Cholesterol in Real Samples, Biosens. Bioelectron., 2011, 26(6), 3037–3043, DOI:10.1016/j.bios.2010.12.009.
- A. Umar, M. M. Rahman, M. Vaseem and Y. B. Hahn, Ultra-Sensitive Cholesterol Biosensor Based on Low-Temperature Grown ZnO Nanoparticles, Electrochem. Commun., 2009, 11(1), 118–121, DOI:10.1016/j.elecom.2008.10.046.
- A. N. Sekretaryova, V. Beni, M. Eriksson, A. A. Karyakin, A. P. F. Turner and M. Y. Vagin, Cholesterol Self-Powered Biosensor, Anal. Chem., 2014, 86, 9540–9547 CrossRef CAS PubMed.
- X. Cai, X. Gao, L. Wang, Q. Wu and X. Lin, A Layer-by-Layer Assembled and Carbon Nanotubes/Gold Nanoparticles-Based Bienzyme Biosensor for Cholesterol Detection, Sens. Actuators, B, 2013, 181, 575–583, DOI:10.1016/j.snb.2013.02.050.
- Q. Yang, M. Long, L. Tan, Y. Zhang, J. Ouyang, P. Liu and A. Tang, Helical TiO2 Nanotube Arrays Modified by Cu–Cu2O with Ultrahigh Sensitivity for the Nonenzymatic Electro-Oxidation of Glucose, ACS Appl. Mater. Interfaces, 2015, 7, 12719–12730, DOI:10.1021/acsami.5b03401.
- N. N. Oh, R. K. Singh and A. Schechter, Electrochemical Investigation of Urea Oxidation Reaction on β Ni(OH)2 and Ni/Ni(OH)2, Electrochim. Acta, 2018, 278, 405–411, DOI:10.1016/j.electacta.2018.05.049.
- R. Hallaj, A. Salimi, K. Akhtari and S. Soltanian, Electrodeposition of Guanine Oxidation Product onto Zinc Oxide Nanoparticles: Application to Nanomolar Detection of L-Cysteine, Sens. Actuators, B, 2009, 135, 632–641, DOI:10.1016/j.snb.2008.09.053.
- B. K. Boggs, R. L. King and G. G. Botte, Urea Electrolysis: Direct Hydrogen Production from Urine, Chem. Commun., 2009, 4859–4861, 10.1039/b905974a.
- M. Liu, R. Liu and W. Chen, Graphene Wrapped Cu2O Nanocubes: Non-Enzymatic Electrochemical Sensors for the Detection of Glucose and Hydrogen Peroxide with Enhanced Stability, Biosens. Bioelectron., 2013, 45, 206–212, DOI:10.1016/j.bios.2013.02.010.
- K. S. Ramaiah and V. S. Raja, Effect of the Solution PH on the Growth of Spray-Deposited CuInS2 Thin Films, J. Mater. Sci.: Mater. Electron., 1999, 10, 145–149, DOI:10.1023/A.
- A. El-Shaer, A. Ramadan Abdelwahed, A. Tawfik, M. Mossad and D. Hemada, Effect of Deposition Parameters on Electrodeposited Cuprous Oxide Thin Films, Int. J. Emerging Technol. Adv. Eng., 2008, 4(12), 595–602 Search PubMed.
- I. A. Mir, K. Das, T. Akhter, R. Ranjan, R. Patel and H. B. Bohidar, Eco-Friendly Synthesis of CuInS2 and CuInS2@ZnS Quantum Dots and Their Effect on Enzyme Activity of Lysozyme, RSC Adv., 2018, 8(53), 30589–30599, 10.1039/c8ra04866e.
- A. Arshad, R. Akram, S. Iqbal, F. Batool, B. Iqbal, B. Khalid and A. U. Khan, Aqueous Synthesis of Tunable Fluorescent, Semiconductor CuInS2 Quantum Dots for Bioimaging, Arabian J. Chem., 2016, 2, 4–11, DOI:10.1016/j.arabjc.2016.10.002.
Footnote |
| † Electronic supplementary information (ESI) available: Different stages of fabrication of a non-enzymatic biosensor, FESEM images of the cross-sectional view of CuInS2/Cu2O/TNT and Cu2O/TNT electrodes decorated with CuInS2 and Cu2O QDs for different deposition cycles along with their corresponding QD size distribution. The schemes showing the variation in band-gaps of Cu2O QDs and CuInS2 QDs with particle sizes respectively, EDX spectra and elemental mapping of CuInS2/Cu2O/TNTs, and comparison of high-resolution XPS spectra of Cu 2p for Cu2O/TNT, CuInS2/TNT, and CuInS2/Cu2O/TNT electrodes. Fitted curves of EIS spectra and the values of circuit parameters of TNTs, Cu2O/TNTs, CuInS2/TNTs, CuInS2(4)/Cu2O/TNTs, CuInS2(6)/Cu2O/TNTs, and CuInS2(8)/Cu2O/TNTs, fitting of the linear portion of the Mott–Schottky curves of TNTs, Cu2O/TNTs, and CuInS2/Cu2O/TNTs, cyclic voltammetry of Cu2O/TNT and CuInS2/Cu2O/TNT electrodes for varying the loading density of Cu2O and CuInS2 QDs (by keeping the Cu2O QD deposition fixed to 10 cycles) respectively. Cyclic voltammetry response studies of the pristine TNTs as a function of cholesterol concentration. Linear fitting of the calibration curve of TNT, Cu2O/TNT, and CuInS2/TNT electrodes derived from their corresponding amperometric response for cholesterol detection. The effect of pH and temperature of the electrolyte on the current response of the CuInS2/Cu2O/TNT electrode for cholesterol detection, reproducibility and repeatability of the CuInS2/Cu2O/TNT electrode towards cholesterol, linear fitting of the calibration curve of TNT, Cu2O/TNT, and CuInS2/TNT electrodes for ibuprofen detection. The effect of pH and temperature of the electrolyte and reproducibility and repeatability of CuInS2/Cu2O/TNTs for ibuprofen detection. FESEM cross-sectional images of the used Cu2O/TNTs, CuInS2/TNTs, CuInS2(4)/Cu2O/TNTs, CuInS2(6)/Cu2O/TNTs, and CuInS2(8)/Cu2O/TNTs and comparison between the XRD patterns of the fresh and used CuInS2/Cu2O/TNTs. See DOI: https://doi.org/10.1039/d4nr00422a |
| This journal is © The Royal Society of Chemistry 2024 |

