 Open Access Article
Retuning the potential of the electrochemical leaf†
Marta M. Dolińska ,
Adam J. Kirwan
 and
Clare F. Megarity
 *
*
School of Chemistry, Manchester Institute of Biotechnology, University of Manchester, 131 Princess Street, Manchester M1 7DN, UK. E-mail: clare.megarity@manchester.ac.uk
First published on 7th June 2024
Abstract
The electrochemical leaf enables the electrification and control of multi-enzyme cascades by exploiting two discoveries: (i) the ability to electrify the photosynthetic enzyme ferredoxin NADP+ reductase (FNR), driving it to catalyse the interconversion of NADP+/NADPH whilst it is entrapped in a highly porous, metal oxide electrode, and (ii) the evidence that additional enzymes can be co-entrapped in the electrode pores where, through one NADP(H)-dependent enzyme, extended cascades can be driven by electrical connection to FNR, via NADP(H) recycling. By changing a critical active-site tyrosine to serine, FNR’s exclusivity for NADP(H) is swapped for unphosphorylated NAD(H). Here we present an electrochemical study of this variant FNR, and show that in addition to the intended inversion of cofactor preference, this change to the active site has altered FNR’s tuning of the flavin reduction potential, making it less reductive. Exploiting the ability to monitor the variant’s activity with NADP(H) as a function of potential has revealed a trapped intermediate state, relieved only by applying a negative overpotential, which allows catalysis to proceed. Inhibition by NADP+ (very tightly bound) with respect to NAD(H) turnover was also revealed and interestingly, this inhibition changes depending on the applied potential. These findings are of critical importance for future exploitation of the electrochemical leaf.
Introduction
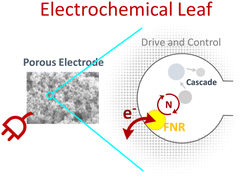
In the chloroplast, light-excited electrons are sequentially transferred through a series of protein-bound redox centres until they are ultimately transferred as a hydride to NADP+ to provide reducing equivalents (NADPH) to the biosynthetic Calvin–Benson–Bassham cycle. This photosynthetic electron flow is unidirectional, with each transfer made possible by nature’s ability to tune the reduction potentials of the redox cofactors through specific binding in the protein environment. Pivotal in this sequence is electron transfer from the 2Fe–S centre of the freely diffusible protein ferredoxin (Fd) to the flavin cofactor in ferredoxin NADP+ reductase (FNR), which then transfers the electrons as hydride to NADP+. Nature has tuned the reduction potential of the 2Fe–S centre in Fd to be more negative than that of the flavin adenine dinucleotide (FAD) in FNR, which in turn, is more negative than that of NADP+. Potential tuning by a protein environment is starkly exemplified by comparing the reduction potential of unbound FAD (−0.23 V vs. SHE) to its potential when bound in the active site of FNR (−0.38 V vs. SHE) – the former would not be able to reduce NADP+ (−0.35 V vs. SHE); all potentials are quoted for pH 8. In addition, since Fd, FNR and NADP+ are freely diffusible, their interactions are enhanced by nanoconfinement in the crowded environment of the chloroplast.In a parallel invention, the Electrochemical Leaf (e-Leaf)1–15 (Scheme 1), FNR is pivotal. Sunlight is replaced with electricity, Fd is replaced by an indium tin oxide (ITO) electrode and the Calvin–Benson–Bassham cycle is replaced with a biosynthetic cascade of choice, now driven by electricity via FNR, with overall cascade catalysis displayed as electrical current.
The nanoconfined and jam-packed environment of the chloroplast is mirrored in the highly porous electrode into which the enzymes crowd and remain entrapped. Importantly, electron exchange between the active-site FAD in FNR and the electrode is under direct potential control, and electrons can transfer with its active-site FAD bidirectionally, allowing it to catalyse the interconversion of NADP+/NADPH, which can then be used by any NADP(H)-dependent enzyme co-entrapped in the pores. In this crucial step, FNR transduces electricity to connect to enzymes and extended multi-enzyme cascades that are not electroactive – opening the door to a myriad of electrochemically controlled, complex and interconnected enzyme-cascade chemistries.
It is the combination of the ability to electrically control and interact with multi-enzyme cascades and their crowded entrapment that makes the e-Leaf unique as an enzyme-cascade operating system. The e-Leaf has been driven by air,7 light6 and by hydrogen in a fuel-cell configuration;5 it has also been scaled for synthesis.8 It has driven a five-enzyme cascade to reductively assimilate CO2 (C1) into a C3 molecule to form a C4 molecule, with CO2 supplied in situ by the co-entrapment of carbonic anhydrase in the porous electrode.10 Directional control of the driving force has enabled the e-Leaf to function as an electrochemical deracemiser by switching the direction of alcohol dehydrogenases with opposing enantioselectivities.12 The e-Leaf has also made it possible to measure the time-resolved binding kinetics of extremely slow-to-bind drugs to an enzyme target driven continuously under steady state;13 this led to the resolution of a two-stage process involving a pre-inhibitory bound state.15 Evidence for the massive advantage that crowded nanoconfinement provides was exemplified in a new design, extending the scope to non-electroactive kinases by exploiting carboxylic acid reductase (CAR) (dependent on NADP(H) and ATP), enabling connection to kinases. The accumulation and recycling of ATP in situ by the kinase cascade outcompeted the system relying on stoichiometric amounts of ATP (i.e. without kinases), because a co-entrapped kinase sequestered inhibitory AMP released from CAR.11
In nature, FNR exhibits exclusive selectivity for the phosphorylated version of the nicotinamide cofactor (NADP(H)) and its C-terminal tyrosine is critical for this recognition.16–20 This aromatic tyrosine is positioned parallel and close to the re-face of the active-site FAD and therefore, counterintuitively, blocks access to the nicotinamide moiety of NADP+, which must occupy this position for efficient hydride transfer from reduced FAD to its C4.17,21 For productive docking of the nicotinamide, there is an energetic cost for the structural rearrangement that must occur to displace the sterically hindering tyrosine. This cost is not outweighed by the energetic gain upon binding of the nicotinamide moiety, but initial very tight binding of the 2′-P-AMP part of NADP(H) anchors the molecule and compensates for the energetic cost to displace the tyrosine. The structure of wild-type (WT) FNR in complex with NADP+ shows unproductive binding of the nicotinamide, in which its 2′-phospho-AMP and the pyrophosphate portion are bound correctly, but its nicotinamide moiety occupies a site that disallows hydride transfer with the isoalloxazine ring (Fig. 1).17
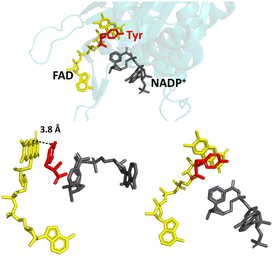 | ||
| Fig. 1 Unproductive binding of NADP+ in WT FNR. The C-terminal tyrosine (shown in red) stacks parallel to the isoalloxazine ring system of FAD (shown in yellow), blocking access to the nicotinamide moiety of NADP+ (shown in grey); PDB 1GJR.17 | ||
Since the crystal structure is a snapshot, this conformation is an intermediate state during the process of productive docking of the nicotinamide. The enzyme is inactive with the unphosphorylated version of the cofactor (NAD(H)) because the initial highly favourable tight binding of the 2′-P-AMP anchor is not possible.20 Other sites in the enzyme have been implicated in the overall mechanism of cofactor specificity, including the region that binds the pyrophosphate part of NADP(H).22 In addition to its role in the enzyme’s cofactor selectivity, this tyrosine has also been implicated in the rate of electron exchange with FNR’s electron-transfer protein partner, ferredoxin, and the stabilisation of the FAD semiquinone radical produced upon the first single electron transfer from ferredoxin.23
By changing the aromatic active-site C-terminal tyrosine to serine (Fig. 2), the resulting FNR variant is no longer exclusive for NADP(H), and can turnover the unphosphorylated NAD(H).16,23–25 The tyrosine-to-serine (Y308S) variant from pea has a kcat value for NAD(H) (430 s−1) that is comparable to that of the WT enzyme (490 s−1) with NAD(P)(H).16 Its Km for NADH, however, is very high at 450 μM. By removing the sterically hindering tyrosine, it would be reasonable to assume that the variant would retain or even have increased activity towards NADP(H), but this is not the case – NADP+ binds tightly,18,21 but the rate of the oxidation of NADPH (with K3Fe(CN)6 or dichlorophenolindophenol (DCPIP) as the electron donor) is exceptionally slow16 (kcat, 32 s−1); this rate is not limited by hydride transfer, but by the subsequent dissociation of the product, NADP+.16,18
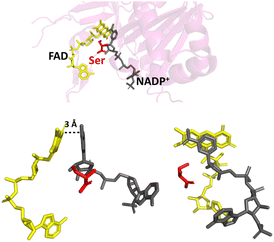 | ||
| Fig. 2 Binding of NADP+ in the Y354S variant FNR. The C-terminal serine is shown in red; the nicotinamide moiety of NADP+ (shown in grey) can now align parallel with the isoalloxazine ring system of FAD (shown in yellow); PDB 1QFY.21 | ||
Changing the equivalent tyrosine to serine in the cyanobacteria Anabaena PCC7119 caused a shift in the reduction potential of its flavin to a less negative value, indicating involvement of the tyrosine, not only in the strict cofactor preference for NADP(H), but also the modulation of the reduction potential of the flavin.23
Here, we present an electrochemical study of the C-terminal tyrosine-to-serine variant FNR (Y354S) from the green alga Chlamydomonas reinhardtii, including its activity coupled to downstream NAD(H)-dependent enzymes co-entrapped in the porous electrode of the e-Leaf. We show that in addition to the intended inversion of cofactor preference, engineering the active site has altered the enzyme’s tuning of the flavin reduction potential, making it less reductive. The very slow activity of the variant with NADP(H) has been deconvoluted via the dimension of electrical potential, to reveal a proposed intermediate state in the sequence of binding, hydride transfer and release. An important additional finding is that NADP+ inhibits the variant with respect to NAD+ and this inhibition is potential-dependent.
Results
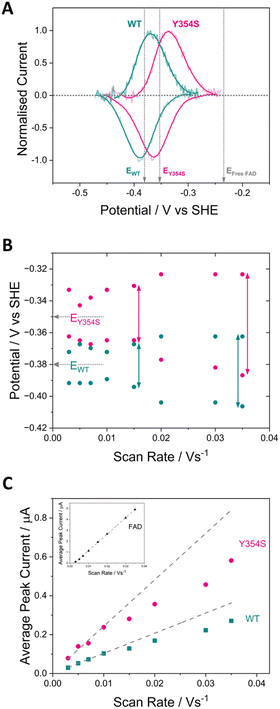
Fig. 3 shows cyclic voltammograms measured for WT FNR and the Y354S variant, adsorbed in a porous ITO electrode and measured at pH 8. The average two-electron reduction potential was also measured for unbound FAD adsorbed in the electrode pores and is indicated on the voltammogram (−0.23 V vs. SHE). The average (two-electron) reduction potential for FAD bound in WT FNR is −0.38 V vs. SHE, whereas for the Y354S variant it is −0.35 V vs. SHE, ∼30 mV more positive than that for the WT. In early work to solve the structure of the Y–S variant (from pea) in complex with NADP+, spectroscopic analysis showed that this variant (and not the WT) co-purified with NADP+, observed as a red-shift in the variant’s visible spectrum compared to the WT, with no further change upon addition of NADP+.21 To investigate whether our Y354S variant from C. reinhardtii also copurified with NADP+, we measured the visible spectra (absorbance) for the WT and Y354S in the absence and presence of NADP+ (ESI Fig. 1†). We did not observe a significant red-shift in the absorbance spectrum for Y354S compared to the WT, and the addition of NADP+ (equimolar and ten-times excess) caused a red-shift for the variant but not the WT (ESI Fig. 1B–E†). Our results indicate that our variant enzyme did not copurify with NADP+. We therefore conclude that the observed change in the redox potential of the active-site FAD is due to the tyrosine-to-serine change, and not from the binding of NADP+ in the active site.Flavins undergo cooperative two-electron reduction as a sequence of two one-electron transfers shown in the following Latimer scheme, where E1 is the reduction potential for the oxidised (FAD)/semiquinone (FADH˙) couple and E2 is the reduction potential for the semiquinone (FADH˙)/hydroquinone (FADH2) couple; the overall two-electron reduction potential is the average of E1 and E2.
In WT FNR, E1 is more negative than E2, i.e., the potentials are “crossed” – the semiquinone being unstable. The tuning of the overall potential of the flavin by a protein environment, including separate tuning of the E1 and E2 potentials, is achieved by tuning the relative binding affinities of these three reduction states of the flavin.26–28 Different factors are at play and include specific hydrogen-bonding patterns,29 π–π stacking interactions with the isoalloxazine ring,30 conformational changes of the ring,28,31 proximity of polar and non-polar residues to the flavin,32,33 the conformation of specific segments of the protein close to the isoalloxazine ring,34 and direct side-chain contacts.35 In flavodoxin from Desulfovibrio vulgaris, an active-site tyrosine shields the si-face of its flavin mononucleotide (FMN) cofactor and plays a critical role in the tuning of its overall reduction potential by modulating the semiquinone/hydroquinone potential (E2).33,36 Changing the tyrosine to alanine resulted in an increase in the E2 potential for the FMN, and was attributed to the elimination of the coplanar aromatic stacking of the tyrosine and to a lesser extent, the greater exposure of the isoalloxazine ring to solvent.30 The C-terminal tyrosine in FNR from pea and Anabaena is implicated in the tuning of the potential of the FAD through its contribution to stabilization of the semiquinone (required to enable splitting of the two-electron transfer).
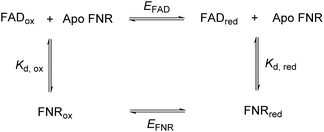
In FNR, the flavin is quite exposed so that it can receive electrons from the protein electron donor, ferredoxin. Its C-terminal tyrosine stacks coplanar to the re-face of the isoalloxazine ring, blocking access to the nicotinamide and playing a role in the control of exposure to solvent.21 Changing this tyrosine to serine in FNR from C. reinhardtii has caused a significant change in the flavin’s environment, by increasing solvent exposure and removing the stacking interaction of the aromatic residue – this has altered the overall reduction potential of the FAD by affecting the relative binding affinities of the oxidised and reduced FAD. The following square scheme relates the dissociation constants for oxidised and reduced FAD to the overall two-electron reduction potential for the flavin.
Combining the Nernst equation with the definition of the dissociation constants for oxidised and reduced FAD results in the equation below.
For the WT enzyme at pH 8 the  ratio is 1 × 10⁻⁵ and for the Y354S variant this increases by ten times to 1 × 10⁻⁴. For both enzymes, the reduced flavin binds less tightly than the oxidised form, but the difference in the binding affinity between reduced to oxidised is less for the Y354S variant.
The shift in the variant’s FAD reduction potential towards that of free flavin is not surprising, since the removal of the solvent-shielding phenol group of tyrosine exposes the bound FAD to solvent, enabling it to behave more like free FAD in solution.
In the cyclic voltammograms for measuring non-turnover peaks for Y354S, we sometimes observe a second oxidation peak corresponding to the potential for free FAD (ESI Fig. 2†), which has never been observed for the WT. The tyrosine change to serine has most likely reduced the overall binding affinity of FAD. At oxidising potentials, the FAD will be enzyme-bound and as we scan to potentials past the non-turnover reduction peak, some FAD may dissociate from the enzyme but remain entrapped in the crowded environment of the electrode pores. This unbound FAD will therefore be oxidised during the subsequent oxidative sweep at the potential for free flavin, after which it will re-bind to the enzyme, which explains the absence of a peak corresponding to the reduction of free FAD in the subsequent reductive scan.
The dependence of FAD’s oxidation and reduction peak positions and average peak currents on scan rate is shown in Fig. 3B and C. As expected, at faster scan rates the average peak current, for both the WT and Y354S, deviates from linearity resulting in lower currents, due to peak broadening caused by electron transfer (from the electrode to the active-site FAD) that is too slow to maintain a Nernstian equilibrium at each potential during the faster scans. The peak separation for Y354S is marginally greater than for the WT (Fig. 3B), indicating that electron transfer from the electrode to the variant is slightly less efficient – which may be related to the perturbation of FAD alignment in the active site.
The half-height peak width for Y354S (averaged from the scan rates, 0.03, 0.02, 0.015 and 0.01 V s−1) is ∼65 mV, which is comparable to that measured for the WT in this work (∼63 mV). For an immobilised redox couple, a fully cooperative two-electron reaction should have a peak width of ∼45 mV (89/n)37 for both oxidation and reduction. The two-electron reduction of the FAD in Y354S is therefore partially cooperative to the same extent as for the WT. The pH-dependence of the non-turnover peaks for Y354S is shown in ESI Fig. 3.†
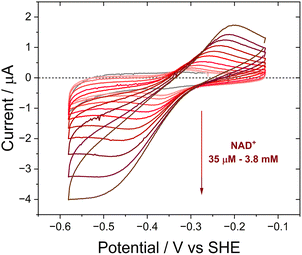
The activity of Y354S with NAD(H) was confirmed by direct electrochemistry (Fig. 4). The introduction of increasing concentrations of NAD+ to the bulk solution resulted in quasi-reversible catalytic peaks which became wave-like at higher concentrations. There is a higher rate for reduction (negative current) than oxidation – the same catalytic bias shown by the WT, which also favours the reduction of NADP+, its role in photosynthesis. Direct control of the electrode potential enables this bias to be observed as we drive the enzyme against its natural reductive preference. The peak current for NAD+ reduction at different scan rates is shown in ESI Fig. 4.†
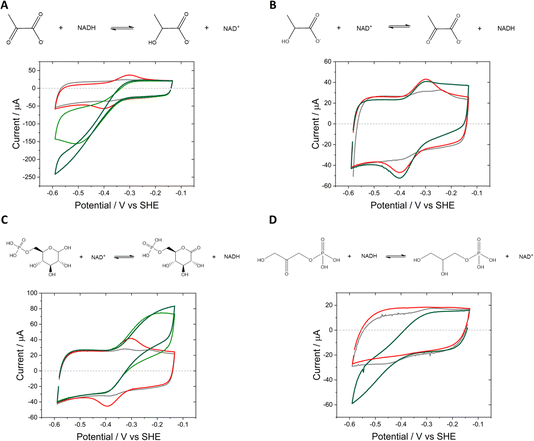
In the e-Leaf, coupling of the interconversion of NAD+/NADH by Y354S to co-entrapped enzymes (which we refer to as E2) was monitored by cyclic voltammetry (Fig. 5), for lactate dehydrogenase (LDH) (A and B), D-glucose-6-phosphate dehydrogenase (G6PDH) (C), and glycerol-3-phosphate dehydrogenase (G3PD (D)). The catalytic bias for reduction by LDH is observed in (A), compared to its poor catalysis of the reverse oxidation (B), in which the addition of 5 mM L-lactate elicits only a small increase in oxidative current. Stronger oxidative coupling is observed for G6PDH in (C); reductive coupling of G3PD is shown in (D).
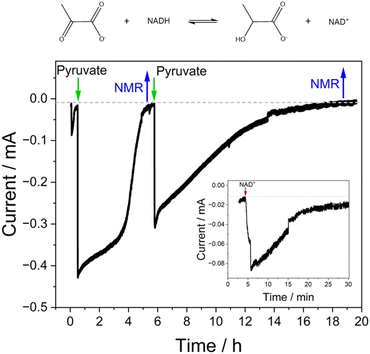
Based on these results, we drove the synthesis of L-lactate by LDH coupled to the interconversion of NAD+/NADH by Y354S, at a fixed potential of −0.53 V vs. SHE (Fig. 6). For this experiment, a “booklet” of four double-sided Y354S@ITO@Ti foil electrodes (total geometric surface area ∼ 12 cm2) was used. The LDH and Y354S enzymes were loaded overnight from a stirred dilute enzyme solution (details in Experimental section). The electrode booklet was rinsed thoroughly in buffer to remove any unbound enzyme before placement in the electrochemical cell. The addition of NAD+ (50 μM) at t = 5 min resulted in an increase in reduction current as Y354S catalysed its conversion to NADH; the current approached zero upon its full conversion. At this point, the addition of pyruvate (5 mM) caused a rapid increase in reductive current as LDH then catalysed its reduction to lactate, initiating the coupled reaction driven through interconversion of NAD+/NADH by Y354S. When the current approached the background zero level (indicating depletion of pyruvate), a sample for NMR analysis was taken, after which, the pyruvate was replenished (5 mM); a second sample for NMR analysis was taken at the end of the experiment. The charge passed during the first stage equated to approximately 2.5 × 10⁻⁵ mol (a concentration in ∼5.5 mL of 4.53 mM); NMR analysis of the sample taken at this point showed a concentration of 4.14 mM (ESI Fig. 5†). The agreement between coulometry and NMR is reasonable and within the error expected in determining the baseline correction. The charge passed during the second stage equated to 2.26 × 10⁻⁵ mol (a concentration in 4.9 mL (NMR sample-removal accounted for) of 4.6 mM); NMR analysis of the sample taken at this point showed a concentration of 4.1 mM, in reasonable agreement with coulometry.
Having demonstrated the e-Leaf cofactor preference swap, we investigated the Y354S variant’s activity with NADP(H), an important consideration when electrochemically driving interconnected and complex enzymes cascades, which may require both cofactors for different chemical steps. As previously mentioned, the literature reports poor Y–S variant activity for the oxidation of NADPH due to tight binding of the resulting NADP+ product (the rate-limiting step being its release). With the insight provided by direct electrochemistry (which brings the dimension of thermodynamic driving force (potential) to kinetics) we electrochemically examined Y354S in the presence of NADP(H) (Fig. 7).
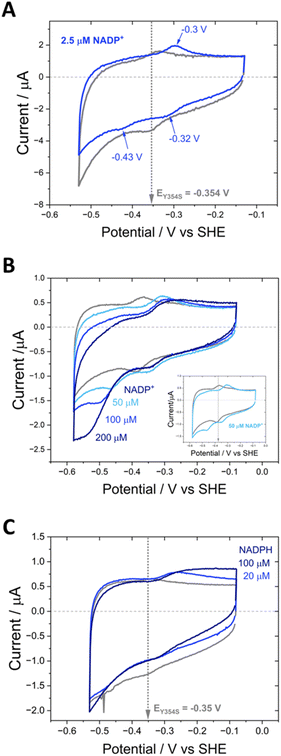
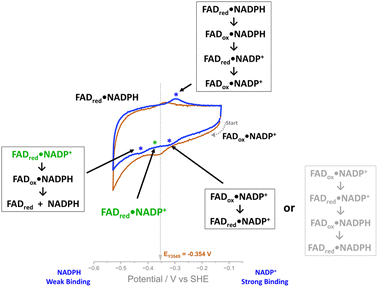
In contrast to the quasi-reversible catalysis of NAD+/NADH interconversion by Y354S shown in Fig. 4, or NADP+/NADPH interconversion by the WT enzyme2 (both observed as oxidation/reduction currents close to the potential for the nicotinamide couple), the variant’s response to the addition of NADP+ resulted in different behaviour for reduction compared to oxidation (Fig. 7). The addition of a relatively low concentration of NADP+ (∼2.5 μM) resulted in three peaks (Fig. 7A): a reduction peak at ∼−0.43 V vs. SHE, a reduction peak similar in size to the Y354S non-turnover reduction peak but shifted to a less negative voltage of ∼−0.32 V vs. SHE, and an oxidation peak at ∼−0.3 V vs. SHE, which was bigger and sharper than the non-turnover oxidation peak.
We hypothesised that the second reduction peak at ∼−0.43 V vs. SHE corresponds to slow turnover of NADP+, requiring a large overpotential, and that the oxidation peak must be due to the oxidation of the NADPH produced during this first reductive scan, interestingly not requiring a comparably large overpotential. This hypothesis was confirmed by separate titrations of both NADPH and NADP+, which resulted in a concentration-dependent increase in catalytic current (Fig. 7B and C); note that the NADP+ titration was carried out at pH 9 rather than pH 8 (as for A and C) and its inset shows that the same behaviour was observed, indicating that it is not pH-dependent.
The area under the reduction peak at −0.32 V vs. SHE is comparable to that for the non-turnover reduction peak for Y354S (grey scan in the absence of NADP+) which suggests that this peak also corresponds to a two-electron transfer to the active-site flavin, now with NADP+ tightly bound. It is therefore not strictly speaking a non-turnover peak, since this term is typically reserved for the redox signal due to the oxidation and reduction of FNR’s active-site flavin with no other ligands bound. In contrast, the oxidation peak at ∼−0.3 V is larger and sharper than the oxidation non-turnover peak, indicating that this is not a shifted flavin signal due to co-occupancy of the active site by the tightly bound NADP+ and instead is likely a four-electron transfer (two 2-electron transfers in succession) for catalysis of NADPH oxidation (confirmed in Fig. 7C) with a contribution from the shifted flavin signal.
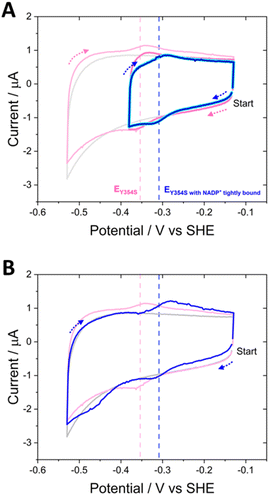
The ability to control the driving force and the direction of scanning through potentials during cyclic voltammetry enabled the experiment shown in Fig. 8. Non-turnover peak potentials for Y354S were confirmed in the usual way by scanning between −0.13 V and −0.53 V vs. SHE (pink voltammogram). The potential range was then truncated to scan between −0.13 V and −0.38 V vs. SHE, to monitor the current after the addition of 20 μM (cyan) and 100 μM NADP+ (dark blue), now avoiding the overpotential required to drive the production of NADPH (note, prior to NADP+ addition, non-turnover peaks were also monitored over this truncated range (dark pink voltammogram)). With NADP+ still present, the potential range was re-extended, and the current monitored again.
The truncated voltammograms measured with NADP+ present show a pair of redox peaks shifted to the right of the non-turnover peaks, in agreement with the position of those in Fig. 7A, but with a much smaller oxidation peak, now the same area as the non-turnover peak. Therefore, in the truncated voltammograms, these shifted peaks both now must correspond solely to a two-electron transfer, which is likely the flavin signal with NADP+ tightly bound, causing the observed increase in potential; in the oxidation peak, there is no longer a contribution from oxidation catalysis, since NADP+ was not reduced during the first half of the scan (truncated to exclude the potential required). The final voltammogram measured over the full potential range reverts to that shown in Fig. 7A, with a reduction peak at a large overpotential and a subsequent increase in the oxidation peak. A model to explain these unusual observations of the variant’s potential-dependent activity with NADP+ is proposed later in the Discussion section.
Fig. 9 shows the inhibitory effect of NADP+ on the variant’s catalysis of NAD+/NADH interconversion. At a very high concentration of NAD+ (1.1 mM) at pH 9, a pair of quasi-reversible large catalytic peaks were observed (red voltammogram in Fig. 9A). The addition of a relatively low concentration of NADP+ (10 μM) (blue voltammogram) caused almost complete inhibition of the oxidation reaction, but in contrast did not have the same effect on the enzyme’s reduction of NAD+, which proceeded at a greater driving force. To investigate this effect further, NADP+ titrations were carried out at 500 μM and 50 μM NAD+ (Fig. 9B and C). At 500 μM NAD+, the finer concentration range of NADP+ resulted in a more gradual inhibition of the oxidation reaction, eventually reaching almost complete inhibition at 3.75 μM NADP+. Again, the NAD+ reduction could proceed at a greater overpotential, even at the highest NADP+ concentration of 100 μM. When the experiment was repeated at a lower NAD+ concentration of 50 μM, the inhibition by NADP+ was slightly more potent, with a decrease in current magnitude also observable in addition to the greater overpotential required for NAD+ reduction – in this experiment, the slow reduction rate of the inhibitor, NADP+, is not swamped by a large NAD+ reduction current and so the highest addition of NADP+ (100 μM) was observed to contribute to the catalytic current.
Structural alignment of the variant bound to NADP+ with a second structure in which it is bound to NADPH shows excellent alignment (RMSD = 0.199) of the proteins’ overall global structure (Fig. 10). In both structures, the nicotinamide is not parallel to the isoalloxazine ring but stacks against it at an angle of approximately 30° with distances of 3 Å and 3.2 Å (NADP+ and NADPH, respectively) between the nicotinamide C4 and the N5 of FAD.21 However, whilst the nicotinamide cofactor molecules are aligned at their reactive nicotinamide moieties and their 2′-P-AMP ends, there is a clear difference in binding of the ribose proximal to the nicotinamide (indicated with an arrow in Fig. 10). A more subtle change with NADPH bound is a tilt in the entire isoalloxazine ring system, which caused the increase from 3 to 3.2 Å between the reactive moieties. These changes are proposed to account for the accommodation of the extra hydrogen on NADPH.21 We hypothesise that these subtly different binding orientations give rise to the potential-dependent inhibition observed in Fig. 9: upon reaching the highly reducing overpotential, tightly bound NADP+ is converted to NADPH and released, enabling NAD+ to bind and catalysis of its reduction to proceed.
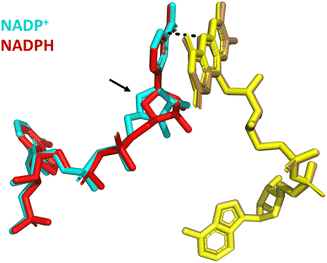 | ||
| Fig. 10 Structural alignment of Y354S bound to NADP+ (PDB 1QFY21) with Y354S bound to NADPH (PDB 1QFZ21); FAD (yellow shades); NADP+ (cyan); NADPH (red). | ||
Discussion
The ability to observe this variant’s activity with NADP+, as a function of electrical potential, has enabled the proposal of an intermediate state in the mechanism. Scheme 2 outlines the possible scenarios as we scan through a cyclic voltammogram. Starting at the most oxidising potential, the enzyme–NADP+ complex will be fully oxidised, FADox·NADP+. As we scan towards more negative potentials, we observe a peak at −0.32 V vs. SHE and the possible scenarios are indicated in the scheme; the second choice (the series of reactions written in pale grey in Scheme 2) can be ruled out, since the peak is similar in size to the two-electron non-turnover reduction peak before the addition of NADP+ and therefore cannot be due to a four-electron transfer (two successive two-electron transfers) that would give rise to the second intermediate choice. Other evidence that supports ruling out scenario two (pale grey) is the fact that this peak does not increase during the NADP+ titration. The most likely intermediate state, therefore, as we scan past this peak, is one in which the FAD is reduced and NADP+ is still tightly bound, FADred·NADP+ (Scheme 2, in green). Reaching the large negative overpotential of −0.43 V must therefore be the driving force required to enable the reduced enzyme to finally transfer the hydride to the tightly bound NADP+, which is followed by immediate reduction of the flavin again, and catalysis of NADP+ reduction proceeds.The ability to monitor oxidation and reduction catalysis as a function of potential via cyclic voltammetry revealed the differential NADP+ inhibition of the Y354S variant, which to the best of our knowledge has not previously been observed. This valuable information will now be a consideration for future use of the e-Leaf to drive and control complex cascades, which may require both versions of the nicotinamide cofactor. Driving such a cascade in reduction should pose no problem, since the phosphorylated cofactor will be mostly in its reduced form, which does not bind tightly to the Y354S variant, but when oxidising potentials are required, the variant will be inhibited, and with it, any cascade enzymes electrically driven through its NAD+/NADH interconversion. One solution might be to introduce potential pulses to relieve the inhibition on demand – this may even become an exploitable strategy for switching on and off particular steps in a complex multistep pathway. Further engineering of FNR can of course be explored.
Inspiration for inhibitory drug research can be drawn from this observed differential inhibition of Y354S in oxidation compared to reduction. By monitoring an enzyme or enzyme cascade implicated in disease in the e-Leaf, any potential-dependent drug inhibition patterns will be revealed, providing unique insight for the design of new drug candidates selective for only one reaction direction – oxidation or reduction – information that is unobtainable using traditional screening methods lacking the dimension of potential.
This Y354S variant illustrates the sensitivity of the cofactor reduction potential to the immediate active-site environment, which can ultimately be affected by other parts of the enzyme, even its global architecture. The parameter of potential tuning is a promising avenue in de novo enzyme design to create new finely tuned bespoke redox proteins,38–41 while tuning redox potentials for the design of coordinated activity of artificial pathways is particularly challenging.42 The tuning of the reduction potential of redox-active metalloenzymes can have a knock-on effect on the catalytic efficiency or even mechanism.43 De novo enzyme design has been used to investigate how enzymes tune cofactor reduction potentials and catalyse both oxidation and hydrolysis.39 Computational studies, such as ab initio, semiempirical, molecular dynamics, semi-continuum electrostatic calculations and machine learning to predict cofactor redox potentials based on natural systems, are providing new insight.31,44,45 The de novo design of new-to-nature enzymes is leading the way in new approaches to synthesis and enzymology, and its integration with the e-Leaf would bring another level of control and expand the space accessible to the electrification of multi-enzyme cascades crowded in the porous electrode.
Experimental
Expression and purification of the Y354S variant
The C-terminal tyrosine of wild-type (WT) FNR was changed to the non-aromatic residue, serine (Chlamydomonas reinhardtii enzyme numbering – Y354S) via QuickChange site-directed mutagenesis of the WT gene (with an N-terminal HIS-tag encoded in the vector).3 The variant enzyme was then expressed and purified using the same protocol as for the WT enzyme.11 In brief, competent Escherichia coli cells (BL21-DE3) were transformed with the vector containing the mutated gene; positive transformants were selected based on ampicillin resistance (encoded in the vector). The transformed cells were grown with shaking overnight at 37 °C and scaled up to 3 litres the following day (with ampicillin selection throughout by its addition to a final concentration of 0.3 mM). The cells were induced at the mid-log phase by the addition of isopropyl β-D-1-thiogalactopyranoside (IPTG) to a final concentration of approximately 0.5–1 mM and grown for a further 3–4 hours. The cultures were then centrifuged (8983 × g) at 4 °C for 30 min; the cell pellets were resuspended in cold buffer (50 mM HEPES; 150 mM NaCl; 10% v/v glycerol, pH 7.4) and stored at −20 °C until purification.After thawing, the cells were lysed using a cell disruptor (Constant Systems) and centrifuged for 1 hour to remove debris. The supernatant containing the variant enzyme was purified using nickel affinity chromatography (Ni2+ HisTrap HP affinity column, ÄKTA Pure, UNICORN software 6.4.1) with a 280 nm absorbance detector. The enzyme eluted in two peaks, as shown in the purification chromatogram, ESI Fig. 6.† Importantly, fractions from each peak were split and separately pooled and desalted using desalting columns (PD-10 GE Healthcare) to remove imidazole. Finally, Y354S FNR was aliquoted into 20 μL single-use portions, flash frozen in liquid nitrogen and stored at −80 °C.
Construction of porous indium tin oxide electrodes by electrophoretic deposition
Electrophoretic deposition46 was used to prepare indium tin oxide (ITO) (Sigma) porous electrode layers on conductive supports (either ITO glass slides, pyrolytic graphite edge (PGE) electrodes, or titanium foil). In brief, a suspension of ITO powder (0.02 g) and I2 (0.01 g) (Alfa Aesar iodine) was prepared in 20 mL of acetone and sonicated for 45 minutes. Then, two conductive supports (one as an auxiliary electrode) were held in parallel orientation in the ITO suspension, around 1 cm apart, for 7 minutes and a potential of 10 V was applied. The porous electrodes were allowed to dry, then rinsed in ultrapure water and dried in air before loading with enzyme for an experiment.Enzyme loading
Enzymes were loaded by drop-casting a concentrated droplet on to the electrode surface and allowing them to incubate for ∼30 minutes, either at 4 °C or RT, then rinsing in ultrapure water, to remove any unbound enzyme before placement in the electrochemical cell. For the experiments in which second enzymes were coupled to Y354S activity, they were either premixed in a concentrated droplet and allowed to soak in as described above, or for electrodes with a large surface area, the enzymes were added to a vial of buffer into which the electrode was submerged, and the enzyme solution stirred overnight to allow the enzymes to adsorb into the electrode pores. The Y354S enzyme from the sharp second peak in the purification chromatogram was used throughout this work. For the large-scale chronoamperometry, the enzymes were loaded from a dilute solution containing 46.8 nmol of Y354S and 6.84 nmol of LDH (based on a molecular weight of 140 kDa).The terminology enzyme@ITO/support is used throughout the manuscript and refers to enzyme adsorbed in the ITO layer deposited on a conductive support as indicated (Ti foil or pyrolytic graphite edge plane (PGE)).
Electrochemical measurements
A three-electrode system was used throughout with a Pt counter electrode, and a Ag/AgCl reference electrode, both housed in separate side arms of the glass electrochemical cell (the reference electrode compartment contained 0.1 M NaCl and buffer was used in the other two compartments). All the electrochemical measurements were made using a Metrohm Autolab potentiostat (μAUTOLAB, PGSTAT204) and Nova 2.1.6 software to control the potential and acquire data. Most of the experiments were conducted using cyclic voltammetry, apart from the large scale chronoamperometry experiment to drive the two-enzyme cascade, Y354S and lactate dehydrogenase (LDH) (Sigma-Aldrich) to synthesise L-lactate.The potentials (E) were converted to the standard hydrogen electrode (SHE) potentials using the equation: ESHE = EAg/AgCl + 0.21 V.37
Solutions of NADP+, NAD+ and NADPH (Melford) were prepared using the same buffer solution in the working electrode compartment for each specific experiment.
Author contributions
CFM conceptualized and directed the project, carried out experimental research, and directed MMD and AJK in the bulk of the experimental research. CFM wrote the paper with input from MMD; CFM and MMD made the figures.Conflicts of interest
There are no conflicts to declare.Acknowledgements
We thank Professor Fraser Armstrong and Dr Bhavin Siritanaratkul for helpful discussions, Josceline Dunne for help with some preliminary work, and Dr Lucian Pirvu for help with NMR. CFM thanks the University of Manchester for a Dame Kathleen Ollerenshaw (DKO) fellowship. MMD thanks the same DKO scheme at the University of Manchester for a funded PhD studentship.Notes and references
- F. A. Armstrong, B. Cheng, R. A. Herold, C. F. Megarity and B. Siritanaratkul, Chem. Rev., 2023, 123, 5421–5458 CrossRef CAS PubMed.
- B. Siritanaratkul, C. F. Megarity, T. G. Roberts, T. O. M. Samuels, M. Winkler, J. H. Warner, T. Happe and F. A. Armstrong, Chem. Sci., 2017, 8, 4579–4586 RSC.
- C. F. Megarity, B. Siritanaratkul, B. Cheng, G. Morello, L. Wan, A. J. Sills, R. S. Heath, N. J. Turner and F. A. Armstrong, ChemCatChem, 2019, 11, 5662–5670 CrossRef CAS.
- C. F. Megarity, B. Siritanaratkul, R. S. Heath, L. Wan, G. Morello, S. R. FitzPatrick, R. L. Booth, A. J. Sills, A. W. Robertson, J. H. Warner, N. J. Turner and F. A. Armstrong, Angew. Chem., Int. Ed., 2019, 58, 4948–4952 CrossRef CAS PubMed.
- L. Wan, C. F. Megarity, B. Siritanaratkul and F. A. Armstrong, Chem. Commun., 2018, 54, 972–975 RSC.
- G. Morello, B. Siritanaratkul, C. F. Megarity and F. A. Armstrong, ACS Catal., 2019, 9, 11255–11262 CrossRef CAS.
- L. Wan, R. S. Heath, B. Siritanaratkul, C. F. Megarity, A. J. Sills, M. P. Thompson, N. J. Turner and F. A. Armstrong, Green Chem., 2019, 21, 4958–4963 RSC.
- B. Cheng, L. Wan and F. A. Armstrong, ChemElectroChem, 2020, 7, 4672–4678 CrossRef CAS PubMed.
- L. Wan, R. S. Heath, C. F. Megarity, A. J. Sills, R. A. Herold, N. J. Turner and F. A. Armstrong, ACS Catal., 2021, 11, 6526–6533 CrossRef CAS.
- G. Morello, C. F. Megarity and F. A. Armstrong, Nat. Commun., 2021, 12, 340 CrossRef CAS PubMed.
- C. F. Megarity, T. R. I. Weald, R. S. Heath, N. J. Turner and F. A. Armstrong, ACS Catal., 2022, 12, 8811–8821 CrossRef CAS PubMed.
- B. Cheng, R. S. Heath, N. J. Turner, F. A. Armstrong and C. F. Megarity, Chem. Commun., 2022, 58, 11713–11716 RSC.
- R. A. Herold, R. Reinbold, C. F. Megarity, M. I. Abboud, C. J. Schofield and F. A. Armstrong, J. Phys. Chem. Lett., 2021, 12, 6095–6101 CrossRef CAS PubMed.
- R. A. Herold, R. Reinbold, C. J. Schofield and F. A. Armstrong, Proc. Natl. Acad. Sci. U. S. A., 2023, 120, e2214123120 CrossRef CAS PubMed.
- R. A. Herold, C. J. Schofield and F. A. Armstrong, Angew. Chem., Int. Ed., 2023, 62, e202309149 CrossRef CAS PubMed.
- L. Piubelli, A. Aliverti, A. K. Arakaki, N. Carrillo, E. A. Ceccarelli, P. A. Karplus and G. Zanetti, J. Biol. Chem., 2000, 275, 10472–10476 CrossRef CAS PubMed.
- J. A. Hermoso, T. Mayoral, M. Faro, C. Gómez-Moreno, J. Sanz-Aparicio and M. Medina, J. Mol. Biol., 2002, 319, 1133–1142 CrossRef CAS PubMed.
- J. Tejero, I. Pérez-Dorado, C. Maya, M. Martínez-Júlvez, J. Sanz-Aparicio, C. Gómez-Moreno, J. A. Hermoso and M. Medina, Biochemistry, 2005, 44, 13477–13490 CrossRef CAS PubMed.
- N. Carrillo and E. A. Ceccarelli, Eur. J. Biochem., 2003, 270, 1900–1915 CrossRef CAS PubMed.
- C. J. Batie and H. Kamin, J. Biol. Chem., 1986, 261, 11214–11223 CrossRef CAS PubMed.
- Z. Deng, A. Aliverti, G. Zanetti, A. K. Arakaki, J. Ottado, E. G. Orellano, N. B. Calcaterra, E. A. Ceccarelli, N. Carrillo and P. A. Karplus, Nat. Struct. Biol., 1999, 6, 847–853 CrossRef CAS PubMed.
- J. Tejero, M. Martínez-Júlvez, T. Mayoral, A. Luquita, J. Sanz-Aparicio, J. A. Hermoso, J. K. Hurley, G. Tollin, C. Gómez-Moreno and M. Medina, J. Biol. Chem., 2003, 278, 49203–49214 CrossRef CAS PubMed.
- I. Nogués, J. Tejero, J. K. Hurley, D. Paladini, S. Frago, G. Tollin, S. G. Mayhew, C. Gómez-Moreno, E. A. Ceccarelli, N. Carrillo and M. Medina, Biochemistry, 2004, 43, 6127–6137 CrossRef PubMed.
- M. Medina, A. Luquita, J. Tejero, J. Hermoso, T. Mayoral, J. Sanz-Aparicio, K. Grever and C. Gómez-Moreno, J. Biol. Chem., 2001, 276, 11902–11912 CrossRef CAS PubMed.
- J. R. Peregrina, B. Herguedas, J. A. Hermoso, M. Martínez-Júlvez and M. Medina, Biochemistry, 2009, 48, 3109–3119 CrossRef CAS PubMed.
- Y. V. S. N. Murthy and V. Massey, J. Biol. Chem., 1998, 273, 8975–8982 CrossRef CAS PubMed.
- L. J. Druhan and R. P. Swenson, Biochemistry, 1998, 37, 9668–9678 CrossRef CAS PubMed.
- J. D. Walsh and A.-F. Miller, J. Mol. Struct.: THEOCHEM, 2003, 623, 185–195 CrossRef CAS.
- L. H. Bradley and R. P. Swenson, Biochemistry, 2001, 40, 8686–8695 CrossRef CAS PubMed.
- Z. Zhou and R. P. Swenson, Biochemistry, 1996, 35, 15980–15988 CrossRef CAS PubMed.
- B. G. Galuzzi, A. Mirarchi, E. L. Viganò, L. De Gioia, C. Damiani and F. Arrigoni, J. Chem. Inf. Model., 2022, 62, 4748–4759 CrossRef CAS PubMed.
- Z. Zhou and R. P. Swenson, Biochemistry, 1995, 34, 3183–3192 CrossRef CAS PubMed.
- R. P. Swenson and G. D. Krey, Biochemistry, 1994, 33, 8505–8514 CrossRef CAS PubMed.
- M. L. Ludwig, K. A. Pattridge, A. L. Metzger, M. M. Dixon, M. Eren, Y. Feng and R. P. Swenson, Biochemistry, 1997, 36, 1259–1280 CrossRef CAS PubMed.
- M. Kasim and R. P. Swenson, Biochemistry, 2001, 40, 13548–13555 CrossRef CAS PubMed.
- B. J. Stockman, T. E. Richardson and R. P. Swenson, Biochemistry, 1994, 33, 15298–15308 CrossRef CAS PubMed.
- A. J. Bard and L. R. Faulkner, Electrochemical Methods: Fundamentals and Applications, Wiley, Chichester, 2nd edn, 1980 Search PubMed.
- C. C. Moser, M. M. Sheehan, N. M. Ennist, G. Kodali, C. Bialas, M. T. Englander, B. M. Discher and P. L. Dutton, in Methods in Enzymology, ed. V. L. Pecoraro, Academic Press, 2016, vol. 580, pp. 365–388 Search PubMed.
- M. J. Chalkley, S. I. Mann and W. F. DeGrado, Nat. Rev. Chem, 2022, 6, 31–50 CrossRef CAS PubMed.
- A. C. Mutter, A. M. Tyryshkin, I. J. Campbell, S. Poudel, G. N. Bennett, J. J. Silberg, V. Nanda and P. G. Falkowski, Proc. Natl. Acad. Sci. U. S. A., 2019, 116, 14557–14562 CrossRef CAS PubMed.
- E. Mathieu, A. E. Tolbert, K. J. Koebke, C. Tard, O. Iranzo, J. E. Penner-Hahn, C. Policar and V. Pecoraro, Chem.–Eur. J., 2020, 26, 249–258 CrossRef CAS PubMed.
- P. Hosseinzadeh and Y. Lu, Biochim. Biophys. Acta, Bioenerg., 2016, 1857, 557–581 CrossRef CAS PubMed.
- T. B. J. Pinter, K. J. Koebke and V. L. Pecoraro, Angew. Chem., Int. Ed., 2020, 59, 7678–7699 CrossRef CAS PubMed.
- B. M. Sattelle and M. J. Sutcliffe, J. Phys. Chem. A, 2008, 112, 13053–13057 CrossRef CAS PubMed.
- V. V. Ptushenko, D. A. Cherepanov, L. I. Krishtalik and A. Y. Semenov, Photosynth. Res., 2008, 97, 55–74 CrossRef CAS PubMed.
- L. Besra and M. Liu, Prog. Mater. Sci., 2007, 52, 1–61 CrossRef CAS.
Footnote |
| † Electronic supplementary information (ESI) available. See DOI: https://doi.org/10.1039/d4fd00020j |
| This journal is © The Royal Society of Chemistry 2024 |

