
Bioinspired molecule-functionalized Cu with high CO adsorption for efficient CO electroreduction to acetate†
Xuanzhao
Lu‡
a,
Baozhen
Yuan‡
a,
Yi
Liu
a,
Li-Xia
Liu
*b and
Jun-Jie
Zhu
 *a
*a
aState Key Laboratory of Analytical Chemistry for Life Science, School of Chemistry and Chemical Engineering, Nanjing University, Nanjing 210023, China. E-mail: jjzhu@nju.edu.cn
bJiangsu Key Laboratory of Green Synthetic Chemistry for Functional Materials, School of Chemistry and Materials Science, Jiangsu Normal University, Xuzhou 221116, China. E-mail: liulixia@jsnu.edu.cn
First published on 7th June 2024
Abstract
Electrochemical reduction of carbon dioxide (CO2) or carbon monoxide (CO) to valuable multi-carbon (C2+) products like acetate is a promising approach for a sustainable energy economy. However, it is still challenging to achieve high activity and selectivity for acetate production, especially in neutral electrolytes. Herein, a bioinspired hemin/Cu hybrid catalyst was developed to enhance the surface *CO coverage for highly efficient electroreduction of CO to acetate fuels. The hemin/Cu electrocatalyst exhibits a remarkable faradaic efficiency of 45.2% for CO-to-acetate electroreduction and a high acetate partial current density of 152.3 mA cm−2. Furthermore, the developed hybrid catalyst can operate stably at 200 mA cm−2 for 14.6 hours, producing concentrated acetate aqueous solutions (0.235 M, 2.1 wt%). The results of in situ Raman spectroscopy and theoretical calculations proved that the Fe–N4 structure of hemin could enhance the CO adsorption and enrich the local concentration of CO, thereby improving C–C coupling for acetate production. In addition, compared to the unmodified Cu catalysts, the Cu catalysts functionalized with cobalt phthalocyanine with a Co–N4 structure also exhibit improved acetate performance, proving the universality of this bioinspired molecule-enhanced strategy. This work paves a new way to designing bioinspired electrolysis systems for producing specific C2+ products from CO2 or CO electroreduction.
Introduction
The electrocatalytic reduction of CO2 holds significant promise for addressing environmental concerns, advancing the production of valuable chemicals and facilitating energy storage.1–3 Although progress has been made in CO2 electrolysis to produce high-value multi-carbon (C2+) chemicals like ethanol and acetate, these processes commonly suffer from issues of low selectivity and high overpotentials.4,5 To circumvent these challenges, a tandem system has been proposed wherein CO2 undergoes reduction in two sequential stages: first to CO and then further to C2+ products.6 Given that CO is widely accepted as a key reaction intermediate in CO2 reduction to C2+ compounds,7 leveraging CO directly as a feedstock to increase the near-surface CO concentration of catalysts could significantly enhance the C–C coupling.8 Moreover, some catalysts are highly selective and active for CO2-to-CO conversion.9–12 Owing to the balanced binding strength of CO,13 Cu has shown great promise for the electrochemical CO reduction reaction (CORR) to synthesize high-value C2+ products. In recent years, extensive strategies have been devoted to the design and development of Cu catalysts to enhance the activity and selectivity in the CORR, such as morphology tuning14 and alloying with other transition metals.15 Nevertheless, achieving selective generation of a specific C2+ product remains a challenge. In addition, to lower the overpotential and facilitate the C–C coupling, alkaline electrolytes have become the main choice for CORR.16 However, alkaline electrolytes with inherent corrosiveness can damage catalysts and electrode equipment, which is not conducive to practical applications.17,18 In contrast, neutral electrolytes can alleviate corrosion problems caused by alkaline electrolytes. Nevertheless, due to the reduced conductivity and pH, it is still hard to achieve high activity and selectivity for a single C2+ product in neutral media. Consequently, it is very necessary to design highly efficient Cu-based catalysts for producing a single C2+ product in neutral media.Acetate is an essential chemical feedstock, extensively applied in the production of solvents, polymers, medicines, and foods. The global acetate market, valued at USD 19 billion in 2022, is projected to soar to USD 29.98 billion by 2032.19 The prevailing method for industrial acetate production involves methanol carbonylation, albeit at the expense of high pressure and temperature, accompanied by substantial CO2 emissions.20 Recent strides have been made in renewable-energy-driven CO-to-acetate conversion.21 Previous studies underscore the pivotal role of CO surface coverage in dictating the product selectivity, with higher CO coverage favoring acetate formation. Bao et al. demonstrated a shift towards acetate production with rising CO pressure by employing pressure conditions.22 Similarly, Pang and colleagues utilized a pressurized flow reactor to bolster *CO coverage, achieving unprecedented acetate selectivity through a Cu-in-Ag dilute alloy catalyst.23 Additionally, Zheng et al. devised a CuPd intermetallic compound characterized by high density Cu–Pd pairs, augmenting the *CO surface coverage and substantially enhancing acetate yields.24 However, the operational complexities associated with elevated pressure or the inclusion of costly Pd element pose significant challenges in implementation.
Biomimicry has emerged as a powerful approach, not only for gaining insights into natural processes, but also for inspiring the design and synthesis of materials with diverse biomimetic functions.25–28 Within this fascinating field, bio-inspired catalysts have garnered significant attention across various reaction processes, like CO2 photoreduction29 and oxygen reduction.30 These catalysts draw inspiration from biological molecules and rely on understanding the properties and functions of these molecules. Among the various biomolecules, hemoglobin and myoglobin stand out as extensively studied proteins responsible for transporting and storing O2 in living organisms. Analysis reveals that the cofactor heme serves as the binding site for both O2 and CO in hemoglobin and myoglobin.31 Interestingly, the binding affinity of CO to heme proteins is significantly lower compared to that of porphyrin complexes.32 For instance, CO binds to free heme in solution at least 1500 times more strongly than O2, but within myoglobin, it binds only 30 times as strongly as O2.33 This characteristic makes heme an ideal CO adsorption enhancer. Notably, hemin (FeIII), an oxidation derivative of heme (FeII), exhibits enhanced stability under ambient conditions and is commercially available at a relatively low cost.28 Furthermore, it can be reduced to its lower valence state (heme) under negative potential,34 thus possessing superior CO adsorption ability. Consequently, the construction of hemin/Cu hybrid catalysts for CORR may increase the *CO coverage on Cu surfaces, thereby facilitating the CO-to-acetate pathway.
Recent studies have suggested that hemin-based molecules can increase the CO concentration on the Cu surface, thus enhancing the electrocatalytic CO2/CO performance. For example, Buonsanti et al. reported that tandem catalysts comprising iron porphyrin and Cu nanocubes (Cucub) exhibited a nearly 22-fold increase in ethylene selectivity and a 100 mV positive shift in the onset potential compared to the pristine Cucub.35 The raw material gas used in this work is CO2. In contrast, our approach aims to directly utilize CO feed for electrolysis, which can result in different catalytic performances. Specifically, significantly increasing the local CO concentration at the catalyst–electrolyte interface inherently favors the generation of C2+ products. In addition, Chang et al. reported that heterobimetallic molecular materials formed by face-to-face coordination of thiol-terminated metalloporphyrins to Cu electrodes, achieving up to 83% FE for CO reduction into C2 products, with the generation of up to 57% ethanol and 24% acetate and a current density of 1.34 mA cm−2.36 This research evaluated the catalytic performance under strong alkaline conditions, which, although beneficial for C–C coupling and inhibiting hydrogen evolution, can cause damage to the electrode and catalyst. Additionally, both investigations were performed in batch cell configurations, making it difficult to examine catalytic behavior at more practical current densities (>200 mA cm−2).
Herein, we present a novel bioinspired hemin/Cu hybrid as an efficient CORR electrocatalyst in the production of acetate under flow-cell and neutral electrolyte conditions. Structural analyses revealed the robust adsorption of hemin onto the surface of Cu nanoparticles (Cu NPs). This unique hemin/Cu electrocatalyst demonstrates remarkable performance in CORR-to-acetate conversion with an acetate faradaic efficiency (FE) of 45.2% and an acetate partial current density of 152.3 mA cm−2. Moreover, this catalyst exhibits 14.6 h of stable acetate electrosynthesis at 200 mA cm−2, enabling the direct collection of concentrated acetate (0.235 M; ∼2.1 wt%) from the circulated catholyte. Comprehensive in situ Raman characterization studies coupled with theoretical modeling shed light on the underlying mechanism, revealing that the Fe–N4 structure of hemin facilitates CO adsorption, thereby enhancing the CO concentration on the Cu surface. Furthermore, we demonstrate the efficacy of this bioinspired strategy by showcasing the outstanding acetate-generating performance of a Cu and cobalt phthalocyanine (CoPc) complex, featuring a Co–N4 structure. This study underscores the versatility and effectiveness of bioinspired catalyst design in advancing sustainable electrochemical processes.
Experimental
Reagents and materials
Sodium hydroxide and sodium borohydride were purchased from Sinopharm Chemical Reagent Co., Ltd (China). Cupric chloride (CuCl2·2H2O; analytical reagent), hemin (purity: 95%), protoporphyrin IX, isopropanol, acetonitrile, and potassium bicarbonate (≥99.99% trace metals basis, 99.7–100.5% dry basis) were obtained from Aladdin Company (Shanghai, China). Cobalt phthalocyanine was obtained from Shanghai Bide Pharmatech Co., Ltd. Tetrahydrofuran was purchased from Sa'en Chemical Technology (Shanghai) Co., Ltd. Nafion perfluorinated resin solution (5 wt%) was obtained from Shanghai Macklin Biochemical Technology Co., Ltd. The gas diffusion layer (Sigracet 39BB) was purchased from the Fuel Cell Store. Ar (99.999%), CO (99.999%), and all the standard gases were provided by Nanjing Tianze Gas CO., Ltd. All other reagents were of analytical grade and used without further purification. Ultrapure fresh water obtained from a Millipore water purification system (≥18 MΩ, Milli-Q, Millipore) was used throughout the entire experiment.Materials characterization
Transmission electron microscopy (TEM), high-resolution transmission electron microscopy (HRTEM), high-angle annular dark-field scanning transmission electron microscopy (HAADF-STEM), and energy dispersive X-ray spectroscopy (EDS) mapping were performed using a JEOL 2800 TEM (JEOL, Japan) with an accelerating voltage of 200 kV. X-ray diffraction (XRD) measurements were conducted on a Bruker D8 ADVANCE. Fourier transform infrared (FTIR) spectroscopy analysis was performed on a NICOLET NEXUS870. X-ray photoelectron spectroscopy (XPS) and Auger electron spectroscopy (AES) analyses were carried out on a PHI5000 Versa Probe. Ultraviolet–visible (UV-Vis) absorption spectra were obtained using a Metash UV-8000 spectrophotometer (Shanghai, China).Preparation of the catalyst and electrode
![[thin space (1/6-em)]](https://www.rsc.org/images/entities/char_2009.gif) :ACE = 3:2). Then, hemin solution was added to the Cu NPs and ultrasonicated for 7 minutes to obtain the target catalyst. The resulting hemin/Cu NP complex was then freeze-dried to yield a solid powder. Among them, the mass ratios of copper nanoparticles and hemin molecules are 1:1, 6:1, and 20:1, respectively.
:ACE = 3:2). Then, hemin solution was added to the Cu NPs and ultrasonicated for 7 minutes to obtain the target catalyst. The resulting hemin/Cu NP complex was then freeze-dried to yield a solid powder. Among them, the mass ratios of copper nanoparticles and hemin molecules are 1:1, 6:1, and 20:1, respectively.
Electrochemical measurements
Electrocatalytic measurements were conducted using a three-electrode system controlled by an electrochemical station (Corrtest CS350H). The setup included an electrochemical flow cell consisting of a gas chamber, a cathodic chamber, and an anodic chamber. Carbon paper with a microporous layer (Sigracet 39BB, Fuel Cell Store) functioned as the gas diffusion layer, supporting the catalyst, collecting the current, and facilitating gas access to the catalyst surface. For the electrodes, an Ag/AgCl (3 M KCl) electrode was used as the reference electrode, while Ni foam was utilized as the counter electrode. An anion exchange membrane (Fumasep FAA-3–50) was used to separate the anodic and cathodic chambers. The electrolyte, comprising 1 M KHCO3, was circulated using peristaltic pumps (Chuangrui, BT100M/YZ1515X). The catholyte flow rate was maintained at approximately 1 mL min−1, while the anolyte flow rate was held at approximately 5.0 mL min−1. CO gas flow through the gas chamber was regulated using a mass flow controller (Alicat). All potentials were converted to the reversible hydrogen electrode (RHE) reference scale using the formula: Evs. RHE = Evs. Ag/AgCl + EθAg/AgCl + 0.059 × pH − I × Ru × 90%, with the pH values of electrolytes determined using a METTLER TOLEDO FiveEasy Plus. The solution resistance (Ru) was determined by potentiostatic electrochemical impedance spectroscopy.Analysis of CO reduction products
Gas-phase products were analyzed by gas chromatography (GC, Agilent 7890B). Nitrogen (99.999%) was employed as the carrier gas. Quantification of hydrogen was achieved using a thermal conductivity detector, while other alkane species such as methane and ethylene were identified using a flame ionization detector. The FE of the gas products was calculated as follows:| FEgas (%) = (x × V × Z × F)/j × 100 |
In this equation, x refers to the mole fraction of the product, V denotes the total molar flow rate of gas, Z is the number of electrons needed to produce one molecule of product, F represents Faraday's constant, and j signifies the total current.
Liquid products were quantified using nuclear magnetic resonance (NMR) spectroscopy (Bruker Avance DRX 400 MHz). Specifically, the electrolyzed catholyte was diluted (500 μL) and then mixed with 100 μL of internal standard solution (dimethyl sulfoxide in D2O with a volume ratio of 25 ppm). The 1D 1H spectrum was obtained by using a water suppression method. The FE of the liquid products was determined by comparing the total charge (Q) passed through the sample, measured in coulombs, with the total amount of liquid products generated, denoted as n (moles). The Q calculation was based on the equation Q = j × t, where j (amperes) represents the total reduction current and t (s) represents the duration time of the constant reduction current. The FE of liquid products can be determined using the following formula:
| FEliquid (%) = (n × Z × F)/(j × t) × 100 |
In this equation, Z represents the number of electrons needed to produce one molecule of product and F represents Faraday's constant.
In situ Raman testing
The setup for in situ Raman testing involved using a three-electrode electrochemical cell equipped with a quartz window provided by GaossUnion (Tianjin) Photoelectric Technology Company. Graphite and Ag/AgCl in 3 M KCl solution were used as the counter and reference electrodes, respectively. To prevent cross-contamination, a membrane separated the counter electrode from the working electrode. Electrochemical tests were carried out using a CHI 760E electrochemical workstation (Chenhua). In situ Raman measurements were performed using a Renishaw inVia-Reflex Raman microscope system from the UK. The sample was excited using a 785 nm Helium–neon laser, and spectra were obtained using a ×50 working objective lens.DFT calculations
Structural computations of all molecules were performed using the b3lyp37 density functional method with the 6-31G(d,p)38 basis set for C, N, O, and H elements and the LANL2DZ39 pseudopotential basis set for the Fe element. The analysis and plotting of IGMH results were performed using Multiwfn software.40Results and discussion
Catalyst synthesis and characterization
The Cu NPs were synthesized by a simple NaBH4 reduction method. The structure of the synthesized Cu was validated by the powder XRD analysis. As shown in Fig. S1,† the catalyst exhibited prominent diffractions at 43.3°, 50.4°, and 74.1°, corresponding to the (111), (200), and (220) planes of cubic Cu (JCPDS 04-0836).41 Additionally, the other peaks were identified as Cu2O (JCPDS 05-0667), evidenced by obvious peaks at 36.4°, 42.3°, 61.3°, and 73.5°. The formation of Cu2O was attributed to exposure to air during washing, freeze-drying, and sample preparation. The TEM image revealed that the Cu NPs presented an agglomerated form with particle sizes ranging approximately from 50 to 200 nm (Fig. 1a). The HRTEM image (Fig. 1b and S2a†) displayed an inter-planar spacing of 0.21 nm, assigned to the (111) planes of Cu. In addition, the lattice spacing near the surface of the particles was 0.30 nm (Fig. S2b†), corresponding to the (110) plane of Cu2O. These findings are consistent with the XRD test results that Cu and Cu2O coexist. Besides, the HRTEM results suggested that the particles likely possessed a structure of metallic Cu covered by oxidized Cu2O. The reason is that the surface of the synthesized Cu NPs first came into contact with air and then was oxidized.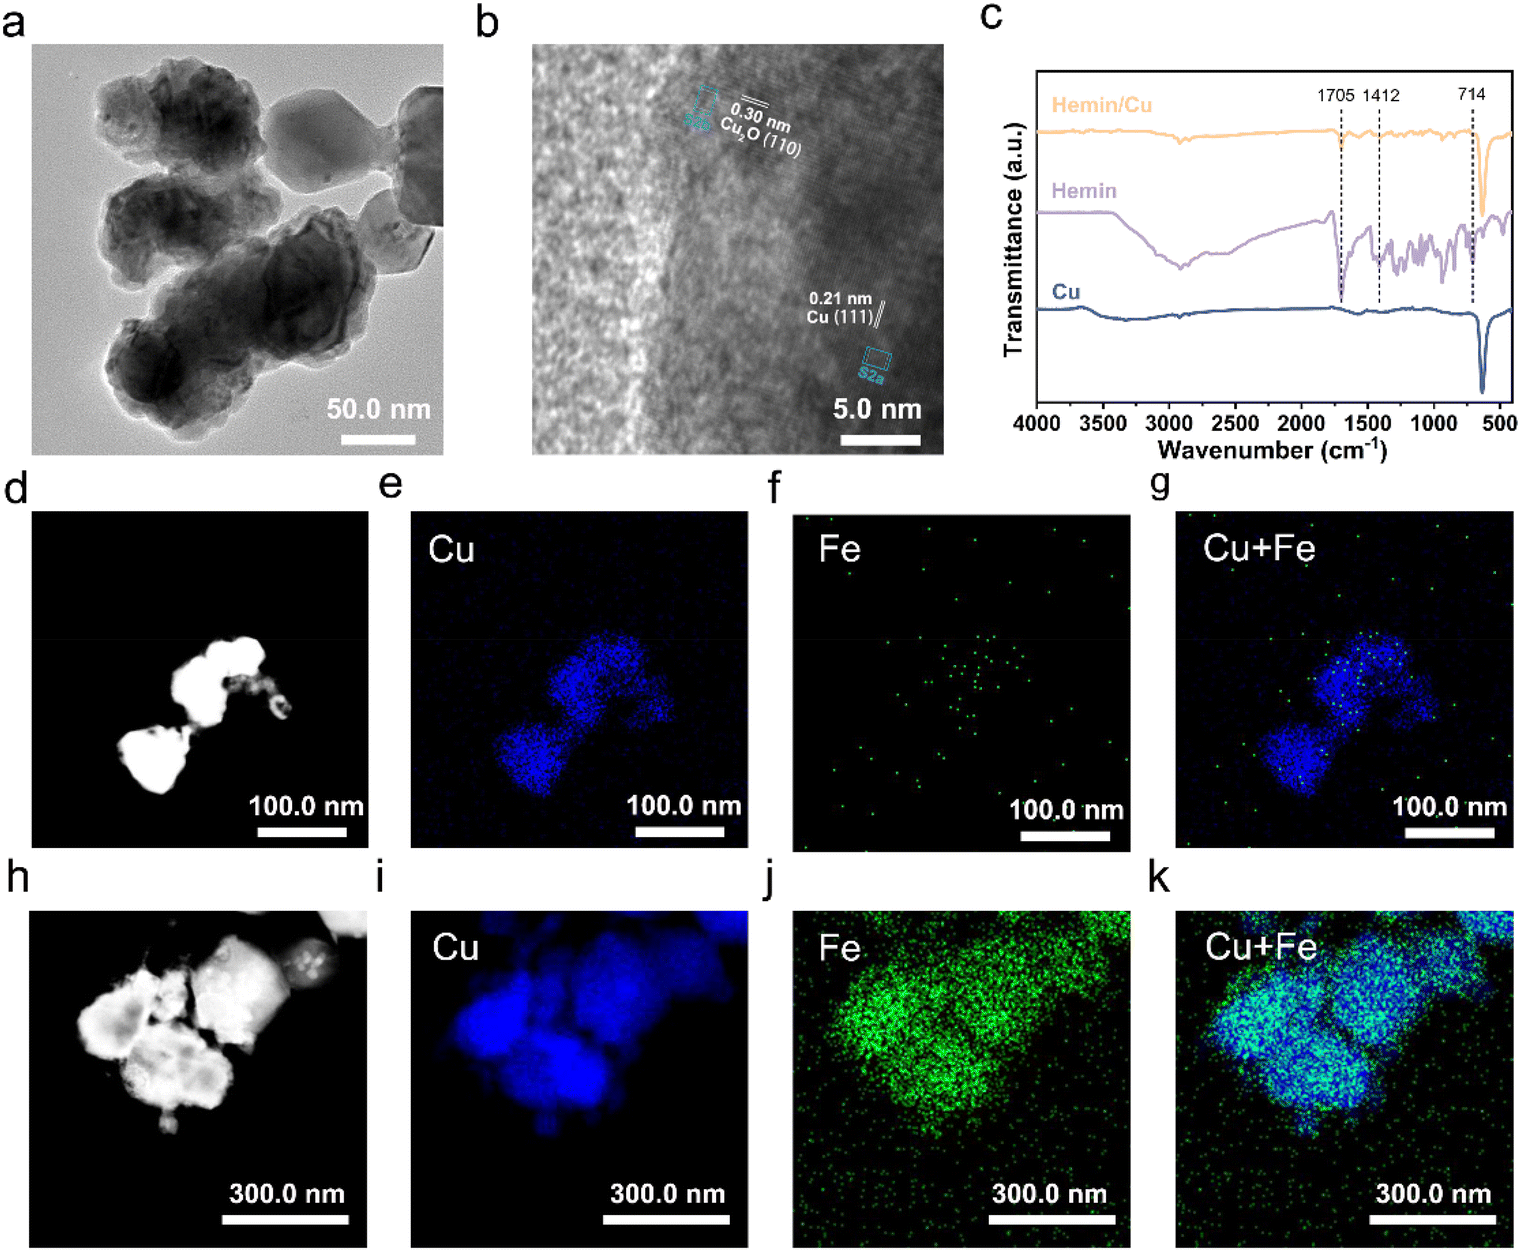 | ||
| Fig. 1 Characterization of the electrocatalysts. (a) TEM and (b) HRTEM images of Cu NPs. (c) FTIR spectra of the as-synthesized Cu, hemin, and hemin/Cu-6. HAADF-STEM images and the corresponding EDS elemental maps of (d–g) Cu NPs and (h–k) hemin/Cu-6. | ||
The hemin/Cu catalyst was obtained by blending the hemin molecules with the Cu NPs with the assistance of sonication, denoted as hemin/Cu–X (where X represents the mass ratio of Cu NPs to hemin). FTIR was used to characterize the resulting catalysts (Fig. 1c). The characteristic peaks of hemin (including C–H vibrations at ∼714 cm−1, C![[double bond, length as m-dash]](https://www.rsc.org/images/entities/char_e001.gif) O at ∼1705 cm−1, and C–OH at ∼1412 cm−1) were evident in the hemin/Cu sample,28,42 proving that the hemin is strongly adsorbed on the Cu surface. Additionally, we characterized the catalysts using HAADF-STEM coupled with EDS mapping. For the pure Cu NP catalyst (Fig. 1d–g and S3†), only the Cu signal was observed. In contrast, in the case of the hemin/Cu catalyst, the Cu and Fe signals were co-localized on the sample (Fig. 1h–k). The EDS spectrum indicated that the Fe/Cu metal mass ratio is 1/68.6 (Fig. S4†), which is close to the theoretical loading of 1/61.6 (calculated as pure Cu) and 1/54.7 (calculated as pure Cu2O). These results confirm the successful preparation of hemin/Cu hybrid catalysts.
O at ∼1705 cm−1, and C–OH at ∼1412 cm−1) were evident in the hemin/Cu sample,28,42 proving that the hemin is strongly adsorbed on the Cu surface. Additionally, we characterized the catalysts using HAADF-STEM coupled with EDS mapping. For the pure Cu NP catalyst (Fig. 1d–g and S3†), only the Cu signal was observed. In contrast, in the case of the hemin/Cu catalyst, the Cu and Fe signals were co-localized on the sample (Fig. 1h–k). The EDS spectrum indicated that the Fe/Cu metal mass ratio is 1/68.6 (Fig. S4†), which is close to the theoretical loading of 1/61.6 (calculated as pure Cu) and 1/54.7 (calculated as pure Cu2O). These results confirm the successful preparation of hemin/Cu hybrid catalysts.
Furthermore, XPS spectroscopy was employed to determine the chemical composition and ascertain any potential electron transfer phenomena between hemin and Cu NPs. As shown in Fig. S5a,† the broad Cu 2p peaks have been deconvoluted into two peaks corresponding to Cu+ or Cu0 and Cu2+, respectively.43 It is challenging to resolve Cu+ and Cu0 due to their binding energies differing by only 0.1 eV.43 The satellite peaks of Cu 2p3/2 and Cu 2p1/2 supported the presence of Cu2+.44 Moreover, Cu L3M4,5M4,5 AES spectra revealed that the Cu NPs and hemin/Cu-6 catalysts consisted of Cu0, Cu+, and Cu2+ (Fig. S5b†).45–47 These results indicate that partial oxidation of Cu has occurred, which is consistent with the XRD results. Overall, the Cu 2p and L3M4,5M4,5 Auger spectra for hemin/Cu-6 show no peak shift and significant variation compared to Cu NPs alone, indicating no change in the oxidation state of Cu before and after forming the hybrid with hemin. Additionally, there is no observed peak shift at around 56.0 eV between pure hemin and hemin/Cu-6 (Fig. S5c†), indicating that no changes in the valence state of iron. Taken together, the lack of obvious peak shifts in both the Cu and Fe regions suggests no changes in the surface composition and/or charge transfer effects between hemin and Cu NPs. Therefore, there is no chemical bond or chemical interaction between them. Given the hydrophobic nature of the hemin molecules and Cu NPs, we believe that the interactions between Cu NPs and hemin are primarily hydrophobic interactions.34,48,49
CO electroreduction performance
Having completed the characterization of the catalysts, we proceeded to evaluate the performance of hemin/Cu hybrids with different mass ratios and pure Cu NPs towards the CORR. This evaluation was conducted in a three-compartment flow cell system (Fig. S6†) utilizing a 1 M aqueous KHCO3 solution (pH = 8.4) as the supporting electrolyte. Gas-phase and solution-phase products were quantified using online GC and NMR spectroscopy, respectively.It was observed that the pristine Cu NPs exhibited notable FEs for C2+ products (ethylene, acetate, ethanol, and n-propanol), exceeding 80% during the CORR. However, they failed to achieve high single-product selectivity (Fig. 2a). The maximum FE for acetate was only 28.8% at 350 mA cm−2. In contrast, the presence of hemin significantly enhanced the acetate FE in the hemin/Cu hybrid catalysts. For instance, hemin/Cu-20 reached a maximum acetate FE of 41.9% at 350 mA cm−2 (Fig. 2b). As the hemin content increased, hemin/Cu-6 exhibited enhanced electrochemical performance in acetate production (Fig. 2c). Specifically, hemin/Cu-6 consistently achieved an acetate FE exceeding 40% across the current density range from 200 mA cm−2 to 350 mA cm−2. At 300 mA cm−2, a remarkable 45.2% FE toward acetate was achieved, while the total FE for other liquid products (ethanol and n-propanol) remained below 10%. The acetate FE of hemin/Cu-6 is higher or at least comparable to those of recently reported Cu-based electrocatalysts, especially in neutral electrolytes (Table S1†). However, for the hemin-rich catalyst (hemin/Cu-1), the hydrogen evolution reaction (HER) became dominant in the electrocatalytic process, occupying over 28% FE throughout the investigated current density region (Fig. 2d). This could be attributed to an excessive number of hemin molecules covering the Cu sites. Acetate was still detected as the primary product of CO reduction, albeit with lower FEs compared to hemin/Cu-6, ranging from approximately 20 to 35%. Notably, pure hemin exhibited no activity for CO reduction, with only H2 and minimal CH4 (<2%) being produced under the same reaction conditions (Fig. S7†). Moreover, only H2 could be detected under the argon atmosphere over hemin/Cu-6 (Fig. S8†), indicating that the carbon source for the products was CO.
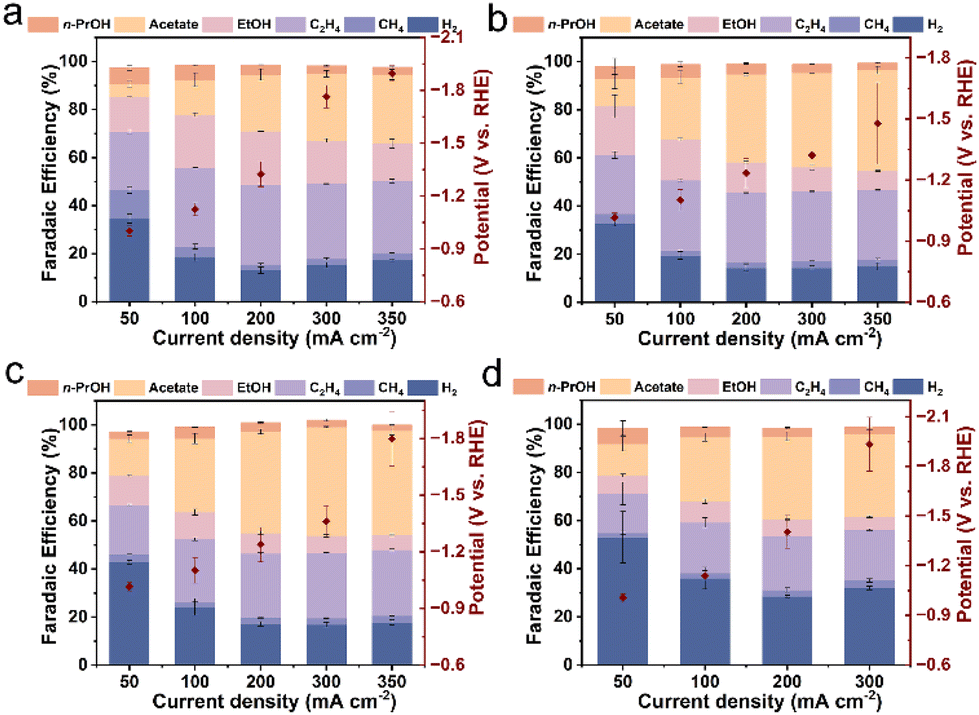 | ||
| Fig. 2 CO reduction performances of Cu NPs and hemin/Cu with different mass ratios in a flow cell system. FEs and potentials measured for the electroreduction of CO on (a) Cu NPs, (b) hemin/Cu-20, (c) hemin/Cu-6, and (d) hemin/Cu-1. | ||
To delve deeper into the roles contributing to the enhanced acetate selectivity of hemin, we conducted a comparative analysis of the electrocatalytic performance. We calculated the ratio of acetate FE to C2+ product FE (Fig. 3a). Across the entire range of current densities, the hemin/Cu-6 electrode consistently favored acetate production over Cu NPs. Specifically, at 300 mA cm−2, the ratio of the acetate-to-C2+ products increased from 0.35 for Cu NPs to 0.55 for hemin/Cu-6, while the overall selectivity for C2+ products only experienced a 1.03-fold increase. This shift indicates a transition from the production of ethylene, ethanol, and n-propanol towards acetate. Moreover, the partial current density (obtained by multiplying the current density by the FE) of acetate over hemin/Cu-6 could reach 152.3 mA cm−2, which is about 1.5 times higher than that of Cu NPs (Fig. 3b). To reveal the intrinsic activity towards acetate of the catalysts, we determined the ECSAs of the catalysts and used them to normalize the current density (Fig. S9†). Compared to Cu NPs, hemin/Cu-6 exhibited a significantly higher ECSA-normalized acetate partial current density (Fig. S10†).
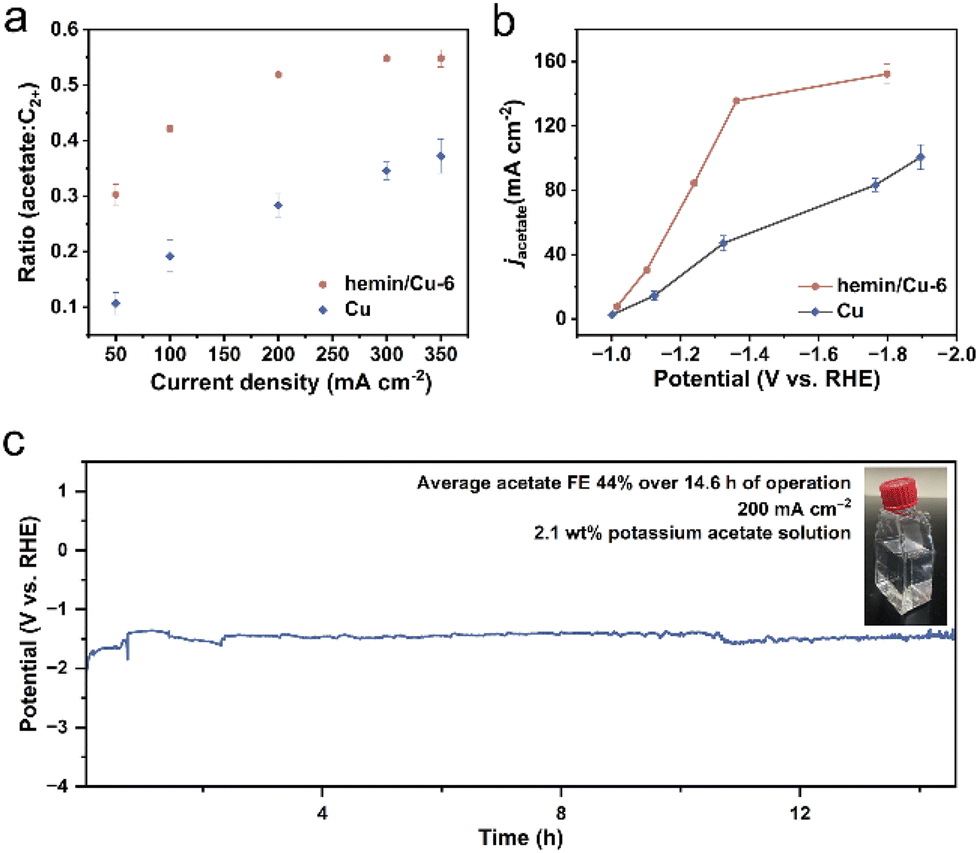 | ||
| Fig. 3 Acetate production performance of hemin/Cu-6 and Cu NPs. (a) The ratio of acetate to C2+ products (ethylene, ethanol, acetate, and n-propanol) for the hemin/Cu-6 and Cu catalysts at different applied currents. (b) Partial current density of acetate for the hemin/Cu-6 and Cu catalysts at different applied potentials. (c) Chronopotentiometry stability test of hemin/Cu-6 using a flow cell at 200 mA cm−2 in 1 M KHCO3 with a product concentration of 2.1 wt% (0.235 M). | ||
A prolonged electrolysis test was conducted at a current density of 200 mA cm−2 for over 14.6 h in 1 M KHCO3 solution (Fig. 3c). The findings revealed a stable potential in CO electroreduction, with the average acetate selectivity remaining at 44% throughout the duration of the test. Achieving a concentrated product stream is crucial for minimizing expenses associated with product separation and electrolyte recovery.50–52 During the stability phase, circulating a 1 M KHCO3 solution as the catholyte yielded a potassium acetate solution of 0.235 M (∼2.1 wt%), surpassing the 0.04 M of Cu nanosheets reported by Jiao and colleagues.2 Subsequent analysis of the post-reaction catalysts was performed through TEM and EDS-based elemental mapping. The TEM image revealed that the Cu NPs in the hybrid maintained the original size (Fig. S11†). Moreover, the EDS mapping and spectrum demonstrated that the Fe/Cu metal mass ratio is 1/74.0, which is slightly smaller than the Fe/Cu ratio before the reaction (1/68.6) (Fig. S12 and S13†), indicating most of the hemins remained on the Cu surface after CO reduction. Furthermore, UV-vis spectroscopy was employed to check the characteristic peaks of dissolved hemin from both fresh and used hemin/Cu-6-modified electrodes. As shown in Fig. S14,† the solution from the used electrodes exhibited hemin characteristic peaks similar to those from the fresh electrodes, further indicating that hemin attached to the Cu surface during the CORR. This result also implies that no structural damage occurred in the hemin molecules during electrolysis.
Mechanistic investigations and verification of universality
To gain molecular-level insights into the cooperative role of the hemin to Cu NPs, we investigated the surface intermediates using in situ Raman spectroscopy. Raman spectra were collected on both hemin/Cu-6 and Cu electrodes across a range of applied potentials. Two characteristic bands at around 375 and 627 cm−1 (Fig. 4a and b), associated with Cu oxide phases,53,54 were present before the reaction and disappeared upon the application of potential over both Cu NPs and hemin/Cu-6, indicating the reduction of surface cuprous oxide.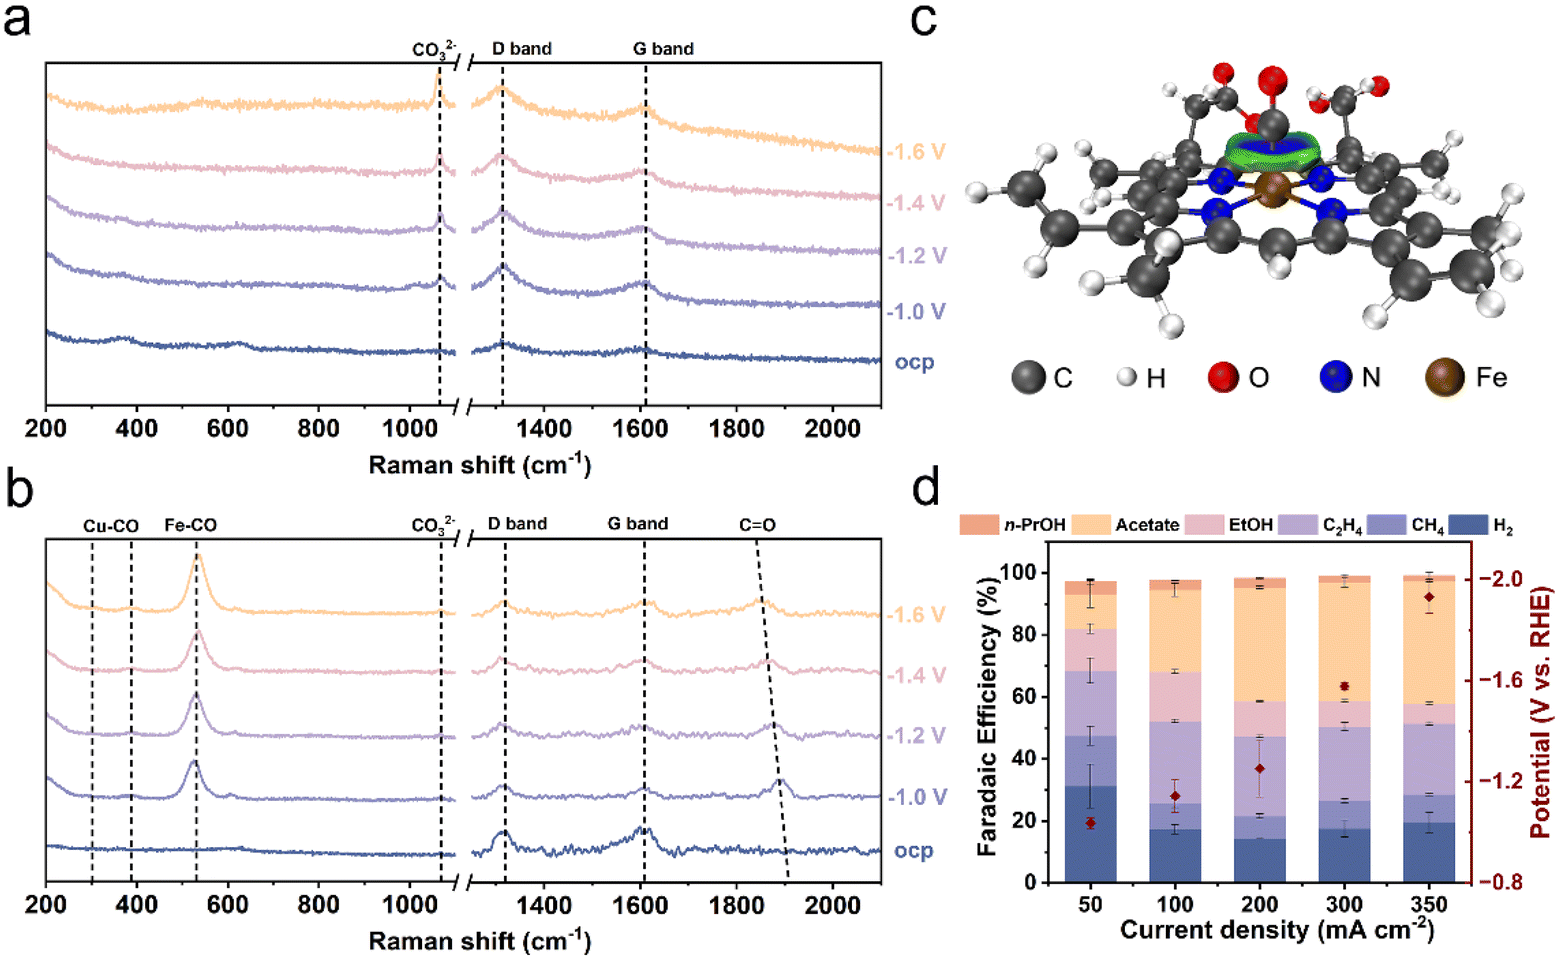 | ||
| Fig. 4 Mechanistic investigations and verification of universality. Operando Raman spectra of (a) the Cu NP electrode and (b) the hemin/Cu-6 electrode during the CORR at different applied potentials vs. RHE in 1 M KHCO3. (c) IGMH analysis of the optimized geometries of heme and the CO complex (isosurface = 0.04 a.u., visualized by VMD and the Multiwfn program). (d) Product distribution at different current densities over CoPc/Cu NPs-6. | ||
On bare Cu electrodes, a peak at 1070 cm−1 attributed to the adsorbed carbonate species (CO32−) was observed (Fig. 4a).55 Additionally, two bands at around 1315 cm−1 and 1609 cm−1 corresponded to the characteristic bands (D and G peaks) of carbon paper.54 On hemin/Cu-6 electrodes, bands were identified at 308, 389, and 1864 cm−1 (Fig. 4b), corresponding to CO frustrated rotation, Cu–C stretching, and CO stretching modes on bridge sites.53,56 This observation is consistent with the notion that the CO concentration is enhanced on the hemin/Cu electrode. Furthermore, an emerging band at 535 cm−1 was observed, attributed to the Fe–CO bending vibration resulting from the interaction between CO and Fe in the iron porphyrin segment.34
We further conducted control experiments to investigate whether the protoporphyrin framework itself influenced acetate selectivity. We found no enhancement of acetate selectivity for the protoporphyrin/Cu electrode (Fig. S15†). These observations support the primary role of the hemin complex as a CO adsorption enhancer.
To elucidate the enrichment effect of heme on CO molecules at the molecular level, we employed DFT calculations to determine the optimized geometries of the heme–CO complex (Fig. S16†).57 DFT calculations reveal that heme exhibited moderate binding affinities for CO with a binding energy (Eb) of −1.90 eV. The optimized structures of heme–CO complexes indicate that the CO molecule preferentially binds to the FeII atoms of the heme via the Fe–C coordination bond (mean dFe–C = 1.73 Å). Furthermore, the independent gradient model based on Hirshfeld partition (IGMH) analysis58 indicated a significant coordination interaction between the CO molecules and FeII (Fig. 4c), thus confirming that the protoporphyrin framework itself does not play the primary role in promoting CO-to-acetate conversion.
To investigate the widespread applicability of locally high concentrations of CO through molecular adsorption in enhancing acetate selectivity, we synthesized hybrid catalysts of CoPc and Cu NPs (CoPc/Cu NPs–X; X represents the mass ratio of Cu NPs to CoPc). CoPc shares a metal–N4 structure similar to hemin and previous studies suggest that it exhibits adsorption ability towards CO.59 The characteristic IR peaks of CoPc were evident in the CoPc/Cu catalyst (Fig. S17†), confirming the successful catalyst preparation. Electrochemical CO reduction performance was also assessed using a three-compartment flow-cell electrolyzer. The product distribution trend was similar between CoPc/Cu NPs and hemin/Cu NPs, with acetate being the main product (Fig. 4d and S18†). Among the CoPc/Cu NPs hybrids, CoPc/Cu NPs-6 displayed the most favorable acetate production performance, achieving the highest FE of 39.3% at 300 mA cm−2. This finding aligns with the notion that CO adsorbed by molecules can enhance acetate selectivity. The array of molecular enhancers demonstrated in this study underscores the broader applicability of the homogeneous–heterogeneous cooperative strategy in reprogramming the CORR.
Conclusion
In summary, this study demonstrates a novel bioinspired approach leveraging the unique properties of hemin to enhance CO adsorption on Cu surfaces, thereby significantly bolstering acetate formation. The hemin/Cu catalyst exhibits exceptional performance, achieving an FE of 45.2% for CO-to-acetate electroreduction and a high acetate partial current density of 152.3 mA cm−2. Importantly, the catalyst demonstrates sustained stability over 14.6 hours, yielding a concentrated acetate solution (0.235 M; ∼2.1 wt%). Through a combination of in situ Raman spectroscopy measurements, electrochemical experiments, and DFT calculations, these results reveal that the Fe–N4 structure of hemin adsorbs CO, enhancing the *CO coverage on the Cu surface, thereby rationalizing the improved acetate production. Moreover, by extending the bioinspired approach to a CoPc/Cu hybrid catalyst, the study underscores the universality of the strategy, confirming its effectiveness in advancing sustainable electrochemical processes. Overall, this work provides new insights for designing efficient electrolysis systems capable of producing high-value single C2+ products under neutral conditions, thus addressing critical challenges in CO utilization and contributing to the advancement of renewable energy technologies.Author contributions
X. L. and B. Y. contributed equally to this work. X. L. conceived the idea and designed the experiments. B. Y. and X. L. performed experiments and collected data. X. L. and B. Y. analyzed the data and created figures. Y. L. and X. L. performed and analyzed the DFT calculation. L.-X. L. discussed the data and provided suggestions. J.-J. Z. supervised the whole project. All authors discussed the results and assisted with manuscript preparation.Conflicts of interest
There are no conflicts to declare.Acknowledgements
The authors greatly appreciate the financial support from the National Natural Science Foundation of China (No. 22174061) and the Shandong Provincial Natural Science Foundation (No. ZR2020ZD37).References
- J. Gu, C.-S. Hsu, L. Bai, H. M. Chen and X. Hu, Science, 2019, 364, 1091–1094 CrossRef CAS PubMed.
- W. Luc, X. Fu, J. Shi, J.-J. Lv, M. Jouny, B. H. Ko, Y. Xu, Q. Tu, X. Hu, J. Wu, Q. Yue, Y. Liu, F. Jiao and Y. Kang, Nat. Catal., 2019, 2, 423–430 CrossRef CAS.
- Z. Li, Y. Lv, H. Huang, Z.-J. Li, T. Li, L. Zhang and J.-Q. Wang, Dalton Trans., 2024, 53, 7067–7072 RSC.
- G. Wang, J. Chen, Y. Ding, P. Cai, L. Yi, Y. Li, C. Tu, Y. Hou, Z. Wen and L. Dai, Chem. Soc. Rev., 2021, 50, 4993–5061 RSC.
- C. Chen, X. Yan, S. Liu, Y. Wu, Q. Wan, X. Sun, Q. Zhu, H. Liu, J. Ma, L. Zheng, H. Wu and B. Han, Angew. Chem., Int. Ed., 2020, 59, 16459–16464 CrossRef CAS PubMed.
- D. S. Ripatti, T. R. Veltman and M. W. Kanan, Joule, 2019, 3, 240–256 CrossRef CAS.
- W. Ma, X. He, W. Wang, S. Xie, Q. Zhang and Y. Wang, Chem. Soc. Rev., 2021, 50, 12897–12914 RSC.
- J. Gao, H. Zhang, X. Guo, J. Luo, S. M. Zakeeruddin, D. Ren and M. Grätzel, J. Am. Chem. Soc., 2019, 141, 18704–18714 CrossRef CAS PubMed.
- W. Zhu, R. Michalsky, Ö. Metin, H. Lv, S. Guo, C. J. Wright, X. Sun, A. A. Peterson and S. Sun, J. Am. Chem. Soc., 2013, 135, 16833–16836 CrossRef CAS PubMed.
- M. C. O. Monteiro, M. F. Philips, K. J. P. Schouten and M. T. M. Koper, Nat. Commun., 2021, 12, 4943 CrossRef CAS PubMed.
- J. Rosen, G. S. Hutchings, Q. Lu, S. Rivera, Y. Zhou, D. G. Vlachos and F. Jiao, ACS Catal., 2015, 5, 4293–4299 CrossRef CAS.
- M. Pauly, E. White, M. Deegbey, E. A. Fosu, L. Keller, S. McGuigan, G. Dianat, E. Gabilondo, J. C. Wong, C. G. E. Murphey, B. Shang, H. Wang, J. F. Cahoon, R. Sampaio, Y. Kanai, G. Parsons, E. Jakubikova and P. A. Maggard, Dalton Trans., 2024, 53, 6779–6790 RSC.
- X. Wang, J. F. de Araújo, W. Ju, A. Bagger, H. Schmies, S. Kühl, J. Rossmeisl and P. Strasser, Nat. Nanotechnol., 2019, 14, 1063–1070 CrossRef CAS PubMed.
- W. Rong, H. Zou, W. Zang, S. Xi, S. Wei, B. Long, J. Hu, Y. Ji and L. Duan, Angew. Chem., Int. Ed., 2021, 60, 466–472 CrossRef CAS PubMed.
- X. Wang, P. Ou, A. Ozden, S.-F. Hung, J. Tam, C. M. Gabardo, J. Y. Howe, J. Sisler, K. Bertens, F. P. García de Arquer, R. K. Miao, C. P. O'Brien, Z. Wang, J. Abed, A. S. Rasouli, M. Sun, A. H. Ip, D. Sinton and E. H. Sargent, Nat. Energy, 2022, 7, 170–176 CrossRef CAS.
- J.-J. Lv, R. Yin, L. Zhou, J. Li, R. Kikas, T. Xu, Z.-J. Wang, H. Jin, X. Wang and S. Wang, Angew. Chem., Int. Ed., 2022, 61, e202207252 CrossRef CAS PubMed.
- C.-T. Dinh, T. Burdyny, M. G. Kibria, A. Seifitokaldani, C. M. Gabardo, F. P. García de Arquer, A. Kiani, J. P. Edwards, P. De Luna, O. S. Bushuyev, C. Zou, R. Quintero-Bermudez, Y. Pang, D. Sinton and E. H. Sargent, Science, 2018, 360, 783–787 CrossRef CAS PubMed.
- X. Zhang, J. Li, Y.-Y. Li, Y. Jung, Y. Kuang, G. Zhu, Y. Liang and H. Dai, J. Am. Chem. Soc., 2021, 143, 3245–3255 CrossRef CAS PubMed.
- R. a. Data, Acetic Acid Market By Product Type (Synthetic, Bio-based), By Application (Vinyl Acetate Monomer, Purified Terephthalic Acid, Acetate Esters, Others), By Region Forecast to 2032, https://www.reportsanddata.com/report-detail/acetic-acid-market, 2023.
- A. C. Dimian and A. A. Kiss, Chem. Eng. Res. Des., 2020, 159, 1–12 CrossRef CAS.
- M. Jouny, G. S. Hutchings and F. Jiao, Nat. Catal., 2019, 2, 1062–1070 CrossRef CAS.
- P. Wei, D. Gao, T. Liu, H. Li, J. Sang, C. Wang, R. Cai, G. Wang and X. Bao, Nat. Nanotechnol., 2023, 18, 299–306 CrossRef CAS PubMed.
- J. Jin, J. Wicks, Q. Min, J. Li, Y. Hu, J. Ma, Y. Wang, Z. Jiang, Y. Xu, R. Lu, G. Si, P. Papangelakis, M. Shakouri, Q. Xiao, P. Ou, X. Wang, Z. Chen, W. Zhang, K. Yu, J. Song, X. Jiang, P. Qiu, Y. Lou, D. Wu, Y. Mao, A. Ozden, C. Wang, B. Y. Xia, X. Hu, V. P. Dravid, Y.-M. Yiu, T.-K. Sham, Z. Wang, D. Sinton, L. Mai, E. H. Sargent and Y. Pang, Nature, 2023, 617, 724–729 CrossRef CAS PubMed.
- Y. Ji, Z. Chen, R. Wei, C. Yang, Y. Wang, J. Xu, H. Zhang, A. Guan, J. Chen, T.-K. Sham, J. Luo, Y. Yang, X. Xu and G. Zheng, Nat. Catal., 2022, 5, 251–258 CrossRef CAS.
- R. A. Decréau, J. P. Collman and A. Hosseini, Chem. Soc. Rev., 2010, 39, 1291–1301 RSC.
- V. Artero, Nat. Energy, 2017, 2, 17131 CrossRef CAS.
- J.-W. DuanMu and M.-R. Gao, Nano Res., 2024, 17, 515–533 CrossRef.
- L. Fan, J. Dai, Z. Huang, J. Xiao, Q. Li, J. Huang, S.-F. Zhou and G. Zhan, iScience, 2020, 23, 101852 CrossRef CAS PubMed.
- S.-G. Han, M. Zhang, Z.-H. Fu, L. Zheng, D.-D. Ma, X.-T. Wu and Q.-L. Zhu, Adv. Mater., 2022, 34, 2202830 CrossRef CAS PubMed.
- L. Xie, X.-P. Zhang, B. Zhao, P. Li, J. Qi, X. Guo, B. Wang, H. Lei, W. Zhang, U.-P. Apfel and R. Cao, Angew. Chem., Int. Ed., 2021, 60, 7576–7581 CrossRef CAS PubMed.
- T. Shimizu, D. Huang, F. Yan, M. Stranava, M. Bartosova, V. Fojtíková and M. Martínková, Chem. Rev., 2015, 115, 6491–6533 CrossRef CAS PubMed.
- G. S. Kachalova, A. N. Popov and H. D. Bartunik, Science, 1999, 284, 473–476 CrossRef CAS PubMed.
- M. Lim, T. A. Jackson and P. A. Anfinrud, JBIC, J. Biol. Inorg. Chem., 1997, 2, 531–536 CrossRef CAS.
- F. Li, Y. C. Li, Z. Wang, J. Li, D.-H. Nam, Y. Lum, M. Luo, X. Wang, A. Ozden, S.-F. Hung, B. Chen, Y. Wang, J. Wicks, Y. Xu, Y. Li, C. M. Gabardo, C.-T. Dinh, Y. Wang, T.-T. Zhuang, D. Sinton and E. H. Sargent, Nat. Catal., 2020, 3, 75–82 CrossRef CAS.
- M. Wang, V. Nikolaou, A. Loiudice, I. D. Sharp, A. Llobet and R. Buonsanti, Chem. Sci., 2022, 13, 12673–12680 RSC.
- M. Gong, Z. Cao, W. Liu, E. M. Nichols, P. T. Smith, J. S. Derrick, Y.-S. Liu, J. Liu, X. Wen and C. J. Chang, ACS Cent. Sci., 2017, 3, 1032–1040 CrossRef CAS PubMed.
- J. Tirado-Rives and W. L. Jorgensen, J. Chem. Theory Comput., 2008, 4, 297–306 CrossRef CAS PubMed.
- R. Krishnan, J. S. Binkley, R. Seeger and J. A. Pople, J. Chem. Phys., 1980, 72, 650–654 CrossRef CAS.
- P. J. Hay and W. R. Wadt, J. Chem. Phys., 1985, 82, 299–310 CrossRef CAS.
- T. Lu and F. Chen, J. Comput. Chem., 2012, 33, 580–592 CrossRef CAS PubMed.
- F. Ni, H. Yang, Y. Wen, H. Bai, L. Zhang, C. Cui, S. Li, S. He, T. Cheng, B. Zhang and H. Peng, Sci. China Mater., 2020, 63, 2606–2612 CrossRef.
- L. Wang, H. Yang, J. He, Y. Zhang, J. Yu and Y. Song, Electrochim. Acta, 2016, 213, 691–697 CrossRef CAS.
- T. Ghodselahi, M. A. Vesaghi, A. Shafiekhani, A. Baghizadeh and M. Lameii, Appl. Surf. Sci., 2008, 255, 2730–2734 CrossRef CAS.
- D. Jeong, W. Jo, J. Jeong, T. Kim, S. Han, M.-K. Son and H. Jung, RSC Adv., 2022, 12, 2632–2640 RSC.
- L. Martin, H. Martinez, D. Poinot, B. Pecquenard and F. Le Cras, J. Phys. Chem. C, 2013, 117, 4421–4430 CrossRef CAS.
- R. M. Arán-Ais, F. Scholten, S. Kunze, R. Rizo and B. Roldan Cuenya, Nat. Energy, 2020, 5, 317–325 CrossRef.
- N. Pauly, S. Tougaard and F. Yubero, Surf. Sci., 2014, 630, 294–299 CrossRef CAS.
- K. S. Joya, N. Morlanés, E. Maloney, V. Rodionov and K. Takanabe, Chem. Commun., 2015, 51, 13481–13484 RSC.
- Y. Shu, J. Chen, Z. Xu, D. Jin, Q. Xu and X. Hu, J. Electroanal. Chem., 2019, 845, 137–143 CrossRef CAS.
- P. Zhu, C. Xia, C.-Y. Liu, K. Jiang, G. Gao, X. Zhang, Y. Xia, Y. Lei, H. N. Alshareef, T. P. Senftle and H. Wang, Proc. Natl. Acad. Sci. U. S. A., 2021, 118, e2010868118 CrossRef CAS PubMed.
- S. Overa, B. S. Crandall, B. Shrimant, D. Tian, B. H. Ko, H. Shin, C. Bae and F. Jiao, Nat. Catal., 2022, 5, 738–745 CrossRef CAS.
- P. Zhu and H. Wang, Nat. Catal., 2021, 4, 943–951 CrossRef CAS.
- Y. Zhao, X. Chang, A. S. Malkani, X. Yang, L. Thompson, F. Jiao and B. Xu, J. Am. Chem. Soc., 2020, 142, 9735–9743 CAS.
- X. Yan, M. Zhang, Y. Chen, Y. Wu, R. Wu, Q. Wan, C. Liu, T. Zheng, R. Feng, J. Zhang, C. Chen, C. Xia, Q. Zhu, X. Sun, Q. Qian and B. Han, Angew. Chem., Int. Ed., 2023, 62, e202301507 CrossRef CAS PubMed.
- Y. Zhao, X.-G. Zhang, N. Bodappa, W.-M. Yang, Q. Liang, P. M. Radjenovica, Y.-H. Wang, Y.-J. Zhang, J.-C. Dong, Z.-Q. Tian and J.-F. Li, Energy Environ. Sci., 2022, 15, 3968–3977 RSC.
- F. Shao, J. K. Wong, Q. H. Low, M. Iannuzzi, J. Li and J. Lan, Proc. Natl. Acad. Sci. U. S. A., 2022, 119, e2118166119 CrossRef CAS PubMed.
- L. Ni, J. Gu, X. Jiang, H. Xu, Z. Wu, Y. Wu, Y. Liu, J. Xie, Y. Wei and G. Diao, Angew. Chem., Int. Ed., 2023, 62, e202306528 CrossRef CAS PubMed.
- T. Lu and Q. Chen, J. Comput. Chem., 2022, 43, 539–555 CrossRef CAS PubMed.
- Y. Wu, Z. Jiang, X. Lu, Y. Liang and H. Wang, Nature, 2019, 575, 639–642 CrossRef CAS PubMed.
Footnotes |
| † Electronic supplementary information (ESI) available: XRD, the line-scanning intensity profile of HRTEM, XPS, a schematic diagram of the flow cell, product distributions, CV curves, normalized partial current densities, TEM, EDS mapping, UV-Vis, FTIR, optimized structures, and related tables. See DOI: https://doi.org/10.1039/d4dt01293c |
| ‡ These authors contributed equally to this work. |
| This journal is © The Royal Society of Chemistry 2024 |