 Open Access Article
Creative Commons Attribution 3.0 Unported Licence
Dynamic acoustic emission analysis of polymer electrolyte membrane fuel cells†
V. S.
Bethapudi
 ab,
G.
Hinds
c,
P. R.
Shearing
 b,
D. J. L.
Brett
 *b and
M.-O.
Coppens
 *a
*a
aEPSRC “Frontier Engineering” Centre for Nature Inspired Engineering & Department of Chemical Engineering, University College London, Torrington Place, London WC1E 7JE, UK. E-mail: m.coppens@ucl.ac.uk
bElectrochemical Innovation Lab, Department of Chemical Engineering, University College London, HORIBA MIRA/NPL/Royal Academy of Engineering Research Chair in Metrology for Electrochemical Propulsion, Torrington Place, London WC1E 7JE, UK. E-mail: d.brett@ucl.ac.uk
cNational Physical Laboratory, Hampton Road, Teddington, Middlesex TW11 0LW, UK
First published on 30th March 2022
Abstract
The acoustic emission (AE) technique has been demonstrated as a non-invasive and non-destructive water management diagnostic tool for polymer electrolyte membrane fuel cells (PEMFCs). AE probes the dynamics of water generation and removal at the flow-field of a PEMFC to establish the hydration state inside the cell and has been utilised to electro-acoustically characterise the performance of a PEMFC under different operating conditions. In this study, the dynamic relationship between the acoustic activity and the rate of electrochemical reaction inside a PEMFC is explored by correlating AE from PEMFCs with their performance using different time-based characterisations (polarisation scans at 10 s, 60 s, and 120 s voltage stabilisation durations). Flooding resulted in ∼16% decrease in maximum current density generated at 60 s and 120 s conditions compared to that at 10 s. Besides, flooding at longer durations is confirmed by acoustic emission as a function of polarisation (AEfP) and electrochemical impedance spectroscopy measurements. The effectiveness of the AE technique as a direct water diagnostic tool for PEMFCs is established through forward-reverse polarisation scans. Here, the AE energy generated during cell polarisations is utilised in understanding the water uptake and release mechanism inside the fuel cell. Furthermore, cell durability testing is performed through galvanostatic and potentiostatic measurements, where a synchronous relationship between the cell performance and the measured AE is identified.
1. Introduction
Polymer electrolyte membrane fuel cells (PEMFCs) are devices that generate electrical energy from the electrochemical reaction between hydrogen fuel and air or oxygen. In addition to the electrical energy, the electrochemical reaction inside the fuel cell produces heat and water as by-products. The rate of electrochemical reaction in the cell defines the quantity of heat and amount of water generated – these, in turn, determine the cell temperature and the hydration conditions, respectively. Furthermore, temperature and hydration conditions influence the reaction rate, ionic conductivity, and the associated cell performance significantly.1,2Efficient water management inside a PEMFC is critical for the cell to deliver better operating performance. Improper water regulation, resulting in either ‘dry’ or ‘flooded’ conditions, can deteriorate the performance of the cell considerably. Several methods are utilised for indirect and direct evaluation of water distribution inside a PEMFC.3,4 For instance, measurement techniques based on cell resistance,5,6 cell voltage,7,8 and pressure drop9,10 have been adopted to provide a qualitative understanding of the water dynamics inside the cell. To establish a quantitative understanding, direct water evaluation methods based on visualisation techniques like optical imaging,11–13 neutron imaging,14–16 X-ray,17–20 and magnetic resonance imaging21–23 have been used. However, these methods have certain operational and utilisation limitations, like material or component compatibility issues,13 measurement expense, and limited availability.24,25
The acoustic activity of a system can be measured using the acoustic emission (AE) technique. An AE event results from an elastic wave generated within a material or component as a result of a mechanical perturbation. Easy accessibility of this technique allows a wide range of applications to utilise AE for monitoring, diagnostic, analytical, and other scientific studies in fields as diverse as corrosion science,26 medical physics,27 automotive industry,28 and building and construction materials.29 In the field of electrochemical science and engineering, AE has been utilised for diagnostic purposes in several applications as well, and a detailed study on this is given in previous work.30 So far, AE has been utilised in fuel cell technology for fault analysis and diagnosis,31 thermo-mechanical characterisation of solid oxide fuel cells (SOFCs),32 damage evaluation of SOFCs,33,34 monitoring structural properties during drying and swelling of Nafion membrane,35 and diagnosis of physiochemical changes occurring inside a PEMFC under a range of operating conditions.36
Acoustic activity generated within a PEMFC can be utilised for the direct water evaluation inside the cell, irrespective of its material properties. Recently, Bethapudi et al.30,37 developed an acoustic emission as a function of polarisation (AEfP) technique for hydration diagnostics of PEMFCs. AEfP probes the water dynamics inside a PEMFC by analysing the AE energy released from the cell at discrete points of polarisation. The measured AE energy is instrumental in establishing correlations between the level of cell polarisation and the water generation and removal within flow-fields. Furthermore, the AEfP technique has successfully diagnosed flooding in fractal flow-field PEMFCs.38
In this study, the AEfP technique is utilised to study the dynamic relationship between PEMFC performance and its corresponding acoustic activity under a time-dependent parametrisation. In addition, the cells are acoustically tested through consecutive forward and reverse polarisation scans to explore the electro-acoustic dynamic relationship. Galvanostatic and potentiostatic tests are performed to highlight the synchronous behaviour between the cell performances affected by hydration conditions and the generated acoustic activity. Furthermore, cell temperature profiles are utilised to better understand the correlation between electrochemical reactions or other processes within the fuel cell and acoustic activity.
2. Experimental setup and methods
2.1. PEMFC flow-field plates
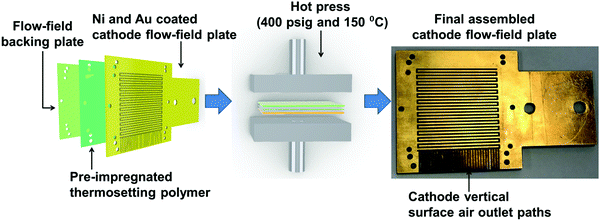
The PEMFC used in this study had single-serpentine cathode and anode flow-fields. The cathode flow-field was developed from planar printed circuit board (PCB) plates using a layer-wise assembly approach.39 Each flow-field was assembled using layers of PCB plates, an approach that has been identified as cost-effective, easy and scalable for manufacturing.39–41 Each plate had dimensions of 80 mm × 80 mm × 2 mm. One plate accommodated the flow-field features, while the other plate acted as the backing plate. The PCB plate accommodating the flow-field features had a 35 μm thick Cu coating on its surface. The corresponding flow-field features were milled and drilled using a Roland – 40 Computer Numeric Control (CNC) machine (Roland, USA).The plate with flow-field features was Ni electroplated using 0.13 M Ni(SO3NH2)2 solution at 4.3 mA cm−2 current density (voltage range 3.0–3.5 V) for 3 min. After this, the Ni-coated plate was Au electroplated using 0.02 M KAu(CN)2 solution at a current density of 2.4 mA cm−2 (voltage range 3.5–3.7 V) for 60 min. The flow-field backing plate was a plain PCB plate with no metallic coating. The above two PCB plates, along with a pre-impregnated thermosetting polymer as an adhesive between them, were hot-pressed, as shown in Fig. 1, under a pressure of 400 psig at 150 °C for 60 min, followed by a 120 min ambient cooling period.30,39
Fig. 1 shows the final assembled cathode flow-field plate, which has a 1 mm2 square channel single-serpentine flow-field path with a depth of 1 mm covering an active membrane electrode assembly (MEA) area of 25 cm2. Vertical surface air outlet paths allow for the removal of excess cathode reactant gases and product water. The overall dimensions of the cathode flow-field plate after the hot press were 80 mm × 80 mm × 4 mm.
The anode single-serpentine flow-field was developed from a graphite plate of 80 mm × 80 mm × 8 mm in dimensions (Fig. S1, ESI†). The anode serpentine flow-field features had similar channel dimensions and depth to those of the cathode flow-field but with a closed hydrogen removal path.
2.2. Membrane electrode assembly (MEA)
The MEA utilised in this study had an active area of 25 cm2. The membrane used was Nafion® 212 (DuPont, USA) and was ∼50 μm in thickness, the gas diffusion layer (GDL) was a carbon fibre paper with PTFE treated microporous layer (MPL) (Freudenberg H23C9) and was ∼210 μm in thickness, and the catalyst loading was 0.4 mgpt cm−2 HyPlat Pt catalyst (HyPlat, South Africa).These MEA components were hot press assembled for 3 min under a pressure of 400 psig and at a temperature of 150 °C. The overall thickness of the final assembled MEA was ∼500 μm.
2.3. Fuel cell testing
PEMFC experimental testing was performed using a Scribner 850e fuel cell test station (Scribner Associates, NC, USA). The test station could supply reactants under controlled conditions of temperature, relative humidity, pressure, flow rates, and gas mixtures. In this study, high purity (99.995%) hydrogen at a flow rate of 200 cm3 min−1 and bottled air at a flow rate of 1000 cm3 min−1, under ambient conditions, were supplied to the PEMFC anode and cathode, respectively. Constant flow rates avoid acoustic disturbances generated from stoichiometric based flows.30The PEMFC was preheated to a temperature of 45 °C using cylindrical heaters; the corresponding cell temperatures generated were measured using a K-type thermocouple. The cell was operated under ambient cooling conditions.
A polarisation curve, potentiostatic and galvanostatic measurements were carried out as detailed in Tables 1 and 2, respectively. Before each experimental procedure, cell conditioning was performed by supplying the reactants under open circuit voltage (OCV) conditions for 2 min, which allowed the gas flow and the reactant humidity to stabilise.
| Experimental condition | Voltage range | Hold time per voltage point | Voltage interval per point |
|---|---|---|---|
| Polarisation | OCV – 0.3 V | 30 s | 0.05 V |
| 60 s | |||
| 120 s | |||
| Forward and reverse polarisation | OCV – 0.3 V | 60 s | 0.05 V |
| 0.3 V – OCV | 60 s |
| Experimental condition | Voltage/Current | Hold duration | Duration per voltage acquisition point |
|---|---|---|---|
| Potentiostatic | 0.8 V | 900 s | 10 s |
| OCV | 300 s | ||
| 0.6 V | 900 s | ||
| OCV | 300 s | ||
| 0.4 V | 900 s | ||
| OCV | 300 s | ||
| Galvanostatic | 20 A | 600 s | |
| OCV | 300 s | ||
| 25 A | 600 s | ||
| OCV | 300 s | ||
| 30 A | 600 s | ||
| OCV | 300 s |
2.4. Acoustic emission analysis
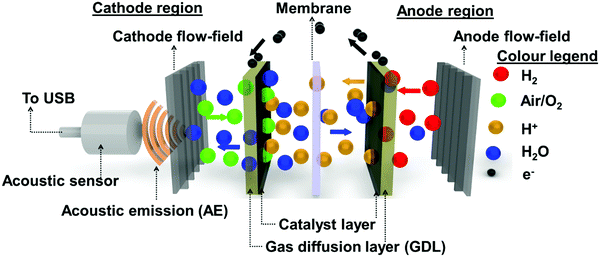
A schematic outline of the AE mechanism occurring inside the PEMFC is shown in Fig. 2. In this study, AE from the PEMFC was recorded using a piezoelectric transducer type acoustic sensor, as shown in Fig. 2. The acoustic sensor was externally coupled to the cathode flow-field plate using silicone paste. The sensor was connected via a USB cable to a computer running AEwin™ data acquisition and replay software (Physical Acoustics Corporation, USA). The software allows for data logging, interpretation, and reproduction of the measured acoustic data. A detailed outline of the signal filters and pre-amplification devices used in the data acquisition is given in a previous study.30,38The acoustic sensor used was a single-channel acquisition system with an operating frequency of 200–1000 kHz and a resonant frequency of 500 kHz, respectively. The acquisition system had lower and upper analogue filters of 30 kHz and 1 MHz, respectively. Here, a threshold amplitude of 30 dB was considered based on the background noise, including the reactant flow through the channels, developed during the PEMFC testing. Signals with a magnitude beyond this threshold are considered as AE hits. The critical data points measured from the AE hits were threshold, peak amplitude (dB), counts, and absolute energy (aJ), as detailed in previous work.30
2.5. Electrochemical impedance spectroscopy
Electrochemical impedance spectroscopy (EIS) measurements were performed using a Scribner 850e impedance analyser (Scribner Associates, NC, USA). The frequency range for analysis was 10 kHz to 0.1 Hz, with 10 points per decade, and the AC modulation amplitude was 5% of the DC input signal.3. Results and discussion
3.1. Polarisation stabilisation based AE analysis
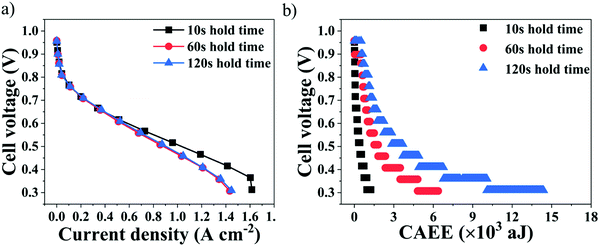
Fig. 3 shows the influence of the polarisation voltage stabilisation time on the performance of a PEMFC and its associated AE generated under three different stabilisation conditions – hold times of 10 s, 60 s and 120 s.It can be observed from Fig. 3(a) that, with increased current density and especially between OCV and 0.6 V (Ohmic region of operation), the performance of the cell remained similar, irrespective of the stabilisation conditions. However, decreasing the voltage further resulted in a more significant decrease of the cell performance for 60 s and 120 s hold times compared to 10 s. The longer the voltage hold, the longer the electrochemical reaction will occur, with associated water generation.42 Thus, the poorer performance at lower cell voltages for longer hold times of 60 s and 120 s can be attributed to mass transport limitations that can be induced by flooding occurring inside the cell, as a result of excess water generation and retention with time.43,44 Furthermore, the overall cell polarisation for the 60 s and 120 s hold times remained similar, as seen in Fig. 3(a), indicating that the impact of the level of cell flooding on the cell performance did not become worse after 60 s.
Cell flooding can be identified from the corresponding AEfP curves, which reflect the AE energy measured from the impacts of water generation and release into the flow-fields, as shown in Fig. 3(b). It can be observed from Fig. 3(b) that the cumulative absolute AE energy (CAEE) measured from the cells increased as the cell voltage decreased, which can be attributed to the increased extent of the electrochemical reactions and associated water generation inside the cell.30,36,45
The overall CAEE measured was lowest at 10 s hold time, namely ∼1500 aJ, which also delivered superior performance compared to the 60 s and 120 s hold times. However, the overall CAEE generated for the 60 s and 120 s hold times was ∼6500 aJ and ∼14![[thin space (1/6-em)]](https://www.rsc.org/images/entities/char_2009.gif) 500 aJ, respectively, and such very high acoustic activity can be attributed to excess water accumulation with time occurring inside the cell. Furthermore, the CAEE measured at each voltage point on the polarisation curves increased considerably when moving from a hold time of 60 s to 120 s. For instance, at 0.4 V, the corresponding CAEE was ∼1150 aJ and ∼1900 aJ, respectively.30,44
500 aJ, respectively, and such very high acoustic activity can be attributed to excess water accumulation with time occurring inside the cell. Furthermore, the CAEE measured at each voltage point on the polarisation curves increased considerably when moving from a hold time of 60 s to 120 s. For instance, at 0.4 V, the corresponding CAEE was ∼1150 aJ and ∼1900 aJ, respectively.30,44
3.2. Electrochemical impedance spectroscopy (EIS) measurements
EIS measurements on the same PEMFC were performed to characterise cell performance in the high current density operating region. Here, EIS was performed at 0.8 A cm−2 (20 A), 1 A cm−2 (25 A) and 1.2 A cm−2 (30 A). The corresponding EIS spectra and resistances developed in the PEMFC are given in Fig. 4 and Table 3, respectively (equivalent circuit use for modelling the EIS data is provided in Fig. S2, ESI†).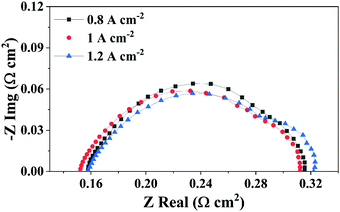 | ||
| Fig. 4 Electrochemical impedance spectroscopy measurements at 20 A (0.8 A cm−2), 25 A (1 A cm−2) and 30 A (1.2 A cm−2) current conditions, respectively. | ||
| Load | Resistance Ω cm2 | ||
|---|---|---|---|
| HFR | R ct | R mt | |
| 20 A/0.8 A cm−2 | 0.158 | 0.285 | 0.025 |
| 20 A/1 A cm−2 | 0.154 | 0.283 | 0.033 |
| 20 A/1.2 A cm−2 | 0.158 | 0.281 | 0.040 |
It can be observed from Table 3 that with an increase in the current density from 0.8 A cm−2 to 1 A cm−2, Rmt increases significantly with current density, while the high-frequency resistance (HFR) and Rct are relatively unchanged For this PEMFC, where the Rmt increases in the high current density region, accompanied by stable HFR and Rct, any increase in the voltage hold duration will result in excess accumulation of water with time and exacerbates the mass transfer related issues like flooding, as described by the polarisation curves and the AEfP results shown in Fig. 3.46
3.3. Forward and reverse polarisations
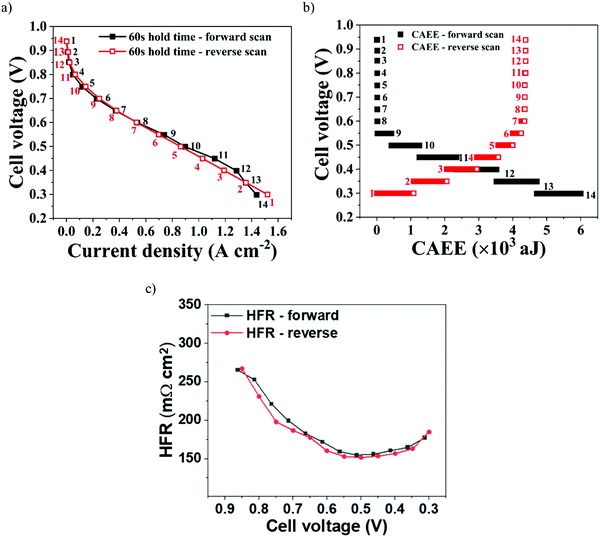
To evaluate the dynamic relationship between electrochemical activity and acoustic activity generated in a PEMFC, forward and reverse polarisation scans were performed, as shown in Fig. 5(a), at 60 s hold time. The corresponding acoustic activity during the scans is shown in Fig. 5(b).The forward scan was run between OCV and 0.3 V, while the reverse scan was run between 0.3 V and OCV. The HFR during the forward scan, as in Fig. 5(c), initially decreases with an increase in the cell operating current. This can be due to the improved membrane hydration, as a result of increased electrochemical reaction rates generating water, and its associated conductivity. However, beyond 0.45 V cell voltage the HFR increases; this is attributed to the increasing cell temperature at higher current, leading to membrane dehydration.15,47 The opposite can be attributed to the HFR measured during the reverse scan. At 0.3 V, the initial higher currents may have resulted in higher cell temperatures, resulting in some membrane dehydration. However, decreasing the cell current led to a lower cell temperature that resulted in increasing HFR until 0.65 V. Below 0.65 V, an increasing HFR is observed as a result of insufficient hydration occurring from lower cell currents.
It can also be observed from Fig. 5(a) that the polarisation performance during forward and reverse scans was similar, with only marginal differences observed in the high current density region. Such similarity in forward and reverse polarisation curves indicates optimal stabilisation conditions for the PEMFC to reach steady-state operation at each voltage point and avoid a hysteresis effect.48 Furthermore, the similarity in polarisation performance was established by the near-identical HFR values generated, which establish the level of membrane hydration and its associated conductivity, as shown in Fig. 5(c).49
The corresponding CAEE measured during the polarisation curves is shown in Fig. 5(b). It can be observed that, for both forward and reverse scans, similar acoustic activity was measured between OCV and 0.6 V, which establishes the measured AE as a dynamic response to the level of polarisation (electrochemical reaction) in the cell. Between 0.6 V and 0.3 V, considerable acoustic activity was measured from the PEMFC, because of the increased water build-up and ineffective removal at higher current densities.
It can be observed from Fig. 5(b) that the net CAEE measured between 0.6 V and 0.3 V for the reverse scan was ∼18–25% less than that measured for the forward scan. During a reverse scan, the initially high currents require a greater uptake of water by the membrane to maintain sufficient hydration and its associated conductivity. With progressive decreases in current density, the level of water in the GDL gradually reduces and this promotes re-absorption of the existing water in the cell into the GDL.50,51 This additional utilisation of water generated in the cell by the GDL during the reverse scan may have resulted in comparatively lower levels of water being released into the flow-field and associated AE measured compared to the forward scan, where the continuous electrochemical activity resulted in saturation of water in the GDL. Furthermore, the additional utilisation of water during the reverse scan can be established from the HFR, as given in Fig. 5(c).52 HFR is an index for the level of water uptake by a membrane and its associated conductivity.49 The HFR initially decreases from ∼270 Ω cm2 at 0.85 V to ∼150 Ω cm2 at 0.55 V due to an increase in the hydration with increasing current. Later, HFR increases from ∼150 Ω cm2 at 0.55 V to ∼175 Ω cm2 at 0.3 V as a result of membrane dehydration due to increased temperatures at higher currents, which is a known trend from our previous work.39,41 The observed similar hydration conditions (HFR values) for both scans imply that during the reverse scan the utilisation of generated water may have offset the additional hydration requirements, resulting in less water released into the flow-field.
Overall, there is a natural hysteresis associated with the time it takes for liquid water to be cleared from the system, i.e. increasing cell currents constantly increase the amount of water in the system, leading to a build-up of water, especially in the forward scan, while in the reverse scan increasingly less water is generated, so build-up decreases. This explains the observed higher and lower CAEE observed in the forward and backward scans, respectively (assuming that the rate of water removal is constant).
3.4. Potentiostatic tests
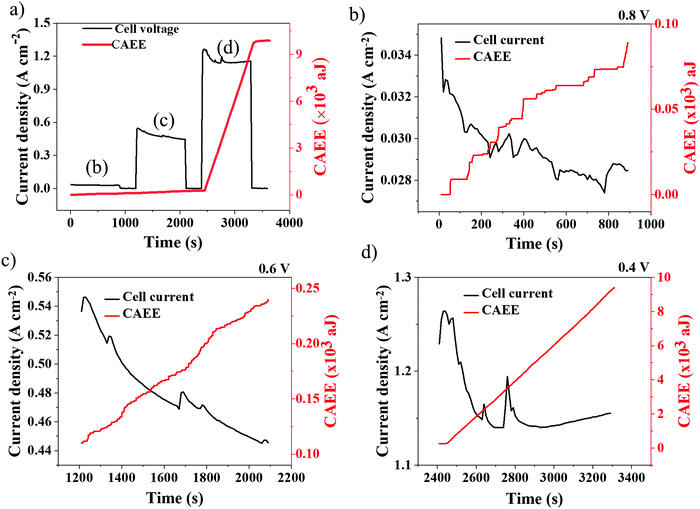
Potentiostatic tests (voltage hold) were performed to probe the dynamics of current density development on the acoustic energy released inside the cell. The AE response to dynamic electrochemical conditions inside the PEMFC were studied under potentiostatic conditions, as shown in Fig. 6. Potentiostatic tests were carried out under three regions of PEMFC operation, namely, ‘activation’ (0.8 V), ‘Ohmic’ (0.6 V) and ‘concentration polarisation’ (0.4 V) regions. Under each voltage condition, the cell was held for 900 s at a particular voltage (gradient profile) followed by an OCV hold for 300 s (flat profile).It can be observed from Fig. 6(b) that, at 0.8 V hold, the current density decreased from 0.035 A cm−2 to 0.028 A cm−2 with periodic ‘spikes’ observed in the current density profile, which are commonly referred to as ‘flushing events’ in a PEMFC.30 Flushing events occur when the water in a flow-field builds up continuously, reducing the apparent cell performance, and eventually resulting in the sudden ejection of water through the flow-field out of the cell followed by a spontaneous increase in the cell performance.51 Here, such spurts of water inside the cell resulted in correlated AE responses, as presented in Fig. 6(b–d).30,36 It can be observed from Fig. 6(b) that the AE response is synchronous with the current density distribution, with step increase and plateau regions in AE corresponding to spikes and stable regions in current density distribution, respectively.36 The CAEE's sequence of steps with a broad distribution – many small steps, and some very large ones, when a lot of water is suddenly released – is remarkably similar to a randomised Cantor function or fractal Devil's Staircase, discussed by Mandelbrot.53 This reflects the stochasticity of water release, with many trickles and occasional spurts that, however, dramatically dominate the overall behaviour. Whilst the quantity of data are insufficient to ascertain a power law distribution of water releases, the qualitative features of the Devil's Staircase are clear.
At 0.6 V hold, as in Fig. 6(c), the current density decreased from 0.55 A cm−2 to 0.44 A cm−2, which can be attributed to gradual water stagnation inside the cell that obstructs the active sites of the catalyst layer, resulting in performance degradation.54 However, the current density profile is less synchronous with CAEE, which is no longer a discrete staircase pattern, as shown in Fig. 6(b). This is due to the continuous water generation as a result of the increased rate of electrochemical reactions (current density) at 0.6 V that resulted in sustained AE generation. Further reducing the cell voltage to 0.4 V, Fig. 6(d), the current density decreased from 1.25 A cm−2 to 1.15 A cm−2 over the hold period and the corresponding increase in CAEE was much larger and more sustained compared to the previous two voltage holds, which can be attributed to greater amounts of water build-up, as a result of the higher current density in the cell.
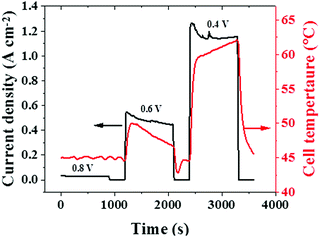
In addition to the water generated, the cell temperature developed is another variable that depends on the rate of the electrochemical reactions occurring inside a cell. The cell temperatures during the potentiostatic tests are given in Fig. 7. At lower current densities (corresponding to a cell voltage of 0.8 V), the rate of electrochemical reaction is minimal, which results in a low and stable cell temperature.
With an increase in current density (corresponding to a lower cell voltage of 0.6 V or 0.4 V), the level of electrochemical reaction occurring in the cell increases significantly and this impacts the cell temperature too. Furthermore, the decreasing and increasing trends in cell temperatures observed at 0.6 V and 0.4 V can be correlated with the corresponding current density (electrochemical reaction rate) trends, as seen in Fig. 7. Besides, the decreasing trend in cell temperature at 0.6 V can be attributed to the cooling effect occurring from liquid water build-up at this condition, which is established by the decreasing trend in HFR at 0.6 V, as observed in Fig. 5(c). Similarly, the increasing trend in temperature at 0.4 V may result from reduced hydration conditions, which is established by an increasing trend in HFR at this voltage, as in Fig. 5(c). Overall, the observed correlation between cell temperature and CAEE profiles confirms the measured AE to be a dynamic response to the electrochemical reaction rate, similar to the cell temperature.
3.5. Galvanostatic tests
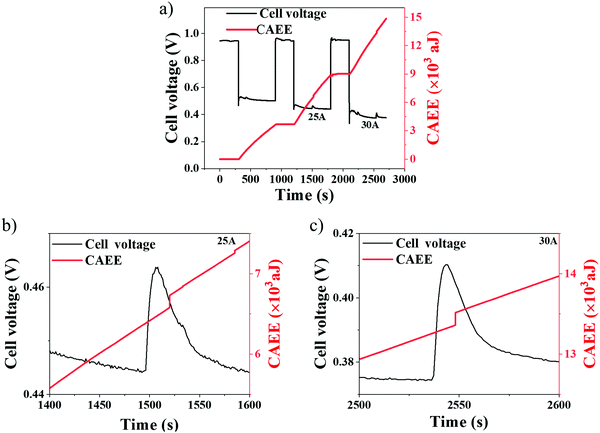
Galvanostatic (current hold) measurements were performed to probe the effect of cell performance on the generated CAEE, specifically at higher current densities, where mass transport limitations are prominent (Table 3). Galvanostatic tests are presented in Fig. 8 for two different current densities, namely 1 A cm−2 (25 A) and 1.2 A cm−2 (30 A). At each current density, the cell was held for 600 s, followed by an OCV hold for 300 s.48It can be observed from Fig. 8(a) that, at each current density, there is a stabilisation phase, identified by the initial spike(s) in cell voltage, where an equilibrium operation state is achieved. This is known to depend on factors such as reactant concentration, current density, cell temperature, reactant humidity, membrane water content and GDL properties.48
During OCV, no acoustic activity (CAEE) is detected (plateau region), implying that the measured CAEE during the cell operation is primarily associated with the water generated from electrochemical reactions. Under imposed current regions, there is a constant increase in the CAEE, which can be attributed to the continuous generation of water as a result of the greater extent of the electrochemical reactions occurring with increased current densities (water generation rates). At 1 A cm−2 (Fig. 8(b)) and 1.2 A cm−2 (Fig. 8(c)), a voltage peak is observed at 1500 s and 2550 s, respectively. Such peaks occur due to the sudden release of built-up water, as a flushing event, from inside the cell.55 Besides, the delay in CAEE edge point at 25 A compared to 30 A may be due to the lower voltage spike generated at 25 A (due to a lower current) compared to that at 30 A. Such flushing events provide improved reactant access for the electrochemical reactions, resulting in improved cell performance. Correlation is observed between the CAEE and voltage peaks in Fig. 8(b) and (c), and can be attributed to flushing events, as described above.30 The corresponding cell temperature developed during the current hold conditions is given in Fig. S3 (ESI†).
4. Conclusions
This study measured acoustic activity from a PEMFC as a dynamic response during potentiostatic and galvanostatic operation. The measured AE and the electrochemical performance are identified to be related to each other at different electrochemical measurement conditions.Increase in voltage stabilisation (hold) duration results in excess water build-up or flooding inside the cell that decrease its performance, especially in the high current density region. In addition, simultaneous acoustic activity measurements indicate higher levels of AE energy measured at higher stabilisation durations as a result of flooding.
It is shown that AE is an effective water management tool for diagnosing water build-up and removal through forward and reverse polarisation scans; the measured AE during these scans reflects the water uptake and release conditions inside the fuel cell.
Flushing events are observed in galvanostatic and potentiostatic tests. The impact of such events on the cell performance is correlated with the measured AE, with the spikes in current and voltage distributions synchronous with the peaks in CAEE developed. Furthermore, the measured AE as a dynamic response to the electrochemical reactions occurring inside the cell is established by the reached cell temperatures, where higher and lower cell temperatures coincide with larger and smaller levels of AE energy distribution, respectively.
Conflicts of interest
There are no conflicts to declare.Acknowledgements
We gratefully acknowledge EPSRC “Frontier Engineering” (EP/K038656/1) and “Frontier Engineering: Progression” (EP/S03305X/1) awards to the Centre for Nature-Inspired Engineering (CNIE), as well as other funding from the EPSRC (EP/L015277/1, EP/P009050/1, EP/M014371/1, EP/M009394/1, EP/M023508/1, EP/L015749/1, EP/N022971/1) for supporting fuel cell research in the Electrochemical Innovation Lab (EIL). We also thank the Department of Chemical Engineering, University College London, and the National Measurement System of the UK Department of Business, Energy and Industrial Strategy for supporting this work. The authors would like to acknowledge the Royal Academy of Engineering for financial support of Shearing (CiET1718\59) and Brett under the Research Chairs and Senior Research Fellowships scheme (RCSRF2021/13/53). The authors would like to acknowledge Dr Quentin Meyer and Professor Daniel Steingart for their assistance in sourcing the equipment and supplying the interfacing code used to obtain the data.References
- M. Amirinejad, S. Rowshanzamir and M. H. Eikani, Effects of operating parameters on performance of a proton exchange membrane fuel cell, J. Power Sources, 2006, 161, 872–875, DOI:10.1016/j.jpowsour.2006.04.144.
- E. Misran, N. S. M. Hassan, W. R. W. Daud, E. H. Majlan and M. I. Rosli, Water transport characteristics of a PEM fuel cell at various operating pressures and temperatures, Int. J. Hydrogen Energy, 2013, 38, 9401–9408, DOI:10.1016/j.ijhydene.2012.12.076.
- M. Hasheminasab, M. J. Kermani, S. S. Nourazar and M. H. Khodsiani, A novel experimental based statistical study for water management in proton exchange membrane fuel cells, Appl. Energy, 2020, 264, 114713, DOI:10.1016/j.apenergy.2020.114713.
- M. Mortazavi and K. Tajiri, Two-phase flow pressure drop in flow channels of proton exchange membrane fuel cells: review of experimental approaches, Renewable Sustainable Energy Rev., 2015, 45, 296–317, DOI:10.1016/j.rser.2015.01.044.
- A. O. Pistono and C. A. Rice, Subzero water distribution in proton exchange membrane fuel cells: Effects of preconditioning method, Int. J. Hydrogen Energy, 2019, 44, 22098–22109, DOI:10.1016/j.ijhydene.2019.06.101.
- J. Shan, R. Lin, X. Chen and X. Diao, EIS and local resolved current density distribution analysis on effects of MPL on PEMFC performance at varied humidification, Int. J. Heat Mass Transf., 2018, 127, 1076–1083, DOI:10.1016/j.ijheatmasstransfer.2018.08.033.
- H. Kalantari, Numerical analysis of water distribution in the various layers of proton exchange membrane fuel cells, Comput. Chem. Eng., 2018, 118, 14–24, DOI:10.1016/j.compchemeng.2018.07.004.
- M. Song, P. Pei, H. Zha and H. Xu, Water management of proton exchange membrane fuel cell based on control of hydrogen pressure drop, J. Power Sources, 2014, 267, 655–663, DOI:10.1016/j.jpowsour.2014.05.094.
- S. A. Niknam, M. Mortazavi and A. D. Santamaria, Signature analysis of two-phase flow pressure drop in proton exchange membrane fuel cell flow channels, Results Eng., 2020, 5, 100071, DOI:10.1016/j.rineng.2019.100071.
- J. I. S. Cho, T. P. Neville, P. Trogadas, J. Bailey, P. Shearing, D. J. L. Brett and M. O. Coppens, Capillaries for water management in polymer electrolyte membrane fuel cells, Int. J. Hydrogen Energy, 2018, 43, 21949–21958, DOI:10.1016/j.ijhydene.2018.10.030.
- O. F. Selamet, U. Pasaogullari, D. Spernjak, D. S. Hussey, D. L. Jacobson and M. D. Mat, Two-phase flow in a proton exchange membrane electrolyzer visualized in situ by simultaneous neutron radiography and optical imaging, Int. J. Hydrogen Energy, 2013, 38, 5823–5835, DOI:10.1016/j.ijhydene.2013.02.087.
- R. Banerjee and S. G. Kandlikar, Liquid water quantification in the cathode side gas channels of a proton exchange membrane fuel cell through two-phase flow visualization, J. Power Sources, 2014, 247, 9–19, DOI:10.1016/j.jpowsour.2013.08.016.
- D. Lee and J. Bae, Visualization of flooding in a single cell and stacks by using a newly-designed transparent PEMFC, Int. J. Hydrogen Energy, 2012, 37, 422–435, DOI:10.1016/j.ijhydene.2011.09.073.
- Y. Wu, J. I. S. Cho, T. P. Neville, Q. Meyer, R. Ziesche, P. Boillat, M. Cochet, P. R. Shearing and D. J. L. Brett, Effect of serpentine flow-field design on the water management of polymer electrolyte fuel cells: an in-operando neutron radiography study, J. Power Sources, 2018, 399, 254–263, DOI:10.1016/j.jpowsour.2018.07.085.
- Y. Wu, Q. Meyer, F. Liu, L. Rasha, J. I. S. Cho, T. P. Neville, J. Millichamp, R. Ziesche, N. Kardjilov, P. Boillat, H. Markötter, I. Manke, M. Cochet, P. Shearing and D. J. L. Brett, Investigation of water generation and accumulation in polymer electrolyte fuel cells using hydro-electrochemical impedance imaging, J. Power Sources, 2019, 414, 272–277, DOI:10.1016/j.jpowsour.2019.01.003.
- E. Coz, J. Théry, P. Boillat, V. Faucheux, D. Alincant, P. Capron and G. Gébel, Water management in a planar air-breathing fuel cell array using operando neutron imaging, J. Power Sources, 2016, 331, 535–543, DOI:10.1016/j.jpowsour.2016.09.041.
- C. Tongsh, Y. Liang, X. Xie, L. Li, Z. Liu, Q. Du and K. Jiao, Experimental investigation of liquid water in flow field of proton exchange membrane fuel cell by combining X-ray with EIS technologies, Sci. China: Technol. Sci., 2021, 64, 2153–2165, DOI:10.1007/s11431-021-1815-6.
- T. Arlt, M. Klages, M. Messerschmidt, J. Scholta and I. Manke, Influence of artificially aged gas diffusion layers on the water management of polymer electrolyte membrane fuel cells analyzed with in-operando synchrotron imaging, Energy, 2017, 118, 502–511, DOI:10.1016/j.energy.2016.10.061.
- P. Rahimian, L. Battrell, R. Anderson, N. Zhu, E. Johnson and L. Zhang, Investigation of time dependent water droplet dynamics on porous fuel cell material via synchrotron based X-ray imaging technique, Exp. Therm. Fluid Sci., 2018, 97, 237–245, DOI:10.1016/j.expthermflusci.2018.04.021.
- S. Chevalier, N. Ge, J. Lee, M. G. George, H. Liu, P. Shrestha, D. Muirhead, N. Lavielle, B. D. Hatton and A. Bazylak, Novel electrospun gas diffusion layers for polymer electrolyte membrane fuel cells: Part II. In operando synchrotron imaging for microscale liquid water transport characterization, J. Power Sources, 2017, 352, 281–290, DOI:10.1016/j.jpowsour.2017.01.114.
- A. Bazylak, Liquid water visualization in PEM fuel cells: a review, Int. J. Hydrogen Energy, 2009, 34, 3845–3857, DOI:10.1016/j.ijhydene.2009.02.084.
- T. Suzuki, Y. Tabuchi, S. Tsushima and S. Hirai, Measurement of water content distribution in catalyst coated membranes under water permeation conditions by magnetic resonance imaging, Int. J. Hydrogen Energy, 2011, 36, 5479–5486, DOI:10.1016/j.ijhydene.2011.01.162.
- Z. W. Dunbar and R. I. Masel, Magnetic resonance imaging investigation of water accumulation and transport in graphite flow fields in a polymer electrolyte membrane fuel cell: do defects control transport?, J. Power Sources, 2008, 182, 76–82, DOI:10.1016/j.jpowsour.2008.03.057.
- J. I. S. Cho, T. P. Neville, P. Trogadas, Q. Meyer, Y. Wu, R. Ziesche, P. Boillat, M. Cochet, V. Manzi-Orezzoli, P. Shearing, D. J. L. Brett and M.-O. Coppens, Visualization of Liquid Water in a Lung-Inspired Flow-Field based Polymer Electrolyte Membrane Fuel Cell via Neutron Radiography, Energy, 2018, 170, 14–21, DOI:10.1016/J.ENERGY.2018.12.143.
- A. Bozorgnezhad, M. Shams, H. Kanani, M. Hasheminasab and G. Ahmadi, Two-phase flow and droplet behavior in microchannels of PEM fuel cell, Int. J. Hydrogen Energy, 2016, 41, 19164–19181, DOI:10.1016/j.ijhydene.2016.09.043.
- V. R. Skal's’kyi, Z. Nazarchuk, Y. Dolins’ka, R. Y. Yarema and V. Selivonchyk, Acoustic-Emission Diagnostics of Corrosion Defects in Materials (a Survey). Part. 1. Detection of Electrochemical Corrosion and Corrosion Fatigue, Mater. Sci., 2017, 53, 295–305, DOI:10.1007/s11003-017-0075-x.
- J. Kiselev, B. Ziegler, H. J. Schwalbe, R. P. Franke and U. Wolf, Detection of osteoarthritis using acoustic emission analysis, Med. Eng. Phys., 2019, 65, 57–60, DOI:10.1016/j.medengphy.2019.01.002.
- C. Brokmann, C. Alter and S. Kolling, Experimental determination of failure strength in automotive windscreens using acoustic emission and fractography, Glas. Struct. Eng., 2019, 4, 229–241, DOI:10.1007/s40940-018-0090-9.
- A. Grazzini, F. Accornero, G. Lacidogna and S. Valente, Acoustic emission and numerical analysis of the delamination process in repair plasters applied to historical walls, Constr. Build. Mater., 2020, 236, 117798, DOI:10.1016/j.conbuildmat.2019.117798.
- V. S. Bethapudi, M. Maier, G. Hinds, P. R. Shearing, D. J. L. Brett and M. O. Coppens, Acoustic emission as a function of polarisation: Diagnosis of polymer electrolyte fuel cell hydration state, Electrochem. Commun., 2019, 109, 106582, DOI:10.1016/j.elecom.2019.106582.
- A. Benmouna, M. Becherif, D. Depernet, F. Gustin, H. S. Ramadan and S. Fukuhara, Fault diagnosis methods for Proton Exchange Membrane Fuel Cell system, Int. J. Hydrogen Energy, 2017, 42, 1534–1543, DOI:10.1016/j.ijhydene.2016.07.181.
- J. Malzbender and R. W. Steinbrech, Advanced measurement techniques to characterize thermo-mechanical aspects of solid oxide fuel cells, J. Power Sources, 2007, 173, 60–67, DOI:10.1016/j.jpowsour.2007.07.072.
- K. Sato, T. Hashida, K. Yashiro, H. Yugami, T. Kawada and J. Mizusaki, Mechanical damage evaluation of solid oxide fuel cells under simulated operating conditions, J. Ceram. Soc. Jpn., 2005, 113, 562–564, DOI:10.2109/jcersj.113.562.
- B. Dev, M. E. Walter, G. B. Arkenberg and S. L. Swartz, Mechanical and thermal characterization of a ceramic/glass composite seal for solid oxide fuel cells, J. Power Sources, 2014, 245, 958–966, DOI:10.1016/j.jpowsour.2013.07.054.
- B. Legros, R. P. Nogueira, P.-X. Thivel, Y. Bultel and M. Boinet, Electrochemical Impedance and Acoustic Emission Survey of Water Desorption in Nafion Membranes, Electrochem. Solid-State Lett., 2009, 12, B116, DOI:10.1149/1.3131728.
- B. Legros, P. X. Thivel, Y. Bultel, M. Boinet and R. P. Nogueira, Acoustic emission: Towards a real-time diagnosis technique for Proton exchange membrane fuel cell operation, J. Power Sources, 2010, 195, 8124–8133, DOI:10.1016/j.jpowsour.2010.07.045.
- V. S. Bethapudi, G. Hinds, P. R. Shearing, D. Brett and M.-O. Coppens, Acoustic Emission Analysis of Polymer Electrolyte Membrane Fuel Cells, ECS Meet. Abstr. MA2020-02, 2020, 2178, DOI:10.1149/ma2020-02332178mtgabs.
- V. S. Bethapudi, J. Hack, P. Trogadas, G. Hinds, P. R. Shearing and D. J. L. Brett, Hydration state diagnosis in fractal flow-field based polymer electrolyte membrane fuel cells using acoustic emission analysis, Energy Convers. Manage., 2020, 220, 113083, DOI:10.1016/j.enconman.2020.113083.
- V. S. Bethapudi, J. Hack, P. Trogadas, J. I. S. Cho, L. Rasha, G. Hinds, P. R. Shearing, D. J. L. Brett and M.-O. Coppens, A lung-inspired printed circuit board polymer electrolyte fuel cell, Energy Convers. Manage., 2019, 202, 112198, DOI:10.1016/j.enconman.2019.112198.
- O. A. Obeisun, Q. Meyer, J. Robinson, C. W. Gibbs, A. R. Kucernak, P. R. Shearing and D. J. L. Brett, Development of open-cathode polymer electrolyte fuel cells using printed circuit board flow-field plates: Flow geometry characterisation, Int. J. Hydrogen Energy, 2014, 39, 18326–18336, DOI:10.1016/j.ijhydene.2014.08.106.
- V. S. Bethapudi, J. Hack, G. Hinds, P. R. Shearing, D. J. L. Brett and M.-O. Coppens, Electro-thermal mapping of polymer electrolyte membrane fuel cells with a fractal flow-field, Energy Convers. Manage., 2021, 250, 114924, DOI:10.1016/j.enconman.2021.114924.
- H. Li, Y. Tang, Z. Wang, Z. Shi, S. Wu, D. Song, J. Zhang, K. Fatih, J. Zhang, H. Wang, Z. Liu, R. Abouatallah and A. Mazza, A review of water flooding issues in the proton exchange membrane fuel cell, J. Power Sources, 2008, 178, 103–117, DOI:10.1016/j.jpowsour.2007.12.068.
- J. Hinebaugh, J. Electrochem and F. Soc, Visualizing Liquid Water Evolution in a PEM Fuel Cell Using Synchrotron Visualizing Liquid Water Evolution in a PEM Fuel Cell Using Synchrotron X-ray Radiography, J. Electrochem. Soc., 2012, 159, F826, DOI:10.1149/2.054212jes.
- S. Litster, D. Sinton and N. Djilali, Ex situ visualization of liquid water transport in PEM fuel cell gas diffusion layers, J. Power Sources, 2006, 154, 95–105, DOI:10.1016/j.jpowsour.2005.03.199.
- B. Legros, P. X. Thivel, F. Druart, Y. Bultel and R. Nogueira, Diagnosis and Modelling of Proton- Exchange-Membrane Fuel Cell via and Acoustic-Emission Measurements, Electromotion., 2009, 1–6, DOI:10.1109/ELECTROMOTION.2009.5259133.
- Y. Bultel, K. Wiezell, F. Jaouen, P. Ozil and G. Lindbergh, Investigation of mass transport in gas diffusion layer at the air cathode of a PEMFC, Electrochim. Acta, 2005, 51, 474–488, DOI:10.1016/j.electacta.2005.05.007.
- O. A. Obeisun, Q. Meyer, J. Robinson, C. W. Gibbs, A. R. Kucernak, P. R. Shearing and D. J. L. Brett, Development of open-cathode polymer electrolyte fuel cells using printed circuit board flow-field plates: Flow geometry characterisation, Int. J. Hydrogen Energy, 2014, 39, 18326–18336, DOI:10.1016/j.ijhydene.2014.08.106.
- T. Fabian, J. D. Posner, R. O’Hayre, S. W. Cha, J. K. Eaton, F. B. Prinz and J. G. Santiago, The role of ambient conditions on the performance of a planar, air-breathing hydrogen PEM fuel cell, J. Power Sources, 2006, 161, 168–182, DOI:10.1016/j.jpowsour.2006.03.054.
- M. Breitwieser, R. Moroni, J. Schock, M. Schulz and B. Schillinger, ScienceDirect Water management in novel direct membrane deposition fuel cells under low humidification, Int. J. Hydrogen Energy, 2016, 41, 11412–11417, DOI:10.1016/j.ijhydene.2016.05.018.
- C. Zhang, Z. Liu, W. Zhou, S. H. Chan and Y. Wang, Dynamic performance of a high-temperature PEM fuel cell - An experimental study, Energy, 2015, 90, 1949–1955, DOI:10.1016/j.energy.2015.07.026.
- D. A. McKay, J. B. Siegel, W. Ott and A. G. Stefanopoulou, Parameterization and prediction of temporal fuel cell voltage behavior during flooding and drying conditions, J. Power Sources, 2008, 178, 207–222, DOI:10.1016/j.jpowsour.2007.12.031.
- A. Iranzo, A. Salva, P. Boillat, J. Biesdorf, E. Tapia and F. Rosa, Water build-up and evolution during the start-up of a PEMFC: Visualization by means of Neutron Imaging, Int. J. Hydrogen Energy, 2017, 42, 13839–13849, DOI:10.1016/j.ijhydene.2016.11.076.
- B. B. Mandelbrot and B. B. Mandelbrot. The fractal geometry of nature, New York, WH freeman, vol. 1, 1982 Search PubMed.
- A. J. Real, A. Arce and C. Bordons, Development and experimental validation of a PEM fuel cell dynamic model, J. Power Sources, 2007, 173, 310–324, DOI:10.1016/j.jpowsour.2007.04.066.
- T. P. Neville, D. J. L. Brett, J. Millichamp, S. Simons, T. J. Mason and P. R. Shearing, A study of the effect of water management and electrode flooding on the dimensional change of polymer electrolyte fuel cells, J. Power Sources, 2013, 242, 70–77, DOI:10.1016/j.jpowsour.2013.05.045.
Footnote |
| † Electronic supplementary information (ESI) available. See DOI: 10.1039/d2ya00037g |
| This journal is © The Royal Society of Chemistry 2022 |

