 Open Access Article
Defective TiO2 for photocatalytic CO2 conversion to fuels and chemicals
Sushma A.
Rawool
,
Kishan K.
Yadav
and
Vivek
Polshettiwar
 *
*
Department of Chemical Sciences, Tata Institute of Fundamental Research (TIFR), Mumbai, India. E-mail: vivekpol@tifr.res.in; Tel: +91 8452886556
First published on 24th February 2021
Abstract
Photocatalytic conversion of CO2 into fuels and valuable chemicals using solar energy is a promising technology to combat climate change and meet the growing energy demand. Extensive effort is going on for the development of a photocatalyst with desirable optical, surface and electronic properties. This review article discusses recent development in the field of photocatalytic CO2 conversion using defective TiO2. It specifically focuses on the different synthesis methodologies adapted to generate the defects and their impact on the chemical, optical and surface properties of TiO2 and, thus, photocatalytic CO2 conversion. It also encompasses theoretical investigations performed to understand the role of defects in adsorption and activation of CO2 and identify the mechanistic pathway which governs the formation and selectivity of different products. It is divided into three parts: (i) general mechanism and thermodynamic criteria for defective TiO2 catalyzed CO2 conversion, (ii) theoretical investigation on the role of defects in the CO2 adsorption–activation and mechanism responsible for the formation and selectivity of different products, and (iii) the effect of variation of physicochemical properties of defective TiO2 synthesized using different methods on the photocatalytic conversion of CO2. The review also discusses the limitations and the challenges of defective TiO2 photocatalysts that need to be overcome for the production of sustainable fuel utilizing solar energy.
1. Introduction
Extensive use of fossil fuels leads to the depletion of natural resources and is a major source of anthropogenic CO2. Hence, there is an active search going on for the replacement of fossil fuels with renewable energy sources.1,2 According to the International Panel on Climate Change (IPCC) prediction, by 2100, the global temperature may rise by 1.9 °C, due to continuous increase in anthropogenic CO2.3 Thus, CO2 capture, utilization, and storage are key in reducing its increased concentration in the earth's atmosphere. The use of solar energy, an abundant and renewable source of energy available on the earth, is one of the best solutions to tackle energy challenges. The total solar energy falling on the earth is 1.3 × 10⁵ TW, which is four orders of magnitude higher than the current overall human energy consumption (1.85 × 10 TW in 2017). Conversion of inexhaustible solar energy into renewable energy carriers such as electricity using solar cells or hydrogen generated by photocatalytic water splitting is a promising approach. However, the storage of the renewable electricity generated from solar cells, as well as hydrogen gas, is challenging, preventing the development of these technologies.The catalytic conversion of CO2 to fuels and chemicals using solar energy can provide a solution to excessive anthropogenic CO2 in the atmosphere as well as an alternative to the storage of electricity or hydrogen gas. Photocatalytic CO2 conversion offers a viable solution for the abatement of climate change by converting CO2 into valuable fuels using solar energy.4–8 The use of CO2 from the atmosphere as a carbon source and its conversion into the hydrocarbons (fuel) which can be further utilized as an energy source in a closed-loop is often termed as ‘artificial photosynthesis’.9
The first report on photocatalytic CO2 reduction came in 1978 by Halmann et al.10 They studied the photoelectrochemical conversion of CO2 to formic acid, formaldehyde, and methane under UV-visible light illumination using single crystal gallium phosphide. In 1979, Inoue et al.11 reported the generation of organic compounds like formic acid, formaldehyde, methanol and methane by photocatalytic CO2 conversion using an aqueous suspension of different semiconductors such as WO3, TiO2, CdS, GaP, SiC, and ZnO under UV-visible light illumination.11 After these initial discoveries, although a large number of photocatalysts have been explored, the desired productivity, selectivity, and catalyst stability have not yet been achieved.
The efficiency of the photocatalytic processes lies in the development of a suitable semiconductor as a photocatalyst having extensive absorption in the visible region of solar light, low rate of recombination of charge carriers and stability. Among various semiconductors, TiO2 is widely studied as a photocatalyst because of its properties such as inexpensiveness, chemical and thermal stability, low toxicity and desired conduction and valence band edge for CO2 reduction.12–15 However, the photocatalytic activity of TiO2 is low in solar light, due to poor absorption in the visible region, which constitutes 43% of the solar spectrum, and a high rate of recombination of photogenerated charge carriers.16–20 To address these issues, different strategies were adopted, such as heteroatom doping, heterojunction formation, dye sensitization, defect engineering etc.21–30
Among these, defect engineering holds promise as the presence, concentration and distribution of defects play a key role in tuning the electronic, chemical and surface properties of TiO2. It was reported that the light absorption property of TiO2 can be extended up to the IR region and also, the defect sites assist in adsorption and activation of the CO2 molecule.4 Not only the oxygen vacant site but also the uncoordinated bonds near the oxygen vacant sites help in the activation of the CO2 molecule.4
There are few review articles published on the application of defective TiO2 for CO2 conversion.31–34 However, they have not discussed the impact brought about by introducing defects using different synthesis methodologies on the electronic, surface and chemical properties of TiO2 and its correlation with the photocatalytic CO2 conversion, which is the main focus of this review article. Moreover, this article also encompasses both theoretical and experimental studies carried out on defective TiO2 to understand the adsorption and activation of CO2 molecules and the mechanistic insights. This review article discusses the recent development in photocatalytic CO2 conversion using defective TiO2. It includes the general mechanism and thermodynamic criteria for defective TiO2 catalyzed CO2 conversion, the theoretical investigation on the role of defects in CO2 adsorption and activation, and the mechanism responsible for the formation and selectivity of different products. It also summarizes the effect of variation of structural and electronic properties of defective TiO2 synthesized using various protocols on the photocatalytic conversion of CO2 into value-added products.
2. General mechanism and thermodynamic criteria for photocatalytic CO2 conversion
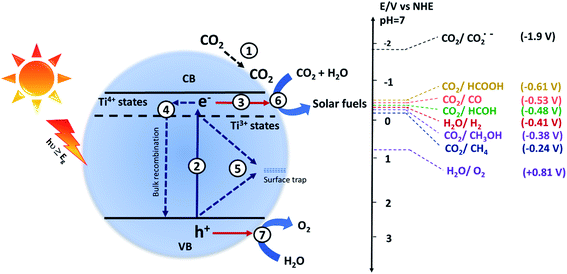
The photocatalytic CO2 conversion process using semiconductor-based catalysts involves the following steps: (1) CO2 adsorption on the surface of the catalyst, (2) generation of electron and hole pairs after the absorption of light, (3) separation and transfer of charges to the surface active sites, and the generated charges may recombine back in the (4) bulk or (5) on the surface, (6) reduction of the adsorbed CO2 by accepting an electron, and (7) oxidation of water to give oxygen. The processes occurring on the semiconductor surface are given in Fig. 1. Photocatalytic CO2 conversion is a complex process and different pathways result in different products.4 The potential energy (E0 V vs. NHE at pH 7) required to form different products such as carbon monoxide (CO), formic acid (HCOOH), formaldehyde (HCOH), methanol (CH3OH), methane (CH4), hydrogen (H2) and oxygen (O2) is given as follows:| CO2 + e− → CO2˙−, E0 = −1.90 V | (1) |
| CO2 + 2H+ + 2e− → HCOOH, E0 = −0.61 V | (2) |
| CO2 + 2H+ + 2e− → CO + H2O, E0 = −0.53 V | (3) |
| CO2 + 4H+ + 4e− → HCHO + H2O, E0 = −0.48 V | (4) |
| CO2 + 6H+ + 6e− → CH3OH + H2O, E0 = −0.38 V | (5) |
| CO2 + 8H+ + 8e− → CH4 + 2H2O, E0 = −0.24 V | (6) |
| 2H+ + 2e− → H2, E0 = −0.41 V | (7) |
| 2H2O → O2 + 4H+ + 4e−, E0 = +0.81 V | (8) |
The water reduction process involves two electrons, whereas the reduction of CO2 to organic products is a multielectron process. The water reduction process can compete with the CO2 reduction reaction, and therefore, it is essential to tailor the surface of the photocatalyst in such a way that it will preferentially reduce CO2 rather than water. Also, the single-electron transfer to the CO2 molecule has the highest reduction potential i.e. −1.9 V vs. NHE (at pH = 7); hence it is the rate-limiting step in most of the photocatalytic CO2 conversion reactions.35
3. Defective TiO2 as a photocatalyst
3.1 Background
In 2011, Chen et al.36 reported “black TiO2” where the light absorption of anatase TiO2 could be enhanced until 1200 nm by introducing a shell of a disordered surface layer over the core crystalline TiO2 nanocrystal via a hydrogenation process. HR-TEM images after hydrogenation showed the presence of a disordered layer and a crystalline core. The hydrogenation process was carried out at 200 °C under 20 bar pressure of H2 gas for five days. TiO2 synthesized by this method is referred to as black TiO2. The black TiO2 showed enhanced photocatalytic H2 generation in visible light with a yield of 10![[thin space (1/6-em)]](https://www.rsc.org/images/entities/char_2009.gif) 000 μmol g−1 h−1. They attributed the enhanced photocatalytic activity to the improved light absorption of black TiO2 until 1200 nm, having an optical bandgap of 1.54 eV. The introduction of mid-gap electronic states within the bandgap of TiO2 was due to the presence of lattice disorder with H atom doping, which improved light absorption.
000 μmol g−1 h−1. They attributed the enhanced photocatalytic activity to the improved light absorption of black TiO2 until 1200 nm, having an optical bandgap of 1.54 eV. The introduction of mid-gap electronic states within the bandgap of TiO2 was due to the presence of lattice disorder with H atom doping, which improved light absorption.
After this discovery, a range of methodologies for defect creation was adopted to improve the light absorption of TiO2 in the visible region. Defects were generated in TiO2 using different synthesis methodologies such as hydrogen gas treatment, inert gas treatment, plasma treatment, metallothermic reduction, using a reducing agent, bombardment with high energy particles, hydrolysis of Ti4+ salt in the presence of a reductant, doping with a heteroatom, etc.31–34
3.2 Role of defects in CO2 adsorption–activation and light harvesting
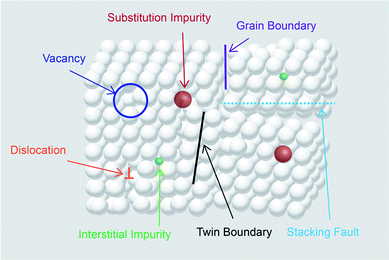
The electronic, optical, surface and chemical properties of TiO2 are dependent on the type and concentration of the defects present in it. These properties play a crucial role in determining the photocatalytic activity of the material. Defects in crystals are classified depending on the dimensionality as 0D point defects, 1D line defects, 2D planar defects and 3D bulk defects.37 Point defects in TiO2 include Ti vacancies, oxygen vacancies, and Ti interstitial and substitutional or interstitial impurity.37,38 Line defects are described as extended dislocations.39 2D defects (planar defects) contain grain boundaries, twin boundaries and stacking faults. Bulk defects (volume defects) include inclusions, cracks, voids and pores.37Fig. 2 shows the types of defects present in the crystal.The generation of oxygen vacancies is the easiest as compared to the generation of interstitial vacancies.40 Oxygen removal leaves behind two electrons at the vacant oxygen site. These electrons were accepted by the adjacent Ti4+ present near the oxygen vacant site to generate Ti3+ sites.41 The preliminary step in CO2 conversion is the adsorption of CO2 molecules on the catalyst surface. The presence of oxygen defects not only facilitates the reduction of the bandgap of pristine TiO2 but also generates active sites for CO2 adsorption and activation, thus making it a suitable candidate for photocatalytic CO2 conversion using solar energy. Several theoretical studies have been performed to understand the role of defects in CO2 activation and conversion into different products.
Oxygen vacant sites offer a stronger binding site for CO2 adsorption. Thompson et al.42 studied the adsorption and desorption of CO2 on the oxidized and defective TiO2 (110) surfaces by temperature-programmed desorption. In the case of a fully oxidized surface, CO2 binds to the fivefold coordinated Ti4+ atoms, whereas in the case of the defective TiO2 surface, CO2 binds to both the regular sites and to the oxygen vacant sites. They also found that the CO2 binds to the oxygen vacant sites with a higher binding energy of 54 kJ mol−1 than the regular sites (48.5 kJ mol−1).
Huygh et al.43 studied the adsorption, dissociation and diffusion of CO2 on the oxidized and reduced (001) surfaces of anatase TiO2 using density functional theory (DFT) calculations with long-range dispersion energy corrections. Fig. 3a shows the different vacancy sites present on the (001) anatase surface, namely VO1, VO2, VO3 and VO4. They identified the monodentate carbonate structure as the stable adsorption configuration after the interaction of CO2 with the oxidized surface. A small energy barrier exists for the conversion of physisorbed CO2 to a chemisorbed one. CO2 dissociation is not possible on an oxidized surface because of having a barrier of 113.6 kcal mol−1. However, the presence of an oxygen vacancy provides a new, highly stable adsorption configuration of CO2 with the elongation of the C–O bond (Fig. 3b). The activation of the C–O bond results in exothermic dissociation of CO2 with a barrier of 22.2 kcal mol−1. The CO2 dissociation on the vacant oxygen site has a lower barrier than on the oxidized surface as the former provides a way to stabilize the end product by taking up the oxygen from CO2 to fill the vacant oxygen site. This results in the formation of a CO molecule, which is desorbed by filling the vacant site.
 | ||
| Fig. 3 (a) Type of oxygen vacancies on the (001) surface of anatase TiO2 (Ti = gray, O = red, oxygen vacancy = yellow) and (b) adsorption configurations of CO2 on the reduced TiO2 anatase surface with different vacancies in side view (upper panel) and top view (lower panel) (Ti = blue, OTiO2 = red, OCO2 = red and yellow plus sign and C = brown) (reproduced from ref. 43 with permission from the American Chemical Society, copyright 2016). | ||
Lee et al.44 studied the electron-induced dissociation of CO2 adsorbed at the oxygen vacant site on the TiO2 (110) surface by scanning transmission microscopy (STM). Fig. 4a shows the schematic of the TiO2 (110) surface having the oxygen vacancy (VO), bridged hydroxyl group (OHb) and CO2 adsorbed at the vacant site. The inset shows the tilted configuration of CO2 adsorbed at the vacant oxygen site. They found that the most stable adsorption of CO2 at the vacant site was a nearly linear configuration with an adsorption energy of 0.44 eV. Fig. 4b shows the STM images recorded after exposure to CO2 at 55 K. The inset shows the STM images of the same area before and after CO2 thermal diffusion. They observed that the two CO2 molecules shown in the dotted ellipse in the upper inset diffused away from their VO site, leaving behind two intact VO sites as seen in the dotted ellipse of the lower inset. This revealed that the CO2 was adsorbed at the VO site. Fig. 4c shows that 1.7 V is the threshold energy required for the dissociation of CO2 and the probability of dissociation depends on the energy of the injected electron from STM tip.
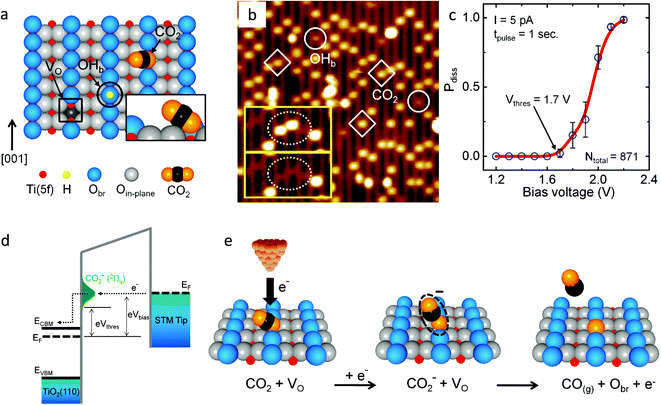 | ||
| Fig. 4 (a) Schematic showing the oxygen vacancy (VO, in a black color square), bridged hydroxyl group (OHb, black color circle) and CO2 molecule adsorbed at the VO site on the reduced TiO2 (1) (1 × 1) surface. The fivefold-coordinated Ti(5f) atoms and bridged oxygen (Obr) are indicated in red and blue, respectively. The inset shows that the molecular axis of CO2 is perpendicular to the direction of the bridging-oxygen row ([001] azimuth) and is tilted away from the surface normal by 57°; (b) STM image (1.5 V, 5 pA, 15 nm × 15 nm) of the TiO2 (110) surface after adsorption of CO2 at 55 K. Three CO2 and two OHb features are shown as diamonds and circles, respectively. The inset shows two STM images (5.1 nm × 2.6 nm) of the same area on the surface. The upper inset shows two CO2 molecules (in the dotted ellipse) that diffused away from their VO sites, leaving two intact VO sites visible, as shown in the lower inset image; (c) dissociation probability (Pdiss) plotted as a function of bias voltage. The threshold voltage was Vthres = +1.7 V, and Pdiss approached 1 at +2.2 V. (d) The electron-transfer process at the STM tip/CO2/TiO2 interface. Above eVthres = 1.7 eV, the electrons start to tunnel into the negative-ion state of the adsorbed CO2 and (e) schematics of an electron-induced CO2 dissociation process (reproduced from ref. 44 with permission from the American Chemical Society, copyright 2011). | ||
The electron from the Fermi level of STM tip can tunnel into CO2 to form CO2− in the 2Πu state if the energy of the electron is greater than 1.7 eV (Fig. 4d). As the Fermi level lies 0.3 eV below the CB, the threshold energy is located 1.4 eV above the CB. They demonstrated that the dissociation of CO2 is a one-electron process with a threshold energy of 1.4 eV above the conduction band minimum of TiO2. The CO2 adsorbed at the oxygen vacant sites dissociates by accepting an electron and heals the vacancy by the oxygen released during dissociation reaction (Fig. 4e). The CO molecule formed could be desorbed from the surface by the excess energy gained during the dissociation process. The formation of CO2− species is the key intermediate in CO2 dissociation. Similar results were also reported by Tan et al.45 where they studied the activation of CO2 on the rutile TiO2 (110) (1 × 1) surface by injecting an electron to CO2 by in situ STM at 80 K.
The presence of point defects creates energy levels within the bandgap and hence light absorption by TiO2 can extend up to the near IR region. Hossain et al.46 used Ab initio density functional theory to calculate the formation energy of intrinsic point defects and position of the defect-induced energy levels within the bandgap of reduced rutile TiO2−x. They reported the energy levels for the oxygen vacancy (VO), titanium vacancy (VTi) and titanium interstitial (Tiint) as 1.17, 1.15 and 1.23 eV, respectively (Fig. 5). The presence of these defects can be thoroughly analyzed by the scanning transmission microscopy (STM) in combination with density functional theory (DFT), high-resolution transmission electron microscopy (HR-TEM), positron annihilation spectroscopy (PAS), electron paramagnetic resonance (EPR), magnetism testing, temperature-programmed desorption (TPD), Fourier transform infrared spectroscopy (FTIR), optical absorption spectroscopy, X-ray photoelectron spectroscopy (XPS), and Raman spectroscopy.31–34
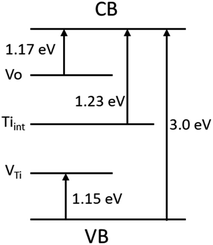 | ||
| Fig. 5 Energy levels formed due to the presence of defects such as oxygen vacancy, titanium vacancy and titanium interstitial within the bandgap of reduced rutile TiO2−x. Energy levels were taken from ref. 46. | ||
3.2 Mechanistic pathways for photocatalytic CO2 conversion using defective TiO2
Two pathways were proposed based on the adsorption and the binding of CO2 to the catalyst surface. One is the carbene pathway and the other is the formaldehyde pathway.47 In the carbene pathway, the CO2˙− radical is formed by accepting an electron from the TiO2 catalyst. CO2˙− binds in a bidentate mode to the two Ti atoms on the surface via a carbon atom. These radicals undergo reduction by accepting hydrogen radicals and electrons to form CO. The adsorbed CO on further reduction in multiple steps gives a ˙CH radical, carbene, and a methyl radical as intermediates to finally give methanol or methane as the final product.In the formaldehyde pathway, the carboxy radical (˙COOH) is primarily formed as a result of binding of the CO2 molecule in a monodentate mode either through binding of the oxygen atom of CO2 to Ti or binding of the oxygen atom of the surface to the carbon atom of the CO2. The ˙COOH forms formic acid by accepting hydrogen radicals. On further reduction of formic acid, formaldehyde, methanol and methane is produced through a series of electron transfer and dehydrating steps.
To understand the mechanism of CO2 reduction on the perfect and defective (101) surfaces of anatase TiO2, Ji et al.48 carried out first principles calculation. They concluded that in the case of both defective and non-defective TiO2, the fast hydrogenation (FH) pathway, generally known as the formaldehyde pathway, is most preferred over the fast deoxygenation (FDO) pathway (known as the carbene pathway). FDO is not possible due to the formation of the energetically unfavorable ˙C intermediate. They also found that the surface oxygen vacancies are more active than Ti atoms on the surface. A new mechanism was proposed to explain the selectivity of the reaction in which fast hydrogenation occurs at both Ti as well as oxygen vacancies and is shown in Fig. 6. On the VO site, the deoxygenation of CO2 is easier and the two electrons provided by the defect sites could prevent the photooxidation of the intermediate species and promote their further reduction.
 | ||
| Fig. 6 Reaction pathway for the photocatalytic CO2 conversion (red and black color font indicate the species adsorbed at the oxygen vacancy and on surface Ti, respectively) (reproduced from ref. 48 with permission from the American Chemical Society, copyright 2016). | ||
To further understand the mechanism proposed by Ji et al.,48 Liu et al.49 performed a DFT calculation to study the pathway for methane and methanol formation from CO2 reduction over the defective anatase phase of TiO2 with the (101) surface. They found that the reaction proceeds through the two plausible pathways (Fig. 7) as follows CO2 → CO(A)(CO(B)) → CHO(CHO) → CHOH(CH2O) → CH2OH(CH3O) → CH3OH* or CH4. CO(A) and CO(B) stand for a more stable monodentate configuration with C binding to Ti3+ and a less stable bidentate configuration of CO on the VO site of the surface, respectively. The desorption energy of methanol is high as 1.66 eV, indicating that it will be difficult to desorb from the VO site of the surface and thus stable on the surface at room temperature. The barrier for the conversion of adsorbed methanol to CH3 is very low i.e., 0.18 eV, and thus, the formation of CH3 is more favorable than the desorption of the adsorbed methanol. Methane is expected as the reaction product as the desorption energy of methane is only 0.20 eV. The predicted mechanism matches with the experimental findings as CO and CH4 were the experimentally observed products.
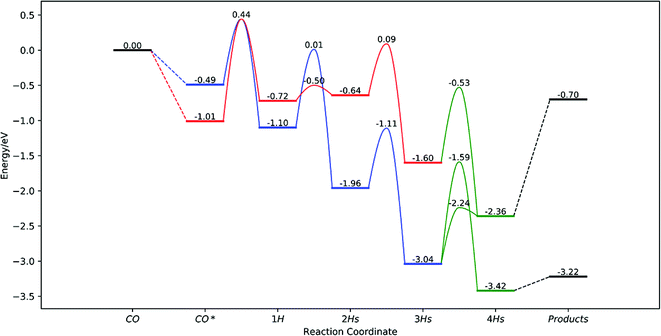 | ||
| Fig. 7 Overall potential energy surface from CO to CH4. Black, red, blue, and green bars and curves represent a desorption state, the most favorable pathway for CO(A), the most favorable pathway for CO(B) and pathways after merged, respectively (reproduced from ref. 49 with permission from the American Chemical Society, copyright 2019). | ||
Furthermore, they also considered a carbene-like deoxygenation pathway to form the CH species on the vacant site, which could generate methane by successive hydrogenation steps.49 The proposed direct deoxygenation and hydrogenation pathway is CO2 → CO(A) → CHO → CHOH → CH → CH2 → CH3 → CH4. The rate-limiting step in this pathway is CHOH → CH with a barrier of 1.96 eV, which is much lower than that reported by Ji et al.48 All the pathways from CO2 are thermodynamically feasible but the barriers between the steps are high mainly in the carbene pathway. The energy via electric field or electrochemical potential could be used to increase the rate of the reaction and, thus, product yield. From the theoretical study, it was concluded that the formaldehyde pathway is more preferred over the carbene pathway for CO2 conversion in defective TiO2. Methane formation is preferred over methanol due to its high desorption energy.
4. Defect generation in TiO2 and its impact on photocatalytic CO2 conversion
The various synthesis procedures, the physicochemical changes in TiO2 due to the presence of defects and applications of defective TiO2 for photocatalytic CO2 conversion are summarized in this section. Point defects in TiO2 can be introduced by different ways, such as reduction using hydrogen gas, inert gas treatment, a reducing agent like NaBH4, metallothermic reduction by using metals like Al, Mg, Li, Zn, etc, bombardment with high energy particle such as electron beam, proton beam, hydrogen plasma, electrochemical reduction method, doping with a heteroatom, etc. The details of the synthesis methodologies have been given in more detail in several other articles.31–34,37 This review primarily focuses on the defects generated using different synthesis methodologies and their impact on the physicochemical and photocatalytic properties of TiO2.4.1 Defect generation under a reducing atmosphere
The general representation of the TiO2 reduction reaction in the presence of hydrogen gas can be given by the below equation. The hydrogen reacts with the lattice oxygen of TiO2 to form oxygen vacancies and Ti3+ in TiO2.
| TiO2 + H2 → TiO2−x + H2O | (9) |
The chemical properties of TiO2 nanomaterials are greatly affected by their size, morphology, shape, exposed facets on the surface and the concentration of defects.31 These factors make hydrogen thermal treatment more complicated. The experimental parameters such as the amount of TiO2, pressure and concentration of the hydrogen and reaction temperature and time affect the chemical, optical and electronic properties as well as the concentration of defects in the hydrogenated TiO2. Hydrogenation helps in the generation of the Ti3+ sites as well as cleaning the surface of the photocatalyst. Recently, Liu et al.51 synthesized TiO2 nanotubes/nanowires with exposed {111} facets by heating a mixture of titanium(IV) oxysulfate–sulfuric acid hydrate, glacial acetic acid and water. These as-synthesized TiO2 nanotubes/nanowires were hydrogenated at 650 °C under H2 gas flow of 2.0 L h−1 for 6, 9, 12 and 18 h and referred to as TiO2-6, TiO2-9, TiO2-12 and TiO2-18, respectively. No change in morphology after hydrogenation was observed. The hydrogenation process causes the expansion and distortion of the TiO2 crystal lattice as revealed from the XRD pattern. The chemical reactions that occurred on the surface during hydrogenation are shown in the schematic in Fig. 8a. The absorption band corresponds to SO42− and CH3COO− species which accumulated in the course of synthesis and disappeared completely after 6 h of hydrogenation (Fig. 8b). During the hydrogenation process, these species get removed and the surface becomes clean. The amount of Ti3+ increases with an increase in the hydrogenation time, as revealed from the XPS spectra. Fig. 8c shows that the light absorption enhanced in the visible region with the increase in the duration of hydrogenation. The bandgap value varies from 3.40 eV for TiO2 to 2.64 eV for TiO2-18.
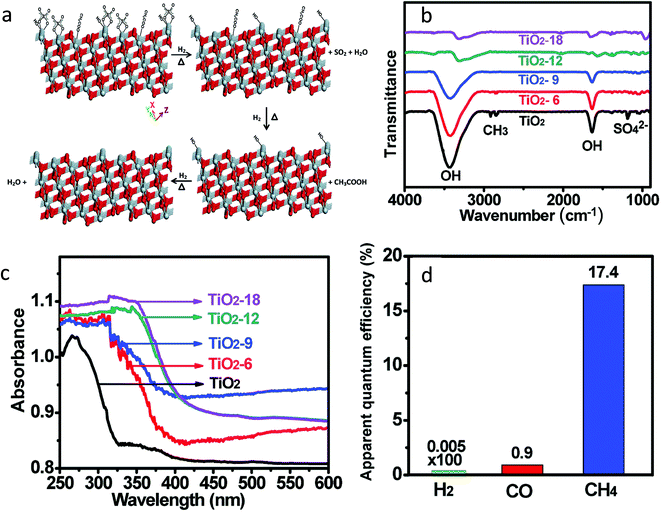 | ||
| Fig. 8 (a) Schematic of the chemical reaction that occurred on the surface of the TiO2 during hydrogenation (gray color: Ti and red color: O), (b) FTIR spectra of non-hydrogenated and hydrogenated TiO2 samples, (c) diffuse reflectance spectra of TiO2 and hydrogenated samples and (d) apparent quantum efficiency (AQE) for H2, CO and CH4 using the TiO2-12 sample (reproduced from ref. 51 with permission from the Royal Society of Chemistry, copyright 2019). | ||
Photocatalytic CO2 conversion was carried out in the presence of isopropanol as a sacrificial reagent at 0.2 MPa of CO2 and 373 K temperature. The photocatalytic CO2 reduction activity increases in the order P25 < TiO2 < TiO2-6 < TiO2-9 < TiO2-12 < TiO2-18, indicating that the activity of TiO2 nanostructures could be increased by hydrogenation. H2, CO and CH4 were generated at a rate of 2.11, 463.2 and 1708.08 μmol g−1 h−1 using TiO2-12, respectively. 17.4% apparent quantum efficiency (AQE) for methane generation was observed using a hydrogenated TiO2-12 sample (Table 1, Fig. 8d). The improved activity was attributed to the exposed clean {111} facets and enhanced light absorption. The author proposed a mechanism where photogenerated electrons and holes transferred to TiO2 (111) and (![[1 with combining macron]](https://www.rsc.org/images/entities/char_0031_0304.gif)
![[1 with combining macron]](https://www.rsc.org/images/entities/char_0031_0304.gif)
![[1 with combining macron]](https://www.rsc.org/images/entities/char_0031_0304.gif) ) surfaces due to the generated spontaneous electric field between the two polar planes, respectively. Thus, the redox reaction takes place at two different Ti–TiO2 (111) and O–TiO2 (
) surfaces due to the generated spontaneous electric field between the two polar planes, respectively. Thus, the redox reaction takes place at two different Ti–TiO2 (111) and O–TiO2 (![[1 with combining macron]](https://www.rsc.org/images/entities/char_0031_0304.gif)
![[1 with combining macron]](https://www.rsc.org/images/entities/char_0031_0304.gif)
![[1 with combining macron]](https://www.rsc.org/images/entities/char_0031_0304.gif) ) polar planes. This resulted in a better separation of charge carriers and improved photocatalytic activity.
) polar planes. This resulted in a better separation of charge carriers and improved photocatalytic activity.
| Sr no. | Reference | Chemicals used to create defects | Photocatalytic experimental conditions | Light source used | Products | Yield | AQE/SFE |
|---|---|---|---|---|---|---|---|
| 1 | Liu et al.51 | H2 gas | 10 mg catalyst dispersed in 1.0 mL (CH3)2CHOH and 4.0 mL H2O, (0.2 MPa) CO2 | 300 W Xe lamp | CH4 | 1708.1 μmol g−1 h−1 | AQE: 17.40% |
| CO | 463.2 μmol g−1 h−1 | — | |||||
| H2 | 2.11 μmol g−1 h−1 | — | |||||
| 2 | Xuan et al.52 | H2 gas | 25 mg of catalyst, CO2 was generated inside the reactor | 300 W Xe lamp, intensity on the sample was 0.5W cm−2 | CH4 | 124.3 μmol g−1 h−1 | — |
| CO | 14.7 μmol g−1 h−1 | — | |||||
| 3 | Billo et al.53 | H2 gas | CO2 bubbled through water, co-catalyst: Ni | 300 W Xe lamp | CH3CHO | 10 μmol g−1 in 6 h | — |
| 4 | Fu et al.54 | H2 gas | 100 mg of catalyst, CO2 bubbled through water | Solar simulator AM 1.5 | CH3CHO | 11.3 μmol g−1 in 6 h | — |
| CH3OH | 1.2 μmol g−1 in 6 h | — | |||||
| 5 | Ye et al.55 | H2 gas | Sample concentration 1 g L−1, CO2 flow rate 100 mL min−1, NaOH = 0.20 mol L−1, Na2SO3 = 0.20 mol L−1, reaction temperature 5 °C | 300 W Xe lamp | CO | 12.1 μmol g−1 h−1 | — |
| 6 | Liu et al.56 | H2 gas | 50 mg catalyst, CO2 passed through water | 150 W solar simulator (90 mW cm−2) | CH4 | 4.4 μmol g−1 in 6.5 h | — |
| CO | 25 μmol g−1 in 6.5 h | — | |||||
| 7 | Li et al.57 | N2![[thin space (1/6-em)]](https://www.rsc.org/images/entities/char_2009.gif) : :![[thin space (1/6-em)]](https://www.rsc.org/images/entities/char_2009.gif) H2(9 H2(9![[thin space (1/6-em)]](https://www.rsc.org/images/entities/char_2009.gif) : :![[thin space (1/6-em)]](https://www.rsc.org/images/entities/char_2009.gif) 1) 1) |
50 mg catalyst dispersed in 2 mL of water, CO2 gas passed through it temperature: 393 K, co-catalyst: CoOx | 150 W UV lamp (20 mW cm−2 at 365 nm) | CH4 (selectivity: 71.02%) | 10.1 μmol g−1 h−1 | 0.0126 |
| CO (selectivity: 28.98%) | 16.4 μmol g−1 h−1 | — | |||||
| 8 | Sorcar et al.59 | NaBH4 | 40 mg of catalyst, moist CO2 (40 mL min−1), co-catalyst: Pt (0.33 wt%) | 100 W Xe solar simulator (AM1.5 filter) | CH4 | 80.3 μmol g−1 h−1 | 12.4 |
| 9 | Sorcar et al.60 | NaBH4 | 40 mg of catalyst, moist CO2 (40 mL min−1), co-catalyst: Pt 1 wt% | 100 W Xe solar simulator (AM1.5 filter) | C2H6 | 77 μmol g−1 in 7 h | 2.7 |
| CH4 | 259 μmol g−1 in 7 h | 5.2 | |||||
| 10 | Sorcar et al.61 | NaBH4 | 40 mg of catalyst, moist CO2 (40 mL min−1), co-catalyst: Cu–Pt | 100 W Xe solar simulator AM1.5 filter | C2H6 | 150 μmol g−1 in 6 h | Total AQE: 86%, SFE: 1% |
| CH4 | 3000 μmol g−1 in 6 h | — | |||||
| 11 | Yan et al.62 | H2 plasma | 90 mg photocatalyst, CO2 bubbled through water | 550 W Xe-lamp with an AM 1.5 G filter, 100 mW cm−2 | CH4 | 14.03 nmol h−1 in 90 mg | — |
| CO | 21.67 nmol h−1 in 90 mg | — | |||||
| 12 | Liu et al.63 | He gas | 100 mg catalyst, CO2 and H2O vapor (H2O ≈ 2.3 v/v%), | 150 W solar simulator, AM1.5 filter; 90 mW cm−2 | CH4 + CO | 18.9 μmol g−1 in 6 h | — |
| 13 | Xin et al.64 | Oxidation-based hydrothermal method | Flow reactor (2 mL min−1) CO2 bubbled through water | 300 W Xe lamp, vis-light, 0.216W cm−2 (≥420 nm) | CH4 | 11.9 μmol g−1 h−1 | — |
| CO | 23.5 μmol g−1 h−1 | — | |||||
| 14 | Zhao et al.65 | Vacuum annealing | 20 mg catalyst dispersed over a quartz disc with a diameter of 50 cm2, CO2 from NaHCO3 and H2SO4 | 500 W Xe lamp, 0.220 W cm−2, (400–800 nm) | CO | 48.5 μmol g−1 in 6 h | — |
| CH4 | 8 μmol g−1 in 6 h | — | |||||
| 15 | Kar et al.66 | Flame reduction method | TiO2 nanotube array with an area of 1 cm × 2 cm, 50 psi CO2 pressure and 80 °C to vaporize the water, a few droplets of water were placed in the reactor beside the catalyst without direct contact with the catalyst | 300 W Xe lamp AM1.5 filter | CH4 | 156.5 μmol g−1 h−1 | — |
| 16 | Tu et al.67 | In situ simultaneous reduction–hydrolysis technique | 100 mg photocatalyst, CO2 at ambient pressure, 0.4 mL H2O | 300 W Xe lamp | CH4 | 8 μmol g−1 h−1 | — |
| C2H6 | 16.8 μmol g−1 h−1 | — | |||||
| 17 | Yin et al.69 | Aluminothermic reduction | 50 mg catalyst, 2 bar CO2, 6 mL H2O | 300 W Xe lamp | CH4 (selectivity: 74%) | 14.3 μmol g−1 h−1 | — |
| 18 | Gao et al.70 | Aluminothermic reduction | Two pieces of the black TiO2 NTAs catalyst – equivalent to 0.01 g TiO2, CO2 is introduced in solution | 300 W Xe lamp with a 420 nm cut-off filter | CO | 185.39 μmol g−1 h−1 | — |
| 19 | Wang et al.72 | Lithiothermic reduction | 100 mg photocatalyst, 0.4 mL water, CO2, co-catalyst: 1 wt% Pt | 300 W xenon arc lamp equipped with a UV light filter (∼100 mW cm−2) | CH4 (visible light) | 3.37 μmol g−1 in 8 h | — |
| CH4 (UV-visible light) | 8.85 μmol g−1 in 8 h | — | |||||
| 20 | Sasan et al.73 | One-step combustion and hydrothermal methods | 100 mg catalyst held on a Teflon holder, 4 mL liquid water at the bottom of reactor, CO2, co-catalyst: Cu(I)–Pd (1 wt%) | Xe lamp (300 W) with 400 nm cut-on filter | CH4 | ∼6 μmol g−1 in 6 h | — |
| 21 | Fang et al.74 | Hydrothermal method using HCl and a small amount of HF | 0.03 g of catalyst amount, 1 mL pure water, batch reactor, no co-catalyst | 300 W Xe lamp AM1.5 filter | CH4 | ∼0.9 μmol g−1 in 4 h | — |
| CO | ∼0.8 μmol g−1 in 4 h | — | |||||
| 22 | Liu et al.75 | NaBH4 reduction | 40 mg catalyst spread over a glass fiber filter, CO2 bubbled through water, temperature: 150 °C, no cocatalyst | 100 W Hg vapor lamp with 10 mW cm−2 at λ < 390 nm | CO (UV-visible) | 54.5 μmol g−1 in 5 h | 0.31 |
| 300 W Xe lamp with UV filter 28 mW cm−2 in visible range | (Visible) | 26.5 μmol g−1 in 5 h | 0.134 | ||||
| 23 | Liu et al.76 | Ultrathin nanosheets of TiO2 by hydrothermal synthesis | 10 mg of sample spread in a chamber, CO2 passed through water (0.08 MPa), co-catalyst: Pt | 300 W xenon lamp | CH4 | 66.4 μmol g−1 h−1 | — |
| CO | 54.2 μmol g−1 h−1 | — | |||||
| 24 | Shi et al.77 | Solvothermal method using HF | 50 mg sample, CO2 bubbled through water, H2O/CO2 = 2.3v/v% | 100 W mercury lamp (λ = 365 ± 10 nm) | CH4 | 2.49 μmol g−1 h−1 | — |
| 25 | Qingli et al.78 | Treatment of the Ti plate in H2O2 solution at 110 and 130 °C (hydrothermal treatment) | TiO2 film, CO2 bubbled through water | Two 300 W Xe lamps | CH4 | 12 μmol g−1 h−1 | — |
| CO | 115 μmol g−1 h−1 | — | |||||
| 26 | Liu et al.79 | Fluoride mediated self-transformation pathway | 30 mg of photocatalyst, Na2CO3 + H2SO4, batch reactor, cocatalyst: Au | 300 W Xe lamp | CO | ∼2.1 μmol g−1 h−1 | — |
| CH4 | ∼1.2 μmol g−1 h−1 | — | |||||
| 27 | Yin et al.80 | Solvothermal method with Li-dissolved EDA as solution. (Considerable number of defects (VO or Ti3+) existed in H–TiO2−x) | 50 mg catalyst, 2 bar CO2, 6 mL H2O | 300 W Xe lamp, simulated solar AM1.5 filter | CH4 | 16.2 μmol g−1 h−1 | — |
| CO | 4.2 μmol g−1 h−1 | — | |||||
| H2 | 13 μmol g−1 h−1 | — | |||||
| 28 | Zhu et al.81 | In situ photodeposition of Cu generates in situ oxygen vacancies | 30 mg catalyst,6 μL of water | 300 W commercial Xe lamp | CH4 | 8.68 μmol g−1 h−1 | — |
| 29 | Lan et al.82 | No such defect is created. Doping of Cu metal by the solvothermal method induced oxygen vacancies | 30 mg of catalyst, CO2 bubbled through solution | 300 W Xe lamp | CO | 32.5 μmol g−1 h−1 | — |
| 30 | Pham et al.83 | Codoping of Ag and Cu into the TiO2 lattice | 2 g of catalyst CO2 passed through water was injected inside the reactor | Visible light. (Two 20 W bulbs of 0.05 W cm−2) | CO | 550 μmol g−1 in 6 h | — |
| CH4 | 880 μmol g−1 in 6 h | — | |||||
| 31 | Pham et al.84 | Co-doping of V and Cu into TiO2 lattice | 2 g of catalyst CO2 was injected inside the reactor | Visible light. (Two 20 W bulbs of 0.05 W cm−2) | CH4 | 933 μmol g−1 in 6 h | — |
| CO | 588 μmol g−1 in 6 h | — | |||||
| 32 | Wang et al.85 | Cobalt-doped titanium dioxide | 100 mg of photocatalyst dispersed on a porous quartzose film in the reaction cell, and 3 mL of deionized H2O and 80 kPa pure CO2 gas | A 300 W xenon arc lamp with an L-42 glass filter was used as the light source lamp with a cut-off filter (λ > 420 nm) | CH4 | 0.09 μmol g−1 h−1 | — |
| CO | 1.94 μmol g−1 h−1 | — | |||||
| H2 | 0.74 μmol g−1 h−1 | — | |||||
| O2 | 0.133 μmol g−1 h−1 | — | |||||
| 33 | Yaghoubi et al.86 | Oxygen vacancy and Ti3+ originated during synthesis (synthesis form peroxo-titanium complex) | 100 mg of photocatalyst + CO2 bubbled through water, (20 psi pressure), 40 °C | Both solar and visible light 300 W Xe lamp | CH4 (solar light) | 79.5 ppm g−1 h−1 | 0.0289 (250–564 nm) |
| Solar light 80 mW cm−2 | CO (solar light) | 303 ppm g−1 h−1 | — | ||||
| Visible light 408 to 1650 nm | CH4 (visible light) | 60 ppm g−1 h−1 | — | ||||
| CO (visible light) | 226 ppm g−1 h−1 | — | |||||
| 34 | Han et al.87 | TiB2 is used to prepare (self doped) Ti+3 in TiO2 | 30 mg catalyst was dispersed into 20 mL of N,N-dimethylformamide and 10 mL ultrapure water | 300 W Xe lamp | CO (simulated solar light) | 724 μmol g−1 h−1 | — |
| H2 (simulated solar light) | 5.5 μmol g−1 h−1 | — | |||||
| CO (visible light) | 58 μmol g−1 h−1 | — | |||||
| 35 | Shi et al.88 | In situ pyrolysis of MIL-125-NH2 (Ti) with melamine | 5 mg photocatalyst dispersed in 5 mL of solution of 4 mL of methyl cyanide (MeCN) solvent, 1 mL of (TEOA), bipyridine (bpy) (10 mmol L−1) and 25 μL of 20 mmol L−1 CoCl2 purged with CO2, co-catalyst: Co(bpy)32+ | 300 W xenon lamp | CO | 388.9 μmol g−1 in 5 h | — |
| UV cut-off filter (λ > 400 nm) | H2 | 75 μmol g−1 in 5 h | — | ||||
| 36 | Feng et al.89 | During MgO deposition by ALD | 10 mg photocatalyst loaded over glass fiber paper, CO2 passed through water, no co-catalyst | 450 W Xe lamp | CO | 54 μmol g−1 in 4 h | — |
Furthermore, the effect of particle size on the degree of hydrogenation and its impact on photocatalytic CO2 conversion was studied by Xuan et al.52 In this work, the TiO2 nanoparticles were loaded over dendritic porous silica nanospheres (DPSNs), also known as dendritic fibrous nanosilica (DFNS). The particle size of TiO2 was tuned from 1–2 to 9–12 nm by varying the amount of titanium isopropoxide precursor. To create oxygen vacancies, hydrogen thermal reduction treatment at ambient pressure was carried out by flowing a mixture of gas containing 5 vol% H2 and 95 vol% argon at 600 °C for 3 h. The synthesis methodology is given in Fig. 9a. Samples were referred to as DPSNs@X% TiO2−x where x is the weight ratio of TiO2/DPSNs. The only signal that corresponded to the oxygen vacancy was observed in the EPR spectrum. The sample DPSNs@X% TiO2−x (X% ≤ 20%) having a particle size of 1–3 nm of TiO2−x nanoparticles (NPs) showed CO as the only product of CO2 conversion, whereas 3–12 nm TiO2−x NPs on DPSNs@X% TiO2−x (X% ≥ 40%) showed the generation of both the CO and CH4 (Fig. 9b). The maximum CH4 and CO generation at a rate of 124.3 and 14.7 μmol g−1 of TiO2−x h−1 was observed using DPSNs@80% TiO2−x having a particle size of 8–12 nm of TiO2−x, respectively. They found that 1–3 nm TiO2−x nanoparticles showed a higher reduction degree during hydrogen thermal treatment leading to a higher decrease in the bandgap. This could have resulted in the lowering of the reduction power of the electrons, which inhibited the kinetics of the reduction reaction of CO2 to methane involving eight electrons (Fig. 9c and d). The exact reason for the improved selectivity of 89.4% for methane production in DPSNs@80% TiO2−x was unclear and they attributed it to the improved light absorption efficiency and suitable CB edge, which help maintain the reduction ability of photogenerated electrons. The other factors such as the better dispersion of particles, appropriate particle size, highly accessible specific surface area, the lower recombination rate of photogenerated charge carriers, and enhanced carrier transfer and separation also contributed to the improvement of the photocatalytic CO2 conversion yield in DPSNs@80% TiO2−x.
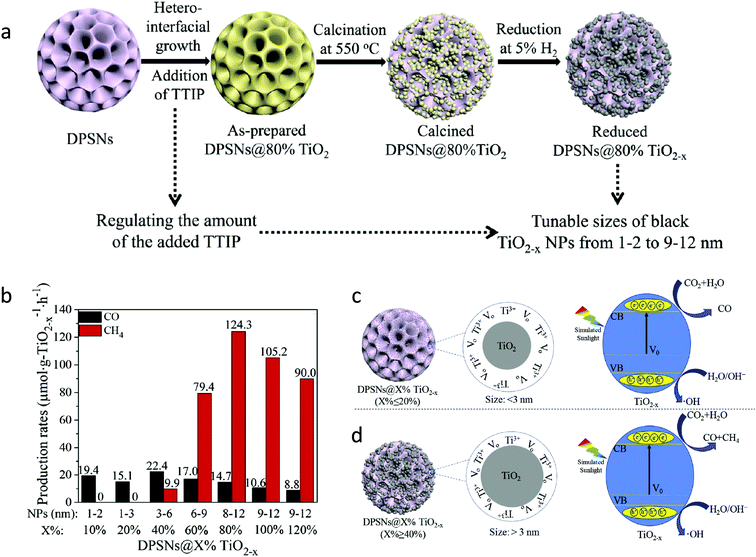 | ||
| Fig. 9 (a) Synthesis protocol for reduced DPSNs@X% TiO2−x NPs, (b) photocatalytic CO2 conversion using different samples, (c and d) a probable mechanism for the different activity and selectivity of DPSNs@X% TiO2−x NPs with the varied particle size of black TiO2−x NPs for CO2 conversion (reproduced from ref. 52 with permission from Elsevier, copyright 2019). | ||
Hydrogenation using H2 atmosphere was also beneficial to reduce metal ions into metals along with the generation of oxygen vacancies and Ti3+ in TiO2. Billo et al.53 introduced dual active sites, Ni nanocluster and the oxygen vacancies for the enhanced CO2 conversion. For this, Ni nanocluster supported oxygen-deficient black TiO2 was synthesized via the one-pot hydrothermal process, followed by hydrogenation under pure H2 gas flow at 300 °C for 3 h. The sample before and after hydrogenation was referred to as Ni/TiO2 and Ni/TiO2[VO], respectively. The hydrogenation treatment brings about the instantaneous reduction of NiO to Ni nanoclusters on black TiO2. The lattice disorder and Ni nanoclusters on the hydrogenated TiO2 surface resulted in the formation of mid-gap states and enhanced light-harvesting capability in Ni/TiO2[VO], as shown in Fig. 10a. The Ni/TiO2[VO] catalyst showed an acetaldehyde yield of 10 μmol gcat−1 in 6 h with 100% selectivity, which was 2 and 18 times higher than that of Ni/TiO2 and commercial TiO2 (P25) under (300 W) halogen lamp illumination, respectively (Fig. 10b). The reaction mechanism for improved selectivity was not clear. The band edge position was derived from ultraviolet photoelectron spectroscopy (UPS) and DRS absorption data. From this data, they concluded that the improved selectivity for acetaldehyde in Ni/TiO2[VO] could be because of the higher CB position at −1.3 V vs. NHE than the Ni/TiO2 (−1.16 V vs. NHE) (Fig. 10c). The proposed mechanism for CO2 conversion is shown in Fig. 10d. The work function of Ni metal (5 eV) was higher than that of the Ni/TiO2[VO] (3.75 eV), which could have resulted in the transfer of an electron from the CB of TiO2 to the Ni nanocluster and further to the adsorbed CO2 molecule. The hole remaining on TiO2 transferred to the water to generate H+. The enhanced photocatalytic activity and selectivity were attributed to the synergistic effect of Ni nanoclusters and oxygen vacancies on black TiO2.
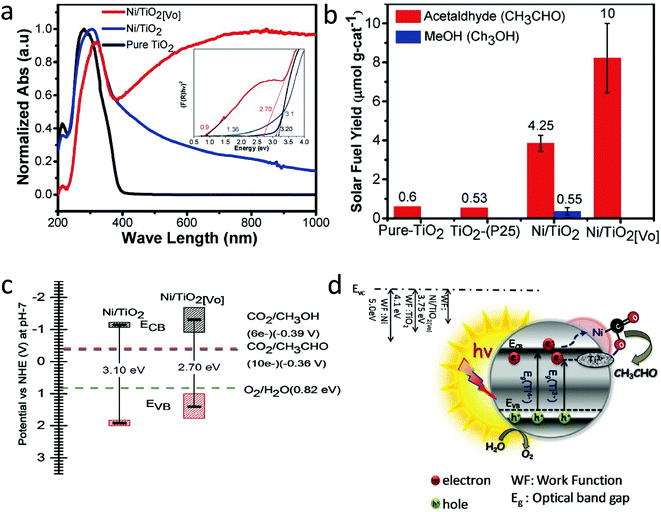 | ||
| Fig. 10 (a) DRS absorption spectra (inset shows Tauc plots with fitting), (b) the cumulative yield of acetaldehyde for 6 h on pure TiO2, TiO2–P25, Ni/TiO2, and Ni/TiO2[VO] using a halogen lamp as a light source, (c) band-edge positions of Ni/TiO2, and Ni/TiO2[VO] estimated using UPS and DRS bandgap and (d) schematic illustration of a mechanism for photocatalytic CO2 reduction of Ni/TiO2[VO]. (reproduced from ref. 53 with permission from Wiley, copyright 2018). | ||
 | ||
| Fig. 11 (a) DRS absorption spectra of the samples, (b) photocatalytic CO2 conversion yield under light illumination, (c) comparative band diagram and interfacial dipole effect of H–Ni–TiO2 and SCN–Ni–TiO2 (reproduced from ref. 54 with permission from the American Chemical Society, copyright 2019 American Chemical Society). | ||
To further improve the photocatalytic activity, Fu et al.54 loaded KSCN along with Ni over oxygen vacant TiO2. The H–Ni–TiO2 photocatalyst was synthesized by a hydrothermal process, followed by hydrogenation in the presence of pure H2 gas. At the same time, SCN–H–Ni–TiO2 was synthesized by modifying H–Ni–TiO2 with potassium thiocyanate passivation. No structural and morphological changes were observed after modification with KSCN. DRS absorption spectra showed that the absorption in the region of 400–1600 nm decreased after modification with thiocyanate and this could be due to the passivation of surface defects (Fig. 11a). Similar results were observed in the XPS data as no peak corresponding to Ti3+ was found after passivation. The SCN–H–Ni–TiO2 photocatalyst showed the maximum yield of 11.30 and 1.20 μmol g−1 in 6 h for acetaldehyde and methanol, respectively (Fig. 11b). Acetaldehyde production was 2.80 times higher than that observed using H–Ni–TiO2 under solar light illumination. Also, it retained the catalytic activity up to 88% after 40 h of reaction, whereas the H–Ni–TiO2 sample retained only 40% of the catalytic activity after 10 h of reaction. Thus, modification of KSCN further helped improve the catalytic activity as well as stability. Fig. 11c shows the band alignment derived from UPS and DRS absorption data. The induced interfacial dipole in SCN–H–Ni–TiO2 shifted the Fermi level as well as the CB and VB edge and also induced an electric field at the interface, which assisted in the separation of charges by driving away hole over the surface. The improvement in activity and stability in the case of SCN–H–Ni–TiO2 was attributed to the surface passivation and improved charge separation due to the formation of the interfacial dipole.
Similarly, Ye et al.55 synthesized inverse opal (IO) structured three-dimensional nickel loaded black TiO2 (referred to as IO-B-TiO2/Ni) from IO-W-TiO2/NiO via the hydrogenation process at 550 °C for 3 h under H2 atmosphere. The hydrogenation treatment reduced NiO to Ni nanoparticles and Ti4+ to Ti3+ in TiO2. EPR and XPS analysis confirmed the presence of Ti3+ centres. The IO-B-TiO2 showed narrow bandgap width and the highest light absorption as compared to P25 because of the slow photon effect of IO structured material and the existence of Ti3+ centres (Fig. 12A). They found that the CO production rate of 12.13 μmol g−1 h−1 using IO-B-TiO2/Ni under a 300 W Xe lamp was 10.1, 5.1, and 2.0 times higher than that using P25, IO-W-TiO2 and IO-B-TiO2, respectively (Fig. 12B). The photocatalyst IO-B-TiO2/Ni was stable over five cycles. The introduction of Ni and the presence of Ti3+ on the outer layer of black TiO2 both improved the rate of separation of photogenerated e−–h+ by trapping of photogenerated electrons via a synergistic effect, thus enhancing photocatalytic activity. PL spectra, photocurrent transient response and electrochemical impedance spectroscopy proved that the recombination rate of photogenerated e−–h+ was the slowest in the case of IO-B-TiO2/Ni as compared to P25, IO-W-TiO2, and IO-B-TiO2. Under light irradiation, an electron could transfer from the CB of TiO2 to Ni where adsorbed CO2 was reduced to CO by accepting photogenerated electrons concentrated on the surface of Ni (Fig. 12C). The improved photocatalytic activity was ascribed to the enhanced light absorption due to the slow photon effect of the IO structure, the formation of a disorder layer and better charge separation efficiency.
 | ||
| Fig. 12 (A) UV-vis DRS and (B) rate of CO generation during the photocatalytic reduction of CO2 using (a) P25, (b) IO-W-TiO2, (c) IO-B-TiO2 and (d) IO-B-TiO2/Ni. (C) Schematic representation of the mechanism for photocatalytic CO2 conversion (reproduced from ref. 55 with permission from Elsevier, copyright 2019). | ||
Liu et al.56 compared the photocatalytic properties of the Cu doped TiO2 sample by calcining it in He and H2 atmosphere. They synthesized Cu doped TiO2 by the precipitation method followed by the calcination of the as-synthesized sample in the air at 400 °C. Furthermore, the sample was calcined in He and H2 atmosphere at 220 °C for 1.5 h. During heat treatment in He and H2, the formation of defects, namely oxygen vacancies and Ti3+, were found. He and H2 treated samples formed predominately Cu1+ and mixed Cu1+/Cu0, respectively. The color of the H2 treated sample was found to be darker and it also showed enhanced absorption in the visible region compared to the He treated sample. This enhancement in the light absorption in the case of the H2 treated sample was due to the high concentration of oxygen vacancies and the presence of interstitial H. The sample treated in the H2 atmosphere showed the highest activity for CH4 and CO generation compared to the He treated samples. The improvement in activity was attributed to the presence of oxygen vacancies and Ti3+, which provided a site for CO2 adsorption and subsequent transfer of an electron to the adsorbed CO2. Also, the presence of the Cu1+/Cu0 redox couple generated by H2 reduction resulted in higher activity for the trapping of photogenerated electrons and holes than the presence of only Cu1+ species induced by He treatment. 1 atom% Cu doped TiO2 after hydrogen treatment showed the highest activity of 25 and 4.4 μmol g−1 in 6.5 h for CO and CH4 production, respectively.
The impact of hydrogenation before and after metal oxide loading was studied by Li et al.57 They observed that the dispersion of CoOx over TiO2 nanotubes varies on changing the sequence of hydrogenation treatment. In this work, nanotubes of TiO2 with the mixture of anatase and TiO2(B) phase (referred to as AB) were synthesized. The impregnation method was used to load CoOx over AB (referred to as (AB-Co)) and then the sample was calcined in the air (referred to as AB-A). The AB-Co sample was calcined in the presence of N2/H2 (1![[thin space (1/6-em)]](https://www.rsc.org/images/entities/char_2009.gif) :
:![[thin space (1/6-em)]](https://www.rsc.org/images/entities/char_2009.gif) 9) and referred to as AB-Co-H. In another approach, AB was first calcined in N2/H2 and then Co ions were loaded over it by the impregnation method and referred to as AB-H-Co. TEM shows the well-dispersed CoOx over the TiO2 nanotubes. It was found that the CoOx nanoparticles on AB-Co and AB-H-Co were amorphous, while AB-Co-H showed the crystalline CoO nanocrystals. The size of the CoOx nanoparticles was found to be in the order AB-Co-H > AB-Co > AB-H-Co. The stronger interaction between the oxygen vacancy of TiO2 and the CoOx nanoparticles resulted in the high dispersion and smaller size of CoOx in AB-H-Co as compared to other samples. DRS absorption spectra did not show much change in the absorption edge, indicating the introduction of a smaller number of oxygen defects. d–d transition of Co2+ species was observed in the range of 550–670 nm. They compared the CO2 conversion yield obtained via photocatalysis (PT) and photo-thermo-catalysis (PTC). A significant increase in the yield of CO and CH4 was observed for the reaction carried out photo-thermo-catalytically at 120 °C. The calcined sample of AB-Co showed a lower yield for CH4. This could be due to the aggregation of the CoOx after calcination. The highest yield of 16.4 and 10.05 μmol g−1 h−1 of CO and CH4 generation was observed in the case of the AB-H-Co sample, respectively. The improved activity was attributed to two factors: the first is the presence of oxygen vacancies, which helped in better charge separation, dispersion of CoOx and adsorption of CO2 and the second is the role of CoOx as the co-catalyst, which acted as a hole trap and enhanced the proton generation form water oxidation.
9) and referred to as AB-Co-H. In another approach, AB was first calcined in N2/H2 and then Co ions were loaded over it by the impregnation method and referred to as AB-H-Co. TEM shows the well-dispersed CoOx over the TiO2 nanotubes. It was found that the CoOx nanoparticles on AB-Co and AB-H-Co were amorphous, while AB-Co-H showed the crystalline CoO nanocrystals. The size of the CoOx nanoparticles was found to be in the order AB-Co-H > AB-Co > AB-H-Co. The stronger interaction between the oxygen vacancy of TiO2 and the CoOx nanoparticles resulted in the high dispersion and smaller size of CoOx in AB-H-Co as compared to other samples. DRS absorption spectra did not show much change in the absorption edge, indicating the introduction of a smaller number of oxygen defects. d–d transition of Co2+ species was observed in the range of 550–670 nm. They compared the CO2 conversion yield obtained via photocatalysis (PT) and photo-thermo-catalysis (PTC). A significant increase in the yield of CO and CH4 was observed for the reaction carried out photo-thermo-catalytically at 120 °C. The calcined sample of AB-Co showed a lower yield for CH4. This could be due to the aggregation of the CoOx after calcination. The highest yield of 16.4 and 10.05 μmol g−1 h−1 of CO and CH4 generation was observed in the case of the AB-H-Co sample, respectively. The improved activity was attributed to two factors: the first is the presence of oxygen vacancies, which helped in better charge separation, dispersion of CoOx and adsorption of CO2 and the second is the role of CoOx as the co-catalyst, which acted as a hole trap and enhanced the proton generation form water oxidation.
Sorcar et al.59 reported reduced blue titania (referred to as BT) synthesis by mixing P25 TiO2 with NaBH4 followed by heating at 350 °C for 30 min under an Ar atmosphere. Samples were referred to as BT-x where x is the amount of NaBH4 in mg used during synthesis for 200 mg of P25 TiO2. Pt was photo-deposited over the BT-30 sample and the amount of Pt was varied from 0.25–0.5 wt%, and the sample was named y-BT-30 where y is the amount of Pt. The color of the sample becomes darker, with an increase in NaBH4 content. They found that the treatment of TiO2 with NaBH4 introduced a shell of a disorder layer over the crystalline core. The enhancement of light absorption in the visible region was attributed to the formation of the disorder surface layer and the existence of Ti3+. The particle size of the Pt was varied from 1.82 nm for 0.25 wt% to 3.5 nm for 0.5 wt%. The highest methane generation at the rate of 80.35 μmol g−1 h−1 with AQE of 12.4% was observed using 0.35-BT-30 having a Pt content of 0.35 wt% under solar light irradiation with 100% selectivity. The catalytic activity was stable for five cycles. The decrease in activity in the second cycle was due to the saturation of active sites by the adsorption of the intermediate products. Therefore, after the 2nd, 3rd and 4th cycle, the catalyst was subjected to the vacuum treatment to desorb the products from the catalyst surface. The improved yield of 0.35-BT-30 was attributed to the presence of defects, optimum amount and size of Pt nanoparticles, and appropriate band alignment.
To further modify the performance of the catalyst, Sorcar et al. decorated the blue titania (referred to as RBT) with graphene.60 Graphene wrapped RBT samples (G/RBT) were prepared by annealing the graphene oxide-RBT composite (GO/RBT) samples in a vacuum oven at 230 °C for 90 minutes. On this composite, the generation of 77 μmol g−1 of ethane (C2H6) and 259 μmol g−1 of CH4 in 7 h under solar light illumination with an AQE of 7.9% was observed. The stability of the photocatalyst was evaluated for 42 h. UPS studies revealed the formation of Ti–O–C bonds at the interface, resulting in upward band bending, which was responsible for the hole transfer from RBT to the graphene. The transient absorption spectroscopy studies revealed the accumulation of photogenerated holes and electrons on the graphene and Ti3+ sites, respectively. The generation of C1 and C2 products was attributed to the efficient charge separation and accumulation of photogenerated electrons and holes is attributed to the RBT and graphene surface, respectively.
To further improve the performance of blue titania, Sorcar et al.61 deposited Cu and Pt over reduced blue-titania by the photodeposition method to improve the yield of CH4 and C2H6. Photoconversion of CO2 using 1 wt% of Cu-0.35 wt% of Pt modified blue titania generated CH4 and C2H6 with a rate of 3.0 mmol g−1 and 0.15 mmol g−1 in 6 h under artificial sunlight illumination with 1% solar to fuel efficiency (SFE) and 86% AQE, respectively. The catalyst was found to be stable for 60 h (Fig. 13a). FTIR spectra of the catalyst recorded after photocatalytic CO2 conversion showed characteristic signals corresponding to CH3; this indicated that CH3 was the intermediate formed during the catalytic reaction (Fig. 13b). They claimed that the Cu nanoparticles provided sites for CO2 adsorption, while the Pt effectively prevented electron–hole recombination. The improvement of photocatalytic activity was attributed to the synergistic effect between charge separation and transfer from Pt to Cu and the enhanced adsorption of CO2 by the presence of both oxygen defects and Cu sites.
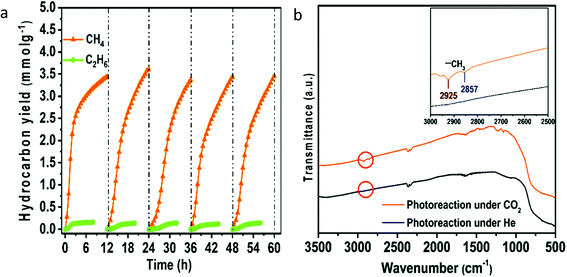 | ||
| Fig. 13 (a) Stability evaluation of Cu–Pt modified blue titania for photocatalytic CO2 conversion, (b) FTIR analysis of the sample after photocatalytic reaction carried out in the presence of CO2 and He gas (reproduced from ref. 61 with permission from the Royal Society of Chemistry, copyright 2019). | ||
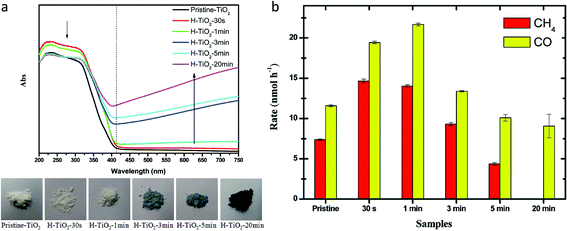 | ||
| Fig. 14 (a) DRS spectra and the photograph of the samples with increasing plasma treatment time and (b) photocatalytic CO2 conversion using hydrogenated samples under solar light illumination (reproduced from ref. 62 with permission from the Royal Society of Chemistry, copyright 2014). | ||
4.2 Defect generation by annealing in an oxygen-deficient atmosphere
 | (10) |
The equilibrium constant (K) of the above reaction can be given as follows:
| K = [VO]n2p(O2)(1/2) | (11) |
| [VO] = Kn−2p(O2)−(1/2) | (12) |
This equation indicates that the concentration of oxygen vacancies will increase with a decrease in oxygen pressure. Thus, thermal treatment in the oxygen-deficient atmosphere facilitates the generation of oxygen vacancies.33
Liu et al.63 compared the photocatalytic activity of defective and defect-free anatase, rutile and brookite polymorphs of TiO2. They introduced defects in the polymorphs by heating them in the flow of He gas for 1.5 h at 220 °C. It was found that heating in the presence of He produces oxygen vacancies and Ti3+ ions on the surface of the anatase and brookite form while it is negligible in the case of the rutile phase. In situ diffuse reflectance infrared Fourier transform spectroscopy (DRIFTS) studies revealed that the pristine TiO2 could not activate the CO2, as no formation of the CO2− intermediate occurred over it. Different intermediates were spotted over anatase and brookite forms. The anatase phase formed predominantly CO2− as one of the intermediates, whereas brookite showed the formation of both CO2− and HCOOH species. It was observed that water adsorption was favored over the brookite surface. Only in the absence of water, characteristics bands of CO2− species appeared and the concentration of these species increased with an increase in illumination time, confirming that the CO2− species reacted immediately with water to form CO during light irradiation. Also, they found that the brookite phase was more photo-catalytically active as a lower amount of energy was required to produce the oxygen vacancy on its surface as compared to the anatase and rutile phases by using this synthesis protocol. Total production of CO and CH4 was found to be 18.9 μmol g−1 in 6 h under solar light illumination using the defective brookite TiO2 polymorph in the presence of water vapor. CO was found to be the major product of CO2 conversion.
Further research was carried out by Xin et al.64 to synthesize the defects over brookite nanosheets of TiO2, by an oxidation-based hydrothermal method using TiH2 as a titanium precursor, followed by post-annealing at different temperatures, 300, 500 and 700 °C, in the presence of a N2 flow. They found that with an increase in calcination temperature, the (concentration of Ti3+ decreases) powder becomes brown, black and light grey. The crystallinity of samples also increased with increasing calcination temperature. The fading of color of the sample annealed at 700 °C was attributed to the difficulty in the diffusion of Ti3+ with improved crystallinity resulting in a lower concentration of defect centers. The sample annealed at 500 °C with the highest concentration of 0.7 × 10²⁰ spins mol−1 of Ti3+ showed CH4 and CO generation at a rate of 11.9 and 23.5 μmol g−1 h−1 under visible light illumination, respectively. The improvement in the activity was attributed to the Ti3+ ion concentration and light absorption properties of the catalyst.
Zhao et al.65 reported the generation of the oxygen vacancy by annealing in a vacuum. To prevent the oxidation of Cu metal, the TiO2 precursor was coated over Cu metal nanoparticles and annealed in a vacuum (referred as Cu@TiO2). They observed that the oxygen vacancies were created as a result of annealing in a vacuum and their amount increased with an increase in Cu content. The presence of Cu nanoparticles helped form the oxygen vacancies in TiO2via metal-oxide interactions. This also resulted in improved visible light absorption of Cu@TiO2. The highest CO and CH4 production at a rate of 48.5 and 8 μmol g−1 in 6 h was observed using Cu@TiO2 (4 wt% Cu), which was 1.4 times higher than the black TiO2 under visible light illumination. The improvement in activity was attributed to the enhancement of adsorption of CO2, light absorption and separation of charge carriers revealed by the transient photocurrent measurements.
 | ||
| Fig. 15 (a) Synthesis protocol for the generation of oxygen vacancies using propane flame treatment (inset shows TEM image of square-shaped TiO2 nanotubes after treatment with propane flame) and (b) DRS absorption spectra of LANT-aq, LANT-eg, FANT-aq and FANT-eg samples (reproduced from ref. 66 with permission from Elsevier, copyright 2019). | ||
4.3 Using organic reducing agents
Tu et al.67 synthesized the TiO2/graphene (referred to as Gx–TiO2 where x = 0, 1, 2, 5 wt% of graphene) hybrid using the simultaneous reduction–hydrolysis method using ethylenediamine and water as a solvent in the hydrothermal treatment. They observed the formation of Ti3+ and reduction of graphene from graphene oxide by treatment with ethylenediamine. The light absorption increases with an increase in graphene content, as shown in Fig. 16a. The dispersion of TiO2 prohibited the restacking of the sheets of the graphene. The nanocomposite with 2 wt% graphene shows the highest rate of 8 and 16.8 μmol g−1 h−1 of methane and ethane, respectively (Fig. 16b). Initially, the yield of ethane increased with an increase in graphene content. On further increase in graphene content to more than 2 wt%, a decrease in activity was observed which could be attributed to the hindering of light absorption of TiO2 due to the presence of excess graphene. They attributed the generation of ethane to the synergistic effect between surface Ti3+ sites and graphene. Matching energy levels of the d-orbital of TiO2 and π orbital of graphene and formation of the Ti–O–C bond between graphene and TiO2 results in d to π orbital overlap; this makes the transfer of the electron from the CB of TiO2 to graphene possible upon light illumination. This transferred electron could help reduce CO2 adsorption on the surface. No ethane formation was observed over P25; hence they proposed that electron-rich graphene could stabilize .CH3 radicals and thus help in the formation of methane as well as ethane by coupling of the ˙CH3 radical.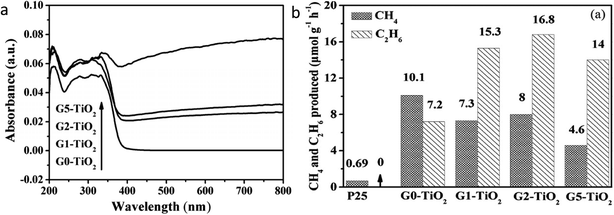 | ||
| Fig. 16 (a) UV-visible DRS spectrum of Gx–TiO2 (x = 0, 1, 2 and 5 wt% of graphene) samples and (b) comparison of photocatalytic activity of Gx–TiO2 samples in the presence of water vapor (reproduced from ref. 67 with permission from Wiley, copyright 2013). | ||
4.4 Metallothermic reduction
The metallothermic reduction method to generate defects in TiO2 is easier, safer, and cost-effective as compared to the H2 reduction method carried out at high pressure and temperature. According to the Ellingham diagram, Al, Mg, and Li possess lower negative potential, and thus can be potential candidates for the reduction of TiO2.68 In this method, these metals act as a reducing agent to capture lattice oxygen effectively.Also, the oxygen vacancies in TiO2 were induced by thermal treatment of a mixture of aluminum powder and TiO2. Gao et al.70 synthesized black TiO2 nanotube arrays (B–TiO2 NTAs) by annealing TiO2-NTAs wrapped with Al powder in an argon atmosphere at temperatures of 250, 300, 450, and 600 °C (Fig. 17a). The obtained samples were named B–TiO2 NTAs-x, where x is the temperature. No doping of Al in TiO2 was observed. The presence of a high concentration of oxygen vacancies introduced by the aluminothermic reduction process and the resultant Ti3+ centres creates a defect energy level below the CB of TiO2; thus, B–TiO2 NTAs exhibited strong visible light absorption as compared to TiO2 NTAs (Fig. 17b). The concentration of oxygen vacancy defects was increased with an increase in temperature. The formed oxygen vacancies could act as electron traps; hence B–TiO2 NTAs showed a lower charge recombination rate than TiO2 NTAs. To know the effect of oxygen vacancies on CO2 conversion, they also synthesized NTAs-450-A by annealing TiO2 NTAs at 450 °C in the air. It was observed that B–TiO2 NTA samples exhibited better performance in photocatalytic reduction of CO2 than TiO2 NTAs-450-A. Among the synthesized photocatalysts, B–TiO2 NTAs-600 demonstrated the best performance under visible light irradiation with a CO yield of 185.39 μmol g−1 h−1, which could be due to the presence of a large amount of oxygen vacancies in TiO2 NTAs, lower charge carrier recombination, and abundant sites for the photocatalytic CO2 reduction (Fig. 17c). The catalyst was 95% active for CO2 reduction even after five cycles of testing.
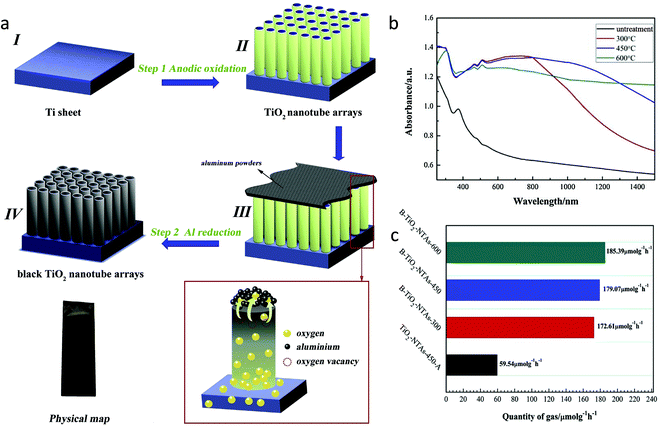 | ||
| Fig. 17 (a) Schematic of synthesis procedure for the black TiO2 nanotube array, (b) UV-visible DRS spectra of the sample annealed at different temperatures and (c) photocatalytic CO2 conversion using different samples under visible light illumination (reproduced from ref. 70 with permission from Elsevier, copyright 2020). | ||
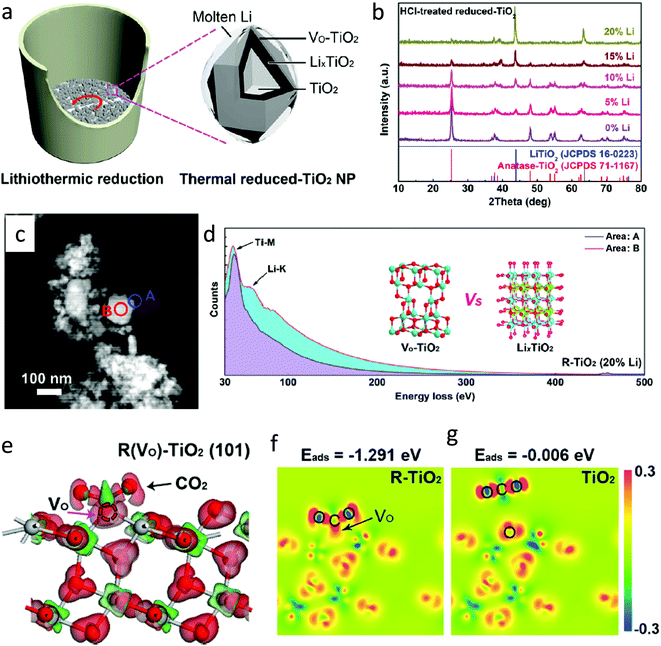 | ||
| Fig. 18 (a) Synthesis of defective TiO2 by lithiothermic reduction, (b) XRD spectra of samples synthesized by varying the amount of Li, (c) HAADF-TEM image of R–TiO2 (20% Li), (d) EELs spectra recorded at the edge position A and center position B; inset shows the atomic structure of oxygen-deficient TiO2 and cubic LixTiO2, (e) charge difference of the CO2 molecule adsorbed on the surface of the (101) plane for anatase phase of R–TiO2 (gray: Ti atom, red: O atom), and (f and g) differential charge density after CO2 adsorption (reproduced from ref. 72 with permission from the American Chemical Society, copyright 2020). | ||
5. Defect generation by morphology and facet engineering
Facet engineering is one of the aspects adopted to improve charge separation and thus enhanced photocatalytic CO2 conversion. The particular facet of the crystal possesses unique electronic properties due to the specific atomic arrangement and coordination, which may affect the adsorption of the reactant, stabilization of intermediates and desorption of the product. TiO2 with different facets has been reported to carry out different oxidation and reduction reactions on different facets. Generally, the hydrothermal method is adapted to synthesize faceted TiO2 along with the introduction of Ti3+ vacancies or oxygen defects.It was observed that not only the presence of defects but also the particular morphology assists in improving the yield of photocatalytic CO2 conversion. Sasan et al.73 reported self-doped rutile TiO2 (Ti3+–TiO2) with facets synthesized using the hydrothermal method in the presence of HCl. Fig. 19a shows the SEM images of the Ti3+–TiO2 sample. Ti3+ concentration in self-doped TiO2 was reported to be ≈4.5 μmol g−1. They claimed the formation of Ti3+ in bulk as the XPS did not show any peak corresponding to Ti3+, whereas EPR showed the presence of Ti3+ (Fig. 19b). To improve the activity of self-doped TiO2, Pd and Cu were photodeposited (referred to as CuI/Pd/Ti3+–TiO2) and evaluated for its potential for CH4 generation from CO2 and water in the presence of visible light. Fig. 19c shows the TEM image of CuI/Pd/Ti3+–TiO2, which showed the presence of the co-catalyst on the {110} facets. This confirmed that the photogenerated electrons accumulated preferentially at the {110} facets than the {111} facets. The generation of ∼1 μmol g−1 h−1 CH4 was observed under visible light illumination (Fig. 19d). To evaluate the impact of the shape and morphology, self-doped TiO2 was synthesized by the combustion method. CH4 productivity of Ti3+–TiO2 synthesized by the hydrothermal method was 2.5 times more than that of the sample synthesized by the combustion method and improvement in activity assigned to the structural features like morphology and facets. The electrons and holes were trapped at different facets such as {111} and {110} of the rutile TiO2 phase, respectively, thus resulting in improved separation of charge carriers and photocatalytic activity.
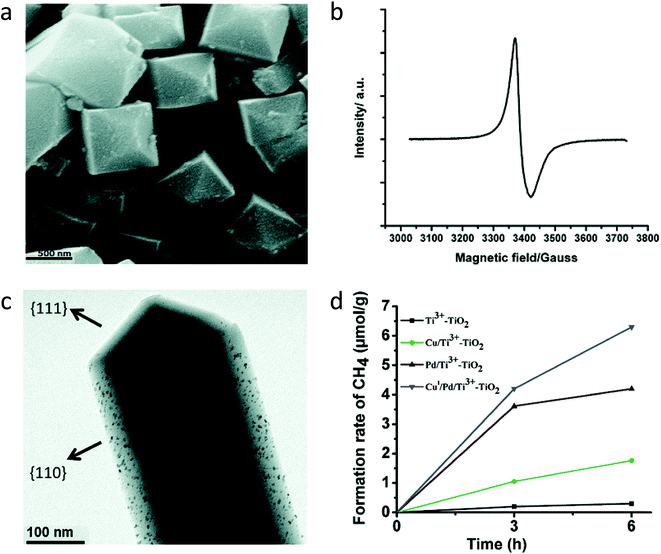 | ||
| Fig. 19 (a) SEM image of the Ti3+–TiO2 sample and (b) EPR spectra of the Ti3+–TiO2 sample recorded at 100 K, (c) TEM images of the CuI/Pd/Ti3+–TiO2 sample, and (d) comparison of photocatalytic CO2 conversion using different samples (reproduced from ref. 73 with permission from the Royal Society of Chemistry, copyright 2015). | ||
It was observed that the sample synthesized by hydrothermal treatment using HF showed the incorporation of fluoride ions into the lattice of TiO2 because of its smaller size. The presence of this fluoride ion induces the disordered layer, which further assists in preventing the Ti3+ oxidation in the air.74 Fang et al.74 synthesized deep blue colored reduced TiO2−xvia a one-step hydrothermal process using HCl and the Ti(III)Cl3 precursor. During synthesis, a small amount of HF was also added, which resulted in the introduction of a disordered layer, increase in the content of the anatase phase of TiO2 and structural morphology with the {101} and {001} facets. The samples were referred to as TiO2−x followed by the amount of HF added. The presence of fluoride ions was verified by XPS and HRTEM-EDS. EDS elemental mapping further confirmed that fluoride ions were homogeneously dispersed in the catalyst. Because of the size and charge of fluoride ions, the transformation of the anatase to the rutile phase gets prohibited. The light absorption in the visible region increased with an increase in fluorination and showed the highest absorption for TiO2−x-0.5 (Fig. 20a). This light absorption could be due to the presence of Ti3+ and oxygen vacancies. The presence of Ti3+ ions was also confirmed by the EPR spectra and showed the presence of 24.6 × 10¹⁹ spins per g in TiO2−x-0.50, which was nearly 14![[thin space (1/6-em)]](https://www.rsc.org/images/entities/char_2009.gif) 000-fold more as compared to the pristine TiO2 (Fig. 20b and c). Fig. 20d and e show the HR-TEM image of the TiO2−x-0.5 sample and shows the presence of the {101} and {001} facets.
000-fold more as compared to the pristine TiO2 (Fig. 20b and c). Fig. 20d and e show the HR-TEM image of the TiO2−x-0.5 sample and shows the presence of the {101} and {001} facets.
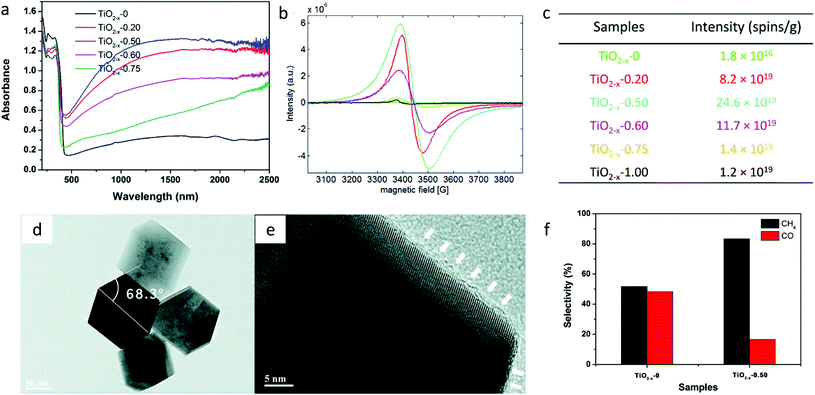 | ||
| Fig. 20 (a) DRS absorption spectra, (b) EPR spectra and (c) the spin intensity of reduced TiO2 samples, (d) HRTEM image of TiO2−x-0.50, (e) disordered layers on the surface of TiO2−x marked with white color arrows and (f) selectivity for CH4 and CO generation using TiO2−x-0 and TiO2−x-0.50 in the absence of the cocatalyst and under simulated solar light (reproduced from ref. 74 with permission from the Royal Society of Chemistry, copyright 2017). | ||
The presence of the disordered layer of 1–2 nm on the surface of TiO2−x induced by the fluoride atoms prevents the oxidation of Ti3+ ions. The presence of facets promotes the separation of electrons and holes as they prefer to accumulate at the {101} and {001} facets, respectively. Photocatalytic CO2 conversion carried out in the absence of the cocatalyst and under simulated solar light illumination generated CH4 and CO. The selectivity for CH4 evolution increased from 51.7% to 83.4% after fluorination (Fig. 20f). The improved photocatalytic performance was attributed to the enhanced solar light absorption by the presence of the Ti3+ ion, improved activation of CO2 by the induced oxygen vacancies and the slow recombination rate because of migration of photogenerated charges on different facets.
Similarly, Liu et al.75 synthesized TiO2 with co-exposed facets of {001} and {101} by the hydrothermal method using titanium isopropoxide and a small amount of HF. Defects were created by heating a TiO2 and NaBH4 mixture at 300 °C. The highest yield for CO generation obtained was 54.5 μmol g−1 in 5 h under UV-visible light with an AQE of 0.31%. The improved activity is attributed to the electron transfer between the {001} and {101} planes and enhanced light absorption due to the formation of the Ti3+ states within a bandgap of TiO2. In situ DRIFTS studies confirmed that the presence of Ti3+ along with co-exposed facets of {001}–{101} helped in the activation and conversion of CO2.
Similarly, Liu et al.76 synthesized ultrathin nanosheets with a thickness of ∼0.8 nm (approximately two atomic layers thick) of TiO2 with abundant facets by the hydrothermal method using ethylene glycol. EPR and XPS studies indicated that the concentration of Ti3+ increased after irradiation with UV-visible light. Pt deposited ultrathin TiO2 exhibited excellent photocatalytic activity for the conversion of CO2 into CH4 and CO with a yield of 66.4 and 54.2 μmol g−1 h−1, respectively. The improved photocatalytic activity was attributed to the increased surface area and defect sites, which assisted in the charge transfer to well-dispersed Pt nanoparticles and reduced the recombination of charge carriers, and the synergy between metal and support helped in the adsorption of CO2.
It is difficult to generate a defective layer over the particular facets of the photocatalyst by the methods discussed above and, hence, to study its impact on photocatalytic CO2 conversion. Recently, Shi et al.77 adopted a mild reducing condition to study the role of the formation of the defective layer, particularly on the {001} facets of TiO2 nanocrystals. The synthesis was carried out in a two-step reduction process viz., the first involves the solvothermal method using TiO2, NaBH4 and glycol and the second step involves calcination under Ar flow at 400 °C. Fig. 21a–c shows HRTEM images of the TiO2 homojunction formed after reduction treatment, showing a truncated octahedral bipyramid consisting of the {101} facets on the side and the {001} facets on top and bottom. HRTEM images indicated that the defective layer forms only on the {001} facets and not on the {101} facets. They observed the formation of a heterojunction between the defective layer, interface layer and the crystalline core. HAADF images showed a disordered layer on the {001} facets (Fig. 21d and e). The EELS spectra were recorded at different depths to know the distribution of Ti3+ and Ti4+ species on the {001} facets (Fig. 21f). Until the depth of 2 nm, the characteristic signals of Ti3+ appeared, confirming its presence in the defective layer. In between 2 and 3 nm, the presence of both Ti3+ and Ti4+ appears, confirming their co-occurrence in the interface layer. After 3 nm depth, the existence of Ti4+ in the crystalline layer was observed. EELS spectra confirmed the presence of Ti3+ in the defective and interface layer of thickness nearly 2 and 1 nm, respectively. In situ DRIFTS study performed in the dark and in thepresence of CO2 saturated with water vapor further confirmed that CO2 was activated by forming CO2˙− species on the surface, which was easy to reduce further. Methane was produced at a rate of 2.49 μmol g−1 h−1 with 100% selectivity under UV light (λ = 365 nm), in the absence of a cocatalyst. The catalyst was found to be stable even after 60 h of a run. The holes are supposed to accumulate on the {001} surface, but they observed that due to the formation of the electron-rich defective layer, the reduction of CO2 has occurred over the {001} facets and oxidation over the {101} facets.
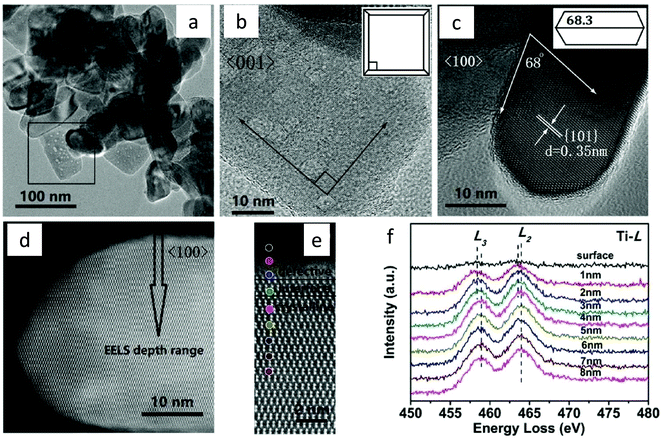 | ||
| Fig. 21 (a) TEM image of the TiO2-homojunction, HRTEM image recorded from (b) <001> orientation, inset shows the model of truncated octahedral bipyramid projected along <001> direction, and (c) <100> orientation inset shows the model of truncated octahedral bipyramid projected along <100> direction, (d) HAADF-STEM image recorded from <100> orientation, (e) position for signal collection for EELS spectra, (f) Ti-L spectra recorded at the different positions marked with colored dots in (e) (reproduced from ref. 77 with permission from Wiley, copyright 2019). | ||
Similarly, Qingli et al.78 synthesized a porous black TiO2 film by hydrothermally treating a Ti plate in H2O2 solution. The oxygen-deficient nature of the black TiO2 film was confirmed by the EDX. They monitored photocatalytic CO2 conversion using simulated sunlight in the presence of moist CO2 with the production of CO and CH4 at a rate of 115 and 12 μmol g−1 h−1 respectively.
An attempt was also made to further enhance the light absorption by using the light trapping property of the hollow microstructure synthesized by the hydrothermal method. Liu et al.79 synthesized the porous fluorinated TiO2 hollow microstructure (referred to as THMs) with exposed {001} facets and induced defects by hydrothermal treatment using Ti(SO4)2 and NH4F. Au was photodeposited on THMs by varying its amount from 0, 0.5, 1, 2 and 4 wt% and referred to as Aux/THMs where x is the weight ratio of Au to Ti. They found that photodeposition of Au on the THMs increases both the oxygen vacancy and Ti3+, which further helps adsorb and activate the CO2 molecule (Fig. 22a). The formation of Ti–F species, surface Ti3+ and oxygen vacancies helps in trapping the surface photogenerated charge carriers, thus reducing surface recombination. The improved light absorption was attributed to the light trapping effect of the hollow sphere and surface plasmon resonance (SPR) effect of the Au nanoparticles. The photocatalytic activity for CO2 conversion enhanced due to improved charge separation as a result of the Schottky junction between Au and TiO2 and the {001}/{101} facet junction and increased CO2 adsorption due to the strong affinity of Au nanoparticles to CO2 as well as the presence of surface Ti3+ and VO sites. Methane formation was favored over the Au1/THMs due to the strong affinity of CO to Au, which restricted its escape from the surface and helped to further hydrogenate the surface-bound CO to form methane. The maximum yield for CH4 and CO was 1.19 and 2.10 μmol g−1 h−1 under UV-visible light irradiation, respectively, using Au1/THMs (Fig. 22b). In situ DRIFTS studies performed using Au1/THMs revealed that even in the absence of light, species like monodentate and bidentate carbonate, bicarbonate, carboxylate (CO2−), and carbon monoxide were formed. CO2− species were formed as a result of the presence of oxygen defects and Ti3+ sites. Under LED light illumination, the species like bicarbonate, CO2− and CO depleted and new species like formate, formaldehyde, dioxymethylene and methoxy groups appeared and became stronger with time. They proposed the possible pathways to generate CO and CH4 (Fig. 22c): (i) a surface Ti3+ (or oxygen vacancy (VO))-bound CO2− activated reaction pathway, (ii) a surface hydroxyl (OH)-bound HCO3− derived reaction pathway and (iii) Au-bound CO initiated hydrogenation to produce CH4.
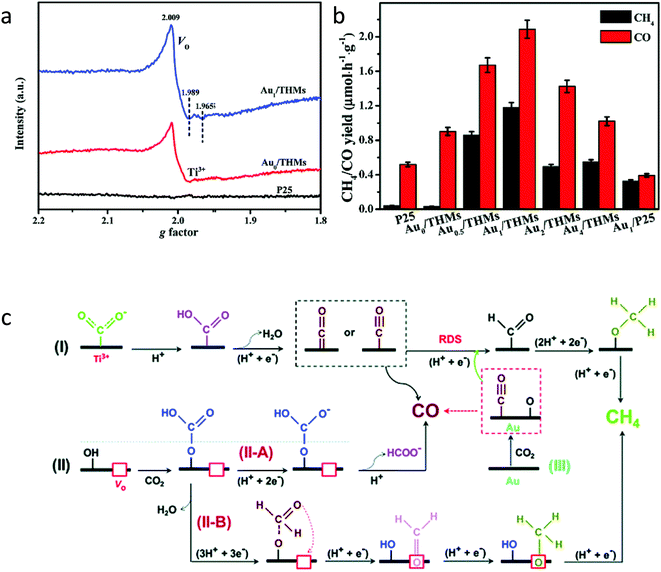 | ||
| Fig. 22 (a) EPR spectra of P25, Au0/THMs, and Au1/THMs, (b) photocatalytic CO2 conversion over different samples under full-spectrum light illumination and (c) probable mechanism pathway for CO2 to CH4 conversion (reproduced from ref. 79 with permission from the Royal Society of Chemistry, copyright 2018). | ||
Another approach was adapted by Yin et al.80 for the synthesis of hydrogenated blue H–TiO2−x by a facile low-temperature solvothermal method using Li-dissolved ethanediamine. During the solvothermal reaction, the generated Li species and [H] atom after mixing of Li metal and ethanediamine were capable of reducing TiO2 by introducing surface defects and intercalated H. The sample was referred to as H–TiO2−x-y where y represents the amount of Li in mg. It was observed that the thickness of the disordered layer increases with an increase in the Li content, i.e. it changed from 2–3 nm for H–TiO2−x-200 to 4–6 nm for H–TiO2−x-300 (Fig. 23A). 1H NMR spectra of the samples showed the presence of protons in a different environment. It was observed that during the solvothermal process, more H atoms were incorporated at the bridging sites in the amorphous layer (Fig. 23B). The kinetic isotope effect studies indicated that the breaking of the C–O bond of CO2 was the rate-determining step in photocatalytic CO2 conversion rather than the O–H bond of H2O. Fig. 23C shows the in situ DRIFTS performed in the dark as well as under light illumination to study the reaction intermediates. The amount of the different carbonate species increases with an increase in illumination time over the surface of H–TiO2−x. The in situ DRIFTS measurements confirmed the formation of the intermediate of CO2− which indicated that CO2 gets adsorbed and activated on the surface of defective H–TiO2−x. CO2 conversion into methane at a rate of 16.2 and 2.7 μmol h−1 g−1 with a selectivity of 75 and 77% were observed using H–TiO2−x 200 under solar light and visible light illumination (400–780 nm), respectively. It was found that the increase of thickness of the disorder layer to 4–6 nm in H–TiO2−x-300 was not favorable for the transport of photo-generated charge carriers, which resulted in low photocatalytic activity.
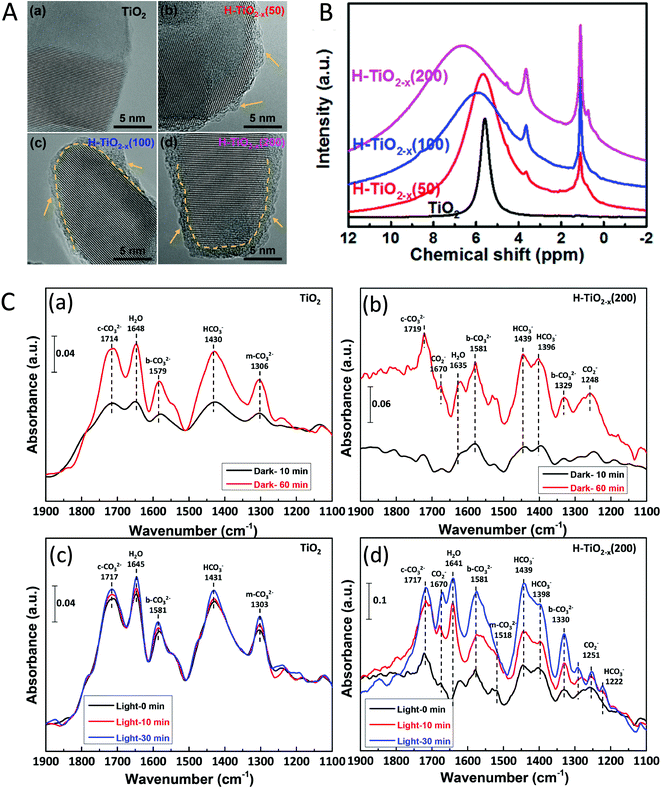 | ||
| Fig. 23 (A) HRTEM images of the TiO2−x with different amounts of Li, (B) 1H NMR spectra of the defective blue H–TiO2−x samples, (C) in situ DRIFTS spectra monitored in the dark for (a) TiO2 and (b) H–TiO2−x-200 and after shining light for (c) TiO2 and (d) H–TiO2−x-200 (reproduced from ref. 80 with permission from the American Chemical Society, copyright 2018). | ||
6. Defect generation during synthesis, doping and composite formation
The formation of defect during the synthesis of the catalyst and its application for the CO2 conversion is discussed in this section. The defects were also found to generate during the photodeposition process. Zhu et al.81 studied the impact of defects generated during photodeposition of Cu2O. They synthesized the nanosheets of TiO2 with facets of {001} by the hydrothermal method and Cu2O was deposited over it by the photodeposition method (referred to as Cu–TiO2-x, where x is the wt% of Cu species). During in situ photodeposition, along with Cu deposition, oxygen vacancies were also generated on the surface of TiO2 nanosheets. The EPR spectra revealed that the intensity of VO after deposition of Cu2O increased, whereas the intensity of Ti3+ decreased significantly (Fig. 24A). The decrease in Ti3+ signal indicated that the Cu2+ adhered to the Ti3+ sites where it was reduced to Cu1+ by accepting an electron from Ti3+. Fig. 24A(b) indicated that after the introduction of CO2, the oxygen defects decreased, whereas the Ti3+ remains the same. This further confirmed that the VO acts as CO2 adsorption centers and the formation of CO2˙− sites on the surface of the Cu–TiO2-1. The presence of Cu2O increases the alkalinity and forms oxygen defects (VO), thus leading to improvement of adsorption of CO2 over Cu–TiO2-1 as compared to pristine TiO2 (Fig. 24B).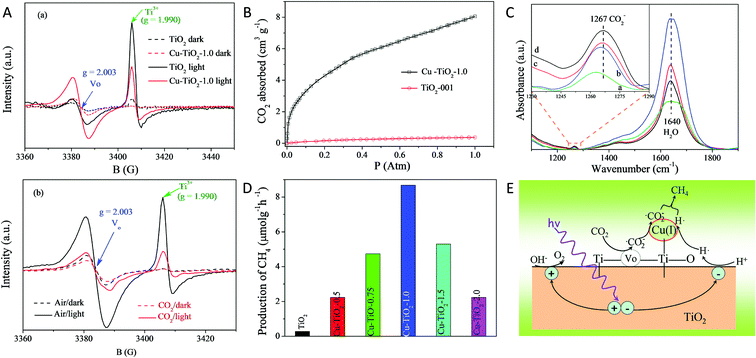 | ||
| Fig. 24 (A) (a) EPR spectra of TiO2 and Cu–TiO2-1.0 samples recorded under vacuum at 77 K in the dark and after solar light illumination, (b) EPR spectra of the Cu–TiO2-1.0 catalyst in the presence of air and CO2, (B) CO2 adsorption isotherm of TiO2 and Cu–TiO2-1.0 samples, (C) in situ FTIR spectra recorded in the presence of CO2 and H2O, (a) raw Cu–TiO2-1 sample (b) after 30 min in the dark, (c) after 30 min of light illumination and (d) after 50 min of light illumination, (D) comparison of the CH4 yield generated using different catalysts under simulated solar light, and (E) plausible reaction mechanism for CO2 conversion using Cu–TiO2-x. (reproduced from ref. 81 with permission from the Royal Society of Chemistry, copyright 2015). | ||
In situ FTIR spectra recorded under light illumination showed that the intensity of the CO2˙− species increases with an increase in light illumination (Fig. 24C). The decrease in the water absorption band indicated its consumption during the reaction. Methane yield was found to be dependent on the concentration of Cu2O. The highest methane yield of 8.68 μmol g−1 h−1 was observed with 100% selectivity using 1 wt% of Cu(I) species under simulated solar light illumination and in the presence of CO2 and H2O vapor (Fig. 24D). On further increase in the Cu2O amount, active species decreased due to its aggregation. Surface VO and Cu1+ act as active centers for the conversion of CO2 into methane. The enhancement of photocatalytic activity was attributed to high CO2 adsorption capacity, high electron mobility, and high concentration of VO. Based on the experimental results, they proposed a plausible mechanism for methane production, as shown in Fig. 24E. CO2˙− was formed by accepting the electron from VO site. The photogenerated electron in the presence of atomic hydrogen was used for the reduction of CO2˙− species to give methane over the Cu1+ sites of Cu–TiO2-x.
Lan et al.82 reported the defects induced during the loading of Cu. They synthesized a series of ultrafine highly crystalline metallic Cu nanoparticles deposited TiO2via a solvothermal method using alcohol (referred to as Cu/TiO2). The defects induced by the introduction of Cu during the synthesis decreased the bandgap of Cu/TiO2 (Fig. 25a). They found that CO was the only product formed during photocatalytic CO2 reduction using Cu/TiO2. The 0.5 wt% Cu/TiO2 catalyst produced 32.5 μmol g−1 h−1 of CO, which was 5.2 times higher as compared to pure TiO2 under irradiation of UV-visible light (Fig. 25b). The high activity and selectivity could be attributed to the oxygen vacancies in Cu/TiO2 catalysts. Importantly, the Cu/TiO2 catalyst stopped producing hydrogen after 2 h of light irradiation, whereas CO yield increased continuously with irradiation time. DFT calculation showed that the adsorption energy of CO on the Cu surface was much higher than that of H2 (Fig. 25c). Hence, with increasing reaction time, the accumulated CO species occupied the Cu surface and prevented the access of H ions to the Cu surface, resulting in the suppression of hydrogen evolution. However, the yield of CO generation was found to decrease in a sample having a Cu content more than 1 wt%. This was due to the aggregation of Cu and the light-shielding caused by the presence of excess Cu on the surface.
 | ||
| Fig. 25 (a) UV-vis DRS of different samples, (b) time profile for the generation of products, CO and H2 using 0.5 wt% Cu/TiO2 photocatalyst, and (c) by use of DFT, calculation of adsorption energy of H2 and CO on the Cu surface (reproduced from ref. 82 with permission from the Royal Society of Chemistry, copyright 2019). | ||
The generation of oxygen defects after heteroatom doping into the TiO2 lattice and its effect on photocatalytic CO2 conversion were studied by Pham et al.83 They synthesized Ag and Cu co-doped TiO2 over honeycombed structured polyurethane (referred to as Ag@Cu–TiO2/PU). Co-doping with 2 wt% Ag and 4 wt% Cu (referred to as 2Ag@4Cu/TiO2/PU) resulted in a higher Ti3+/Ti4+ ratio than the single doped Ag or Cu (6 wt% Ag or Cu@TiO2/PU). This indicated that the co-doping of Ag and Cu further enhanced Ti3+ and oxygen vacancies, as evident from XPS analysis. Enhanced absorption of visible light, separation of the electron and hole and adsorption of CO2 due to the presence of defects resulted in the enhancement of the total photocatalytic yield of 2Ag@4Cu/TiO2/PU under visible light illumination. The total product yield of CH4 and CO was found to be 880 and 550 μmol g−1 in 6 h using 2Ag@4Cu/TiO2/PU, respectively. They also observed a slight improvement in the CH4 and CO production yield at a rate of 933 and 588 μmol g−1 in 6 h using co-doped 2 wt% Cu and 4 wt% V–TiO2/PU under visible light illumination.84
Similarly, Wang et al.85 synthesized cobalt doped ordered mesoporous TiO2 by a multicomponent self-assembly process (referred to as Co–OMT-x, OMT stands for ordered mesoporous TiO2; the molar ratio of Co/Ti varied from 0.002 to 0.2; x = 1–8 corresponds to molar ratio of Co/Ti 0.002, 0.005, 0.01, 0.025, 0.05, 0.10, 0.15, and 0.20). The maximum CO2 conversion was found at 0.025 molar ratio of Co/Ti, with a yield of CO and CH4 at a rate of 1.94 and 0.09 μmol g−1 h−1, respectively (Fig. 26a). The greater selectivity for CH4 formation was observed when the molar ratio of Co/Ti was 0.2. This improvement in selectivity with an increase in the Co content was attributed to the formation of the nanocomposite of Co3O4/doped Co–TiO2 and increase in oxygen vacancies. As a result of doping of Co, the CB and VB shifted upward, resulting in the decrease in bandgap with an increase in Co content as shown in Fig. 26b. Fig. 26c shows the schematic illustration of the proposed mechanism for CO2 conversion.
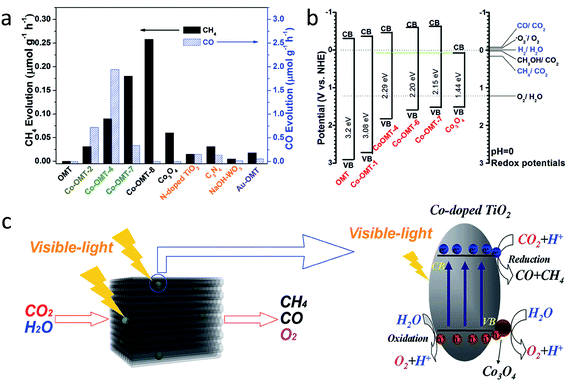 | ||
| Fig. 26 (a) Comparison of photocatalytic CO2 conversion using different samples, (b) valence band and conduction band position in different samples, (c) schematic representation of photocatalytic CO2 conversion over Co-doped mesoporous ordered TiO2 (reproduced from ref. 85 with permission from the Royal Society of Chemistry, copyright 2015). | ||
Different precursors of Ti can be used for the generation of inherent oxygen vacancies. Yaghoubi et al.86 synthesized TiO2 using the peroxo-titanium complex and found the generation of defects during the synthesis. The obtained crystalline TiO2 was composed of a mixed phase of anatase, rutile and brookite. The VB and CB of mixed-phase TiO2 were determined with the help of UPS and inverse photoemission spectroscopy (IPES), respectively (Fig. 27a and b). The bandgap determined by the above two techniques was 3.8 eV higher than that determined using DRS (3.1 eV as depicted in Fig. 27c) due to the high threshold energy required to create an unbound e− and h+ pair. UPS spectra show that the edge corresponds to midgap states at 1.7 eV below the Fermi level i.e. at 2.2 eV from the conduction band edge, which was also elucidated by the Urbach tail in the UV-visible DRS spectrum (Fig. 27c). XPS and ICP-OES were performed to rule out the possibility of extended absorption due to doping with heteroatoms. The formation of the mid-gap states within the bandgap was due to the presence of oxygen defects and Ti3+ and not because of heteroatom doping. The presence of midgap states was responsible for the absorption in the visible region. The mechanism for photocatalytic CO2 conversion was proposed (Fig. 27d), where illumination of the TiO2 with the photon of energy equal to and greater than 2.2 eV excited the electron from midgap state to the CB where the reduction of CO2 takes place. The hole in the mid-gap states oxidizes water to give a proton. The catalyst was active for CO2 conversion under both solar light and visible light illumination. The mixed-phase TiO2 showed CO and CH4 yield at a rate of 1357 and 360 ppm g−1 in 6 h under visible light illumination, which was 6.75 and 7.66 times better as compared to P25 TiO2, respectively. The total quantum yield was found to be of 0.0289% in the region of 250–564 nm.
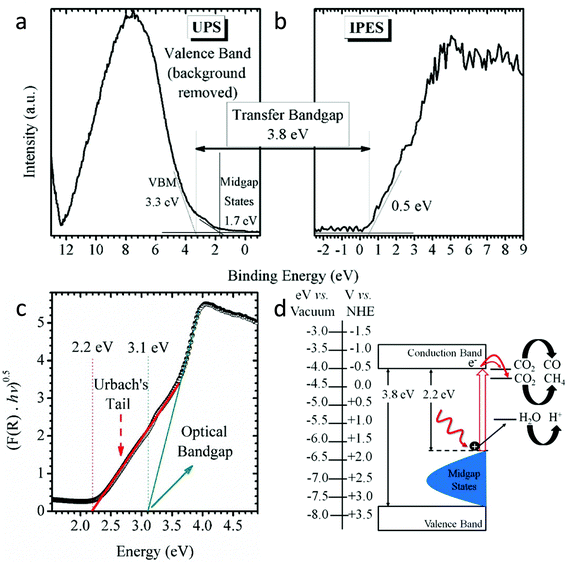 | ||
| Fig. 27 Valence band and conduction band of TiO2 nanoparticles determined using (a) UPS and (b) IPES spectra and (c) plot of Kubelka–Munk Function vs. energy derived from the UV-visible DRS spectrum of TiO2. The green line denotes the optical bandgap, whereas the red line shows Urbach's tail. (d) Schematic representation of the electronic structure of TiO2 in combination with a suggested diagram for photocatalytic CO2 conversion. The blue region shows the presence of extended localized states within the bandgap resulting in the absorption in the visible region (reproduced from ref. 86 with permission from the American Chemical Society, copyright 2015). | ||
Han et al.87 synthesized the defective truncated bi-pyramidal structure with co-exposed {101} and {001} facets of anatase TiO2 (referred to as TiO2–B) using TiB2 as the precursor by one-step hydrothermal treatment. To further improve the charge separation, nanosheets of SnS2 were loaded over defective TiO2–B (referred to as SnS2/TiO2–B). XPS studies indicated that the oxygen vacancies were maintained well even after the formation of the composite with SnS2 nanosheets. The improved light absorption and adsorption and activation of the CO2 molecule due to the presence of defects in TiO2 and enhanced separation of charge carriers as a result of the formation of the Z-scheme heterojunction between TiO2 and SnS2 nanosheets improved the photocatalytic performance of the sample. The highest CO production was observed at a rate of 58 μmol g−1 h−1 with a selectivity of 96.3% under visible light irradiation (Fig. 28a). In the Z-scheme mechanism, the electron from the CB of TiO2–B gets transferred to the hole in the VB of SnS2 (Fig. 28b). The electron present in the CB of SnS2 was then used for the conversion of the CO2 to CO.
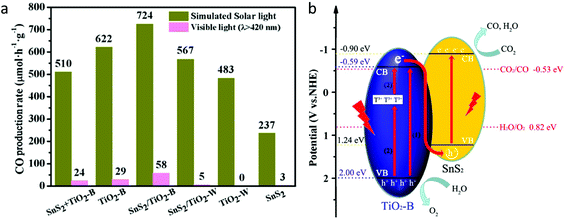 | ||
| Fig. 28 (a) Comparison of the yield of CO produced by photocatalytic CO2 conversion using SnS2/TiO2–B under simulated solar light and visible light and (b) schematic for the Z-scheme mechanism of separation of photogenerated charge carriers (reproduced from ref. 87 with permission from MDPI, copyright 2019). | ||
Another strategy adopted by Shi et al.88 was to construct a heterojunction between TiO2 and g-C3N4 to separate the photogenerated charge carriers and improve the activity. They synthesized the 0D/2D heterojunctions of oxygen defect rich TiO2/g-C3N4 (referred to as yTiO2−x–MCN) by in situ two-step pyrolysis of NH2-MIL-125(Ti) and melamine. HR-TEM images revealed that the 5 nm quantum dots of TiO2 were homogeneously distributed on the surface of the nanosheets of g-C3N4. XPS and EPR showed the existence of Ti3+ and oxygen vacancies in yTiO2−x–MCN. The g-value for the unpaired electron of g-C3N4 and oxygen vacancies of TiO2 is similar. On comparison of the EPR spectra of the TiO2–MCN (synthesized by one-step pyrolysis mixing of TiO2 and melamine), which was devoid of oxygen vacancies, MCN (g-C3N4 synthesized by thermal pyrolysis of melamine) and yTiO2−x–MCN revealed that the increase in intensity in yTiO2−x–MCN could be attributed to the existence of oxygen defects of TiO2 rather than an unpaired electron in g-C3N4. The charge transfer that occurs from 2D-g-C3N4 to 0D-TiO2 in less than 1 ps was revealed by the transient photo-luminescence and femtosecond and nanosecond pumped-probe transient absorption spectra. CO2 adsorption of yTiO2−x–MCN (8–10 cm3 g−1) was ten times higher than that of MCN (0.8 cm3 g−1). The presence of oxygen defects enhanced both absorption of light in the visible region and the CO2 adsorption. The photocatalytic performance was studied in the presence of an acetonitrile/triethanolamine mixture and Co(bpy)32+ as the cocatalyst in the presence of visible light. CO generation at a rate of 388.9 μmol g−1 using 2TiO2−x/MCN was observed to be five times higher than that of MCN (75.3 μmol g−1) in 5 h. The significant improvement in activity of TiO2−x/MCN was attributed to the enhanced visible light absorption, CO2 adsorption, large surface area and efficient charge separation due to the formation of an interface between TiO2 and g-C3N4. After absorption of light, the electron from g-C3N4 transfers to the conduction band of TiO2−x where the conversion of CO2 to CO takes place in the presence of the electron mediator Co(bpy)32+. A hole is generated on TiO2−x transfer to g-C3N4 where it gets removed by oxidation of triethanolamine, and this efficient transfer of the electron and hole pair across the heterojunction resulted in the effective separation of charge carriers.
Feng et al.89 reported the formation of Ti3+ ions while depositing the MgO layer over porous TiO2 by atomic layer deposition (ALD). Porous TiO2 was synthesized using the metal–organic framework MIL-125 as the Ti precursor. Five layers of MgO deposited by the ALD showed four times higher photocatalytic yield than porous TiO2 and 21 times better than P25. Uniform distribution of MgO over porous TiO2 generated the active site for CO2 reduction by increasing the amount of Ti3+ species on the surface and hydroxyl groups bonded to Mg and also helped in reduction of the surface photogenerated charge recombination rate by passivating the surface states of porous TiO2. With an increase in ALD cycles to more than five, photocatalytic activity for CO generation decreased due to the reduced contact of adsorbed CO2 with TiO2. The photocatalytic activity was found to be higher for the ALD deposited MgO than that from the wet impregnation (WI) method. This was due to the high concentration of Ti3+ and oxygen defects in the case of MgO deposited by the ALD method.
7. Conclusions and future directions
The defect engineering in TiO2 has raised tremendous interest in the scientific community and different protocols based on reduction and oxidation strategies have been introduced for the synthesis of oxygen vacant/Ti3+ induced TiO2. This review discussed various ways for the introduction of defects such as oxygen vacancies and Ti3+ generation and their impact on photocatalytic CO2 conversion. The formation of the disordered layer and concentration of defects play an important role in determining the product yield and selectivity in photocatalytic CO2 conversion. Defects significantly narrowed the bandgap, which resulted in improved absorption in the visible region. In addition, the defects provided the sites to bind and activate the CO2 into CO2˙−, which is much easier to reduce further and thus enhance the CO2 conversion yield.The point defects in TiO2 were generated by different synthesis methods such as treatment under a hydrogen atmosphere, inert gas (Ar, He, or N2), using a reducing agent, hydrogen plasma treatment, metallothermic reduction, doping with a heteroatom, etc. Although there are different methods reported in the literature, several of them required harsh conditions, hazardous chemicals, and costly and complex procedures or equipment. Therefore, the development of a low temperature, cost-effective and scalable process is needed for its practical application.
Thermal treatment in the presence of hydrogen gas at ambient pressure was found to be useful not only for the generation of defects but also to reduce the metal ion into metal nanoparticles and also to clean the surface of the catalyst. Also, it was observed that the product yield and selectivity depend on the particle size and degree of hydrogenation. Smaller particles of TiO2 dispersed over the silica support showed a higher degree of reduction than the large particles. It was also observed that the presence of an oxygen vacancy could alter the dispersion of metal nanoparticles and thus affect the photo-thermo-catalytic activity. The decoration of the surface of the defective TiO2 with chemical species like thiocyanate passivates the defects and also induces the electric field at the interface, which helped in the separation of charge carriers.
Defect generation using hydrides like NaBH4 is one of the safe and easiest ways for the generation of a reductive atmosphere. Also, the generation of defects in the presence of He, N2, Ar and vacuum was also reported. The concentration of vacancies generated after thermal treatment in an inert atmosphere was dependent on the partial pressure of oxygen. By using the flame reduction method, defects can be induced within a minute because of the faster heating rate and high temperature of the flame. The metallothermic reduction method is a cost-effective method as compared to the high pressure and temperature hydrogenation method. In this method, metals such as Al, Mg, Li and Zn were used as a reducing agent to capture lattice oxygen effectively. By using lithiothermic reduction, defects can be generated at room temperature.
In all the reduction methods, the concentration of defects was found to increase with an increase in the amount of reducing agent. Also, the enhancement in light absorption was observed with an increase in the concentration of defects. But a similar trend was not observed for the photocatalytic activity. Hence the optimum amount of defects is needed to get a better yield.
Along with the defects, the presence of particular facets was also found to impact the CO2 conversion yield. Facet engineering was found to be effective for the separation of charge carriers at different facets. Shi et al.77 generated disorder layers only on particular facets using mild reducing conditions and found that the chemical reactions on the facets were altered. The holes are supposed to accumulate at the {001} surface, but they observed that due to the formation of the electron-rich defective layer, the reduction of CO2 occurred over the {001} facets and oxidation over the {101} facets. Along with the generation of oxygen vacancies or Ti3+ in TiO2, attempts were also made to improve the charge carrier separation by facet selective deposition of metal nanoparticles, doping with heteroatoms like Co, Cu, etc., Z-scheme heterojunction formation with visible light active semiconductors like SnS2 and g-C3N4, and surface decoration with chemical species like thiocyanate, which helped induce an electric field and passivated the surface defects.
This review also discusses the theoretical aspects of the formation of different products. Theoretical studies revealed that the formaldehyde pathway is most preferred in the case of both defective and non-defective TiO2, while the carbene pathway is not favored over the defective TiO2 due to the formation of energetically unfavourable ˙C intermediates.
The photocatalytic CO2 conversion yield of defective TiO2 is summarized in Table 1. It is difficult to compare the yield as the reaction conditions reported by the different research groups were different. Also, the expression of the product yield in terms of μmol g−1 h−1 is inappropriate as it does not account for the intensity of the light source, photons falling on the reactor system, illumination area, etc. Also, it is difficult to extrapolate the yield in terms of per gram of catalyst as the yield does not vary linearly with the catalyst amount. Catalyst dispersion also plays a crucial role in determining the yield of the product.
There are several unknowns and challenges not yet addressed in this field. The nature and concentration of the defects and how they are helping in the improvement of photocatalytic activity are still not well understood. The defects created by adopting different synthetic methods have different physical and chemical properties and thus, assessment of the exact reason responsible for the enhancement of photocatalytic activity is another challenge. More information on structural distortion needs to be acquired using various in situ spectroscopy techniques. This will be helpful to rationalize the design of the photocatalyst. Efforts to produce C2 and higher products by utilizing the advantages provided by the defects present on the surface of TiO2 are needed. Recent work by Chen et al.90 who reported the activation of CO2 over defective Bi2O3 for the production of the dimethyl carbonate using methanol, and Polshettiwar et al.91 who reported activation of CO2 using defective dendritic fibrous nanosilica (DFNS) without any metal sites, could be a way forward for defect engineering in other catalytic materials.
The catalyst's stability is another critical issue as the strong adsorption of the intermediate species at defect sites may deactivate the catalyst. Adsorption of reactants and desorption of products are important factors. Therefore, the removal of the products generated during the reaction is necessary to further prevent their oxidation into CO2 or other products by accepting a hole. One of the ways to improve the adsorption and desorption kinetics is by carrying out the photothermal reactions where the CO2 conversion can be performed at a slightly higher temperature than room temperature. The high temperature may hamper the adsorption of CO2, but temperature optimization can result in the desired results where desorption as well as adsorption could be possible.
Along with tailoring of defects in TiO2, designing a specific photoreactor is also equally important in the view of efficient removal of the products as well as effective utilization of light falling on the system. A monolith photoreactor design holds promise for better product yields.92
Overall, defect engineering in TiO2 is a potential approach for the production of value-added products and chemicals from photocatalytic CO2 conversion by utilizing solar energy.
Conflicts of interest
There are no conflicts to declare.Acknowledgements
We acknowledge the funding support of the Department of Atomic Energy (under project no. R&D-TIFR-RTI4003) and Mission Innovation India, Department of Science & Technology, Government of India.References
- T. Kong, Y. Jiang and Y. Xiong, Photocatalytic CO2 conversion: What can we learn from conventional COx hydrogenation?, Chem. Soc. Rev., 2020, 49, 6579–6591 RSC.
- M. Meinshausen, N. Meinshausen, W. Hare, S. C. B. Raper, K. Frieler, R. Knutti, D. J. Frame and M. R. Allen, Greenhouse-gas emission targets for limiting global warming to 2 °C, Nature, 2009, 458, 1158–1162 CrossRef CAS.
- M. Khalil, J. Gunlazuardi, T. A. Ivandini and A. Umar, Photocatalytic conversion of CO2 using earth-abundant catalysts: A review on mechanism and catalytic performance, Renew. Sust. Energ. Rev, 2019, 113, 109246 CrossRef CAS.
- Y. Zhang, B. Xia, J. Ran, K. Davey and S. Z. Qiao, Atomic-level reactive sites for semiconductor-based photocatalytic CO2 reduction, Adv. Energy Mater., 2020, 10, 1903879 CrossRef CAS.
- X. Chang, T. Wang and J. Gong, CO2 photo-reduction: insights into CO2 activation and reaction on surfaces of photocatalysts, Energy Environ. Sci., 2016, 9, 2177–2196 RSC.
- J. Albero, Y. Peng and H. García, Photocatalytic CO2 reduction to C2+ products, ACS Catal., 2020, 10(10), 5734–5749 CrossRef CAS.
- S. R. Lingampalli, M. M. Ayyub and C. N. R. Rao, Recent progress in the photocatalytic reduction of carbon dioxide, ACS Omega, 2017, 2, 2740–2748 CrossRef CAS.
- T. P. Nguyen, D. L. T. Nguyen, V. H. Nguyen, T.-H. Le, D.-V. N. Vo, Q. T. Trinh, S.-R. Bae, S. Y. Chae, S. Y. Kim and Q. V. Le, Recent Advances in TiO2-Based photocatalysts for reduction of CO2 to fuels, Nanomaterials, 2020, 10, 337 CrossRef CAS.
- S. Sato, T. Arai and T. Morikawa, Toward solar-driven photocatalytic CO2 reduction using water as an electron donor, Inorg. Chem., 2015, 54, 5105–5113 CrossRef CAS.
- M. Halmann, Photoelectrochemical reduction of aqueous carbon dioxide on p-type gallium phosphide in liquid junction solar cells, Nature, 1978, 275, 115–116 CrossRef CAS.
- T. Inoue, A. Fujishima, S. Konishi and K. Honda, Photoelectrocatalytic reduction of carbon dioxide in aqueous suspensions of semiconductor powders, Nature, 1979, 277, 637–638 CrossRef CAS.
- J. Schneider, M. Matsuoka, M. Takeuchi, J. Zhang, Y. Horiuchi, M. Anpo and D. W. Bahnemann, Understanding TiO2 photocatalysis: Mechanisms and materials, Chem. Rev., 2014, 114(19), 9919–9986 CrossRef CAS.
- J. Low, L. Zhang, B. Zhu, Z. Liu and J. Yu, TiO2 photonic crystals with localized surface photothermal effect and enhanced photocatalytic CO2 reduction activity, ACS Sustainable Chem. Eng., 2018, 6, 15653–15661 CrossRef CAS.
- A. Meng, L. Zhang, B. Cheng and J. Yu, TiO2–MnOx–Pt hybrid multiheterojunction film photocatalyst with enhanced photocatalytic CO2-reduction activity, ACS Appl. Mater. Interfaces, 2019, 11, 5581–5589 CrossRef CAS.
- F. Xu, B. Zhu, B. Cheng, J. Yu and J. Xu, 1D/2D TiO2/MoS2 hybrid nanostructures for enhanced photocatalytic CO2 reduction, Adv. Opt. Mater., 2018, 6(23), 1800911 CrossRef.
- D. Gao, X. Wu, P. Wang, Y. Xu, H. Yu and J. Yu, Simultaneous realization of direct photoinduced deposition and improved H2-evolution performance of Sn-nanoparticle-modified TiO2 photocatalyst, ACS Sustainable Chem. Eng., 2019, 7, 10084–10094 CrossRef CAS.
- X. Chen and S. S. Mao, Titanium dioxide nanomaterials: Synthesis, properties, modifications, and applications, Chem. Rev., 2007, 107, 2891–2959 CrossRef CAS.
- R. Asahi, T. Morikawa, T. Ohwaki, K. Aoki and Y. Taga, Visible light photocatalysis in nitrogen-doped titanium oxides, Science, 2001, 293, 269–271 CrossRef CAS.
- S. G. Kumar and L. G. Devi, Review on modified TiO2 photocatalysis under UV/Visible light: Selected results and related mechanisms on interfacial charge carrier transfer dynamics, J. Phys. Chem. A, 2011, 115(46), 13211–13241 CrossRef CAS.
- M. Nasr, C. Eid, R. Habchi, P. Miele and M. Bechelany, Recent progress on titanium dioxide nanomaterials for photocatalytic applications, ChemSusChem, 2018, 11(18), 3023–3047 CrossRef CAS.
- S. Xie, H. Zhang, G. Liu, X. Wu, J. Lin, Q. Zhang and Y. Wang, Tunable localized surface plasmon resonances in MoO3−x-TiO2 nanocomposites with enhanced catalytic activity for CO2 photoreduction under visible light, Chinese, J. Catal., 2020, 41(7), 1125–1131 CrossRef CAS.
- F. Xu, K. Meng, B. Cheng, S. Wang, J. Xu and J. Yu, Unique S-scheme heterojunctions in self-assembled TiO2/CsPbBr3 hybrids for CO2 photoreduction, Nat. Commun., 2020, 11, 4613 CrossRef CAS.
- A. Li, T. Wang, X. Chang, Z.-J. Zhao, C. Li, Z. Huang, P. Yang, G. Zhou and J. Gong, Tunable syngas production from photocatalytic CO2 reduction with mitigated charge recombination driven by spatially separated cocatalysts, Chem. Sci., 2018, 9(24), 5334–5340 RSC.
- Y. Xia and J. Yu, Reaction: Rational Design of Highly Active Photocatalysts for CO2 Conversion, Chem, 2020, 6(5), 1039–1040 CAS.
- M.-Q. Yang and Y.-J. Xu, Photocatalytic conversion of CO2 over graphene-based composites: current status and future perspective, Nanoscale Horiz., 2016, 1, 185–200 RSC.
- K.-Q. Lu, Y.-H. Li, F. Zhang, M.-Y. Qi, X. Chen, Z.-R. Tang, Y. M. A. Yamada, M. Anpo, M. Conte and Y.-J. Xu, Rationally designed transition metal hydroxide nanosheet arrays on graphene for artificial CO2 reduction, Nat. Commun., 2020, 11, 5181 CrossRef CAS.
- X. Pan and Y.-J. Xu, Defect-Mediated Growth of Noble-Metal (Ag, Pt, and Pd) Nanoparticles on TiO2 with Oxygen Vacancies for Photocatalytic Redox Reactions under Visible Light, J. Phys. Chem. C, 2013, 117, 17996–18005 CrossRef CAS.
- L. Yuan, K.-Q. Lu, F. Zhang, X. Fu and Y.-J. Xu, Unveiling the interplay between light-driven CO2 photocatalytic reduction and carbonaceous residues decomposition: A case study of Bi2WO6-TiO2 binanosheets, Appl. Catal., B, 2018, 237, 424–431 CrossRef CAS.
- L. Yuan and Y.-J. Xu, Photocatalytic conversion of CO2 into value-added and renewable fuels, Appl. Surf. Sci., 2015, 342, 154–167 CrossRef CAS.
- K. Nakata and A. Fujishima, TiO2 photocatalysis: Design and applications, J. Photochem. Photobiol., C, 2012, 13(3), 169–189 CrossRef CAS.
- X. Chen, L. Liu and F. Huang, Black titanium dioxide (TiO2) nanomaterials, Chem. Soc. Rev., 2015, 44, 1861–1885 RSC.
- A. Chatzitakis and S. Sartori, Recent advances in the use of black TiO2 for production of hydrogen and other solar fuels, ChemPhysChem, 2019, 20, 1–11 CrossRef.
- X. Pan, M.-Q. Yang, X. Fu, N. Zhang and Y.-J. Xu, Defective TiO2 with oxygen vacancies: synthesis, properties and photocatalytic applications, Nanoscale, 2013, 5, 3601–3614 RSC.
- B. B. Adormaa, W. K. Darkwah and Y. Ao, Oxygen vacancies of the TiO2 nano-based composite photocatalysts in visible light responsive photocatalysis, RSC Adv., 2018, 8, 33551–33563 RSC.
- X. Chang, T. Wang and J. Gong, CO2 Photo-reduction: Insights into CO2 Activation and Reaction on Surfaces of Photocatalysts, Energy Environ. Sci., 2016, 9, 2177–2196 RSC.
- X. B. Chen, L. Liu, P. Y. Yu and S. S. Mao, Increasing solar absorption for photocatalysis with black hydrogenated titanium dioxide nanocrystals, Science, 2011, 331, 746 CrossRef CAS.
- A. Naldoni, M. Altomare, G. Zoppellaro, N. Liu, S. Kment, R. Zboril and P. Schmuki, Photocatalysis with reduced TiO2: From black TiO2 to cocatalyst- free hydrogen production, ACS Catal., 2019, 9, 345–364 CrossRef CAS.
- T. L. Thompson and J. T. Yates Jr, TiO2-based photocatalysis: surface defects, oxygen and charge transfer, Top. Catal., 2005, 35, 3–4 CrossRef.
- K. K. Adepalli, M. Kelsch, R. Merkle and J. Maier, Influence of line defects on the electrical properties of single crystal TiO2, Adv. Funct. Mater., 2013, 23, 1798–1806 CrossRef CAS.
- H. Zhao, F. Pan and Y. Li, A review on the effects of TiO2 surface point defects on CO2 photoreduction with H2O, J. Materiomics, 2017, 3, 17–32 CrossRef.
- L.-B. Xiong, J.-L. Li, B. Yang and Y. Yu, Ti3+ in the surface of titanium dioxide: generation, properties and photocatalytic application, J. Nanomater., 2012, 2012, 831524 Search PubMed.
- T. L. Thompson, O. Diwald and J. T. Yates, CO2 as a Probe for monitoring the surface defects on TiO2 (110) temperature-programmed desorption, J. Phys. Chem. B, 2003, 107(42), 11700–11704 CrossRef CAS.
- S. Huygh, A. Bogaerts and E. C. Neyts, How oxygen vacancies activate CO2 dissociation on TiO2 anatase (001), J. Phys. Chem. C, 2016, 120(38), 21659–21669 CrossRef CAS.
- J. Lee, D. C. Sorescu and X. Deng, Electron-induced dissociation of CO2 on TiO2 (110), J. Am. Chem. Soc., 2011, 133, 10066–10069 CrossRef CAS.
- S. Tan, Y. Zhao, J. Zhao, Z. Wang, C. Ma, A. Zhao, B. Wang, Y. Luo, J. Yang and J. Hou, CO2 dissociation activated through electron attachment on the reduced rutile TiO2 (110)-1×1 surface, Phys. Rev. B, 2011, 84, 155418 CrossRef.
- F. M. Hossain and G. E. Murch, The effect of defect disorder on the electronic structure of rutile TiO2−x, Defect Diffus. Forum, 2006, 251–252, 1–12 CAS.
- A. Razzaq and S.-I. In, TiO2 based nanostructures for photocatalytic CO2 conversion to valuable chemicals, Micromachines, 2019, 10(5), 326 CrossRef.
- Y. Ji and Y. Luo, New mechanism for photocatalytic reduction of CO2 on the anatase TiO2 (101) surface: the essential role of oxygen vacancy, J. Am. Chem. Soc., 2016, 138(49), 15896–15902 CrossRef CAS.
- J.-Y. Liu, X.-Q. Gong and A. N. Alexandrova, Mechanism of CO2 photocatalytic reduction to methane and methanol on defective anatase TiO2 (101): A Density Functional Theory Study, J. Phys. Chem. C, 2019, 123, 3505–3511 CrossRef CAS.
- X. Liu, G. Zhu, X. Wang, X. Yuan, T. Lin and F. Huang, Progress in black titania: A new material for advanced photocatalysis, Adv. Energy Mater., 2016, 6(17), 1600452 CrossRef.
- J. Liu, B. Liu, Y. Ren, Y. Yuan, H. Zhao, H. Yang and S. F. Liu, Hydrogenated nanotubes/nanowires assembled from TiO2 nanoflakes with exposed {111} facets: excellent photo-catalytic CO2 reduction activity and charge separation mechanism between (111) and (
![[1 with combining macron]](https://www.rsc.org/images/entities/char_0031_0304.gif)
![[1 with combining macron]](https://www.rsc.org/images/entities/char_0031_0304.gif)
![[1 with combining macron]](https://www.rsc.org/images/entities/char_0031_0304.gif) ) polar surfaces, J. Mater. Chem. A, 2019, 7, 14761–14775 RSC.
) polar surfaces, J. Mater. Chem. A, 2019, 7, 14761–14775 RSC. - X. Xuan, S. Tu, H. Yu, X. Du, Y. Zhao, J. He, H. Dong, X. Zhang and H. Huang, Size-dependent selectivity and activity of CO2 photoreduction over black nano-titanias grown on dendritic porous silica particles, Appl. Catal. B, 2019, 255, 117768 CrossRef CAS.
- T. Billo, F.-Y. Fu, P. Raghunath, I. Shown, W.-F. Chen, H.-T. Lien, T.-H. Shen, J.-F. Lee, T.-S. Chan, K.-Y. Huang, C.-I. Wu, M. C. Lin, J.-S. Hwang, C.-H. lee, L.-C. Chen and K.-H. Chen, Ni-Nanocluster Modified Black TiO2 with Dual Active Sites for Selective Photocatalytic CO2 Reduction, Small, 2018, 14, 1702928 CrossRef.
- F.-Y. Fu, I. Shown, C.-S. Li, P. Raghunath, T.-Y. Lin, T. Billo, H.-L. Wu, C.-I. Wu, P.-W. Chung, M.-C. Lin, L.-C. Chen and K.-H. Chen, KSCN-induced interfacial dipole in black TiO2 for enhanced photocatalytic CO2 reduction, ACS Appl. Mater. Interfaces, 2019, 11(28), 25186–25194 CrossRef CAS.
- J. Ye, J. He, S. Wang, X. Zhou, Y. Zhang, G. Liu and Y. Yang, Nickel-loaded black TiO2 with inverse opal structure for photocatalytic reduction of CO2 under visible light, Sep. Purif. Technol., 2019, 220, 8–15 CrossRef CAS.
- L. Liu, F. Gao, H. Zhao and Y. Li, Tailoring Cu valence and oxygen vacancy in Cu/TiO2 catalysts for enhanced CO2 photoreduction efficiency, Appl. Catal. B, 2013, 134–135, 349–358 CrossRef CAS.
- Y. Li, C. Wang, M. Song, D. Li, X. Zhang and Y. Liu, TiO2−x/CoOx photocatalyst sparkles in photothermocatalytic reduction of CO2 with H2O steam, Appl. Catal. B, 2019, 243, 760–770 CrossRef CAS.
- P. Martelli, R. Caputo, A. Remhof, P. Mauron, A. Borgschulte and A. Züttel, Stability and Decomposition of NaBH4, J. Phys. Chem. C, 2010, 114, 7173–7177 CrossRef CAS.
- S. Sorcar, Y. Hwang, C. A. Grimes and S.-I., Highly enhanced and stable activity of defect-induced titania nanoparticles for solar light-driven CO2 reduction into CH4, Mater. Today, 2017, 20, 507–515 CrossRef CAS.
- S. Sorcar, J. Thompson, Y. Hwang, Y. H. Park, T. Majima, C. A. Grimes, J. R. Durrant and S.-I. In, High-rate solar-light photoconversion of CO2 to fuel: controllable transformation from C1 to C2 products, Energy Environ. Sci., 2018, 11, 3183–3193 RSC.
- S. Sorcar, Y. Hwang, J. Lee, H. Kim, K. M. Grimes, C. A. Grimes, J.-W. Jung, C.-H. Cho, T. Majima, M. R. Hoffmann and S.-I. In, CO2, water, and sunlight to hydrocarbon fuels: a sustained sunlight to fuel (Joule-to-Joule) photoconversion efficiency of 1%, Energy Environ. Sci., 2019, 12, 2685–2696 RSC.
- Y. Yan, M. Han, A. Konkin, T. Koppe, D. Wang, T. Andreu, G. Chen, U. Vetter, J. R. Morante and P. Schaaf, Slightly hydrogenated TiO2 with enhanced photocatalytic performance, J. Mater. Chem. A, 2014, 2, 12708–12716 RSC.
- L. Liu, H. Zhao, J. M. Andino and Y. Li, Photocatalytic CO2 Reduction with H2O on TiO2 Nanocrystals: Comparison of Anatase, Rutile, and Brookite Polymorphs and Exploration of Surface Chemistry, ACS Catal., 2012, 2(8), 1817–1828 CrossRef CAS.
- X. Xin, T. Xu, L. Wang and C. Wang, Ti3+-self doped brookite TiO2 single-crystalline nanosheets with high solar absorption and excellent photocatalytic CO2 reduction, Sci. Rep., 2016, 6, 23684 CrossRef CAS.
- J. Zhao, Y. Li, Y. Zhu, Y. Wang and C. Wang, Enhanced CO2 photoreduction activity of black TiO2−coated Cu nanoparticles under visible light irradiation: Role of metallic Cu, Appl. Catal., A, 2016, 510, 34–41 CrossRef CAS.
- P. Kar, S. Zeng, Y. Zhang, E. Vahidzadeh, A. Manuel, R. Kisslinger, K. M. Alam, U. K. Thakur, N. Mahdi, P. Kumar and K. Shankar, High rate CO2 photoreduction using flame annealed TiO2 nanotubes, Appl. Catal., B, 2019, 243, 522–536 CrossRef CAS.
- W. Tu, Y. Zhou, Q. Liu, S. Yan, S. Bao, X. Wang, M. Xiao and Z. Zou, An in Situ simultaneous reduction-hydrolysis technique for fabrication of TiO2 -graphene 2D sandwich-like hybrid nanosheets: graphene-promoted selectivity of photocatalytic-driven hydrogenation and coupling of CO2 into methane and ethane, Adv. Funct. Mater., 2013, 23, 1743–1749 CrossRef CAS.
- A. Vignes, Metallurgical Thermochemistry in Extractive Metallurgy 1: Basic Thermodynamics and Kinetics, John Wiley & Sons, Inc., USA, 2013 Search PubMed.
- G. Yin, Q. Bi, W. Zhao, J. Xu, T. Lin and F. Huang, Efficient Conversion of CO2 to Methane Photocatalyzed by Conductive Black Titania, ChemCatChem, 2017, 9, 4389–4396 CrossRef CAS.
- J. Gao, Q. Shen, R. Guan, J. Xue, X. Liu, H. Jia, Q. Li and Y. Wu, Oxygen vacancy self-doped black TiO2 nanotube arrays by aluminothermic reduction for photocatalytic CO2 reduction under visible light illumination, J. CO2 Util., 2020, 35, 205–215 CrossRef CAS.
- G. Ou, Y. Xu, B. Wen, R. Lin, B. Ge, Y. Tang, Y. Liang, C. Yang, K. Huang, D. Zu, R. Yu, W. Chen, J. Li, H. Wu, L.-M. Liu and Y. Li, Tuning Defects in Oxides at Room Temperature by Lithium Reduction, Nat. Commun., 2018, 9, 1302 CrossRef.
- C. Wang, J. Yang, T. Li, Z. Shen, T. Guo, H. Zhang and Z. Lu, In Situ Tuning of Defects and Phase Transition in Titanium Dioxide by Lithiothermic Reduction, ACS Appl. Mater. Interfaces, 2020, 12(5), 5750–5758 CrossRef.
- K. Sasan, F. Zuo, Y. Wang and P. Feng, Self-doped Ti3+–TiO2 as a photocatalyst for the reduction of CO2 into a hydrocarbon fuel under visible light irradiation, Nanoscale, 2015, 7, 13369–13372 RSC.
- W. Fang, L. Khrouz, Y. Zhou, B. Shen, C. Dong, M. Xing, S. Mishra, S. Daniele and J. Zhang, Reduced {001}-TiO2−x photocatalysts: noble-metal-free CO2 photoreduction for selective CH4 evolution, Phys. Chem. Chem. Phys., 2017, 19, 13875–13881 RSC.
- L. Liu, Y. Jiang, H. Zhao, J. Chen, J. Cheng, K. Yang and Y. Li, Engineering Coexposed {001} and {101} Facets in Oxygen-Deficient TiO2 Nanocrystals for Enhanced CO2 Photoreduction under Visible Light, ACS Catal., 2016, 6, 1097–1108 CrossRef CAS.
- Y. Liu, C. Miao, P. Yang, Y. He, J. Feng and D. Li, Synergetic promotional effect of oxygen vacancy-rich ultrathin TiO2 and photochemical induced highly dispersed Pt for photoreduction of CO2 with H2O, Appl. Catal., B, 2019, 244, 919–930 CrossRef CAS.
- D. R. Shi and P. Y. Chen, Controlled Formation of Defective Shell on TiO2 (001) Facets for Enhanced Photocatalytic CO2 Reduction, ChemCatChem, 2019, 11, 2270–2276 CrossRef.
- W. Qingli, Z. Zhaoguo, C. Xudong, H. Zhengfeng, D. Peimei, C. Yi and Z. Xiwen, Photoreduction of CO2 using black TiO2 films under solar light, J. CO2 Util., 2015, 12, 7–11 CrossRef.
- X. Liu, M. Ye, S. Zhang, G. Huang, C. Li, J. Yu, P. K. Wong and S. Liu, Enhanced photocatalytic CO2 valorization over TiO2 hollow microspheres by synergetic surface tailoring and Au decoration, J. Mater. Chem. A, 2018, 6, 24245 RSC.
- G. Yin, X. Haung, T. Chen, W. Zhao, Q. Bi, J. Xu, Y. Han and F. Haung, Hydrogenated Blue Titania for Efficient Solar-to-Chemical Conversions: Preparation, Characterization, and Reaction Mechanism of CO2 Reduction, ACS Catal., 2018, 8(2), 1009–1017 CrossRef CAS.
- S. Zhu, S. Liang, Y. Tong, X. An, J. Long, X. Fu and X. Wang, Photocatalytic reduction of CO2 with H2O to CH4 on Cu(i) supported TiO2 nanosheets with defective {001} facets, Phys. Chem. Chem. Phys., 2015, 17, 9761–9770 RSC.
- Y. Lan, Y. Xie, J. Chen, Z. Hu and D. Cui, Selective photocatalytic CO2 reduction on copper–titanium dioxide: a study of the relationship between CO production and H2 suppression, Chem. Commun., 2019, 55, 8068 RSC.
- T.-D. Pham and B.-K. Lee, Novel capture and photocatalytic conversion of CO2 into solar fuels by metals co-doped TiO2 deposited on PU under visible light, Appl. Catal., A, 2017, 529, 40–48 CrossRef CAS.
- T.-D. Pham and B.-K. Lee, Novel photocatalytic activity of Cu@V co-doped TiO2/PU for CO2 reduction with H2O vapor to produce solar fuels under visible light, J. Catal., 2017, 345, 87–95 CrossRef CAS.
- T. Wang, X. Meng, G. Liu, K. Chang, P. Li, Q. Kang, L. Liu, M. Li, S. Ouyang and J. Ye, In situ synthesis of ordered mesoporous Co-doped TiO2 and its enhanced photocatalytic activity and selectivity for the reduction of CO2, J. Mater. Chem. A, 2015, 3, 9491 RSC.
- H. Yaghoubi, Z. Li, Y. Chen, H. T. Ngo, V. R. Bhethanabolta, B. Joseph, S. Ma, R. Schlaf and A. Takshi, Toward a Visible Light-Driven Photocatalyst: The Effect of Midgap-States-Induced Energy Gap of Undoped TiO2 Nanoparticles, ACS Catal., 2015, 5(1), 327–335 CrossRef CAS.
- A. Han, M. Li, S. Zhang, X. Zhu, J. Han, Q. Ge and H. Wang, Ti3+ Defective SnS2/TiO2 Heterojunction Photocatalyst for Visible-Light Driven Reduction of CO2 to CO with High Selectivity, Catalysts, 2019, 9, 927 CrossRef CAS.
- H. Shi, S. Long, S. Hu, J. Hou, W. Ni, C. Song, K. Li, G. G. Gurzadyan and X. Guo, Interfacial charge transfer in 0D/2D defect-rich heterostructures for efficient solar-driven CO2 reduction, Appl. Catal., B, 2019, 245, 760–769 CrossRef CAS.
- X. Feng, F. Pan, H. Zhao, W. Deng, P. Zhang, H.-C. Zhou and Y. Li, Atomic layer deposition enabled MgO surface coating on porous TiO2 for improved CO2 photoreduction, Appl. Catal., B, 2018, 238, 274–283 CrossRef CAS.
- S. Chen, H. Wang, Z. Kang, S. Jin, X. Zhang, X. Zheng, Z. Qi, J. Zhu, B. Pan and Y. Xie, Oxygen vacancy associated single-electron transfer for photofixation of CO2 to long-chain chemicals, Nat. Commun., 2019, 10, 788 CrossRef CAS.
- A. K. Mishra, R. Belgamwar, R. Jana, A. Datta and V. Polshettiwar, Proc. Natl. Acad. Sci. U. S. A., 2020, 117, 6383–6390 CrossRef CAS.
- M. Tahir and N. A. S. Amin, Photocatalytic CO2 reduction and kinetic study over In/TiO2 nanoparticles supported microchannel monolith photoreactor, Appl. Catal., A, 2013, 467, 483–496 CrossRef CAS.
| This journal is © The Royal Society of Chemistry 2021 |


