 Open Access Article
Hemin-doped metal–organic frameworks based nanozyme electrochemical sensor with high stability and sensitivity for dopamine detection†
Kai Kanga,
Beibei Wanga,
Xueping Ji *ab,
Yuheng Liua,
Wenrui Zhaoa,
Yaqing Dua,
Zhiyong Guo
 c and
Jujie Ren*d
aSchool of Pharmacy, Hebei Medical University, Shijiazhuang 050017, PR China. E-mail: xuepingji@126.com; jujieren@126.com; Tel: +86-311-86265593
bHebei Key Laboratory of Forensic Medicine, Shijiazhuang 050017, PR China
cSchool of Materials Science and Chemical Engineering, Ningbo University, Ningbo 315211, PR China
dDepartment of Chemistry, School of Sciences, Hebei University of Science and Technology, Shijiazhuang 050018, PR China
First published on 11th January 2021
Abstract
This study reports a new type of artificial nanozyme based on Hemin-doped-HKUST-1 (HKUST-1, also referred to as MOF-199; a face-centered-cubic MOF containing nanochannels) as a redox mediator for the detection of dopamine (DA). Hemin-doped-HKUST-1 was successfully synthesized by one-pot hydrothermal method, which was combined with reduced graphene oxide (rGO) modified on a glassy carbon electrode (GCE) to construct a sensor (Hemin-doped HKUST-1/rGO/GCE). The morphology and structure of Hemin-doped-HKUST-1 were characterized by X-ray diffraction (XRD), scanning electron microscope (SEM), transmission electron microscope (TEM) and infrared spectra (IR) techniques. The Hemin-doped HKUST-1/rGO nanozyme showed an excellent electrocatalytic activity for DA oxidation, which is due to the enhanced Hemin activity through the formation of a metal–organic framework (MOFs) and the synergy between the Hemin-doped HKUST-1 and rGO in nanozyme. The resulted sensor exhibited a high sensitivity of 1.224 μA μM−1, with a lower detection limit of 3.27 × 10⁻⁸ M (S/N = 3) and a wide linear range of 0.03–10 μM for DA detection. In addition, due to the stabilizing effect of MOFs on heme, the sensor showed satisfactory stability and has been successfully applied to the detection of DA in serum samples, indicating that this work has potential value in clinical work.
1. Introduction
Dopamine (DA) is an important catecholamine neuro-transmitter that transmits information between the brain and nerve cells of the human body and is responsible for the regulation of hormonal balance which plays a critical role in the human body and brain.1 Abnormal DA level is an indication of neurological disorders such as Parkinson's disease, senile dementia, and schizophrenia etc.2 The detection and quantification of DA is very important for the diagnosis, monitoring, prevention and treatment of these neurological diseases. Therefore, sensitive and accurate analytical method for the detection of DA is essential in the clinical diagnosis of neurological diseases.3–5 In recent years, different analytical methods have been reported for DA determination. Common DA detection methods include high performance liquid chromatography (HPLC) with fluorimetric detection,6 gas chromatography-mass spectrometry,7 chemiluminescence,8 colorimetry,9 spectrophotometric methods,10 and capillary electrophoresis,11 etc. Among various methods, the electrochemical method has attracted more attention due to its fast, simple, accuracy properties in recent years.12 Furthermore, electrochemical sensors are cost effective and are used for the detection of biomolecules on a wide range of substrates.13,14 However, in order to enhance the signal, a variety of redox mediators and enzymes as well as aptamers are used to modify the electrode, which potentially increase the complexity and cost of the methods.15,16 In addition, biological enzymes usually have poor stability and cannot work in harsh environments. For this reason, there is an urgent need to find a novel nanozyme-based multifunctional probe with intrinsic redox activity, good biocompatibility and catalytic properties to overcome the limitations associated with current electrochemical devices.17Metal–organic frameworks (MOFs), synthesized by assembling metal ions with organic ligands, have recently emerged as new versatile materials with fascinating structures and intriguing properties.18–20 In particular, their high porosity, large surface area and chemical tunability, as well as exposed active sites, provide MOFs with the opportunity to develop MOF-based biomimetic catalytic systems by decorating them with metalloporphyrins and analogs.21 However, the application of MOFs in electrochemical aspect is limited due to their inherent drawbacks, including poor electron transfer capability and unsteadiness in water environments.22
Hemin, a well-known natural metalloporphyrin, which is the active center of the hemeprotein family including cytochromes, peroxidases, myoglobins, and hemoglobins, used as redox mediators based on the reversible redox of Fe3+/Fe2+, can catalyze a variety of oxidation reactions like peroxidase enzymes.23 Nevertheless, Hemin often suffers from limited lifetime, and is easily deactivated by the formation of dimers due to the strong π–π conjugation of the porphyrin ring.24 In 2011, Larsen and coworkers reported a simple method to encapsulate heme into HKUST-1 MOFs (HKUST-1, also referred to as MOF-199; a face-centered-cubic MOF containing nanochannels) and mimicked heme enzymes in a solid state.38 This assay presents an attractive and straightforward approach to entrap active catalysts into MOFs, bringing MOFs some new properties and expanding their catalytic performance. Thereafter, it becomes a hot trend to incorporate porphyrins or metalloporphyrins into MOFs for a large variety of applications.25
Liu and co-workers used MIL-101 as a host matrix material to anchor Hemin and simulate the peptidic microenvironment of the native peroxidase.26 Chi and co-workers encapsulated Hemin in HKUST-1 MOFs for catalyzing chemiluminescence reaction of H2O2–luminol system and detecting glucose in the neutral condition.27 Yuan and co-workers also encapsulated Hemin in MIL-88(Fe) for catalyzing thrombin (TB) with enzyme.28 However, it is difficult to increase the content of Hemin by encapsulating Hemin in MOFs. In 2016, Wang and co-workers used copper as the metal ion and Hemin as the ligand to construct novel MOFs.29 Compared to the method of encapsulating Hemin into MOFs, using it as a ligand may reduce porosity and stability.
Graphene and its derivatives have been extensively applied in electrochemistry due to the specific structure and properties, such as high electrical conductivity, good biocompatibility, large surface area, rapid heterogeneous electron transfer rate, and low costs. In our previous work, we used the electrochemical method to produce the reduced graphene oxide (rGO), which is a relatively simple approach to obtain highly sensitive electrode sensing interface.30 Combining graphene with MOFs will greatly improve the electrical properties of MOFs.29
Inspired by these reported works and our previous researches,30–32 we used a one-pot, general method to synthesize a novel multifunctional MOF nanozyme (denoted as Hemin-doped-HKUST-1) by using Hemin as the ligand to replace a part of 1,3,5-benzenetricarboxylic acid (BTC) in HKUST-1 and further used it to compound electrochemical rGO to construct an electrochemical sensor for DA detection. The Hemin-doped-HKUST-1/rGO in our system has the following three major advantages. Firstly, compared with previously reported MOFs, our synthesized Hemin-doped-HKUST-1 with both micropore and mesopore could be employed as an ideal microreactor for different biological samples. Secondly, the Hemin-doped-HKUST-1 could act as redox mediators directly for signal generation based on the reversible redox of Fe3+/Fe2+ within Hemin, and the content of the Hemin could be controlled easily. Finally, the modified electrode not only exhibit high sensitivity to DA, but also has good biocompatibility and excellent chemical stability through the strong interaction of Hemin-doped-HKUST-1 and rGO.
2. Experimental section
2.1 Chemicals
Iron protoporphyrin IX (Hemin), 1,3,5-benzenetricarboxylic acid (BTC), Cu(NO3)2·3H2O obtained from Sigma, were used without further purification. N,N-Dimethylformamide (DMF) and DA were purchased from Alfa Aesar (Shanghai, China). Graphene oxide (GO) was purchased from Nanjing Ji Cang Nano Tech Co., Ltd. (Nanjing, China). Phosphate buffer solutions (PBS, 0.10 M, pH 6.0–10.0) were prepared from disodium hydrogen phosphate and potassium dihydrogen phosphate (Tianjin Chemical Reagent Factory, Tianjin, China), with the pH adjusted with potassium hydroxide or phosphoric acid. All other chemicals and solvents were of analytical grade and were used as received. All solutions were prepared in ultrapure water (SMART, 18.2 MΩ cm).2.2 Instrumentation
All the electrochemical experiments were carried out using a CHI 650D electrochemical workstation (from Chen Hua Instruments Co., Ltd., Shanghai, China), controlled using CHI 650D software. A conventional three-electrode system was used for all electrochemical experiments, under a protective atmosphere of high-purity nitrogen. The modified glassy carbon electrode (GCE) was prepared and used as a working electrode and a platinum wire was used as a counter electrode. All potentials quoted in this work were in reference to a Ag/AgCl reference electrode. A PFS-80 digital pH meter (Shanghai Dazhong Analysis Instrument Company, Shanghai, China) was used to monitor the pH of the buffer solution. An ultrasonic cleaner (Kunshan Ultrasonic Instrument Co., Ltd., Kunshan, China), and a SMART ultrapure water system (Heal Force SMART-N, Heal Force Development Co., Ltd., China) were also used.2.3 Synthesis of Hemin-doped-HKUST-1
Hemin-doped-HKUST-1 was synthesized by a one-pot solvothermal method. Typically, 3.26 mg Hemin (0.005 mmol), 2.42 mg Cu(NO3)2·3H2O (0.01 mmol) and 2.01 mg BTC (0.01 mmol) were dissolved in a mixed solvent which is composed of 15 mL DMF and ethanol with a ratio of 3![[thin space (1/6-em)]](https://www.rsc.org/images/entities/char_2009.gif) :
:![[thin space (1/6-em)]](https://www.rsc.org/images/entities/char_2009.gif) 1 in a 25 mL polytetrafluoroethylene autoclave and heated at 80 °C for 12 h. After cooling, the solution was carefully decanted and the resulting solid crystalline material was collected by centrifugation. The crystals were then washed extensively with ethanol and dried at 60 °C in vacuum. The schematic illustration for the preparation of Hemin-doped-HKUST-1, the stepwise assembly procedure and electrocatalysis detection principle of the DA sensor are shown in Scheme 1.
1 in a 25 mL polytetrafluoroethylene autoclave and heated at 80 °C for 12 h. After cooling, the solution was carefully decanted and the resulting solid crystalline material was collected by centrifugation. The crystals were then washed extensively with ethanol and dried at 60 °C in vacuum. The schematic illustration for the preparation of Hemin-doped-HKUST-1, the stepwise assembly procedure and electrocatalysis detection principle of the DA sensor are shown in Scheme 1.
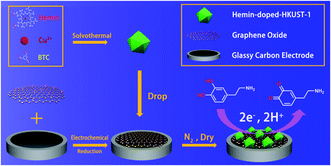 | ||
| Scheme 1 Schematic illustration for the preparation of Hemin-doped-HKUST-1 and the stepwise assembly procedure and electrocatalysis detection principle of the DA sensor. | ||
2.4 Fabrication of the modified electrode
The GCE (3 mm Φ) was carefully polished first with 1200 grit Carbimet disk, and then followed by 1.0, 0.3 and 0.05 mm alumina slurry on microcloth pads. After removing the trace alumina from the surface by rinsing with water at each step, the electrode was ultrasonicated for 5 min in a fresh solution (HNO3![[thin space (1/6-em)]](https://www.rsc.org/images/entities/char_2009.gif) :
:![[thin space (1/6-em)]](https://www.rsc.org/images/entities/char_2009.gif) H2O = 1
H2O = 1![[thin space (1/6-em)]](https://www.rsc.org/images/entities/char_2009.gif) :
:![[thin space (1/6-em)]](https://www.rsc.org/images/entities/char_2009.gif) 1 (v/v)). The electrode was then ultrasonicated in water, acetone, and water again for 3 min, respectively. After being rinsed with water and dried, an aliquot of 5 μL GO (1 mg mL−1) aqueous dispersion was dropped on the surface of the electrode and dried under N2 protection. Then, one-step electrochemical deposition of rGO on the electrode was performed by chronoamperometry in a stirred 0.10 M PBS at a fixed potential of −1.4 V for 720 s. After that, a 3 μL of Hemin-doped-HKUST-1 was dropped onto the surface of the rGO modified GCE and dried under N2 protection.
1 (v/v)). The electrode was then ultrasonicated in water, acetone, and water again for 3 min, respectively. After being rinsed with water and dried, an aliquot of 5 μL GO (1 mg mL−1) aqueous dispersion was dropped on the surface of the electrode and dried under N2 protection. Then, one-step electrochemical deposition of rGO on the electrode was performed by chronoamperometry in a stirred 0.10 M PBS at a fixed potential of −1.4 V for 720 s. After that, a 3 μL of Hemin-doped-HKUST-1 was dropped onto the surface of the rGO modified GCE and dried under N2 protection.
3. Results and discussion
3.1 Characterization of the Hemin-doped-HKUST-1
For proving the successful synthesis of the Hemin-doped-HKUST-1, X-ray diffraction (XRD), scanning electron microscope (SEM), transmission electron microscope (TEM), and infrared spectra (IR) were used for the characterization and analysis of its morphology and structure.The size and morphology of the as-synthesized Hemin-doped-HKUST-1 were characterized by SEM and TEM. As shown in Fig. 1a and b, most of the Hemin-doped-HKUST-1 presented irregular polygon, not a regular octahedral structure, which is different from the morphology of HKUST-1 and Cu–Hemin MOF reported in the literature.27,29 The average size of the Hemin-doped-HKUST-1 was around 100 nm.
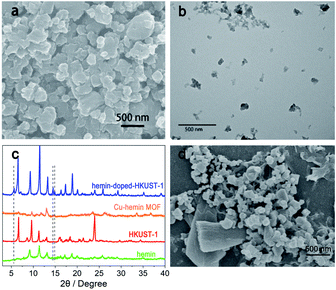 | ||
| Fig. 1 (a) SEM image of Hemin-doped-HKUST-1. (b) TEM image of Hemin-doped-HKUST-1. (c) XRD patterns of Hemin, HKUST-1, and Hemin-doped-HKUST-1. (d) SEM image of Hemin-doped-HKUST-1/rGO/GCE. | ||
In order to explore the crystal structure of Hemin-doped-HKUST-1, we performed three solvothermal reactions using the same synthesis conditions. We obtained Cu–Hemin MOF through the solvothermal reaction of Cu2+ and Hemin, and obtained HKUST-1 through Cu2+ and BTC. However, we did not get any product in the reaction of Hemin and BTC. We performed XRD powder diffraction on the obtained products and the results are displayed in Fig. 1c. In Hemin-doped-HKUST-1, the peaks appeared at 5.5, 14.5, and 14.9° were not found in Hemin, HKUST-1 and Cu–Hemin MOF, which indicated that Hemin-doped-HKUST-1 is not a mixture of Cu-Hemin MOF, HKUST-1 and Hemin. According to related references and our related experimental results, both the carboxyl group of BTC and the carboxyl group of Hemin can coordinate with Cu2+. The results showed that Hemin was not encapsulated in HKUST-1 but as ligand linked to copper, so the crystal form changed. The XRD result fitted well with SEM and TEM images.
All the results above indicated that the Hemin-doped-HKUST-1 has been successfully synthesized.
3.2 Electrochemical characterization of the stepwise modified electrodes
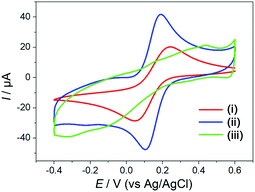
The stepwise fabrication of the Hemin-doped-HKUST-1/rGO/GCE was confirmed with cyclic voltammetry (CV) which was performed in a supporting electrolyte of a 5 mM [Fe (CN)6]3−/4− solution containing 0.1 M KCl and 0.1 M PBS. As shown in Fig. 2, a pair of well-defined redox peaks, characteristic of a diffusion-limited redox process, was observed on the bare GCE (curve i), and the peak current was 24 μA. After rGO was electrodeposited on the surface of GCE (rGO/GCE, curve ii), the peak currents increased (40 μA), and peak potential separation (ΔEp, the potential difference between the oxidation and reduction peak potentials) changed narrow. It might be attributed to the high specific surface area, excellent conductivity and electron mobility of rGO, which played an important role as an efficient electron-conducting tunnel and promoted the transmission of electrons. With the assembly of the Hemin-doped-HKUST-1 (Hemin-doped-HKUST-1/rGO/GCE, curve iii), the peaks disappeared. This may be attributed to the poor conductivity of the Hemin-doped-HKUST-1, which hindered the access of the modified electrode. In addition, we can see rGO with lamellar structure and Hemin-doped-HKUST-1 with irregular polyhedral structure through the SEM of the modified electrode (Fig. 1d). These results above implied that the Hemin-doped-HKUST-1/rGO/GCE were successfully assembled.The CVs at rGO/GCE, Hemin/rGO/GCE, HKUST-1/rGO/GCE and Hemin-doped-HKUST-1/rGO/GCE were carried out in 0.10 M PBS at the potential range from −0.8 V to 0.4 V. As shown in Fig. 3, the redox peak was hardly observed at the rGO/GCE (curve i). A small pair of redox peaks appeared at the Hemin/rGO/GCE (curve ii), which was the characteristic of a single electron transfer process of iron (Fe3+/Fe2+) of Hemin, which was the same as the previous report.30 As shown in curve iii, a pair of well-defined redox peaks appeared at the HKUST-1/rGO/GCE, which was the characteristic of a single electron transfer process of copper (Cu2+/Cu+) of HKUST-1. From curve iii, it can be seen that the Epa and the Epc were located at 0.042 V and −0.422 V, respectively. The ΔEp was calculated as 464 mV. Through curve iv, it can be seen that a pair of sharper peaks compared to curve iii. The positions of the oxidation peak and the reduction peak are slightly shifted from curve 3 (Epa = 0.053 and Epc = −0.387), indicating that the presence of iron ions on Hemin has an effect on the electron cloud of copper ions.
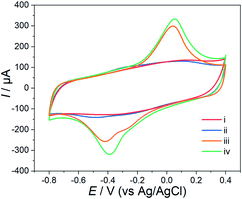 | ||
| Fig. 3 CVs obtained at different modified electrodes in 0.10 M PBS at a scan rate of 100 mV s−1. (i) rGO/GCE, (ii) Hemin/rGO/GCE, (iii) HKUST-1/rGO/GCE and (iv) Hemin-doped-HKUST-1/rGO/GCE. | ||
3.3 Optimization of experimental conditions for Hemin-doped-HKUST-1/rGO/GCE
The effect of the deposition potential and deposition time of rGO on the sensor's current response was investigated in 5 mM [Fe(CN)6]3−/4− solution containing 0.1 M KCl and 0.1 M PBS.As shown in Fig. S1 and S2,† the deposition potential of rGO was chosen as −1.4 V, at which the conductivity of the rGO/GCE was the best and when the deposition time was 400 s, rGO/GCE showed the best performance. So, deposition potential of −1.4 V and deposition time of 400 s were selected, respectively.
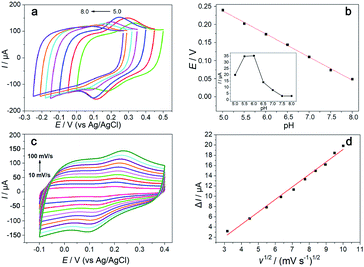
The pH of working buffer in DA detection is important for the performance of the modified electrode. The effect of pH on the electrochemical behavior of DA was investigated by CV at the Hemin-doped-HKUST-1/rGO/GCE in the pH range from 5.0 to 8.0. As shown in the inset of Fig. 4b, with the increasing of the pH from 5.0 to 6.0, the peak current of DA increased. The highest peak current for DA was obtained at pH 6.0 and then decreased gradually. It may be due to the low and high pH affecting the conjugation effect between the Hemin-doped-HKUST-1 and DA, leading to a decrease in sensitivity. So, the pH 6.0 was selected as the optimum pH for working buffer.
The variation of formal potentials (E0′) of DA with pH was also studied. As shown in Fig. 4a, the formal potentials of DA shifted negatively with the increase of pH, and the linear relationship between E0′ and pH can be expressed as ΔE0′ = −0.0638 ΔpH + 0.557 (R2 = 0.998) (Fig. 4b). The slope (63.8 mV pH−1) was closed to 59 mV pH−1, indicating that the number of electron and transferred proton involved in the electrochemical reaction is equal.
Scan rate could greatly affect the electrochemical responses of the modified electrode. As shown in Fig. 4d, the resulting plots of the anodic peak current of the Hemin-doped-HKUST-1/rGO/GCE increased linearly with increased the scanning rate, which is the characteristic of a typical diffusion-controlled process. The linear relationship between the redox peak currents (I) and the square root of potential scan rate (v1/2) has a linear regression equation calculated as I (μA) = 0.244v1/2 (mV) − 0.522 (R2 = 0.99).
3.4 Electrochemical behaviors of DA at different modified electrodes
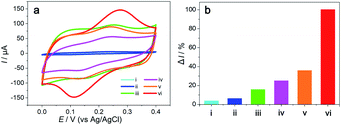
Fig. 5 shows the CV curves recorded in 0.1 mM DA with 0.1 M PBS at bare GCE, Hemin-doped-HKUST-1/GCE, rGO/GCE, Hemin/rGO/GCE, HKUST-1/rGO/GCE and Hemin-doped-HKUST-1/rGO/GCE at a scan rate of 0.1 V s−1. A very small hump can be observed in the CV curve of the bare GCE (curve i), with a weak oxidation current signal (ca. 2.13 μA), indicating the inferior electrocatalytic effect of the bare GCE for the oxidation of DA. A similar oxidation hump with an increased current signal (ca. 3.45 μA) is displayed in the CV curve of the Hemin-doped-HKUST-1/GCE (curve ii), implying that the Hemin-doped-HKUST-1 exhibits peroxidase activity towards to DA, which may be due to the increased surface area of the electrode brought from the modification of Hemin-doped-HKUST-1. The CV curve of the rGO/GCE (curve iii) shows an obvious oxidation peak with a larger peak current (ca. 8.69 μA), demonstrating that the electron-transfer channel formed by rGO effectively increased the electron-transfer of DA to the underlying electrode. From curve iv and curve v, it can be seen that after Hemin and HKUST-1 were added to the surface of rGO, oxidation peaks became more obvious and the peak currents were larger (ca. 13.73 μA, 19.65 μA, respectively), which is attributed to the iron ions (Fe3+/Fe2+) in Hemin and the copper ions (Cu2+/Cu+) in HKUST-1. The change in their valence makes them act like peroxidase and increase the electrical signal.In surprise, the Hemin-doped-HKUST-1/rGO/GCE (curve vi) shows significantly enhanced catalytic current (Ipa = 54.91 μA), which is ca. 6.3 and 16 times higher than rGO/GCE and Hemin-doped-HKUST-1/GCE, respectively, indicating the synergistic catalytic ability between rGO and Hemin-doped-HKUST-1. In addition, compared to Hemin/rGO and HKUST-1/rGO, the peak current of Hemin-doped-HKUST-1/rGO/GCE is several times larger, which indicates that Hemin and HKUST-1 also have a synergistic effect. This interesting phenomenon can be attributed to the following factors. Firstly, the rGO electrodeposited on the electrode could not only increase the conductivity due to its high specific surface and electron mobility but also support the Hemin-doped-HKUST-1 through π–π stacking interactions and make this material of high stability for electrocatalytic measurement. Secondly, the 3D network forming from the Hemin-doped-HKUST-1could also enlarge the surface area, thereby enhancing the electrochemical responses through adsorbing more DA on surface of the Hemin-doped-HKUST-1/rGO/GCE. Thirdly, copper ions can regulate the electron cloud of iron ions in Hemin, and the resulting synergistic effect gives Hemin-doped-HKUST-1 a better catalytic activity for DA.
3.5 Amperometric response of the biosensor to DA
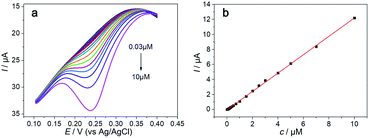
Fig. 6 displays the DPV responses of the Hemin-doped-HKUST-1/rGO/GCE in the DA solution. The oxidation peak current of the sensor increased sharply with the increase of template molecule concentration and showed a good linear region with the concentration of DA in the range of 3 × 10⁻⁸–1 × 10⁻⁵ M.The linear regression equation was expressed as I (μA) = 1.224c (μM) − 0.043 (R2 = 0.9994), with a high sensitivity of 1.224 μA μM−1, and a lower detection limit of 3.27 × 10⁻⁸ M (S/N = 3). A comparison of the modified electrode for electrochemical oxidation of DA with other modification strategies is shown in Table 1. It suggests the sensitivity of this biosensor has been significantly improved, being 3 times higher than the metal oxides modified electrode and approximatively 8 times higher than that sensor based on others MOFs modification. In addition, the detection limit is relatively lower than other reported methods. The Hemin-doped MOFs/rGO as described in this work is crucial for achieving the relatively high sensitivity and low detection limit for DA detection. In fact, the two-dimensional rGO efficiently not only promoted the electron transfer between the analyte and the electrode, but also could act as a support that prevented the collapse of the Hemin-doped MOFs in aqueous media during the electrocatalytic measurement. What's more important, the 3D Hemin-doped MOFs provided a large open and accessible surface area that could absorb more DA onto the electrode, which could be beneficial for electrocatalytic reaction.
| Electrode | Sensitivity (μA μM−1) | Linear range (μM) | Detection limit (μM) | References |
|---|---|---|---|---|
| a GNs graphene nanospheres, AuNBP gold nanobipyramid. | ||||
| AuNBP/MWCNTs | 0.11 | 2–157 | 0.60 | 15 |
| GO-ZIF67 | 0.141 | 0.2–80 | 0.05 | 33 |
| Fe3O4@GNs/Nafion/GCE | 0.3969 | 0.02–130 | 0.007 | 34 |
| HKUST-1/GCE | 0.02 | 0.5–100 | 0.15 | 35 |
| MOFs/ERGO | 0.156 | 0.2–300 | 0.013 | 36 |
| DNA/Au-GO/GCE | 0.0554 | 0.9–70 | 0.056 | 37 |
| Hemin-doped-HKUST-1/rGO/GCE | 1.224 | 0.03–10 | 0.0327 | This work |
3.6 Precision and stability of Hemin-doped-HKUST-1/rGO/GCE
The precision of the modified electrode was evaluated in a DA of 1.0 × 10⁻⁴ M by DPV. The oxidation peak of DA did not change significantly for 22 continuous determinations (Fig. S3†). The relative standard deviation for DA was 3.9%, demonstrating that the modified electrode had a high reproducibility. To investigate the stability of the modified electrode, it was stored in 0.1 M PBS at room temperature for different time periods. There was no clear decrease in peak current with the extension of storage time, and the electrocatalytic activity was nearly not changed after storage for 35 days (Fig. S4†). These results demonstrated that the modified composite had high reproducibility and stability in application.3.7 Interference
Possible interference to the selective determination of DA was investigated using DPV by adding various interferents into a DA of 1.0 × 10⁻⁵ M. The ratios of foreign substances which were added into DA solution were 500 for Na+, K+, Mg2+, SO42− H2PO4− and HPO42−, 50 for glucose, cysteine, L-leucine, alanine and L-lysine, and the percentage of current change caused by interfering substances are shown in Fig. S5.†It also demonstrated that the modified electrode showed excellent selectivity toward DA. It could be used to assess the contents of DA in real-life samples.
3.8 Real-life sample analysis
To evaluate the validity of the proposed method for DA detection in real-life sample, seven blood samples from healthy volunteers were determined using DPV. The results are shown in Table 2. The low standard deviation shows that this modified electrode has very good reproducibility, indicating that the sensor can be successfully applied in blood samples for DA detection.| Sample | Concentration/μM | SD |
|---|---|---|
| 1 | 4.85 | 0.07 |
| 2 | 4.96 | 0.17 |
| 3 | 4.35 | 0.14 |
| 4 | 3.62 | 0.05 |
| 5 | 2.94 | 0.06 |
| 6 | 4.18 | 0.02 |
| 7 | 3.26 | 0.03 |
4 Conclusions
The conclusions section should come in this section at the end of the article, before the acknowledgements. This study reported a one-pot general method for synthesizing Hemin-doped-HKUST-1 nanozyme and further compounding it with rGO to construct an ultra-sensitive electrochemical sensor for DA detection. The Hemin-doped-HKUST-1/rGO/GCE has been proven to have remarkable performance in DA detection, owing to its large surface area, good electrical conductivity and excellent catalytic activity. The sensitivity of the sensor for the detection of DA increased remarkably compared with the previously reported electrochemical sensors, because of the synergistic catalytic ability between rGO and Hemin-doped-HKUST-1. In addition, due to the support effect of RGO on the Hemin-doped-HKUST-1 through π–π stack interaction, the stability and repeatability of the sensor have been significantly improved. What's more, the sensor was successfully applied in blood samples for DA detection. In summary, this proposed sensor can provide a highly sensitive and low-cost strategy for DA detection.Conflicts of interest
There are no conflicts to declare.Acknowledgements
This work was financially supported by the Natural Science Foundation of China (No. GZR81872669) and the Natural Science Foundation of Hebei Province of China (No. B2020206001).Notes and references
- K. M. Tye, J. J. Mirzabekov, M. R. Warden, E. A. Ferenczi, H.-C. Tsai, J. Finkelstein, S.-Y. Kim, A. Adhikari, K. R. Thompson, A. S. Andalman, L. A. Gunaydin, I. B. Witten and K. Deisseroth, Nature, 2013, 493, 537–541 CrossRef CAS.
- A. R. Younus, J. Iqbal, N. Muhammad, F. Rehman, M. Tariq, A. Niaz, S. Badshah, T. A. Saleh and A. Rahim, Microchim. Acta, 2019, 186, 471 CrossRef.
- N. Diab, D. M. Morales, C. Andronescu, M. Masoud and W. Schuhmann, Sens. Actuators, B, 2019, 285, 17–23 CrossRef CAS.
- N. Baig and A.-N. Kawde, RSC Adv., 2016, 6, 80756–80765 RSC.
- D. B. Gorle and M. A. Kulandainathan, RSC Adv., 2016, 6, 19982–19991 RSC.
- X. Song, J. Fu, J. Wang, C. Li and Z. Liu, Microchim. Acta, 2018, 185, 369 CrossRef.
- A. Naccarato, E. Gionfriddo, G. Sindona and A. Tagarelli, Anal. Chim. Acta, 2014, 810, 17–24 CrossRef CAS.
- L. Farzin, M. Shamsipur, L. Samandari and S. Sheibani, Microchim. Acta, 2018, 185, 276 CrossRef.
- L. Liu, S. Li, L. Liu, D. Deng and N. Xia, Analyst, 2012, 137, 3794–3799 RSC.
- M. Mamiński, M. Olejniczak, M. Chudy, A. Dybko and Z. Brzózka, Anal. Chim. Acta, 2005, 540, 153–157 CrossRef.
- V. Šolínová, L. Žáková, J. Jiráček and V. Kašička, Anal. Chim. Acta, 2019, 1052, 170–178 CrossRef.
- S. K. Krishnan, E. Singh, P. Singh, M. Meyyappan and H. S. Nalwa, RSC Adv., 2019, 9, 8778–8881 RSC.
- Z. Anajafi, M. Naseri, S. Marini, C. Espro, D. Iannazzo, S. G. Leonardi and G. Neri, Anal. Bioanal. Chem., 2019, 411, 7681–7688 CrossRef CAS.
- P. R. S. Teixeira, A. S. d. N. M. Teixeira, E. A. d. O. Farias, E. C. da Silva Filho, H. N. da Cunha, J. R. dos Santos Júnior, L. C. C. Nunes, H. R. S. Lima and C. Eiras, Anal. Bioanal. Chem., 2019, 411, 659–667 CrossRef CAS.
- J. Cheng, X. Wang, T. Nie, L. Yin, S. Wang, Y. Zhao, H. Wu and H. Mei, Anal. Bioanal. Chem., 2020, 412, 2433–2441 CrossRef CAS.
- Z. Hsine, S. Blili, R. Milka, H. Dorizon, A. H. Said and H. Korri-Youssoufi, Anal. Bioanal. Chem., 2020, 412, 4433–4446 CrossRef CAS.
- L. Jiao, H. Yan, Y. Wu, W. Gu, C. Zhu, D. Du and Y. Lin, Angew. Chem., Int. Ed., 2020, 59, 2565–2576 CrossRef CAS.
- Z. Yin, S. Wan, J. Yang, M. Kurmoo and M.-H. Zeng, Coord. Chem. Rev., 2019, 378, 500–512 CrossRef CAS.
- X. Yi, W. Dong, X. Zhang, J. Xie and Y. Huang, Anal. Bioanal. Chem., 2016, 408, 8805–8812 CrossRef CAS.
- X. Huang, D. Huang, J. Chen, R. Ye, Q. Lin and S. Chen, Anal. Bioanal. Chem., 2020, 412, 849–860 CrossRef CAS.
- G. Xiong, X.-Y. Qin, P.-F. Shi, Y.-L. Hou, J.-Z. Cui and B. Zhao, Chem. Commun., 2014, 50, 4255–4257 RSC.
- X. Qiao, F. Xia, D. Tian, P. Chen, J. Liu, J. Gu and C. Zhou, Anal. Chim. Acta, 2019, 1050, 51–59 CrossRef CAS.
- Q. Deng, P. Sun, L. Zhang, Z. Liu, H. Wang, J. Ren and X. Qu, Adv. Funct. Mater., 2019, 29, 1903018 CrossRef.
- J. Li, T. Yuan, T. Yang, L. Xu, L. Zhang, L. Huang, W. Cheng and S. Ding, Sens. Actuators, B, 2018, 271, 239–246 CrossRef CAS.
- Y. Guo, L. Deng, J. Li, S. Guo, E. Wang and S. Dong, ACS Nano, 2011, 5, 1282–1290 CrossRef CAS.
- F.-X. Qin, S.-Y. Jia, F.-F. Wang, S.-H. Wu, J. Song and Y. Liu, Catal. Sci. Technol., 2013, 3, 2761–2768 RSC.
- F. Luo, Y. Lin, L. Zheng, X. Lin and Y. Chi, ACS Appl. Mater. Interfaces, 2015, 7, 11322–11329 CrossRef CAS.
- S. Xie, J. Ye, Y. Yuan, Y. Chai and R. Yuan, Nanoscale, 2015, 7, 18232–18238 RSC.
- L. Wang, H. Yang, J. He, Y. Zhang, J. Yu and Y. Song, Electrochim. Acta, 2016, 213, 691–697 CrossRef CAS.
- B. Wang, X. Ji, J. Ren, R. Ni and L. Wang, Bioelectrochemistry, 2017, 118, 75–82 CrossRef CAS.
- B. Wang, X. Ji, H. Zhao, N. Wang, X. Li, R. Ni and Y. Liu, Biosens. Bioelectron., 2014, 55, 113–119 CrossRef CAS.
- H. Zhao, X. Ji, B. Wang, N. Wang, X. Li, R. Ni and J. Ren, Biosens. Bioelectron., 2015, 65, 23–30 CrossRef CAS.
- J. Tang, S. Jiang, Y. Liu, S. Zheng, L. Bai, J. Guo and J. Wang, Microchim. Acta, 2018, 185, 486 CrossRef.
- W. Zhang, J. Zheng, J. Shi, Z. Lin, Q. Huang, H. Zhang, C. Wei, J. Chen, S. Hu and A. Hao, Anal. Chim. Acta, 2015, 853, 285–290 CrossRef CAS.
- J. Li, J. Xia, F. Zhang, Z. Wang and Q. Liu, J. Chin. Chem. Soc., 2018, 65, 743–749 CrossRef CAS.
- B. Ma, H. Guo, M. Wang, L. Li, X. Jia, H. Chen, R. Xue and W. Yang, Electroanalysis, 2019, 31, 1002–1008 CrossRef CAS.
- S. J. Zhang, K. Kang, L. M. Niu and W. J. Kang, J. Electroanal. Chem., 2019, 834, 249–257 CrossRef CAS.
- R. W. Larsen, L. Wojtas, J. Perman, R. L. Musselman, M. J. Zaworotko and C. M. Vetromile, J. Am. Chem. Soc., 2011, 133(27), 10356–10359 CrossRef CAS.
Footnote |
| † Electronic supplementary information (ESI) available: Electrode optimization conditions, stability, reproducibility and interference test. See DOI: 10.1039/d0ra08224d |
| This journal is © The Royal Society of Chemistry 2021 |

