
 Open Access Article
 This Open Access Article is licensed under a
 Creative Commons Attribution 3.0 Unported Licence
Using geometric simulation software ‘GASP’ to model conformational flexibility in a family of zinc metal–organic frameworks†
William J.
Gee
 a,
Stephen A.
Wells
b,
Simon J.
Teat
c,
Paul R.
Raithby
d and
Andrew D.
Burrows
*d
a,
Stephen A.
Wells
b,
Simon J.
Teat
c,
Paul R.
Raithby
d and
Andrew D.
Burrows
*d
aSchool of Environment and Science, Griffith University, 170 Kessels Road, Brisbane, QLD 4111, Australia
bDepartment of Chemical Engineering, University of Bath, Claverton Down, Bath, BA2 7AY, UK
cAdvanced Light Source, Lawrence Berkeley National Laboratory, Berkeley, CA, USA
dDepartment of Chemistry, University of Bath, Claverton Down, Bath, BA2 7AY, UK. E-mail: a.d.burrows@bath.ac.uk
First published on 19th April 2021
Abstract
Here, a new tripodal tricarboxylic acid ligand, 4,4′-(4′-(4′-carboxy-[1,1′-biphenyl]-4-yl)-[2,2′:6′,2′′-terpyridine]-5,5′′-diyl)-dibenzoic acid (H3cbt), was synthesised using a three-step convergent strategy. Subsequent reactions with zinc(II) nitrate hexahydrate yielded three metal–organic frameworks (MOFs). The three MOFs, [Zn(Hcbt)]·4DMF (1), [Zn(Hcbt)]·4DMSO·1.5H2O·DMF (2), and [Zn(Hcbt)]·2DMF·3H2O (3), each adopt flexible interdigitated 2D net topologies. Framework 1 has DMF-filled channels that retain porosity upon desolvation, with a measured BET surface area of 248 m2 g−1. Framework 2 possesses larger DMSO-containing channels that collapse upon desolvation, resulting in near-equivalent porosity values to framework 1. In silico calculations and topological considerations determined using the geometric simulation software GASP dictate that framework 2 can feasibly alter conformation to approximate 1, but cannot perfectly replicate the interdigitated motif. Framework 3 formed when wet solvents were used to synthesise 1. Interestingly, the interdigitated structure of 3 contains a unique carboxylate binding mode that precludes its subsequent adoption by either 1 or 2 upon their exposure to water. This diverse array of structural considerations recommends this MOF family for modelling using GASP. Interrogating frameworks 1–3 using this software provided insights that justified experimentally observed conformational trends, as well as barriers to interconversion between members of this MOF family. In a broader sense, this work demonstrates the wider applicability of GASP software to modelling structural changes within flexible MOF materials.
Introduction
Conformational flexibility in metal–organic frameworks (MOFs), also known as porous coordination polymers (PCPs), is one of the preconditions for solid-state switchable behaviours that are much coveted by materials scientists.1 Interest in these systems stems from the desire to control and manipulate nanometre-sized cavities, which would grant chemists, physicists and material scientists the ability to manipulate separation, storage, and catalytic behaviours of the resulting materials.2 Designing such systems requires a combination of organic linker and metal connecter to produce a 1D, 2D, 3D or 4D framework3 that is amenable to one of the six classes of movement proposed by Kitagawa.4 These classes may rely on the addition or loss of guest molecules to drive changes in conformation,1c,d however in the absence of interchangeable guests, flexibility can be triggered by other stimuli, such as temperature, mechanical stress or photochemistry.1a,5 In such cases, the inorganic component is typically associated with rigidity, whereas the organic component imparts flexibility.1 Numerous examples of MOFs exhibiting conformational flexibility when subjected to a range of stimuli were detailed in a recent review by Fischer.1a Illustrative examples include MIL-88 that showed guest dependent swelling,6 MOF-5 and HMOF-1 that exhibited thermally-induced structural changes,7 ZIF-8 for mechanical stress induced deformation,8 and incorporation of photo-responsive linkers within a MOF-5 analogue that triggered reversible changes to CO2 uptake capacity.9Despite the diverse modes of movement available to MOF materials,4 progress in computational modelling of the flexibility exhibited by MOFs has been slow. A specialized modelling approach of “template-based geometric simulation” has proved very successful in describing flexibility in polyhedral mineral frameworks such as perovskites and aluminosilicates, especially zeolites,10 as well as proteins.11 The geometric simulation approach implements a simplified, localized physical model incorporating only steric exclusion and local bonding. Harmonic penalties are applied to the steric overlap of atoms and to deviations from idealised bonding geometry, represented as an overlapping system of templates. Geometric simulation for periodic frameworks is implemented in a code called “GASP” (Geometric Analysis of Structural Polyhedra). The current version of GASP12 is capable of handling not only polyhedral but also molecular entities in a framework structure, thereby providing compatibility to flexible MOF motifs. In the study of zeolites, GASP was principally used to examine the response of frameworks to imposed strain (i.e. a change in unit cell parameters), and in particular to determine whether a given strain could be accommodated by framework flexibility, or whether distortions of the structural units were inevitable.10b
In this study, the first application of GASP to MOF structures is demonstrated. We use geometric simulation to explore framework flexibility in a challenging family of interdigitated 2D frameworks, and thus link local bonding phenomena (i.e. the carboxylate-zinc binding modes) to global framework properties (e.g. channel closures upon desolvation, and barriers to interconversion between frameworks upon solvent exchange). Detailed materials characterisation is also provided for new ligands and frameworks synthesised during this work.
Experimental
General considerations
Single-crystal X-ray diffraction measurements for compounds 1–3 were carried out at Station 11.3.1 of The Advanced Light Source (ALS), Lawrence Berkeley National Laboratory, CA. Powder X-ray diffraction data (PXRDs) for 1 and 2, and their corresponding desolvated activated forms, were collected using a Bruker AXS D8 Advance diffractometer with Cu Kα radiation of wavelength 1.5406 Å at 298 K. Samples were placed on a flat plate and measured with a 2θ range of 5–40°. Simulated X-ray powder patterns were generated from single crystal data that were imported into Xrdplot. Infrared spectra were recorded on a PerkinElmer Spectrum 100 spectrometer equipped with an ATR sampling accessory. Abbreviations for IR bands are s, strong; m, medium; w, weak. Elemental analyses (C, H, N) were performed on a CE-440 elemental analyser (Exeter Analytical). TGA experiments were carried out on a PerkinElmer TGA 4000 Thermogravimetric Analyser. The samples were heated from 20 °C to 650 °C at a heating rate of 10 °C min−1, under a flow of nitrogen (20 mL min−1). NMR spectra were recorded at 300 MHz (1H) or 75 MHz (13C) using the residual solvent signals as an internal standard. Chemical shifts are reported in parts per million (ppm) and coupling constants (J) in Hertz (Hz). Signal multiplicity is denoted as singlet (s), doublet (d), triplet (t), quartet (q), multiplet (m) or broad (b). High resolution mass spectroscopy was performed using electrospray ionisation (ESI) with either positive or negative ionisation.Synthesis
All reagents were purchased from commercial sources and used as received except for 2-acetyl-5-bromopyridine, which was synthesised following a known literature procedure.134-(6-Acetylpyridin-3-yl)benzoic acid
A suspension of 4-carboxyphenylboronic acid (0.896 g, 5.4 mmol), 2-acetyl-5-bromopyridine (1.080 g, 5.4 mmol), K2CO3 (2.0 g, 14.5 mmol) and [Pd(PPh3)4] (0.150 g, 0.13 mmol) in a mixture of water and methanol (1![[thin space (1/6-em)]](https://www.rsc.org/images/entities/char_2009.gif) :2 v/v, 50 mL) was heated to reflux overnight under an atmosphere of nitrogen. The reaction mixture was then cooled to room temperature and filtered to remove the catalyst. The basic mixture was acidified by the addition of concentrated HCl, which caused the product to precipitate as an off-white powder. The powder was then isolated by filtration (74% yield). 1H-NMR (300 MHz, DMSO-d6): δ = 9.11 (s, 1 H, PyH), 8.35 (d, J = 9.0 Hz, 1 H, PyH), 8.07 (m, 3 H, PyH), 7.96 (d, J = 9.0 Hz, 2 H, PhH), 2.68 (s, 3 H, CH3) ppm. 13C-NMR (125 MHz, DMSO-d6): 199.33, 167.27, 152.53, 147.81, 140.48, 138.14, 135.92, 130.44, 128.45, 127.80, 121.73, 26.09 ppm. IR (ATR):
:2 v/v, 50 mL) was heated to reflux overnight under an atmosphere of nitrogen. The reaction mixture was then cooled to room temperature and filtered to remove the catalyst. The basic mixture was acidified by the addition of concentrated HCl, which caused the product to precipitate as an off-white powder. The powder was then isolated by filtration (74% yield). 1H-NMR (300 MHz, DMSO-d6): δ = 9.11 (s, 1 H, PyH), 8.35 (d, J = 9.0 Hz, 1 H, PyH), 8.07 (m, 3 H, PyH), 7.96 (d, J = 9.0 Hz, 2 H, PhH), 2.68 (s, 3 H, CH3) ppm. 13C-NMR (125 MHz, DMSO-d6): 199.33, 167.27, 152.53, 147.81, 140.48, 138.14, 135.92, 130.44, 128.45, 127.80, 121.73, 26.09 ppm. IR (ATR): ![[small nu, Greek, tilde]](https://www.rsc.org/images/entities/i_char_e0e1.gif) = 2979 (m), 2546 (m), 1677 (s), 1608 (m), 1587 (m), 1558 (m), 1509 (w), 1424 (m), 1362 (m), 1288 (s), 1232 (m), 1189 (m), 1128 (m), 1096 (m), 1015 (m), 1002 (m), 957 (m), 842 (s), 774 (s), 710 (s), 607 (m) cm−1. MS [M − H]−: 240.0666 found: 240.0667, [2M − H + Na]−: 503.1224; found: 503.1268.
= 2979 (m), 2546 (m), 1677 (s), 1608 (m), 1587 (m), 1558 (m), 1509 (w), 1424 (m), 1362 (m), 1288 (s), 1232 (m), 1189 (m), 1128 (m), 1096 (m), 1015 (m), 1002 (m), 957 (m), 842 (s), 774 (s), 710 (s), 607 (m) cm−1. MS [M − H]−: 240.0666 found: 240.0667, [2M − H + Na]−: 503.1224; found: 503.1268.
4′-Formyl-[1,1′-biphenyl]-4-carboxylic acid
Synthesised analogously to 4-(6-acetylpyridin-3-yl)benzoic acid by substituting 4-carboxyphenylboronic acid and 4-bromobenzaldehyde in equimolar amounts (89% yield). 1H-NMR (300 MHz, DMSO-d6): δ = 10.05 (s, 1 H, CHO), 8.08–7.95 (m, 6 H, PhH), 7.86 (d, J = 9.0 Hz, 2 H, PhH) ppm. 13C-NMR (125 MHz, DMSO-d6): 192.76, 167.04, 144.66, 142.88, 135.64, 130.66, 130.21, 130.07, 127.73, 127.35 ppm. IR (ATR): = 2949 (m), 2836 (m), 2633 (m), 1709 (s), 1676 (s), 1602 (s), 1601 (s), 1578 (m), 1559 (m), 1425 (m), 1403 (m), 1293 (m), 1248 (s), 1219 (s), 1170 (s), 1109 (m), 1006 (m), 875 (w), 824 (s), 786 (s), 710 (s), 658 (m) cm−1. MS [M − H]−: 225.0557 found: 225.0537, Na[M − H]2−: 473.1012; found: 473.1017.
4,4′-(4′-(4′-Carboxy-[1,1′-biphenyl]-4-yl)-[2,2′:6′,2′′-terpyridine]-5,5′′-diyl)dibenzoic acid (H3cbt)
To a 10 mL microwave vial were added 4-(6-acetylpyridin-3-yl)benzoic acid (500 mg, 2.07 mmol), 4′-formyl-[1,1′-biphenyl]-4-carboxylic acid (234 mg, 1.03 mmol), potassium hydroxide (250 mg, 4.46 mmol) and a 2:1 mixture of water and conc. aq. ammonia (6 mL). The contents were stirred until dissolved and the vial sealed. The vial was subsequently heated in a microwave oven at 100 °C for 30 minutes. After this time, the contents of the vial were poured into 20 mL of conc. aq. NH4Cl and the resulting precipitate separated by filtration. The precipitate was then dissolved in hot DMSO (5 mL) and poured into ethanol (20 mL) to precipitate the product a second time. The resulting solid was isolated by filtration. This precipitate was dissolved in hot DMF (5 mL) and any insoluble material removed by filtration. After cooling over several hours, the resulting precipitate was isolated by filtration and washed with diethyl ether, yielding an off-white powder (29% yield). 1H-NMR (300 MHz, DMSO-d6): δ = 9.15 (d, J = 3.0 Hz, 2 H, PyH), 8.82 (s, 2 H, PyH), 8.78 (d, J = 9.0 Hz, 2 H, PyH), 8.40 (dd, J1 = 3.0 Hz J2 = 9.0 Hz, 2 H, PyH), 8.11–7.99 (m, 6 H, PhH), 7.97 (d, J = 9.0 Hz, 4 H, PhH), 7.90 (d, J = 9.0 Hz, 2 H, PhH) ppm. IR (ATR): = 3157 (m), 2546 (m), 1704 (s), 1662 (m), 1607 (s), 1539 (m), 1481 (w), 1391 (m), 1361 (m), 1241 (s), 1182 (m), 1106 (m), 1005 (m), 1106 (m), 771 (s), 699 (m), 658 (m) cm−1. MS [M − H]−: 668.1827; found: 668.1829.
[Zn(Hcbt)]·4DMF (1)
To a glass vial were added solutions of H3cbt (25 mg, 0.037 mmol) dissolved in hot anhydrous DMF (∼4 mL), and Zn(NO3)2·6H2O (11 mg, 0.037 mmol) dissolved in hot anhydrous DMF (∼1 mL). The vial was sealed and heated at 100 °C for 2 days. After this time, the resulting colourless crystalline material was isolated by filtration (74% yield). IR (ATR): = 3039 (w), 2928 (w), 1719 (m), 1660 (m), 1602 (m), 1541 (m), 1480 (s), 1365 (s), 1240 (m), 1099 (m), 1006 (m), 831 (s), 774 (s), 735 (w), 704 (m), 671 (m) cm−1. Elemental analysis calcd (%) for C53H49N7O10Zn: C 63.07, H 4.89, N 9.71; found: C 63.09, H 5.03, N 6.47.
[Zn(Hcbt)]·4DMSO·1.5H2O·DMF (2)
This material was synthesised analogously to 1 but substituting the solvent used to dissolve Zn(NO3)2·6H2O from anhydrous DMF to wet DMSO (65% yield). IR (ATR): = 3388 (m), 3042 (m), 1702 (m), 1604 (s), 1541 (m), 1482 (s), 1356 (s), 1240 (s), 1178 (m), 1119 (w), 1008 (s), 949 (m), 833 (s), 775 (s), 702 (m), 671 (m) cm−1. Elemental analysis calcd (%) for C106H118N8O25S8Zn2: C 55.56, H 5.19, N 4.89; found: C 56.01, H 5.47, N 4.29.
[Zn(Hcbt)]·2DMF·3H2O (3)
Attempts to synthesise large batches of 3 using DMF spiked with water were unsuccessful, resulting instead in crystalline mixtures that predominantly contained 1 that were interspersed with small amounts of crystalline 3. Characterisation of 3 was consequently limited to X-ray diffraction studies performed on hand-picked individual crystals. Both 1 and 3 adopted similar colourless plate crystal habits, however crystals of 3 were typically larger (ca. twice the size of 1) with a higher quality appearance, rendering them identifiable. Elemental analysis calcd (%) for C48H45N5O11Zn: C 61.77, H 4.86, N 7.50.Crystallographic data
Crystallographic data was collected on a Bruker Apex2 CCD diffractometer at 150 K using synchrotron radiation (Station 11.3.1, Advanced Light Source, Berkeley). Data were processed using the supplied BRUKER software.14 Structure solution, followed by full-matrix least-squares refinement (all data) was performed using SHELXL-9715 using the XSEED package.161: C53H42N7O10Zn, M = 1002.30, monoclinic, P21/n, a = 16.5565(17), b = 14.5139(15), c = 21.112(2) Å, β = 104.938(2)°, V = 4901.8(9) Å3, Z = 4, μ = 1.358 mm−1, Ntotal = 72286, Nindependent = 15845 [R(int) = 0.0635], wR2 = 0.1845 (all data), R1 = 0.0754 [13090 reflections with I > 2σ(I)]. 2: C106H100N8O25S8Zn2, M = 2273.15, monoclinic, P21/c (No. 14), a = 15.823(4), b = 16.228(5), c = 22.530(6) Å, β = 108.133(4)°, V = 5498(3) Å3, Z = 2, μ = 1.373 mm−1, Ntotal = 25904, Nindependent = 5654 [R(int) = 0.1087], wR2 = 0.3224 (all data), R1 = 0.1583 [3635 reflections with I > 2σ(I)]. 3: C48H24N5O11Zn, M = 912.09, monoclinic, P21/n (No. 14), a = 17.733(5), b = 11.753(3), c = 22.790(6) Å, β = 96.427(4)°, V = 4720(2) Å3, Z = 4, μ = 1.284 mm−1, Ntotal = 38697, Nindependent = 6786 [R(int) = 0.1037], wR2 = 0.3004 (all data), R1 = 0.1249 [5246 reflections with I > 2σ(I)]. CCDC 2062086–2062088 contain the supplementary crystallographic data for coordination polymers 1–3 described in this paper.†
Variata
(1) Two of the four lattice DMF molecules exhibited rotational disorder. One such instance required that the formyl group be modelled over two positions, each possessing half occupancy. The other disordered DMF molecule could not sustain anisotropic refinement or addition of hydrogen atoms and was consequently modelled without. The geometry of this second molecule of DMF was fixed using the DFIX and DANG restraints. (2) The single lattice DMF molecule was restrained using the DFIX and DANG commands to maintain proper geometry and was modelled isotropically. The lattice waters and a single molecule of DMSO were modelled isotropically and without hydrogen atoms to ensure a stable refinement. Within the terpy group C(10) exhibited non-positive definite behaviour that was corrected using the ISOR command. (3) The free carboxylic acid group of the Hcbt ligand was disordered over two positions with ca. one-third and two-thirds occupancy, respectively. Two of the disordered atoms, C(42) and O(6A), were made more isotropic with the ISOR command to prevent non-positive definite behaviour. The geometry of one of the two DMF molecules was restrained with the DFIX and DANG commands. None of the lattice solvent refined stably with anisotropic parameters and were thus refined isotropically. Similarly, hydrogen atoms were omitted from lattice solvents to maintain stable refinement.Geometric simulations using GASP
The GASP (Geometric Simulation of Structural Polyhedra) code was recently extended12 to handle molecular entities as well as regular polyhedra. The code is applied here to take one MOF crystal structure as input and to impose a new set of cell parameters, either hypothetical or taken from a second crystal structure. The geometric simulation engine then seeks to adapt the contents of the simulation cell to the new cell parameters while retaining the bonding geometry of the input structure and resolving any steric clashes. The code is freely available to researchers and can be downloaded from the Github repository at https://github.com/EssayWells/GASP_6. Detailed settings for this investigation were as follows. Element radii were assigned in Å as C 1.35, N 1.4, H 1.0, Zn 0.6, O 1.35. Bonding of zinc to coordinating oxygens was set to a fixed length using a bar constraint assigned to a length of 1.96 Å, to permit flexibility in the bonding angles about the Zn centre. All other bonds were assigned based on the input geometry and the following cluster building rules: carbon atoms were bonded to adjacent C, H, O, or N atoms within 1.8 Å. Nitrogen atoms were bonded to adjacent C or H atoms within 1.8 Å. Zinc atoms were bonded to adjacent nitrogen atoms within 2.3 Å. By default, GASP would identify all adjacent sp2-hybridised atoms as members of a single rigid cluster; this would make each three-armed ligand into a single rigid object. However, in this case rotation of the bonds between adjacent aromatic rings must be permitted based on the crystal structure data. The default behaviour was therefore suppressed using the “nodeloc” option, allowing variations of the dihedral angles between aromatic rings. Steric clashes were identified using a coarse grid of edge length 4 Å.Results and discussion
This study commenced with the development of a novel ligand that draws its inspiration from the known H3bbc (1,3,5-tris(4′-carboxy[1,1′-biphenyl]-4-yl)benzene) scaffold.17 The core of the H3bbc ligand was redesigned to contain a terpyridine group, thereby enhancing its chelative affinity towards transition metals. This new terpy-tricarboxylic acid, H3cbt, was accessed using a convergent synthetic strategy in three steps from commercially available starting materials (Scheme 1). This strategy harnessed Suzuki couplings to furnish the two unique carboxyl arms, followed by a Hantzsch pyridine synthesis to generate the tripodal core. While each Suzuki coupling could be achieved in high yield (>74%), the Hantzsch pyridine synthesis only provided an isolated yield of 29%. This low yield likely occurs due to the aromatization step wherein the pyridyl group forms. The oxidation of the dihydropyridine occurs with concomitant reduction of the precursor aldol condensation product, as inferred by mass spectrometry evidence (ESI,† S1). The addition of a range of substitute oxidants to the reaction (e.g. FeCl3, H2O2, KMnO4, ceric ammonium nitrate) all failed to improve the isolated yield of H3cbt.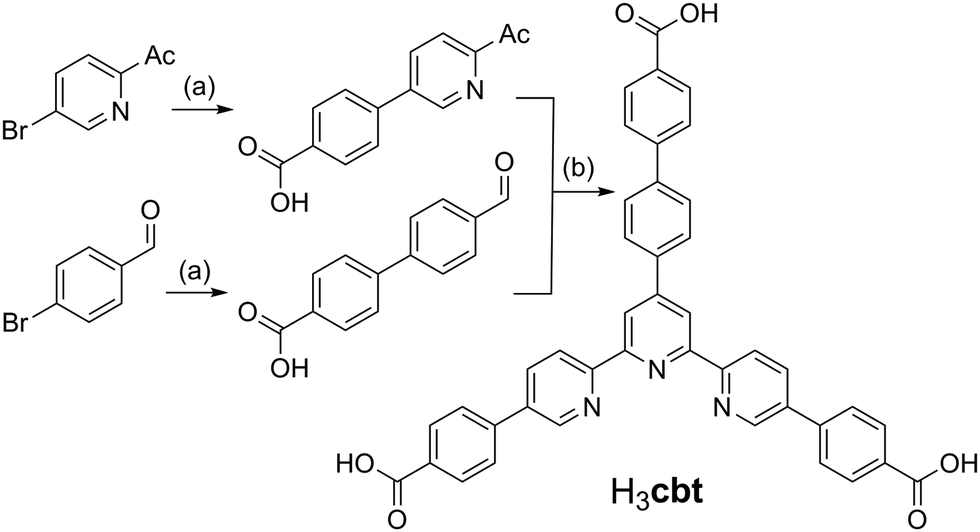 | ||
| Scheme 1
Reagents and conditions: (a) 2:1 MeOH:H2O, 4-carboxyphenylboronic acid, [Pd(PPh3)4], K2CO3, reflux, 12 h. (b) 2:1 H2O:aq. NH3, 2:1 aldehyde:ketone ratio, 100 °C, 30 min microwave heating. | ||
H3cbt exhibited limited solubility, dissolving only in hot DMF or DMSO. The proton NMR spectrum of H3cbt showed two groupings of aromatic protons: aryl resonances totalling sixteen protons in the region from 7.85–8.20 ppm, and pyridyl resonances totalling eight protons at higher ppm values. A characteristic singlet at 8.82 ppm that integrated for two protons was attributed to the pyridyl ring situated in the central hub of the ligand (ESI,† S2). Infrared analysis of H3cbt identified a band at 1704 cm−1 with a well-defined shoulder at 1662 cm−1, corresponding to the asymmetric carboxylic acid stretch of two non-equivalent carboxylic acid groups.
Crystallographic analysis
Crystalline samples of zinc frameworks 1–3 were obtained by adding H3cbt dissolved in hot anhydrous DMF to an equimolar solution of hydrated zinc nitrate dissolved in either anhydrous DMF for 1; wet DMSO for 2; or wet DMF for a mixture of 1 containing 3. Once combined, each mixture was subsequently heated at 100 °C in a sealed vessel for two days. The resulting MOF samples all possessed similar 2D network topologies and Zn(II) coordination environments. In each instance the zinc atom adopted five-coordinate geometry localised within the tridentate terpy group of the Hcbt ligand. The remaining two coordination sites are filled by carboxylate groups derived from neighbouring Hcbt ligands. In this way, every Hcbt ligand serves to localise a metal node within its terpy group while simultaneously projecting two framework struts in the form of coordinating polyaromatic carboxylate arms. Propagation in this manner yields a (4,4) sheet, in which the non-coordinating carboxylic acid arm of Hcbt is arrayed orthogonally to the 2D sheet, resulting in regular interdigitation of the sheets above and below. Tables of crystal and structure refinement data for 1–3 are provided as ESI† (S3).[Zn(Hcbt)]·4DMF (1)
The asymmetric unit of 1 contains a single Hcbt ligand chelating a zinc centre in the tridentate manner typical of terpyridine moieties, coupled with four molecules of DMF in the lattice. One molecule of DMF acts as a hydrogen bond acceptor to the carboxylic acid group of the non-coordinating Hcbt arm (ESI,† S4). Two symmetry generated (1/2 − x, y − 1/2, 3/2 − z; 3/2 − x, 3/2 + y, 3/2 − z) Hcbt ligands complete the coordination sphere of the zinc centre, each coordinating in a κO fashion (Fig. 1, left). The distance between the Zn(II) centre and the terpy group ranges from 2.0733(17) Å (Zn(1)–N(2)) to 2.1708(18) Å (Zn(1)–N(1)), with the central nitrogen atom having closest contact to the metal centre. The coordinating carboxylate oxygen atoms have interatomic distances of 1.9641(15) Å (Zn(1)–O(1)) and 1.9563(16) Å (Zn(1)–O(4)). The non-coordinating carboxylate oxygens, O(2) and O(3), are each ca. 3.0 Å from the metal centre, precluding any form of covalent interaction. The coordination geometry of 1 approaches perfect trigonal bipyramidal, with a τ value of 0.92.18 The angle formed between the two coordinating benzoate groups (O(1)–Zn(1)–O(4)) is 95.47(7)°, with asymmetric carboxylate coordination relative to the terpy group (O(1)–Zn(1)–N(2): 141.95(7)°, O(4)–Zn(1)–N(2): 122.21(7)°). Similarly, while O(4) coordinates approximately equidistant between N(1) and N(3) of the terpy group, O(1) favours coordination with closer proximity to N(1), (O(1)–Zn(1)–N(1): 95.43(7)°, O(1)–Zn(1)–N(3): 105.48(7)°). The [Zn(Hcbt)] motif propagates to form 2D (4,4) sheets that adopt offset layers to accommodate interdigitation of the non-coordinating carboxylic acid arms through voids made by the sheet above and below (Fig. 1, right). Solvated channels exist within the structure to accommodate the four lattice molecules of DMF. These channels propagate along the crystallographic c axis and are ordered by a strong hydrogen bonding interaction from the non-coordinating arm of the Hcbt ligand. The inter-oxygen distance between the donor carboxylic acid group and the acceptor DMF molecule is 2.636(3) Å.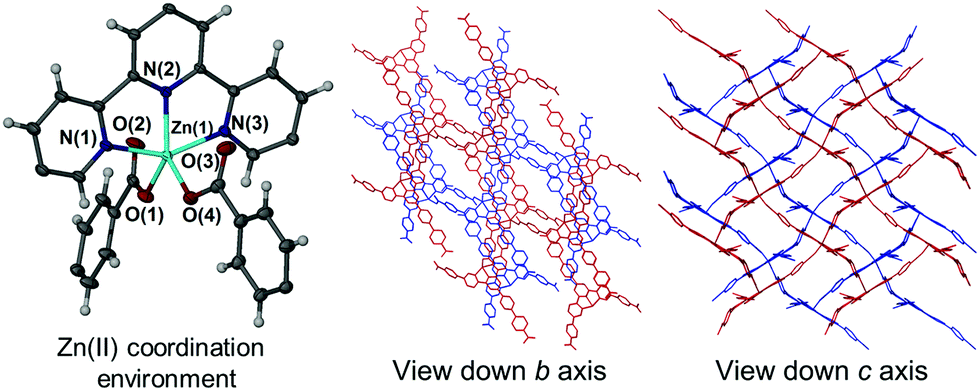 | ||
| Fig. 1 Left: The zinc(II) coordination environment of 1 showing only the terpy region of the coordinating Hcbt ligand and coordinating benzoate groups of neighbouring Hcbt ligands. Ellipsoids are shown with 50% probability. Right and centre: Two stacked 2D sheets (shown in red and blue) of [Zn(Hcbt)] in 1 as viewed down the crystallographic b and c axes. Lattice solvents present within the channels have been removed for clarity. | ||
[Zn(Hcbt)]·4DMSO·1.5H2O·DMF (2)
The addition of wet DMSO to the solvent mixture of 1 resulted in isolation of a second 2D framework that contained DMSO, DMF and water within its pores. In addition to a Hcbt ligand chelating zinc(II) via the terpy group, the asymmetric unit of 2 also contained four molecules of DMSO, one molecule of DMF and two molecules of water, of which one exhibited half occupancy. The zinc(II) centre is made five-coordinate by a pair of carboxylate groups that coordinate analogously to 1 (Fig. 2, left), albeit with greater distortion from trigonal bipyramidal geometry (τ value: 0.88).18 The central ring of the terpy group is twisted from planarity by ca. 10°, which shortens the Zn(1)–N(2) bond length to 2.051(9) Å. The Zn–O bond lengths of 2 are analogous to 1, however the coordination angles vary considerably. Variation in the angles relative to the terpy group include the O(1)–Zn(1)–N(2) angle of 133.3(4)° (compared with 141.95(7)° in 1), and the O(4)–Zn(1)–N(2) of 128.0(4)° (122.21(7)° in 1). Furthermore, the coordinating carboxylate oxygen atoms in 2 are both approximately equidistant in location between N(1) and N(3) of the terpy group, with (O(1)–Zn(1)–N(1) and O(1)–Zn(1)–N(3)) angles of 99.8(3)° and 98.5(4)° respectively. This compares to angles of 95.43(7)° and 105.48(7)° observed for 1. The angle formed between the two coordinating benzoate groups (O(1)–Zn(1)–O(4)) of 2 is 98.6(4)°. The 2D (4,4) sheets no longer stack in a manner that produces solvated channels along the crystallographic c axis (Fig. 2, right), instead pronounced channels form along the crystallographic b axis to accommodate the additional solvent molecules. A strong hydrogen bond again provides an ordering influence on the lattice solvent, located between the carboxylic acid group and a molecule of DMSO, with an inter-oxygen distance of 2.626(15) Å.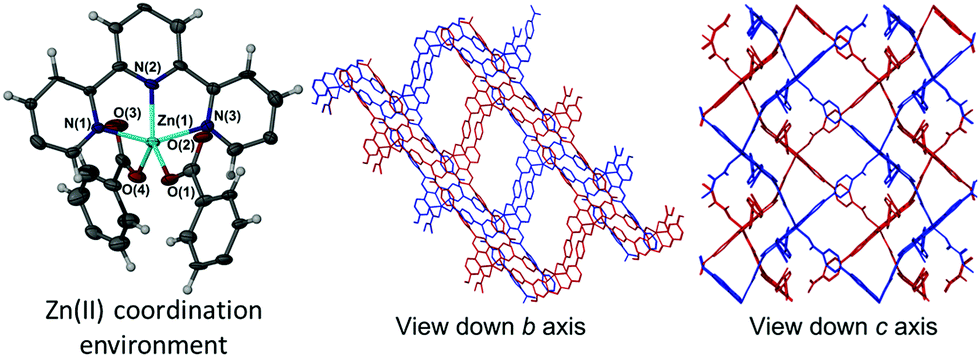 | ||
| Fig. 2 Left: The zinc(II) coordination environment in 2 showing only the terpy region of the coordinating Hcbt ligand and coordinating benzoate groups of neighbouring Hcbt ligands. Ellipsoids are shown with 50% probability. Right: Stacked 2D sheets (shown in red and blue) of [Zn(Hcbt)] in 2 as viewed down both the crystallographic b and c axes. Lattice solvents present within the channels have been removed for clarity. | ||
[Zn(Hcbt)]·2DMF·3H2O (3)
Altering the synthesis of 1 to make use of wet DMF produced a mixture of products. The major product remained 1 however this was now interspersed with small amounts of a new hydrated form 3. The asymmetric unit of 3 differs from 1 in that it contained only two molecules of DMF, with the remaining sites occupied by three molecules of water, one of which showed positional disorder. While the zinc(II) atom remained five-coordinate, a striking difference was seen in the carboxylate coordination mode (Fig. 3, left). One of the carboxylate groups has pivoted, resulting in substitution of O(1) coordination for O(2) coordination to the metal centre. The newly formed Zn(1)–O(2) bond in 3 is slightly longer than the former Zn(1)–O(1) bond in 1 (1.980(5) Å versus 1.9641(15) Å). The angles observed about the Zn(II) centre also vary considerably relative to the parent motif, exemplified by O(2)–Zn(1)–O(4) angle of 104.3(3)° (former angle: 95.47(7)° for O(1)–Zn(1)–O(4) in 1), and carboxylate coordination angles relative to the terpy group of O(2)–Zn(1)–N(2): 123.9(2)° and O(4)–Zn(1)–N(2): 131.5(2)° (formerly: 141.95(7)° and 122.21(7)° in 1 respectively). Because of these changes in geometry, the zinc coordination sphere of 3 deviates considerably from perfect trigonal bipyramidal, with a τ value of 0.77.18 The net influence of these conformational changes is a twisting effect on the (4,4) sheet motif that restricts continuity of the solvent channels down both the crystallographic b and c axes (Fig. 3, right). | ||
| Fig. 3 Left: The zinc(II) coordination environment in 3 showing only the terpy region of the coordinating Hcbt ligand and coordinating benzoate groups of neighbouring Hcbt ligands. Ellipsoids are shown with 50% probability. Right: Two stacked 2D sheets (shown in red and blue) of [Zn(Hcbt)] in 3 as viewed down the crystallographic b and c axes. Solvent molecules present within the structure have been removed for clarity. | ||
Modes of conformational flexibility in 1–3
Multiple modes of flexibility can be identified within structures 1–3 which hold relevance for GASP modelling. Globally, the structures consist of interdigitated 2D sheets that stack along the crystallographic c axis. In every layer the non-coordinating H3cbt arms protrude above or below into the quadrilateral interstices of adjacent layers. There are no strong interactions connecting stacked layers, meaning that in the absence of lattice solvents the layers would experience two degrees of translational freedom orthogonal to the c axis. In practice, the presence of lattice solvents restricts this type of motion. Instead, two other mechanisms of conformational flexibility are observed within 1–3: (1) hinge-like changes to carboxylate coordination of the Zn(II) atom that influence both the angle and relative orientation of the ligand, and (2) distortion of the Hcbt ligand away from planarity and linearity.The first mechanism, hinge-like variation of the coordination angle between carboxylates and the Zn(II) atom, enables the MOF channels to expand or contract in response to variable solvent loadings. Accommodating sterically challenging solvents appears to drive this effect, with substitution of larger DMF molecules with water in 3 promoting a closed-channel form, whereas accommodation of sterically challenging DMSO molecules drives formation of an open-channel form in 2. This hinge-like effect has been quantified in structures 1–3 by measuring the angle made between coordinating benzoate ring centroids in relation to the zinc atom. The observed range varied from 99° (3) to 120° (2), as shown in Fig. 4.
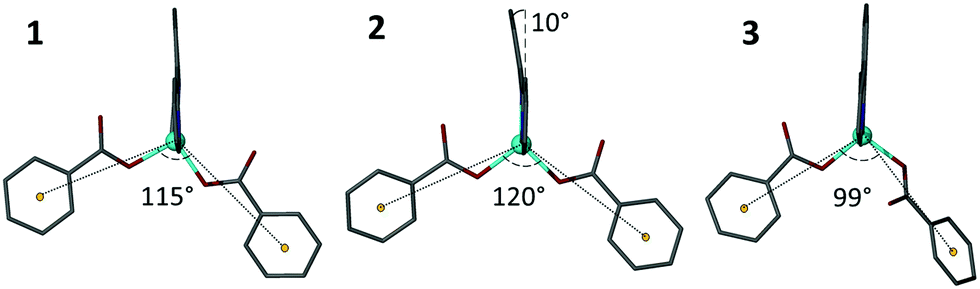 | ||
| Fig. 4 A demonstration of hinge-like flexibility observed at the zinc coordination sphere for structures 1–3. Both the angle, orientation and coordination mode of the Hcbt ligand influences the size of the resulting channels within the motif. Angles are rounded to the nearest integer. | ||
The second mode of flexibility quantified by this study is distortion of the Hcbt ligand away from planarity and linearity. Fig. 5 shows that framework 3 contains the least distorted Hcbt ligand in that the tripodal arms of Hcbt remain linear, and the terpy group planar. In contrast, while framework 1 retains a planar terpy group, the terminal benzoate/benzoic acid groups of all three arms bend away from linearity by 8–14°. In framework 2 planarity of the terpy group is broken by ca. 10° (Fig. 4), which reorients the central Hcbt arm, and by extension, alters the stacking of interdigitated sheets. Simultaneously one of the remaining two terminal benzoates also deviates from linearity by ca. 11°. This inherent flexibility of the Hcbt ligand is one possible explanation for the lower-than-expected porosity value (vide infra) for the activated open-channel form of 2. The ability of the ligands to distort provides a means for the framework to close empty channels as they desolvate.
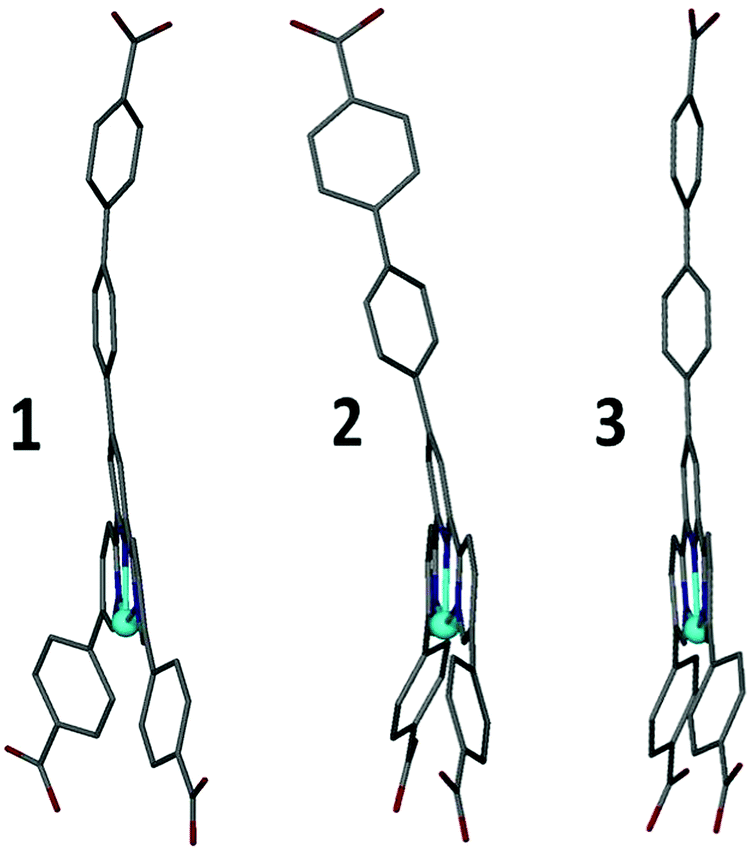 | ||
| Fig. 5 Distortions to the Hcbt ligand observed in structures 1–3. The distortions take the form of bending of the tripodal arms, and in the case of 2, a 10° distortion from planarity across the terpy group (see also Fig. 4). | ||
GASP modelling of flexibility at zinc centres
The X-ray diffraction studies of structures 1–3 identified several classes of movement that recommend this family of structures for further analysis using the geometric simulation approach implemented by the software GASP. In geometric simulation, the input geometry of a structure is maintained by a system of templates, while the unit cell parameters are varied. This allows the mechanisms by which the flexible framework responds to the imposed strain to be observed. GASP was originally developed for mineral frameworks composed of polyhedra, e.g. the aluminosilicates; however a recent extension of the logic permits it to handle the organic ligands typical of MOF frameworks as well.12 In this case, GASP allows us to investigate the significance of the change in carboxylate coordination mode in structure 3 compared to 1 and 2. Details of the simulation approach are described in the Methods section, and all simulation files are provided as ESI.†The flexibility of each structure can be examined by imposing the cell parameters of a different structure upon it; GASP then seeks to adapt to the new cell while maintaining the local bonding geometry defined by the original input structure. A particularly intriguing result is obtained using structure 3 as input. In Fig. 6, panel A shows a unit cell of structure 3 viewed along the crystallographic c axis. Panel B shows a simple scaling of the structure, in which the fractional coordinates are left unchanged but the cell parameters of structure 1 are imposed. Panel C shows the result of geometric simulation, seeking to maintain the bonding geometry of structure 3 with the cell parameters of structure 1. This structure clearly differs from the simple scaling case, particularly in the arrangement of the carboxylate oxygen atoms around the zinc centre. This simulated structure differs in turn from the experimental structure 1 which is shown for comparison in Panel D. Panel E shows the geometry of the terpy-zinc-carboxylate unit in the simple scaling case (i.e. a detail from the structure of Panel B). The scaling has clearly introduced distortions to the geometry of the aromatic rings. Panel F shows the geometry of the terpy-zinc-carboxylate unit in the geometric simulations (i.e. a detail from the structure of Panel C). It can be inferred that as the structure sought to adapt while maintaining its bonding geometry, the carboxylate unit rotates to bring the other oxygen atom into contact with the zinc centre – a reversal of the hinging motion noted between structures 1 and 3. Due to this rotation, the simulated structure contains substantial steric clashes, on the order of 0.1 Å, with consequent smaller distortions to the bonding geometry nearby. Thus, there is a direct link in framework 3 between changes in the global geometry, i.e. closure of the channels, and locally in terms of the carboxylate binding mode. If, by contrast, the cell parameters of structure 2 are imposed upon structure 1, or vice versa, and the structures are relaxed in geometric simulations, no such clashes or changes in carboxylate binding mode are observed. It is instructive to observe the result when the framework of structure 1 is used as the input, and cell parameters comparable to framework 3 are imposed upon it, as illustrated in Panel G. This represents a flexion of the channels, making them narrower, as would be expected if the channels contained smaller solvent molecules such as water. The carboxylate binding mode in framework 1 affords the structure more conformational freedom: in the geometric simulation, the structure adapts flexibly to the new cell parameters and no new clashes are generated.
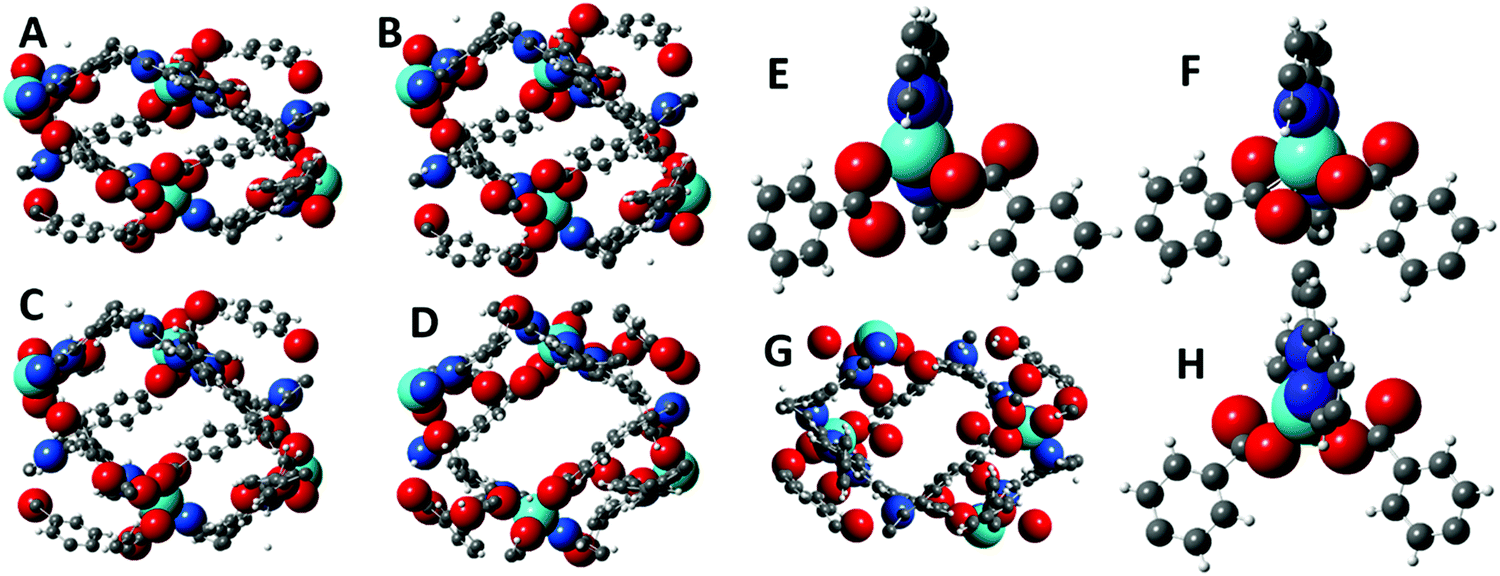 | ||
| Fig. 6 Panel A: One unit cell of framework 3, viewed along the crystallographic c axis. Panel B: Uniform scaling of framework 3 to the cell parameters of framework 1. Panel C: Geometric simulation of framework 3 with the cell parameters of framework 1. Panel D: One unit cell of framework 1, for comparison. Panel E: Zinc coordination in framework 3 with uniform scaling. Panel F: Zinc coordination in framework 3 with geometric simulation, showing rotation of carboxylate unit. Panel G: Unit cell from geometric simulation of framework 1 with cell parameters comparable to framework 3. Panel H: Zinc coordination in framework 1 with geometric simulation, showing free adaptation of zinc-carboxylate binding. In all panels, the metal, oxygen and zinc atoms are shown with radii comparable to the values used in the simulations (see Methods), while the radii of carbon atoms are reduced for clearer viewing. | ||
Topology of interdigitation
Further insights regarding the differences between frameworks 1–3 become evident when the topology of successively stacked layers along the c axis are considered. Each layer provides a chequerboard of roughly square interstices, into which the central arms of Hcbt ligands from the layers above and below insert. Due to the corrugation of the layers, adjacent interstices are topologically distinct, which in turn leads to two distinct possible topologies for interdigitation of the layers.In all three structures the unit cell contains an upper layer whose zinc atoms lie at z coordinates of approximately 5/6 and 4/6, and a lower layer whose zinc atoms lie at z coordinates of approximately 2/6 and 1/6. By aligning all three structures on the upper layer the stacking topologies can be observed and directly compared. In Fig. 7, Panel A shows a 2 × 2 × 1 supercell of the structure, viewed along the [001] direction. The zinc atoms are coloured by increasing z coordinate in order blue, green, yellow, orange. Quadrilateral outlines highlight an interstice in the upper layer overlaid by one in the lower layer. Note particularly the relative position of the uppermost (orange) and lowest (blue) zincs. The tail of the ligand coordinating the blue zinc atom inserts into the yellow-highlighted interstice of the other layer.
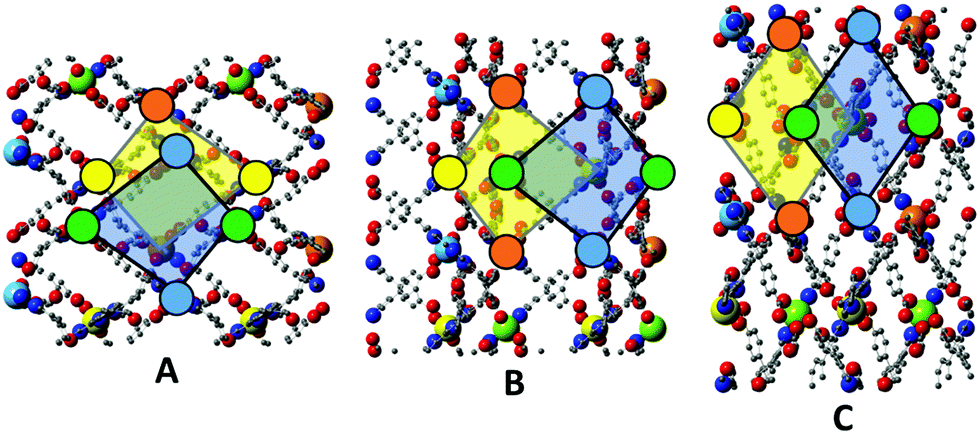 | ||
| Fig. 7 In all panels, zinc atoms are colour coded: upper layer, orange (z = 5/6) and yellow (z = 4/6), lower layer, green (z = 2/6) and blue (z = 1/6). Overlapping interstices are highlighted in the upper layer (yellow transparency) and the lower layer (blue transparency). Panel A, upper left: framework 1, 221 supercell, viewed along the [001] direction, with the [010] direction pointing up the page. Panel B, lower left: framework 2, 221 supercell, viewed as in Panel A. Panel C, right: framework 3, 221 supercell, viewed along the [001] direction with the [100] direction pointing up the page. | ||
Framework 2 can be aligned by a simple translation of the unit cell contents, bringing the upper layer into an analogous position and orientation to that of framework 1. The alignment of the terpy units around the zinc centres provides an unambiguous definition of the layer orientation; note the alignment of the three nitrogen atoms coordinating each zinc. Panel B shows analogous interstices highlighted as per Panel A. The topology of interdigitation is opposite to that seen in framework 1. It is now the green, not the blue, zinc centres that align with the yellow-highlighted interstice in the opposing layer, meaning that the free arm of Hcbt coordinating the blue zinc centre inserts into a different interstice. Thus, although frameworks 1 and 2 are similar in terms of their cell parameters and the geometry of their individual layers, they remain topologically distinctive, and cannot interconvert without complete delamination of the layers.
Framework 3 is an interesting case in that its upper layer must undergo both a translation of unit cell contents, and a 90° rotation about the [001] direction to adopt an analogous position and orientation to that of framework 1. As noted, it is the orientation of the terpy units about the zincs which defines the layer orientation. The structure is displayed in Panel C with analogous interstices highlighted. Note that in this panel the [100] direction is aligned with the page, whereas in Panels A and B it is the [010] direction that is aligned to the page. The topology of interdigitation is clearly the same as seen in framework 2 (Panel B), and different to that of framework 1 (Panel A); note that it is once again the green, not the blue, zinc which aligns with the yellow-highlighted interstice of the other layer. The different shape of the interstices in framework 3, as compared to 1 and 2, is also visible in this comparison.
Bulk characterisation of 1 and 2
Frameworks 1 and 2 could be accessed in sufficient quantities to facilitate their thorough characterization. Infrared analysis performed on crystalline samples identified the expected shift in carbonyl band from 1704 cm−1 (H3cbt) to 1601 cm−1 (1) and 1604 cm−1 (2) upon deprotonation and coordination to zinc. The carbonyl bands from the non-coordinating carboxylic acid within the frameworks were observed at 1719 cm−1 for 1, and 1702 cm−1 for 2. Thermogravimetric analysis (TGA) of 1 showed a mass loss of 11.2% in the range of 30 °C to 300 °C corresponding to loss of two molecules of DMF (predicted: 14.5%). Framework decomposition was then observed in two stages (onset at 330 °C and 510 °C). Framework 2 displayed a two-step solvent loss profile spanning from 30 °C to 330 °C for a mass loss of 32.8%, equating to four molecules of DMSO and a single molecule of DMF (predicted: 33.9%). Framework 2 exhibited a similar decomposition profile to 1 from 360 °C onwards (ESI,† S5), with the slight improvement in thermal stability likely being a consequence of lesser ligand distortion inherent to this motif (i.e.Fig. 5). The discrepancy between the number of DMF molecules observed thermogravimetrically as opposed to crystallographically for 1 is likely a result of solvent loss during the overnight air-drying step prior to analysis. Bulk purity of powder material produced on larger scale was determined by both elemental analysis and PXRD methods (ESI:† Fig. S6). The nitrogen values of the elemental analysis were slightly lower than expected, which we attributed to known issue of incomplete oxidation affecting heterocyclic nitrogen species such as H3cbt.19 Interconversion between the two unique solvates by suspending samples of 1 or 2 in either neat DMF or DMSO proved unsuccessful, and similarly 3 could not be accessed by suspending 1 in water (ESI:† Fig. S6). These results can now be interpreted with respect to the differences in interdigitation topology and carboxylate binding mode among the structures as modelled by GASP. The geometric simulations of flexibility about the zinc centres highlight that framework 1 could adapt flexibly to accommodate water in narrower channels without needing to alter carboxylate binding mode to that seen in framework 3, however the differences in interdigitation topology would necessitate complete delamination and reformation of the layered stacking for this to occur, which ultimately precludes interconversion, as was observed experimentally (ESI,† S9).Bulk powder samples of 1 and 2 were activated by heating at 150 °C under high vacuum for eight hours. BET surface area calculations were then performed on these activated samples that yielded near equivalent values of 248 m2 g−1 for 1, and 269 m2 g−1 for 2 after a nitrogen adsorption–desorption experiment. The first value is in good agreement with the predicted value obtained for crystalline 1 of 206 m2 g−1. By contrast, the predicted BET surface area for 2 was 537 m2 g−1, ca. twice the observed value. PXRD analysis performed on the activated powders show retention of crystallinity in both samples (ESI,† S9). Both activated materials show variations in both intensity and peak position relative to the ‘as synthesised’ 1 and 2, particularly at low 2θ angles. We attribute these variations to changes in the topological structure as the frameworks contort to minimise void space upon activation. Unique patterns of peaks and intensities observed in the PXRD patterns of activated 1 and 2 support GASP's assertion that the topologies of interdigitation for these frameworks are non-interchangeable (i.e.Fig. 7). This makes it impossible for either framework to structurally mimic the other without a complete delamination of the assembled layers. Modelling from GASP also supports the finding that the two frameworks can adopt similar conformations upon activation to minimise void space, explaining the near-identical BET surface area calculations determined for 1 and 2.
Conclusions
Synthesis of a new terpyridine-functionalised tricarboxylic acid ligand, H3cbt, has allowed the crystallographic characterisation of three new zinc(II) MOFs, two of which were further characterized by elemental analysis, TGA, and IR spectroscopy. BET measurements performed on activated powdered samples of 1 and 2 yielded analogous BET surface areas, each being consistent with the predicted values of motif 1. Geometric simulation using the code ‘GASP’ unambiguously demonstrated that frameworks 1 and 2 are topologically distinct, and thus unable to interconvert without delamination of their constituent layers. It also showed that the topology of interdigitation of framework 3 matched that of framework 2. Furthermore, GASP was able to justify structural trends in global geometry after identifying links between framework channel size and local features such as carboxylate binding modes. It primarily achieved this by assessing changes to the magnitude of steric clashing when simulating variations to the carboxylate-zinc binding region (i.e. hinge-like motion) while allowing for rotation of adjacent aromatic rings in the arms of the Hcbt ligand. The analogous BET surface areas of activated 1 and 2 was also justified using GASP, with modelling showing the feasibility of conformational rearrangement of activated framework 2 to approximate 1 based on geometric and topological grounds. In summary, the insights from geometric simulations performed on this new family of flexible MOFs provide a compelling demonstration of GASP's applicability to challenging MOF systems. It is hoped that this proof-of-concept work improves understanding and enhances the modelling of mechanisms and barriers to conformational change in flexible MOF motifs.Author contributions
The manuscript was written through contributions of all authors. All authors have given approval to the final version of the manuscript. Geometric simulations were carried out by SAW and interpreted in discussion with all authors.Conflicts of interest
The authors declare no competing financial interests.Acknowledgements
We are grateful to the EPSRC for financial support of the project (EP/K004956/1). We would also like to thank the ALS, LBNL for the beamtime to perform these measurements. The Advanced Light Source is supported by the Director, Office of Science, Office of Basic Energy Sciences, of the U.S. Department of Energy under Contract No. DE-AC02-05CH11231.References
- (a) A. Schneemann, V. Bon, I. Schwedler, I. Senkovska, S. Kaskel and R. A. Fischer, Chem. Soc. Rev., 2014, 43, 6062–6096 RSC; (b) G. Férey and C. Serre, Chem. Soc. Rev., 2009, 38, 1380–1399 RSC; (c) J. V. Knichal, W. J. Gee, A. D. Burrows, P. R. Raithby, S. J. Teat and C. C. Wilson, Chem. Commun., 2014, 50, 14436–14439 RSC; (d) W. J. Gee, L. E. Hatcher, C. A. Cameron, C. Stubbs, M. R. Warren, A. D. Burrows and P. R. Raithby, Inorg. Chem., 2018, 57, 4959–4965 CrossRef CAS PubMed; (e) Z. Liu, L. Zhang and D. Sun, Chem. Commun., 2020, 56, 9416–9432 RSC; (f) F.-X. Coudert, Chem. Mater., 2015, 27, 1905–1916 CrossRef CAS; (g) A. D. Burrows, S. Chan, W. J. Gee, M. F. Mahon, C. Richardson, V. M. Sebestyen, D. Turski and M. R. Warren, CrystEngComm, 2017, 19, 5549–5557 RSC.
- (a) M. Eddaoudi, J. Kim, N. Rosi, D. Vodak, J. Wachter, M. O’Keeffe and O. M. Yaghi, Science, 2002, 295, 469–472 CrossRef CAS PubMed; (b) S. Kitagawa, R. Kitaura and S. Noro, Angew. Chem., Int. Ed., 2004, 43, 2334–2375 CrossRef CAS PubMed; (c) W. J. Gee, Dalton Trans., 2017, 46, 15979–15986 RSC; (d) H. A. Hamzah, W. J. Gee, P. R. Raithby, S. J. Teat, M. F. Mahon and A. D. Burrows, Chem. – Eur. J., 2018, 24, 11094–11102 CrossRef PubMed; (e) W. J. Gee, L. K. Cadman, H. Amer Hamzah, M. F. Mahon, P. R. Raithby and A. D. Burrows, Inorg. Chem., 2016, 55, 10839–10842 CrossRef CAS PubMed.
- (a) S. R. Batten, S. M. Neville and D. R. Turner, Coordination Polymers: Design, Analysis and Application, Royal Society of Chemistry, Thomas Graham House, Science Park, Milton Road, Cambridge CB4 0WF, UK, 2008 Search PubMed; (b) J. D. Evans, V. Bon, I. Senkovska, H.-C. Lee and S. Kaskel, Nat. Commun., 2020, 11, 2690 CrossRef CAS PubMed.
- S. Kitagawa and K. Uemura, Chem. Soc. Rev., 2005, 34, 109–119 RSC.
- (a) D. Bousquet, F.-X. Coudert, A. G. J. Fossati, A. V. Neimark, A. H. Fuchs and A. Boutin, J. Chem. Phys., 2013, 138, 1747061 CrossRef PubMed; (b) J. V. Knichal, H. J. Shepherd, C. C. Wilson, P. R. Raithby, W. J. Gee and A. D. Burrows, Angew. Chem., Int. Ed., 2016, 55, 5943–5946 CrossRef CAS PubMed; (c) W. J. Gee, K. Robertson and J. M. Skelton, Eur. J. Inorg. Chem., 2017, 2628–2636 CrossRef CAS; (d) H. A. Lopez, A. Dhakshinamoorthy, B. Ferrer, P. Atienzar, M. Alvaro and H. Garcia, J. Phys. Chem. C, 2011, 115, 22200–22206 CrossRef CAS; (e) C. L. Jones, A. J. Tansell and T. L. Easun, J. Mater. Chem. A, 2016, 4, 6714–6723 RSC.
- (a) C. Mellot-Draznieks, C. Serre, S. Surble, N. Audebrand and G. Férey, J. Am. Chem. Soc., 2005, 127, 16273–16278 CrossRef CAS PubMed; (b) S. Surble, C. Serre, C. Mellot-Draznieks, F. Millange and G. Férey, Chem. Commun., 2006, 284–286 RSC.
- (a) W. Zhou, H. Wu, T. Yildirim, J. R. Simpson and A. R. Hight Walker, Phys. Rev. B: Condens. Matter Mater. Phys., 2008, 78, 0541141 Search PubMed; (b) L. D. DeVries, P. M. Barron, E. P. Hurley, C. Hu and W. Choe, J. Am. Chem. Soc., 2011, 133, 14848–14851 CrossRef CAS PubMed.
- K. W. Chapman, G. J. Halder and P. J. Chupas, J. Am. Chem. Soc., 2009, 131, 17546–17547 CrossRef CAS PubMed.
- J. Park, D. Yuan, K. T. Pham, J.-R. Li, A. Yakovenko and H.-C. Zhou, J. Am. Chem. Soc., 2012, 134, 99–102 CrossRef CAS PubMed.
- (a) S. A. Wells, K. M. Leung, P. P. Edwards and A. Sartbaeva, Dalton Trans., 2015, 44, 5978–5984 RSC; (b) A. Sartbaeva, S. A. Wells, M. M. J. Treacy and M. F. Thorpe, Nat. Mater., 2006, 5, 962–965 CrossRef CAS PubMed.
- (a) S. Wells, S. Menor, B. Hespenheide and M. F. Thorpe, Phys. Biol., 2005, 2, S127–S136 CrossRef CAS PubMed; (b) S. A. Wells, S. J. Crennell and M. J. Danson, Proteins: Struct., Funct., Bioinf., 2014, 82, 2657–2670 CrossRef CAS PubMed.
- S. A. Wells and A. Sartbaeva, Mol. Simul., 2015, 41, 1409–1421 CrossRef CAS.
- J. Huo, N. Arulsamy and J. O. Hoberg, Dalton Trans., 2011, 40, 7534–7540 RSC.
- SMART and SAINT Software Reference Manuals 6.22 ed. (Ed.: I. Bruker AXS Analytic X-ray Systems), Madison, WI, 2000.
- G. M. Sheldrick, Acta Crystallogr., Sect. C: Struct. Chem., 2015, 71, 3–8 Search PubMed.
- L. J. Barbour, J. Supramol. Chem., 2001, 1, 189–191 CrossRef CAS.
- (a) F. Saraci, V. Quezada-Novoa, P. R. Donnarumma and A. J. Howarth, Chem. Soc. Rev., 2020, 49, 7949–7977 RSC; (b) H. Jiang, J. Jia, A. Shkurenko, Z. Chen, K. Adil, Y. Belmabkhout, L. J. Weselinski, A. H. Assen, D.-X. Xue, M. O’Keeffe and M. Eddaoudi, J. Am. Chem. Soc., 2018, 140, 8858–8867 CrossRef CAS PubMed.
- D. A. Atwood, A. R. Hutchison and Y. Zhang, in Group 13 Chemistry III, ed. H. W. Roesky and D. A. Atwood, Springer Berlin Heidelberg, 2003, pp. 167–201 Search PubMed.
- P. D. Sternglanz and H. Kollig, Anal. Chem., 1962, 34, 544–547 CrossRef CAS.
Footnote |
| † Electronic supplementary information (ESI) available: Analysis of the H3cbt reaction mixture by accurate mass spectrometry; 1H-NMR spectrum of H3cbt; crystal data tables for 1–3; hydrogen-bonding environment about the nonbonding Hcbt arm in 1–3; TGA traces for 1 and 2; PXRD analysis for bulk samples of 1 and 2; a comparison of the PXRD pattern of 1 to the predicted pattern of 3; behaviour of 1 immersed in water for 12 hours; PXRD comparisons of activated 1 and 2 relative to solvated forms. CCDC 2062086–2062088. For ESI and crystallographic data in CIF or other electronic format see DOI: 10.1039/d1nj01158h |
| This journal is © The Royal Society of Chemistry and the Centre National de la Recherche Scientifique 2021 |