DOI:
10.1039/C9RA04296B
(Paper)
RSC Adv., 2019,
9, 25847-25860
Insight into the adsorption mechanisms of methylene blue and chromium(III) from aqueous solution onto pomelo fruit peel
Received
7th June 2019
, Accepted 6th August 2019
First published on 19th August 2019
Abstract
In this study, the biosorption mechanisms of methylene blue (MB) and Cr(III) onto pomelo peel collected from our local fruits are investigated by combining experimental analysis with ab initio simulations. Factors that affect the adsorption such as pH, adsorption time, adsorbent dosage and initial adsorbate concentration, are fully considered. Five isotherm models—Langmuir, Freundlich, Sips, Temkin, and Dubinin–Radushkevich—are employed to estimate the capacity of pomelo peel adsorption, whereas four kinetic models—pseudo-first-order, pseudo-second-order, Elovich and intra-diffusion models—are also used to investigate the mechanisms of the uptake of MB and Cr(III) onto the pomelo fruit peel. The maximum biosorption capacities calculated from the Langmuir models for MB and Cr(III) at 303 K are, 218.5 mg g−1 and 11.3 mg g−1, respectively. In particular, by combining, for the first time, the experimental FT-IR spectra with those obtained from ab initio calculations, we are able to demonstrate that the primary adsorption mechanisms of the uptake of MB onto pomelo fruit peel are electrostatic attraction and hydrogen-bond formations, whereas the adsorption mechanisms for Cr(III) are electrostatic attraction and n–d interactions.
1. Introduction
Environmental pollution has become a challenging problem in the lives of humans and other creatures in developing nations and some other regions in the world.1 Currently, government sectors in developing nations and other geographic regions are facing environmental problems, especially the release of organic compounds and heavy metal pollution from plating and textile dyeing industries, that lead to human health problems. Among the chemicals exhausted from these factories, methylene blue (MB) is responsible for fast heart rate, vomiting (spitting), shock, Heinz body formation, cyanosis, jaundice (icterus), quadriplegia and tissue necrosis in humans,2–5 whereas chromium compounds cause nausea, diarrhoea, liver failure, dermatitis (eczema), internal haemorrhage (bleeding) and respiratory troubles.6–9 Various chemical and physical methods have been employed to remove the MB and chromium compounds from aqueous solution, such as solvent extraction,8 adsorption,10–13 coagulation,14–16 membrane separation,17,18 ion exchange,19,20 electrodeposition,21 and reverse osmosis.22 It is well-known that, adsorption is a promising method to remove these compounds from waste water since this method has high enrichment efficiency and can be easily used to separate the phases.23–26
In recent years, the use of agricultural waste as a biosorbent to remove MB and Cr(III) has been widely applied. The reason is that biosorbent has many significant advantages such as simple implementation, very low cost, no or minimal use of chemicals and high efficiency, as compared to other materials. Several biosorbents have been used to treat MB and Cr(III) in waste solution such as oak banana peels,11 sawdust,27 lawn grass,28 de-oiled algae,29 mango leaves,30 corn cobs, sunflower31 and grapefruit.32
Pomelo, or Citrus maxima, has been popularly planted in Dong Nai Province, Vietnam. Among the tropical fruits, pomelo is known as one of special fruits with a thick peel and a large amount of pomelo peel waste is generated every year. Although pomelo has been widely used in food industry and pharmacy, its usages as well as products made from its peel as a biosorbent to remove toxic organic compounds and heavy metals from waste water have still been insignificant.33–36 However, the adequate insights into the adsorption mechanisms using the pomelo peel have been lacked so far.37–39 In addition, despite of the fact that the Fourier-transform infrared spectroscopy (FTIR) plays a crucial role in studying the adsorption characteristics of pomelo fruit peel,38,39 this method was unable to provide an accurate analysis for the interaction of adsorbates with lignin, cellulose, and pectin in pomelo fruit peel. Recently, the computer simulation using the ab initio modelling has been extensively applied to simulate the IR spectra of adsorbents, based on which one can exactly understand the relationships between the internal interactions and the shifts inside the experimental FT-IR spectra.40,41 It is therefore our hope that by combing the FT-IR measurement with the ab initio simulation, we will be, for the first time, able to deeply understand the adsorption mechanisms of removing MB and Cr(III) from wastewater solution using pomelo fruit peel. This is the goal of the present study.
2. Materials and methods
2.1. Chemicals
MB (C16H18ClN3S), which was used as an adsorbate in the present study, was prepared by dissolving the methylene blue (solid phase) in double-distilled water. The chemical structure and UV-Vis absorption spectrum of MB in the solution are shown in Fig. 1. Four characteristic peaks (246, 292, 613 and 664 nm) of MB are observed and they are similar to those reported previously.42
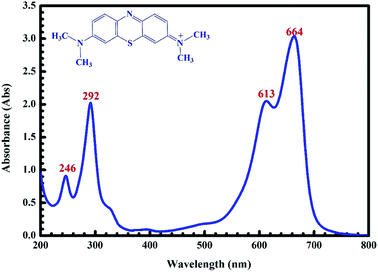 |
| | Fig. 1 UV-Vis absorption spectra of the MB solution. | |
Another adsorbate, Cr(III) (Cr(NO3)3) ions, was prepared by dissolving Cr(III) (1000 mg L−1) in double-distilled water.
All the chemicals, which are purchased from Merck, are in the analytical grade.
2.2. Preparation of biosorbent
Pomelo fruit peel, which was collected from Dong Nai province, Vietnam, was cleaned in double-distilled water and then dried at 80 °C in 24 hours. In the next step, the product was crushed to pieces of approximately 0.5–1 mm each and washed 2–3 times with double-distilled water prior to be dried in the oven.
2.3. Characterisation of biosorbent
The Ultra-high resolution scanning electron microscopy S-4800 (Hitachi) and Energy-dispersive X-ray Spectroscopy (JSM-6490LA) have been used to investigate the surface properties and elemental composition of pomelo fruit peels, whereas the Spectrum GX-FTIR (PerkinElmer, USA) has been applied to record their IR spectra before and after the adsorption over the wave-number range from 4000 to 400 cm−1.
The pH at the potential of zero-point charge (pHPZC), which describes the condition when the electrical charge density on a surface becomes zero, is an important instrument. In the present work, the pHPZC of the materials was determined by using the salt addition method.43 Here, 0.2 g of each pomelo fruit peel is placed in ten 100 mL plastic beakers including 50.0 mL of 0.1 M KNO3. The pH values are adjusted using a pH-meter (MARTINI Instruments Mi-150, Romania) from 2 to 11 (±0.1) with 0.1 M HNO3 or 0.1 M NaOH as required in each beaker. The prepared solutions are then shaken for 24 h until the equilibrium is reached. After that, each solution containing the typical pH is measured. By plotting the initial pH (pHo) versus the difference between the initial and final pH values (ΔpH), the pHPZC is chosen at the point where pH = 0.
The UV-Vis spectrum of MB was determined by using a spectrophotometer (Jasco-V630) with a measurement range from 800 to 200 nm and a data interval of 0.1 nm.
2.4. Batch adsorption experiments
In this work, the batch technique was utilised to investigate the uptake of MB and Cr(III) from aqueous solution onto pomelo fruit peel. Initially, we placed 0.2 g of the material into a 100 mL conical flask with 50 mL MB or Cr(III). The influence of pH on the solution (within a range of 2–11 for MB and 2–6 for Cr(III)), adsorption time (from 5 min to 240 min), and ionic strength was examined by varying the KCl concentration from 0 to 0.5 M, and initial concentrations of MB (from 5 to 1000 mg L−1) and Cr(III) (from 5 to 50 mg L−1). Each experiment was conducted with three replications. Next, the concentrations of MB and Cr(III) in the filtrate before and after the adsorption were measured using the UV-Vis and atomic absorption (AAS) spectrophotometers, respectively. For every 10 samples, the calibration, verification and standardisation were continuously applied during the measurement.
To calculate the percentage of removal (% removal) and adsorption capacity (qe), we have used the following mass-balance equations
| |
 | (1) |
and
| |
 | (2) |
where
Co (mg L
−1) is the initial concentration, whereas
Ce (mg L
−1) is the concentration at the equilibrium.
2.5. Adsorption isotherm
In order to describe the interactions between the adsorbate molecules and biosorbent surface as well as their distribution between the liquid and solid phases in an equilibrium state, many different well-known models with two or three fitting parameters can be used. In the present study, five models including Langmuir, Freundlich, Sips, Temkin and Dubinin–Radushkevich were chosen.
2.5.1. Two-parameter models. The Langmuir model is used to describe the adsorption of MB and Cr(III) by assuming that the monolayer adsorption occurs on a homogenous surface without any interaction between the adsorbed ions.44 Two key parameters, Qm, related to the monolayer adsorption capacity and KL, being the Langmuir constant, were determined based on a nonlinear form of Langmuir isotherm equation as45| |
 | (3) |
where qe (mg g−1) is the amount of adsorbed MB or Cr(III) per unit of mass of the adsorbent, whereas Ce (mg L−1) is the concentration of MB or Cr(III) remaining in the solution.The Freundlich model is utilised to estimate the adsorption of MB and Cr(III) by considering the multilayer adsorption, which occurs on a heterogeneous surface and contains a adsorbate–adsorbent interaction.44 Two main parameters, KF (L g−1) and n, corresponding, respectively, to the Freundlich constant and heterogeneity of the adsorption surface, were estimated by using a nonlinear form of the Freundlich isotherm equation given as46
Unlike the Langmuir and Freundlich models, the Temkin model proposes that the adsorption heat of all the molecules in the layers should linearly decrease with the coverage due to the adsorbent–adsorbate interactions. In addition, within the Tempkin model, the adsorption is characterised by a uniform distribution of the bonding energy up to some maximum values of the binding energy.44 The Temkin isotherm equation is often expressed in terms of the following nonlinear form47
| |
 | (5) |
where
KT (L mol
−1) is the binding constant at the equilibrium, which relates to the maximum binding energy, whereas
bT (kJ mol
−1) is associated with the adsorption heat.
R (8.314 × 10
−3 kJ K
−1 mol
−1) and
T (K) in
eqn (5) are the universal gas constant and temperature, respectively.
In addition, to determine the physical/chemical nature of the adsorption, the Dubinin–Radushkevich model was also used. The isotherm equation of the Dubinin–Radushkevich model is given as44
| |
qe = qm![[thin space (1/6-em)]](https://www.rsc.org/images/entities/char_2009.gif) e(−βε2), e(−βε2),
| (6) |
where
β (mol
2 J
−2) and
ε =
RT![[thin space (1/6-em)]](https://www.rsc.org/images/entities/char_2009.gif)
ln(1 + 1/
Ce) (J mol
−1) are the Dubinin–Radushkevich isotherm constant and Polanyi potential (J mol
−1), respectively. The mean adsorption energy
E (kJ mol
−1), a parameter which is used to determine whether the adsorption is physical or chemical, can be then calculated from the following equation
| |
 | (7) |
For instance, if E is smaller than 8 kJ mol−1, the adsorption is physical. If E is in the range of 8–16 kJ mol−1, the adsorption is ion-exchange, whereas the adsorption is chemical if E is higher than 16 kJ mol−1.48
2.5.2 Three-parameter models. In addition to the two-parameter models, different three-parameter models have also been widely considered for the description of adsorption isotherms. Among them, the Sips model, which is a combination of the Langmuir and Freundlich models, was selected. This model was proposed to describe the heterogeneous adsorption systems and to overcome the limitation on the increase of adsorbate concentration within the Freundlich model. This model has the form as44| |
 | (8) |
where αS (L mg−1) and βS are, respectively, the Sips isotherm constant and exponent, whereas QS is the Sips constant. The Sips model reduces to the Freundlich isotherm when the adsorbate concentration is low, whereas it becomes the Langmuir isotherm in the region of high concentration.
2.6. Data analysis
In order to identify the best fitted model for the adsorption process, the values of the chi-square (χ2), root mean square error (RMSE) and coefficient of determination (R2) of the nonlinear optimisation methods are calculated by using the following equations| |
 | (9) |
| |
 | (10) |
and| |
 | (11) |
The smallest values of RMSE and χ2 indicate which model is best fitted to the experimental data.
3. Results and discussion
3.1. Factors affecting the adsorption of MB and Cr(III)
3.1.1. pH. pH is one of the essential factors affecting the adsorption of adsorbates onto the surface of materials based on the electrostatic interaction. When pH of a solution is smaller than its pHPZC value (pH < pHPZC), the adsorption sites will be positively charged, which is thus available for the uptake of anions. By contrast, the adsorption sites will be negatively charged if pH is higher than its pHPZC value and consequently the adsorption of cations is favourable. In this work, the pHPZC value of pomelo fruit peels is determined to be approximately 4.5 (Fig. 2).
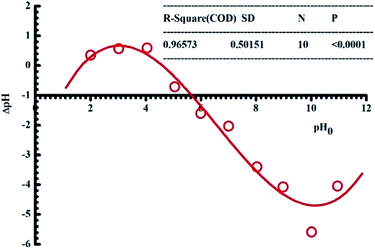 |
| | Fig. 2 Plot of the point of zero charge of pomelo fruit peel. | |
Fig. 3a shows that the absorbance intensity of MB after the adsorption versus the wavelength decreases dramatically with the pH values from 2 to 3. It slightly falls when pH increases 4 to 9 and reaches maximum at pH = 10 (see the black line in Fig. 3b). At the same time, the uptake of Cr(III) onto pomelo fruit peel rises dramatically with the pH values from 2 to 4 and then attains the maximum value at pH = 5.0, before falling minimally at the end of the experiment (see the red line in Fig. 3b). These results show that the changes in the pH values significantly affect the adsorption of MB and Cr(III) because of the transition of the surface charge from the positive to negative regions that facilitates the adsorption of cation.
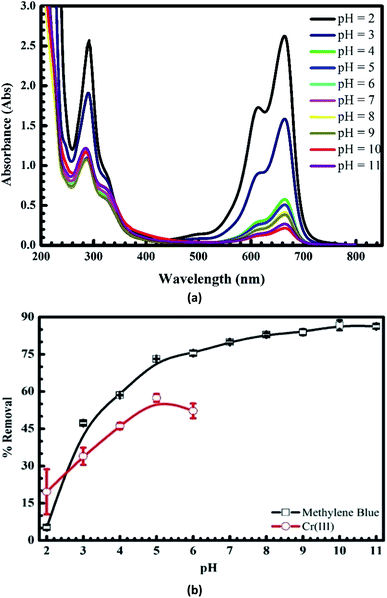 |
| | Fig. 3 UV-Vis spectra of MB after the uptake at different pH values (a) and effects of pH on the adsorption of MB and Cr(III) onto pomelo fruit peel (b). | |
3.1.2. Ion strength. Fig. 4 shows the influence of the ionic strength on the uptake of MB and Cr(III) onto pomelo fruit peel. In this figure, the percentage of MB being removed from the solution significantly drops from roughly 90% to about 20% with the slight increase of KCl concentration or ionic strength from 0.0 to 0.1 mol L−1. Increasing the ionic strength further does no change much the percentage of removal of MB. For the removal percentage of Cr(III), one can clearly see a slight fall from approximately 70% to about 40% with increasing the ionic strength. Obviously, the presence of electrolytes leads to the above reduction of the adsorption of MB and Cr(III) onto pomelo fruit peel. One explanation is that there is a screening effect (known as the electrostatic screening) existed between the positively charged surface of pomelo fruit peel and MB molecules or Cr(III) ions. This finding is consistent with the those reported by Salazar-Rabago et al. and Tran et al.3,49 Moreover, these data might suggest that the electrostatic force plays an instrumental role in the adsorption mechanism considered in the present study.
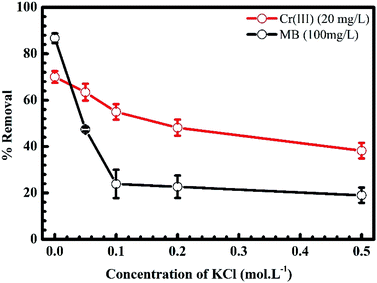 |
| | Fig. 4 Effects of KCl concentration or ionic strength on the adsorption of MB and Cr(III) onto pomelo fruit peel (shaking speed = 240 rpm, adsorption time = 150 min, error bar = SD, n = 3). | |
3.1.3. Adsorption time. Fig. 5a depicts the spectra of MB after the adsorption at different times. It can be seen that there is a downward trend in the intensity of absorbance after the adsorption without any shifts of the wavelength, indicating clearly that the adsorption is unique. The influence of time on the uptake of MB and Cr(III) onto pomelo fruit peel is presented in Fig. 5b, in which the adsorption increases with increasing the adsorption time and reaches an equilibrium after about 120 min for both MB and Cr(III). The percentage of removal at which the adsorption reaches the equilibrium are roughly 90% and 60% for MB and Cr(III), respectively.
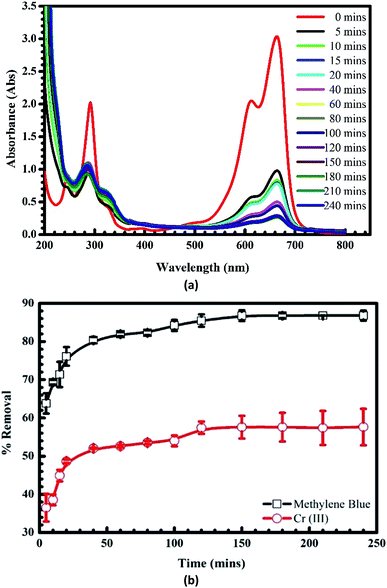 |
| | Fig. 5 UV-Vis spectra of MB before and after the adsorption at different times (a) and effects of time on the adsorption of MB and Cr(III) onto pomelo fruit peel (b) (shaking speed = 240 rpm, pH = 10 of MB and pH = 5 of Cr(III), error bar = SD, n = 3). | |
3.1.4. Adsorbate initial concentration. In Fig. 6 and 7, we plot the influence of initial concentration on the adsorption of MB and Cr(III) onto pomelo fruit peel. Several noteworthy results are seen, namely the adsorption capacity increases with increasing the initial MB and Cr(III) concentrations at different temperatures. These results can be explained by the fact that the number of adsorption sites is higher (smaller) than that of the adsorbate molecules at low (high) concentrations, leading to the increase of the adsorption capacity.31 Notably, the numbers show a steady decrease in the MB adsorption capacity, which is inversely proportional to the increase of temperature from 303 K to 323 K, whereas there is a reverse trend for the adsorption of Cr(III).
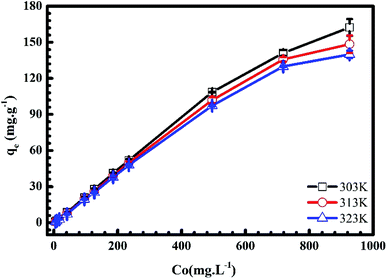 |
| | Fig. 6 Effects of initial concentration on the adsorption of MB onto pomelo fruit peels. | |
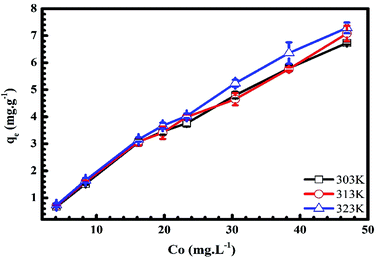 |
| | Fig. 7 Effects of initial concentration on the adsorption of Cr(III) onto pomelo fruit peels. | |
3.2. Isotherm studies
Plots of the nonlinear isotherm models for the biosorption of MB and Cr(III) onto pomelo fruit peels are shown in Fig. 8 and 9, whereas the calculated isotherm parameters are listed in Table 1. Based on the obtained RMSE and χ2 values given in Table 1, one can easily recognize that among four isothermal models, the Sips model gives the best fit to experimental data because it is a three-parameter model, which combines the Langmuir and Freundlich isotherms and works well in all the region of adsorbate concentrations.44 In addition, the n values determined from the Freundlich model are in the range of 1 to 10, confirming that the surface of this material is indeed heterogeneous.26,44,50 Besides, the monolayer maximum adsorption capacities calculated from the Langmuir models at 303 K for Cr(III) and MB are 11.29 mg g−1 and 218.5 mg g−1, respectively. By comparing with other studies shown in Table 2, it is obvious that although pomelo fruit peel is better at removing MB from aqueous solution than most of the biosorbents, it is not favourable for the removal of Cr(III) in the effluents.
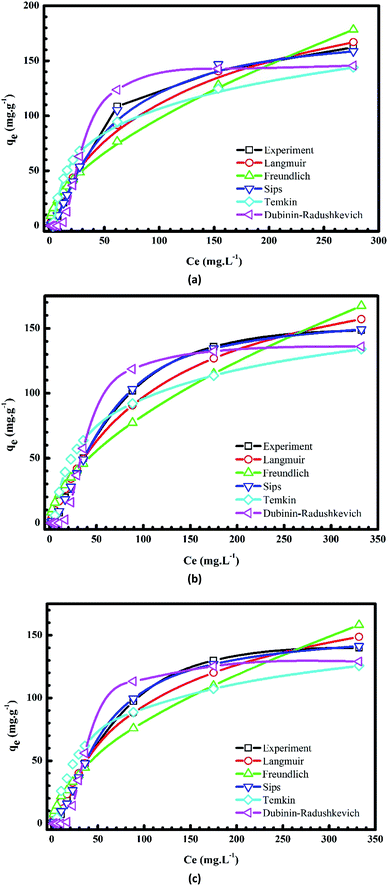 |
| | Fig. 8 Plots of nonlinear isotherm models of the adsorption of MB onto pomelo fruit peels at 303 K (a), 313 K (b) and 323 K (c). | |
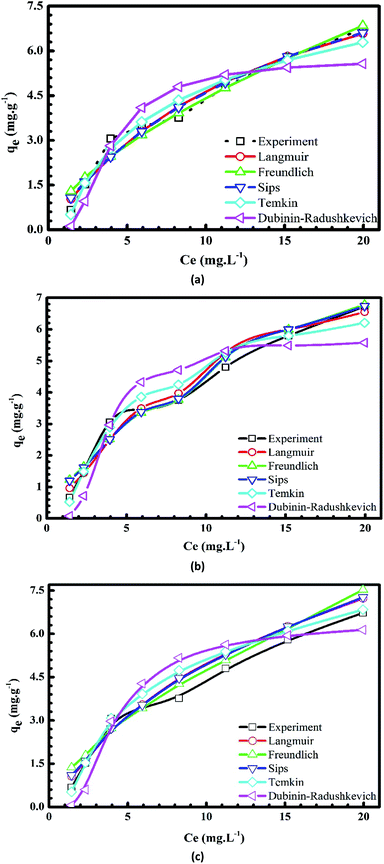 |
| | Fig. 9 Plots of nonlinear isotherm models of the adsorption of Cr(III) onto pomelo fruit peels at 303 K (a), 313 K (b) and 323 K (c). | |
Table 1 Nonlinear isotherm parameters
| Isotherm models |
Parameters |
| Temperature |
MB |
Cr(III) |
| 303 K |
313 K |
323 K |
303 K |
313 K |
323 K |
| Langmuir |
KL |
0.01168 |
0.00833 |
0.00693 |
0.0700 |
0.0725 |
0.0792 |
| qm (mg g−1) |
218.5 |
213.9 |
207.4 |
11.3 |
11.4 |
12.4 |
| RMSE |
7.464 |
7.336 |
6.950 |
0.3238 |
0.4088 |
0.2851 |
| R2 |
0.9838 |
0.9821 |
0.9822 |
0.9749 |
0.9616 |
0.9837 |
| χ2 |
39.71 |
47.78 |
45.72 |
0.3754 |
0.3493 |
0.2759 |
| Freundlich |
n |
1.78 |
1.71 |
1.68 |
1.58 |
1.58 |
1.59 |
| KF |
7.51 |
5.65 |
4.69 |
1.03 |
1.06 |
1.23 |
| RMSE |
14.76 |
14.41 |
13.33 |
0.3655 |
0.3789 |
0.3482 |
| R2 |
0.9366 |
0.9309 |
0.9345 |
0.9680 |
0.9670 |
0.9757 |
| χ2 |
203.9 |
209.8 |
187.3 |
0.7751 |
0.5716 |
0.6704 |
| Sips |
Qs |
0.42 |
0.23 |
0.18 |
0.83 |
1.04 |
1.03 |
| αs |
0.0025 |
0.0015 |
0.0012 |
0.06704 |
0.02045 |
0.07574 |
| βs |
1.581 |
1.594 |
1.583 |
0.9455 |
0.6874 |
0.9475 |
| RMSE |
2.515 |
1.176 |
1.974 |
0.3226 |
0.3778 |
0.2834 |
| R2 |
0.9982 |
0.9995 |
0.9986 |
0.9751 |
0.9672 |
0.9839 |
| χ2 |
0.8380 |
0.8374 |
2.083 |
0.4154 |
0.5210 |
0.3077 |
| Temkin |
KT (L mg−1) |
0.2901 |
0.2077 |
0.1820 |
1.149 |
1.23 |
1.15 |
| bT (kJ mol−1) |
0.07675 |
0.08225 |
0.08981 |
0.8818 |
1.019 |
1.0603 |
| RMSE |
20.00 |
19.20 |
18.74 |
0.3342 |
0.4619 |
0.3608 |
| R2 |
0.8835 |
0.8774 |
0.8704 |
0.9732 |
0.9509 |
0.9739 |
| χ2 |
1206 |
1271 |
1283 |
0.2185 |
0.3298 |
0.2530 |
| Dubinin–Radushkevich |
QD–R (mol g−1) |
146.9 |
137.5 |
130.6 |
5.757 |
5.78 |
6.37 |
| β |
104.9 |
172.2 |
226.9 |
2.201 |
1.856 |
1.704 |
| E (kJ mol−1) |
0.06905 |
0.05389 |
0.04694 |
0.4766 |
0.5190 |
0.5418 |
| RMSE |
11.28 |
9.899 |
9.927 |
0.7383 |
0.8732 |
0.8362 |
| R2 |
0.9630 |
0.9674 |
0.9636 |
0.8694 |
0.8246 |
0.8600 |
| χ2 |
44.28 |
37.28 |
39.39 |
1.347 |
1.856 |
1.950 |
Table 2 Comparison the monolayer maximum adsorption capacity with other materials
| Biosorbents |
Adsorbents |
pH |
Qmax (mg g−1) |
Ref. |
| Meranti sawdust |
Cr(III) |
6.0 |
37.9 |
50 |
| Banana peel |
Cr(III) |
— |
6.9 |
31 |
| Corn cob |
Cr(III) |
— |
18.8 |
31 |
| Sunflower |
Cr(III) |
— |
12.2 |
31 |
| Banana peel |
MB |
7.2 |
20.8 |
69 |
| Orange peel |
MB |
7.2 |
18.6 |
69 |
| Rice husk |
MB |
8.0 |
40.6 |
2 |
| White pine (Pinus durangensis) sawdust |
MB |
10.0 |
102.0 |
3 |
| Breadfruit (Artocarpus altilis) peel |
MB |
5.8 |
183.0 |
70 |
| Breadfruit (Artocarpus altilis) core |
MB |
5.8 |
200.0 |
70 |
| Artocarpus odoratissimus skin |
MB |
4.6 |
184.6 |
71 |
| Dragon fruit skin |
MB |
4.7 |
640.0 |
72 |
| Breadnut peel |
MB |
6.0 |
409.0 |
73 |
| Pomelo fruit peel |
Cr(III) |
5.0 |
11.3 |
This study |
| Pomelo fruit peel |
MB |
10.0 |
218.5 |
This study |
Furthermore, the free energy values of the adsorption of MB and Cr(III) estimated from the Dubinin–Radushkevich are less than 8 kJ mol−1, demonstrating that the uptake of MB and Cr(III) onto pomelo fruit peel should follow the physical processes.51
3.3. Kinetic studies
Fig. 10 and 11 show the plots of pseudo-first-order, pseudo-second-order, Elovich and intra-particle diffusion kinetic models, which are used to describe the adsorption rates of Cr(III) and MB onto pomelo fruit peels. The kinetic parameters of these models are listed in Table 3.
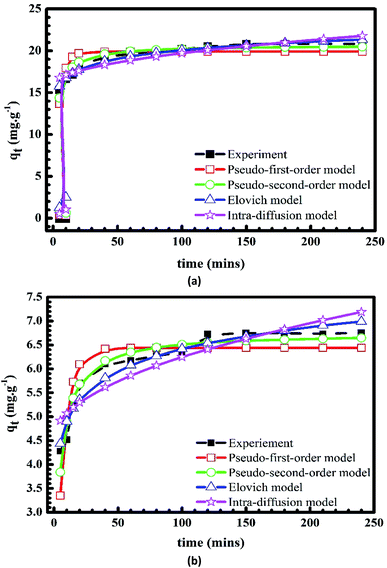 |
| | Fig. 10 Plots of kinetic models of the adsorption of MB (a) and Cr(III) (b) onto pomelo fruit peel. | |
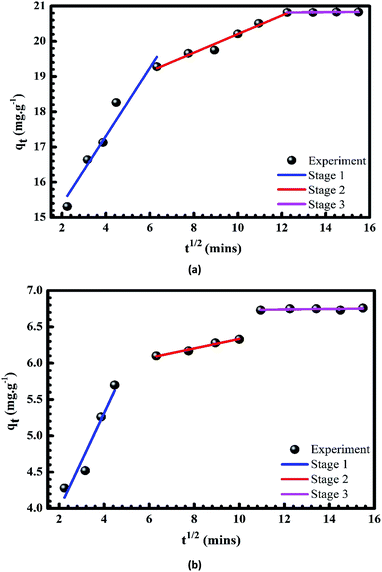 |
| | Fig. 11 Plots of intra-particle diffusion models of the adsorption of Cr(III) (a) and MB (b) onto pomelo fruit peel. | |
Table 3 Kinetic parameters
| Kinetics models |
Parameters |
| |
MB |
Cr(III) |
| Co (mg L−1) |
100 |
50 |
| qe(exp) (mg g−1) |
20.82 |
6.76 |
| Pseudo-first-order kinetic |
qe(cal) (mg g−1) |
19.90 |
6.44 |
| k1 (min−1) |
0.2323 |
0.1465 |
| RMSE |
1.137 |
0.4185 |
| R2 |
0.6183 |
0.7605 |
| χ2 |
0.8768 |
0.4160 |
| Pseudo-second-order kinetic |
qe(cal) (mg g−1) |
20.68 |
6.75 |
| k2 (g mg−1 min−1) |
0.02210 |
0.0391 |
| RMSE |
0.4931 |
0.2140 |
| R2 |
0.9282 |
0.9374 |
| χ2 |
0.1669 |
0.1100 |
| Elovich kinetic |
α |
16![[thin space (1/6-em)]](https://www.rsc.org/images/entities/char_2009.gif) 409 409 |
111.1 |
| β |
0.6944 |
1.517 |
| RMSE |
0.3340 |
0.2112 |
| R2 |
0.9671 |
0.9390 |
| χ2 |
0.07164 |
0.0974 |
| Intra-particle diffusion |
KP |
0.3765 |
0.1716 |
| C |
15.95 |
4.531 |
| RMSE |
0.7313 |
0.3722 |
| R2 |
0.8422 |
0.8105 |
| χ2 |
0.3589 |
0.3139 |
Equation of the pseudo-first-order equation is given as52
whereas that of the pseudo-second-order equation reads
53| |
 | (13) |
Here
qe (mg g
−1) and
qt (mg g
−1) are, respectively, the amount of solute adsorbed per unit weight of adsorbent at equilibrium and the amount of solute adsorbed at any time, whereas
k1 and
k2 are the adsorption constants.
The Elovich model assumes that the adsorption sites increase exponentially with adsorption and this model is mainly applicable for the chemo-adsorption kinetics. It has the form as54
| |
 | (14) |
where
β (mg g
−1) and
α (mg g
−1 min
−1) are the desorption constant during any one experiment and the rate constants, respectively.
Results listed in Table 3 indicate that among the three models above, the Elovich model gives the best agreement with the experimental data at different initial concentration as it produces the highest R2 and lowest χ2 values. Moreover, one can also see from Table 3 that the pseudo-second-order equation is in a better agreement with the experimental data than the pseudo-first-order one and the qe(cal) values obtained within this model are very close to the experimental data for both MB and Cr(III).
However, the diffusion mechanisms cannot be identified via the pseudo-first-order and pseudo-second-order models; hence, Weber and Morris55 have developed the intraparticle-diffusion model, whose equation is given as
where
C characterises the effects caused by the boundary layer and
kd is the diffusion constant. The results of the present study demonstrate that the uptakes of Cr(
III) and MB onto the pomelo fruit peel surface are likely to occur
via three stages. In the first stage [blue lines in
Fig. 11a and b], there is a bulk diffusion process within about 40 min at which Cr(
III) and MB have a quick transfer from the solution to the boundary film of the particles. Next, there is a gradual adsorption occurring during the time interval from 40 to 120 min in the second stage (red lines in
Fig. 11a and b). This stage is known as the sole rate-determining step. Moreover, one can also easily see that within this second stage the
qt plot does not cross the origin and the presence of the boundary layer effect is characterised by the nonzero value of
C. These results indicate that the adsorption follows not only the intraparticle diffusion but also two or more different mechanisms of the diffusion.
56 In the last stage (violet lines in
Fig. 11a and b), the equilibrium is reached because of two factors, namely the extremely low concentration of Cr(
III) and MB in the solution and the decrease in the number of adsorption sites.
26,57
3.4. Thermodynamics
The thermodynamic parameters such as the Gibbs free energy (ΔG) and the enthalpy (ΔH) and entropy (ΔS) differences are computed by using the MB or Cr(III) adsorption data at temperatures of 303 K, 313 K, and 323 K. These parameters follow the Gibbs isotherm as58
The quantity ΔG, which is a function of temperature, can be calculated from the following van't Hoff equation59
| |
ΔG = −RT![[thin space (1/6-em)]](https://www.rsc.org/images/entities/char_2009.gif) ln ln![[thin space (1/6-em)]](https://www.rsc.org/images/entities/char_2009.gif) KC, KC,
| (17) |
where
T (K) is the absolute temperature and
KC (L mol
−1) is the equilibrium constant. Meanwhile, the values of Δ
H and Δ
S can be determined from the intercept and slope of the plots of ln(
Kc)
versus 1/
T, that is
49| |
 | (18) |
Table 4 presents the values of thermodynamic parameters obtained within the present study for MB and Cr(III). It should be noted that the negative values of ΔG indicate a spontaneous process taking place between MB or Cr(III) and pomelo fruit peel, that is, the increase in the negative value of the Gibbs free energy with temperature is associated with a much more stable and energetically favourable adsorption of MB and Cr(III) at high temperatures. In addition, the values of the adsorption heat ΔH obtained within the present study are −21.29 kJ mol−1 and 4.98 kJ mol−1 for MB and Cr(III), respectively, which are both less than 40 kJ mol−1. We are therefore able to conclude that the adsorptions of MB or Cr(III) onto pomelo fruit peel are essentially following the physical adsorption processes.
Table 4 Thermodynamic parameters
| Adsorbate |
T |
KC |
ΔG (kJ mol−1) |
ΔH (kJ mol−1) |
ΔS (J mol−1) |
| MB |
303 |
11![[thin space (1/6-em)]](https://www.rsc.org/images/entities/char_2009.gif) 683 683 |
−23.54 |
−21.29 |
7.41 |
| 313 |
8330 |
−23.61 |
| 323 |
6932 |
−23.69 |
| Cr(III) |
303 |
69![[thin space (1/6-em)]](https://www.rsc.org/images/entities/char_2009.gif) 998 998 |
−28.08 |
4.98 |
109.13 |
| 313 |
72![[thin space (1/6-em)]](https://www.rsc.org/images/entities/char_2009.gif) 537 537 |
−29.17 |
| 323 |
79![[thin space (1/6-em)]](https://www.rsc.org/images/entities/char_2009.gif) 168 168 |
−30.27 |
3.5. SEM-EDX analysis
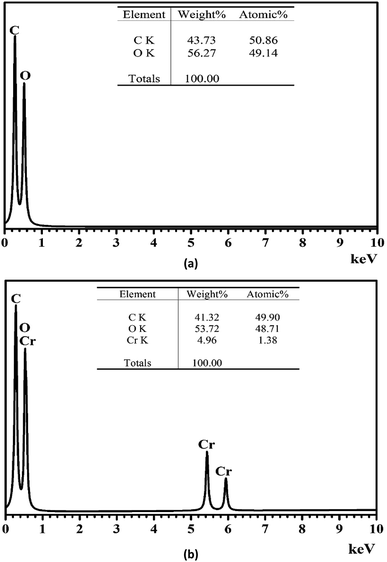
The morphology of pomelo fruit peel is investigated by using the ultra high-resolution scanning electron microscopy (SEM). The SEM image presented in Fig. 12 suggests that this adsorbent has a rugged surface and some cavities in its structure that are favourable for the uptake of MB and heavy metal ions. In addition, the elemental composition of pomelo fruit peel before the uptake of Cr(III) and MB is examined by using the energy-dispersive X-ray spectroscopy (EDX) and the results are depicted in Fig. 13a. The figure reveals that the main composition of the material includes C and O with 43.73 wt% and 56.27 wt%, respectively. Moreover, the appearance of the main characteristic peaks of Cr at 0.573, 5.415 and 5.947 keV in the EDX spectrum of pomelo fruit peel after the Cr(III) adsorption (Fig. 13b) indicates that Cr(III) ions have been successfully absorbed by pomelo fruit peel. Similar studies have also been reported.26,60
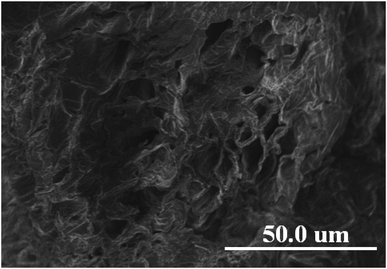 |
| | Fig. 12 SEM images of pomelo fruit peel. | |
 |
| | Fig. 13 EDX spectrum of pomelo fruit peel before (a) and after (b) the adsorption of Cr(III). | |
3.6. FT-IR analysis
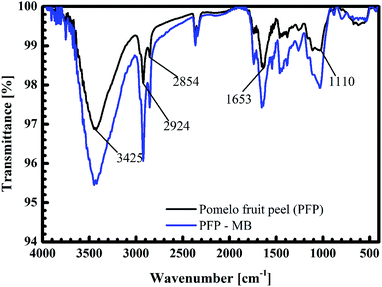
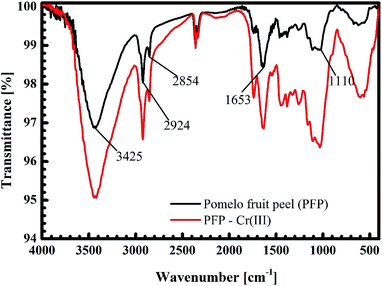
The black curves in Fig. 14 and 15 present the FT-IR spectrum of pomelo fruit peel. This spectrum exhibits a specific band at 3425 cm−1, which is related to the stretching vibration of –O–H groups (alcohols, phenols, and carboxylic acids) as in pectin, cellulose and lignin on the surface of the biosorbent.61 The spectrum peaks at around 2924 and 2855 cm−1 can be assigned to the stretching vibrations of C–H, whereas the peak observed at 1653 cm−1 can be attributed to the stretching vibration of C![[double bond, length as m-dash]](https://www.rsc.org/images/entities/char_e001.gif) O bond.61,62 The band at 1110 cm−1 confirms the stretching vibration of C–O in the lignin structure of grapefruit peel.63 Furthermore, the FT-IR spectra of pomelo fruit peel after the adsorption of MB and Cr(III) are plotted in Fig. 14 (black curve) and Fig. 15 (read curve). In Fig. 14, in comparison with the results obtained for pomelo fruit peel, that is, without MB, the intensity of all the specific peaks of pomelo fruit peel, which characterise the –O–H groups, C
O bond.61,62 The band at 1110 cm−1 confirms the stretching vibration of C–O in the lignin structure of grapefruit peel.63 Furthermore, the FT-IR spectra of pomelo fruit peel after the adsorption of MB and Cr(III) are plotted in Fig. 14 (black curve) and Fig. 15 (read curve). In Fig. 14, in comparison with the results obtained for pomelo fruit peel, that is, without MB, the intensity of all the specific peaks of pomelo fruit peel, which characterise the –O–H groups, C![[double bond, length as m-dash]](https://www.rsc.org/images/entities/char_e001.gif) O and –C–O bonds, is increased. These results indicate that the adsorption of MB onto pomelo fruit peel occurs via the above-named functional groups. Similarly, the change in the intensity of these specific peaks after the adsorption of Cr(III), depicted by the red curve in Fig. 15, demonstrates the interaction between Cr(III) and pomelo fruit peel surface.
O and –C–O bonds, is increased. These results indicate that the adsorption of MB onto pomelo fruit peel occurs via the above-named functional groups. Similarly, the change in the intensity of these specific peaks after the adsorption of Cr(III), depicted by the red curve in Fig. 15, demonstrates the interaction between Cr(III) and pomelo fruit peel surface.
 |
| | Fig. 14 FT-IR spectra of pomelo fruit peels before and after the adsorption MB. | |
 |
| | Fig. 15 FT-IR spectra of pomelo fruit peels before and after the adsorption Cr(III). | |
3.7. Proposal of the possible adsorption mechanisms
The possible mechanisms of cationic MB adsorption onto pomelo fruit peel are as follows: (1) electrostatic attraction, (2) hydrogen bonding and (3) n–π interactions;49 whereas those of Cr(III) uptake onto this material are: (1) electrostatic attraction and (2) n–π interactions.
The electrostatic attraction mechanisms can be explained based on the interaction between cationic MB and Cr(III) and negatively charged sites on the surface of pomelo fruit peel when pHsolution > pHPZC. Obviously, the pH values of solution used in the present work, which are approximately 5.0 for Cr(III) and roughly 10 for MB, are higher than the pHPZC values, thus, the carboxylic groups are deprotonated and negatively charged carboxylate ligands (–COO−) binding the charged MB and Cr(III) molecules as shown in Fig. 16a and 17a. These results are related to the studies of Tran et al.49 and Salazar-Rabago et al.3
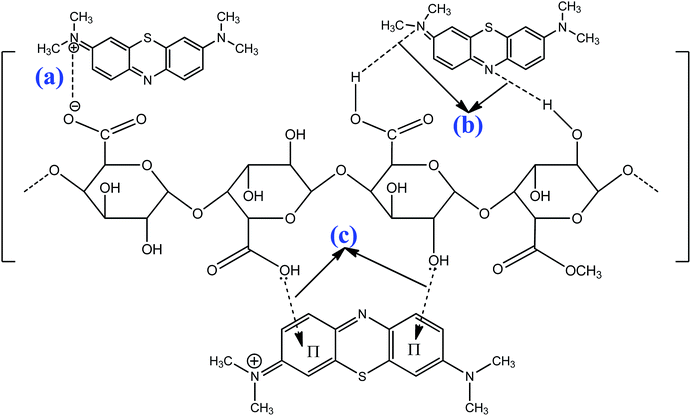 |
| | Fig. 16 Possible adsorption mechanisms of MB (pH = 10 > pHPZC): electrostatic attraction (a), hydrogen bonding (b), and n–π interactions (c). | |
 |
| | Fig. 17 Possible adsorption mechanisms of Cr(III) (pH = 5 > pHPZC): electrostatic attraction (a), and n–d interactions (b). | |
In addition, the hydrogen bonding interactions, which can be formed between the surface hydrogens of the hydroxyl groups (H-donors) on the pomelo fruit peel's surface and the nitrogen atoms (H-acceptors) of MB. This phenomenon is also known as the dipole–dipole hydrogen bonding (Fig. 16b). It can be seen from the FT-IR spectrum of the MB adsorbed sample (blue curve in Fig. 14) that the intensity of the –OH groups at around 3400 cm−1 dramatically decreases and shifts toward the minimally higher wavenumbers, confirming the existence of the dipole–dipole bonding interaction.49 The n–π or n–d interactions are formed between the electron donor atoms including pairs of electrons, such as oxygen or nitrogen, and acceptors that are aromatic rings or free d orbitals in metal ions. In this study, oxygen in the carbonyl groups on the surface of the adsorbent acts as an electron donor and the aromatic rings of MB and free d orbitals of Cr(III) act as electron acceptors (Fig. 16c and 17b).
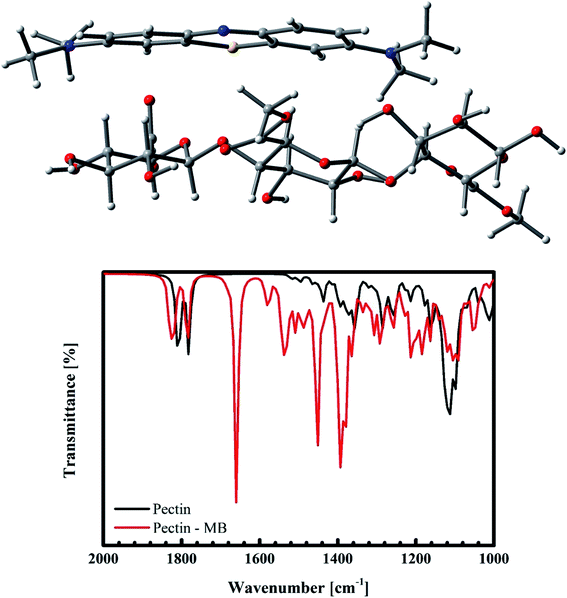
In order to understand deeply which interactions are dominant in the present experiment, a computer simulation within the ab initio calculations has been carried out. Within the optimization, the interactions between MB and pectin, the primary recipe of pomelo fruit peel, are calculated using the Gaussian suite of program64 with the B3LYP functional65 and the 6-31g* and LANL2dz (for Cr) basis sets.66–68 After structural optimisations, the obtained vibrational infrared results indicate that MB mainly interacts with pectin through the weak electrostatic forces and hydrogen bonding. This results in a slight shift of the vibrational modes and their corresponding change in the IR intensity (Fig. 18b). Moreover, it can be confirmed through the quantum mechanical calculations that there exist no n–π interactions between MB and pectin. Such modelling results are in good accordance with the FT-IR spectra of this material after the adsorption of MB shown in Fig. 14. We should be therefore able to state again that the interacting mechanism here is mainly constituted by the electrostatic force and weak hydrogen bonding.
 |
| | Fig. 18 Ab initio simulation of the interaction between MB and pomelo fruit peel. | |
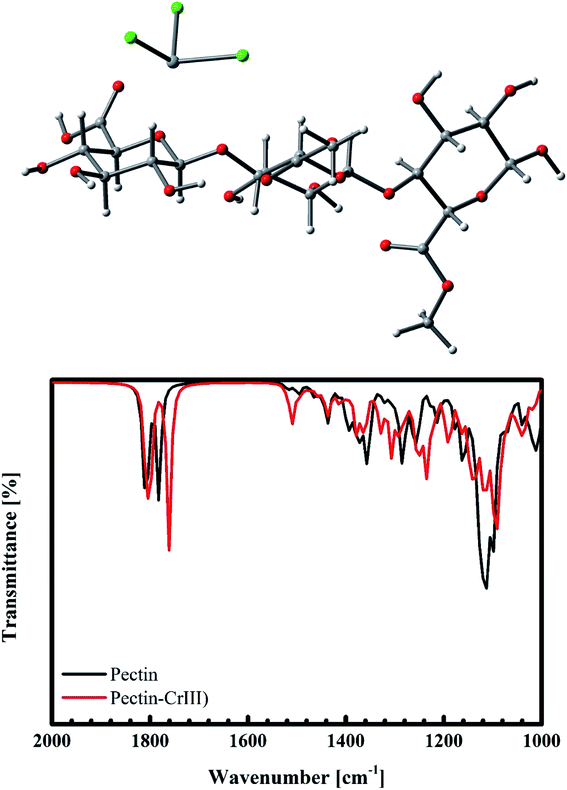
For the case of Cr(III) interacting with pectin, besides the weak electrostatic interaction, Cr(III) tends to exhibit a bonding distance of 2.097 Å to oxygen on the –C![[double bond, length as m-dash]](https://www.rsc.org/images/entities/char_e001.gif) O group. This results in a shift of 20 cm−1 for the –C
O group. This results in a shift of 20 cm−1 for the –C![[double bond, length as m-dash]](https://www.rsc.org/images/entities/char_e001.gif) O vibration from 1781 cm−1 (Fig. 19b), as confirmed by our previous experimental data (from 1655 cm−1 to 1633 cm−1, as shown in Fig. 15). Therefore, we predict that the adsorption of Cr(III) is produced as a result of both electrostatics and n–d mechanism.
O vibration from 1781 cm−1 (Fig. 19b), as confirmed by our previous experimental data (from 1655 cm−1 to 1633 cm−1, as shown in Fig. 15). Therefore, we predict that the adsorption of Cr(III) is produced as a result of both electrostatics and n–d mechanism.
 |
| | Fig. 19 Ab initio simulation of the interaction between Cr(III) and pomelo fruit peel. | |
4. Conclusions
In the present study, the phenomenon and biosorption mechanisms of MB and Cr(III) onto pomelo fruit peel are investigated. It has been found that pH plays an important role in removing MB and Cr(III) from aqueous solution. Moreover, based on the kinetic studies, we have demonstrated that the adsorption of MB and Cr(III) onto pomelo fruit peel has occurred in three distinguished stages, namely the bulk diffusion process, the gradual adsorption and the adsorption equilibrium. By combining the experimental data with the ab inito calculations, we have indicated, for the first time, that the uptake of MB can be occurred due to two adsorption mechanisms: electrostatic attraction and hydrogen bonding, whereas the biosorption of Cr(III) can be happened via the electrostatic attraction and n–d interaction mechanisms. This is the most important result of the present study. Finally, the maximum monolayer adsorption capacity of MB is found to be 218.5 mg g−1 at 303 K, which is higher than other popular biosorbents. This result demonstrates that pomelo fruit peel shall be a low-cost, environmentally friendly material for the removal of MB from effluents.
Conflicts of interest
There are no conflicts to declare.
References
- V. Geissen, H. Mol, E. Klumpp, G. Umlauf, M. Nadal, M. van der Ploeg, S. E. A. T. M. van de Zee and C. J. Ritsema, International Soil and Water Conservation Research, 2015, 3, 57–65 CrossRef.
- V. Vadivelan and K. V. Kumar, J. Colloid Interface Sci., 2005, 286, 90–100 CrossRef CAS PubMed.
- J. J. Salazar-Rabago, R. Leyva-Ramos, J. Rivera-Utrilla, R. Ocampo-Perez and F. J. Cerino-Cordova, Sustainable Environ. Res., 2017, 27, 32–40 CrossRef CAS.
- D. Pathania, S. Sharma and P. Singh, Arabian J. Chem., 2017, 10, S1445–S1451 CrossRef CAS.
- K. V. Kumar, V. Ramamurthi and S. Sivanesan, J. Colloid Interface Sci., 2005, 284, 14–21 CrossRef CAS PubMed.
- W.-S. Zhong, T. Ren and L.-J. Zhao, J. Food Drug Anal., 2016, 24, 46–55 CrossRef CAS PubMed.
- A.-L. Alanne, M. Tuikka, K. Tõnsuaadu, M. Ylisirniö, L. Hämäläinen, P. Turhanen, J. Vepsäläinen and S. Peräniemi, RSC Adv., 2013, 3, 14132–14138 RSC.
- J. H. Luo, J. Li, Y. B. Qi and Y. Q. Cao, Desalin. Water Treat., 2013, 51, 2130–2134 CrossRef CAS.
- D. Mohan, K. P. Singh and V. K. Singh, J. Hazard. Mater., 2006, 135, 280–295 CrossRef CAS PubMed.
- S. O. Owalude and A. C. Tella, Beni-Seuf Univ. J. Appl. Sci., 2016, 5, 377–388 Search PubMed.
- A. Ali, K. Saeed and F. Mabood, Alexandria Eng. J., 2016, 55, 2933–2942 CrossRef.
- M. A. Khan, Z. A. Alothman, M. Naushad, M. R. Khan and M. Luqman, Desalin. Water Treat., 2015, 53, 515–523 CrossRef CAS.
- E. Altintig, H. Altundag, M. Tuzen and A. Sarı, Chem. Eng. Res. Des., 2017, 122, 151–163 CrossRef CAS.
- G. Qin, M. J. McGuire, N. K. Blute, C. Seidel and L. Fong, Environ. Sci. Technol., 2005, 39, 6321–6327 CrossRef CAS PubMed.
- A. Esmaeili, E. Hejazi and A. H. Hassani, Water, Air, Soil Pollut., 2014, 225, 2140 CrossRef.
- N. W. Zainon Najib, F. M. Ridwan, A. M. Syakirah and B. S. Lim, Study of Methylene Blue color removal effectiveness by moringa oleifera and alum, 2012 Search PubMed.
- S. K. Mondal and P. Saha, Chem. Eng. Res. Des., 2018, 132, 564–583 CrossRef CAS.
- J. Wang, Z. Wu, T. Li, J. Ye, L. Shen, Z. She and F. Liu, Chem. Eng. J., 2018, 334, 579–586 CrossRef CAS.
- S. Rengaraj, K.-H. Yeon and S.-H. Moon, J. Hazard. Mater., 2001, 87, 273–287 CrossRef CAS PubMed.
- L. Rafati, A. H. Mahvi, A. R. Asgari and S. S. Hosseini, Int. J. Environ. Sci. Technol., 2010, 7, 147–156 CrossRef CAS.
- R. Giovanardi and G. Orlando, Surf. Coat. Technol., 2011, 205, 3947–3955 CrossRef CAS.
- A. Çimen, Russ. J. Phys. Chem. A, 2015, 89, 1238–1243 CrossRef.
- V.-P. Dinh, N.-C. Le, T.-P.-T. Nguyen and N.-T. Nguyen, J. Chem., 2016, 2016, 9 Search PubMed.
- V.-P. Dinh, N.-C. Le, V.-D. Nguyen and N.-T. Nguyen, Desalin. Water Treat., 2017, 58, 427–434 CrossRef CAS.
- V.-P. Dinh, N.-C. Le, T.-D. Le, T.-A. Bui and N.-T. Nguyen, J. Electron. Mater., 2017, 46, 3681–3688 CrossRef CAS.
- V.-P. Dinh, N.-C. Le, L. A. Tuyen, N. Q. Hung, V.-D. Nguyen and N.-T. Nguyen, Mater. Chem. Phys., 2018, 207, 294–302 CrossRef CAS.
- M. E. Argun, S. Dursun, C. Ozdemir and M. Karatas, J. Hazard. Mater., 2007, 141, 77–85 CrossRef CAS PubMed.
- L. Chen, A. Ramadan, L. Lü, W. Shao, F. Luo and J. Chen, J. Chem. Eng. Data, 2011, 56, 3392–3399 CrossRef CAS.
- R. Maurya, T. Ghosh, C. Paliwal, A. Shrivastav, K. Chokshi, I. Pancha, A. Ghosh and S. Mishra, PLoS One, 2014, 9, e109545 CrossRef PubMed.
- R. Saha and B. Saha, Desalin. Water Treat., 2014, 52, 1928–1936 CrossRef CAS.
- M. Mahmood-ul-Hassan, V. Suthor, E. Rafique and Y. Muhammad, Environ. Monit. Assess., 2015, 187, 8 CrossRef PubMed.
- E. Rosales, J. Meijide, T. Tavares, M. Pazos and M. Sanromán, Process Saf. Environ. Prot., 2016, 101 Search PubMed.
- J. Liu, G. Huang, J. Deng, K. Liu and Y. Xie, J. Ecol. Rural Environ., 2012, 28, 187–191 CAS.
- M. K. Dahri, M. R. R. Kooh and L. B. L. Lim, J. Environ. Biotechnol. Res., 2017, 6, 238–247 Search PubMed.
- M. E. Argun, D. Güclü and M. Karatas, J. Ind. Eng. Chem., 2014, 20, 1079–1084 CrossRef CAS.
- H. Li, Z. Sun, L. Zhang, Y. Tian, G. Cui and S. Yan, Colloids Surf., A, 2016, 489, 191–199 CrossRef CAS.
- P. Tasaso, J. Clean Energy Technol., 2014, 2, 154–157 CrossRef CAS.
- Y. Wu, L. Cha, Y. Fan, P. Fang, Z. Ming and H. Sha, Water, Air, Soil Pollut., 2017, 228, 405 CrossRef.
- S. X. Hou, in Advanced Materials Research, Trans Tech Publ, 2013, pp. 178–181 Search PubMed.
- M. Thomas, M. Brehm, R. Fligg, P. Vöhringer and B. Kirchner, Phys. Chem. Chem. Phys., 2013, 15, 6608–6622 RSC.
- M. Gastegger, J. Behler and P. Marquetand, Chem. Sci., 2017, 8, 6924–6935 RSC.
- X. Yu, L. Huang, Y. Wei, J. Zhang, Z. Zhao, W. Dai and B. Yao, Mater. Res. Bull., 2015, 64, 410–417 CrossRef CAS.
- A. M. Cardenas-Peña, J. G. Ibanez and R. Vasquez-Medrano, Int. J. Electrochem. Sci., 2012, 7, 6142–6153 Search PubMed.
- K. Y. Foo and B. H. Hameed, Chem. Eng. J., 2010, 156, 2–10 CrossRef CAS.
- I. Langmuir, J. Am. Chem. Soc., 1918, 40, 1361–1403 CrossRef CAS.
- H. M. F. Freundlich, J. Phys. Chem., 1906, 57, 385–471 CAS.
- M. J. Temkin and V. Pyzhev, Acta Physicochim. URSS, 1940, 12, 217–225 Search PubMed.
- R. R. Bhatt and B. A. Shah, Arabian J. Chem., 2015, 8, 414–426 CrossRef CAS.
- H. Tran, S.-J. You, T. V. Nguyen and H.-P. Chao, Chem. Eng. Commun., 2017, 204, 1020–1036 CrossRef CAS.
- M. Rafatullah, O. Sulaiman, R. Hashim and A. Ahmad, J. Hazard. Mater., 2009, 170, 969–977 CrossRef CAS PubMed.
- J. Anwar, U. Shafique, Z. Waheed uz, M. Salman, A. Dar and S. Anwar, Bioresour. Technol., 2010, 101, 1752–1755 CrossRef CAS PubMed.
- R.-L. Tseng, F.-C. Wu and R.-S. Juang, J. Taiwan Inst. Chem. Eng., 2010, 41, 661–669 CrossRef CAS.
- Y. S. Ho and G. McKay, Process Biochem., 1999, 34, 451–465 CrossRef CAS.
- A. M. Aljeboree, A. N. Alshirifi and A. F. Alkaim, Arabian J. Chem., 2017, 10, S3381–S3393 CrossRef CAS.
- W. J. Weber and J. C. Morris, J. Sanit. Eng. Div., Am. Soc. Civ. Eng., 1963, 89, 31–60 Search PubMed.
- S. Vasiliu, I. Bunia, S. Racovita and V. Neagu, Carbohydr. Polym., 2011, 85, 376–387 CrossRef CAS.
- F.-C. Wu, R.-L. Tseng and R.-S. Juang, J. Hazard. Mater., 2000, 73, 63–75 CrossRef CAS PubMed.
- V. J. Inglezakis and A. A. Zorpas, Desalin. Water Treat., 2012, 39, 149–157 CAS.
- A. B. Albadarin, C. Mangwandi, A. a. H. Al-Muhtaseb, G. M. Walker, S. J. Allen and M. N. M. Ahmad, Chem. Eng. J., 2012, 179, 193–202 CrossRef CAS.
- T. A. Saleh, A. Sarı and M. Tuzen, J. Environ. Chem. Eng., 2017, 5, 1079–1088 CrossRef CAS.
- M. Torab-Mostaedi, M. Asadollahzadeh, A. Hemmati and A. Khosravi, J. Taiwan Inst. Chem. Eng., 2013, 44, 295–302 CrossRef CAS.
- G. Zhang, Y. Sun, Y. Guo, J. Liu, L. Wu and J. Lin, J. Sci. Food Agric., 2018, 98, 4135–4141 CrossRef CAS PubMed.
- N. V. Farinella, G. D. Matos and M. A. Z. Arruda, Bioresour. Technol., 2007, 98, 1940–1946 CrossRef CAS PubMed.
- M. J. Frisch, G. W. Trucks, H. B. Schlegel, G. E. Scuseria, M. A. Robb, J. R. Cheeseman, G. Scalmani, V. Barone, B. Mennucci, G. A. Petersson, H. Nakatsuji, M. Caricato, X. Li, H. P. Hratchian, A. F. Izmaylov, J. Bloino, G. Zheng, J. L. Sonnenberg, M. Hada, M. Ehara, K. Toyota, R. Fukuda, J. Hasegawa, M. Ishida, T. Nakajima, Y. Honda, O. Kitao, H. Nakai, T. Vreven, J. A. Montgomery, J. E. Peralta, F. Ogliaro, M. Bearpark, J. J. Heyd, E. Brothers, K. N. Kudin, V. N. Staroverov, R. Kobayashi, J. Normand, K. Raghavachari, A. Rendell, J. C. Burant, S. S. Iyengar, J. Tomasi, M. Cossi, N. Rega, J. M. Millam, M. Klene, J. E. Knox, J. B. Cross, V. Bakken, C. Adamo, J. Jaramillo, R. Gomperts, R. E. Stratmann, O. Yazyev, A. J. Austin, R. Cammi, C. Pomelli, J. W. Ochterski, R. L. Martin, K. Morokuma, V. G. Zakrzewski, G. A. Voth, P. Salvador, J. J. Dannenberg, S. Dapprich, A. D. Daniels, Ö Farkas, J. B. Foresman, J. V. Ortiz, J. Cioslowski and D. J. Fox, Gaussian 09, Revision D.01, Wallingford CT, USA, 2009 Search PubMed.
- A. D. Becke, J. Chem. Phys., 1993, 98, 5648–5652 CrossRef CAS.
- V. A. Rassolov, J. A. Pople, M. A. Ratner and T. L. Windus, J. Chem. Phys., 1998, 109, 1223–1229 CrossRef CAS.
- V. A. Rassolov, M. A. Ratner, J. A. Pople, P. C. Redfern and L. A. Curtiss, J. Comput. Chem., 2001, 22, 976–984 CrossRef CAS.
- P. J. Hay and W. R. Wadt, J. Chem. Phys., 1985, 82, 270–283 CrossRef CAS.
- G. Annadurai, R.-S. Juang and D.-J. Lee, J. Hazard. Mater., 2002, 92, 263–274 CrossRef CAS PubMed.
- N. Priyantha, L. B. L. Lim, D. T. B. Tennakoon, E. T. Z. Liaw, C. H. Ing and A. B. Liyandeniya, Appl. Water Sci., 2018, 8, 37 CrossRef.
- L. B. L. Lim, N. Priyantha, C. Hei Ing, M. Khairud Dahri, D. T. B. Tennakoon, T. Zehra and M. Suklueng, Desalin. Water Treat., 2015, 53, 964–975 CAS.
- N. Priyantha, L. Lim and M. Dahri, Int. Food Res. J., 2015, 22, 2141–2148 CAS.
- L. B. L. Lim, N. Priyantha, D. T. B. Tennakoon, H. I. Chieng, M. K. Dahri and M. Suklueng, Arabian J. Chem., 2017, 10, S3216–S3228 CrossRef CAS.
|
| This journal is © The Royal Society of Chemistry 2019 |
Click here to see how this site uses Cookies. View our privacy policy here.  Open Access Article
 *a,
Thuy-Diem-Thuy Huynhb,
Hung M. Le
 c,
Van-Dong Nguyend,
Vinh-Ai Daoa,
N. Quang Hunga,
L. Anh Tuyene,
Sunhwa Leef,
Junsin Yif,
Trinh Duy Nguyen
 g and
L. V. Tanb


![[thin space (1/6-em)]](https://www.rsc.org/images/entities/char_2009.gif) e(−βε2),
e(−βε2),
![[thin space (1/6-em)]](https://www.rsc.org/images/entities/char_2009.gif) ln(1 + 1/Ce) (J mol−1) are the Dubinin–Radushkevich isotherm constant and Polanyi potential (J mol−1), respectively. The mean adsorption energy E (kJ mol−1), a parameter which is used to determine whether the adsorption is physical or chemical, can be then calculated from the following equation
ln(1 + 1/Ce) (J mol−1) are the Dubinin–Radushkevich isotherm constant and Polanyi potential (J mol−1), respectively. The mean adsorption energy E (kJ mol−1), a parameter which is used to determine whether the adsorption is physical or chemical, can be then calculated from the following equation


![[thin space (1/6-em)]](https://www.rsc.org/images/entities/char_2009.gif) 409
409

![[thin space (1/6-em)]](https://www.rsc.org/images/entities/char_2009.gif) ln
ln![[thin space (1/6-em)]](https://www.rsc.org/images/entities/char_2009.gif) KC,
KC,

![[thin space (1/6-em)]](https://www.rsc.org/images/entities/char_2009.gif) 683
683![[thin space (1/6-em)]](https://www.rsc.org/images/entities/char_2009.gif) 998
998![[thin space (1/6-em)]](https://www.rsc.org/images/entities/char_2009.gif) 537
537![[thin space (1/6-em)]](https://www.rsc.org/images/entities/char_2009.gif) 168
168![[double bond, length as m-dash]](https://www.rsc.org/images/entities/char_e001.gif) O bond.61,62 The band at 1110 cm−1 confirms the stretching vibration of C–O in the lignin structure of grapefruit peel.63 Furthermore, the FT-IR spectra of pomelo fruit peel after the adsorption of MB and Cr(III) are plotted in Fig. 14 (black curve) and Fig. 15 (read curve). In Fig. 14, in comparison with the results obtained for pomelo fruit peel, that is, without MB, the intensity of all the specific peaks of pomelo fruit peel, which characterise the –O–H groups, C
O bond.61,62 The band at 1110 cm−1 confirms the stretching vibration of C–O in the lignin structure of grapefruit peel.63 Furthermore, the FT-IR spectra of pomelo fruit peel after the adsorption of MB and Cr(III) are plotted in Fig. 14 (black curve) and Fig. 15 (read curve). In Fig. 14, in comparison with the results obtained for pomelo fruit peel, that is, without MB, the intensity of all the specific peaks of pomelo fruit peel, which characterise the –O–H groups, C![[double bond, length as m-dash]](https://www.rsc.org/images/entities/char_e001.gif) O and –C–O bonds, is increased. These results indicate that the adsorption of MB onto pomelo fruit peel occurs via the above-named functional groups. Similarly, the change in the intensity of these specific peaks after the adsorption of Cr(III), depicted by the red curve in Fig. 15, demonstrates the interaction between Cr(III) and pomelo fruit peel surface.
O and –C–O bonds, is increased. These results indicate that the adsorption of MB onto pomelo fruit peel occurs via the above-named functional groups. Similarly, the change in the intensity of these specific peaks after the adsorption of Cr(III), depicted by the red curve in Fig. 15, demonstrates the interaction between Cr(III) and pomelo fruit peel surface.


![[double bond, length as m-dash]](https://www.rsc.org/images/entities/char_e001.gif) O group. This results in a shift of 20 cm−1 for the –C
O group. This results in a shift of 20 cm−1 for the –C![[double bond, length as m-dash]](https://www.rsc.org/images/entities/char_e001.gif) O vibration from 1781 cm−1 (Fig. 19b), as confirmed by our previous experimental data (from 1655 cm−1 to 1633 cm−1, as shown in Fig. 15). Therefore, we predict that the adsorption of Cr(III) is produced as a result of both electrostatics and n–d mechanism.
O vibration from 1781 cm−1 (Fig. 19b), as confirmed by our previous experimental data (from 1655 cm−1 to 1633 cm−1, as shown in Fig. 15). Therefore, we predict that the adsorption of Cr(III) is produced as a result of both electrostatics and n–d mechanism.


