 Open Access Article
Identification of Pt-based catalysts for propane dehydrogenation via a probability analysis†
Shenjun
Zha
ab,
Guodong
Sun
ab,
Tengfang
Wu
ab,
Jiubing
Zhao
ab,
Zhi-Jian
Zhao
 *ab and
Jinlong
Gong
 *ab
*ab
aKey Laboratory for Green Chemical Technology of Ministry of Education, School of Chemical Engineering and Technology, Tianjin University, Tianjin 300072, China. E-mail: jlgong@tju.edu.cn; zjzhao@tju.edu.cn
bCollaborative Innovation Center of Chemical Science and Engineering, Tianjin 300072, China
First published on 26th March 2018
Abstract
The intrinsic errors due to functionals are always a concern on the reliability of the predicted catalytic performance by density functional theory. This paper describes a probability-based computational screening study, which has successfully identified an optimal bimetallic alloy (Pt3In) for the propane dehydrogenation reaction (PDH). Considering DFT uncertainty, Pt3In was found to have an activity comparable to that of pure Pt and Pt3Sn. Meanwhile, Pt3In shows a considerable improvement in the propylene selectivity compared with pure Pt. After a complete and progressive potential energy, free energy and microkinetic analysis, Pt3In was discovered to show a great balance between activity and selectivity and reach a maximum propylene formation performance. The first dehydrogenation step was found to be the rate-controlling step on most of the facets. Apart from separating Pt atoms and covering the low coordinated step Pt atoms, the role of In can also be attributed to an apparently increasing electron transfer from In to Pt. The adsorption energies of propylene that play a key role in selectivity and activity were correlated with the d-band center, which can be used to tune a more precise PtIn ratio for the PDH reaction in the future.
Introduction
Propylene is one of the most important types of compounds in the chemical industry, which is employed in the production of polypropylene, propylene oxide, acrylonitrile, etc.1 Due to the scarceness of fossil fuels and the discovery of shale gas, propane dehydrogenation (PDH) is becoming a more promising way to meet the increasing demand of propylene.2,3 Pt- and Cr-based catalysts are currently used in commercial PDH processes and deliver comparably high initial yields and stability.2 Compared with Cr-based catalysts, Pt-based catalysts are more environmentally friendly. However, pure Pt suffers from coke formation as well as low selectivity towards propylene. The anti-coking ability and propylene selectivity can be enhanced by alloying Pt with Cu,1 Sn,4 Ga,5 In,6 Ge,7etc. via combined geometric and electronic effects. From the geometric perspective, low coordinated surface Pt atoms such as step sites are more active but less selective.8,9 With the addition of Sn, the steps of Pt3Sn become inert, because the steps tend to be decorated with Sn, thus they suppress further dehydrogenation of propylene and coke formation.10 Besides, the surface enriched Sn divides large surface Pt ensembles into small pieces, which can further suppress the C–C scission step, since it normally requires larger Pt ensembles than C–H dissociation.3 In addition, the electron density of Pt atoms was observed to increase which is induced by charge transfer from Sn to Pt atom.11 The introduction of Sn downshifts the d-band center of surface Pt atoms which lowers the binding strength of propylene, promotes its desorption and results in higher propylene selectivity.12Although it is generally accepted that the main group metals can give a better selectivity, it is still unclear which element is the optimum choice for the PDH process from a fundamental perspective. With the developments of density functional theory (DFT), the computational screening procedure for heterogeneous catalyst design has become an important technique in recent years.13–15 By incorporating linear scaling relationships, e.g. Brønsted–Evans–Polanyi relationships and scaling the relationship between adsorption energies of surface intermediates/transition states, the reaction rates and product selectivity can be mapped from a high dimension space including information of all elementary steps to a simple descriptor space. Then, a volcano plot can be generated for a direct guide to locate the optimal catalyst.13–15 Interestingly, the recently developed Bayesian error estimation functional with van der Waals correlation (BEEF-vdW) will generate a large ensemble of variations around the prediction, which can be used to assess the reliability of our screening results.16,17 This paper describes a systematic study on the PDH reaction over Pt-based bimetallic alloy surfaces. By combining the scaling relationship with the reliability analysis, we predicted the probability that candidate catalysts display better performance than Pt. We successfully identified that In is potentially better than Sn as an alloy component to improve the PDH performance of pure Pt, and our synthesized PtIn catalyst does show enhanced PDH performance just like the PtSn catalyst.
Results and discussion
Screening of Pt-based catalysts
The well-recognized Pt![[thin space (1/6-em)]](https://www.rsc.org/images/entities/char_2009.gif) :
:![[thin space (1/6-em)]](https://www.rsc.org/images/entities/char_2009.gif) X = 3
X = 3![[thin space (1/6-em)]](https://www.rsc.org/images/entities/char_2009.gif) :
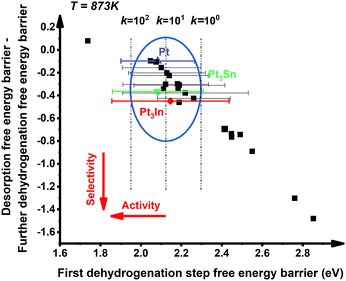
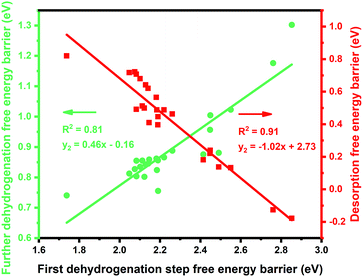
:![[thin space (1/6-em)]](https://www.rsc.org/images/entities/char_2009.gif) 1 (X = 3d metals, 4d metals, Ga, In, Sn) ratio was chosen for the screening.10,12,18 Most of the studies suggested the first or the second C–H bond cleavage of alkanes to be the rate-controlling step and the energy barrier values are almost the same for the two steps.2,8,9,12,19–24 Thus, the free energy barrier of the first dehydrogenation step was utilized to represent the activity of the PDH catalyst. Previous studies by Honkala et al. and De Chen et al. have suggested that the relative magnitude between propylene dehydrogenation and propylene desorption can be used to understand the selectivity.1,10,12 We follow a similar idea by applying the difference between C3H*6 desorption free energy barrier and further dehydrogenation free energy barrier from C3H*6 to 1-C3H*5 (a model precursor leading to coke formation) to roughly represent the selectivity. Based on the strategy mentioned above, we tested nearly 30 different bimetallic compounds for the PDH reaction and the results of our screening are illustrated in Fig. 1. Apparently, the activity (X axis in Fig. 1) and selectivity (Y axis in Fig. 1) were constrained by an approximately linear relationship, which indicates that the selectivity will decline with the rise of activity. The stronger C3H*7–Pt interaction will lead to enhanced dehydrogenation activity according to the Brønsted–Evans–Polanyi (BEP) relationship.25 The stronger C3H*7–Pt interaction accompanies the stronger C3H*6–Pt and C3H*5–Pt interactions based on the well-established scaling relationship of adsorption over transition metal surfaces, which leads to a lower free energy barrier of further dehydrogenation on the basis of the BEP relationship.26 Indeed, a positive correlation has been observed between the free energy barrier of the first dehydrogenation step and further propylene dehydrogenation free energy barriers (green line in Fig. 2). Meanwhile, strong C3H*6–Pt interaction inhibits propylene desorption, which lowers the selectivity towards the target propylene. Therefore, a negative correlation has been observed between the first dehydrogenation step free energy barrier and propylene desorption free energy barrier (red line in Fig. 2). Unsurprisingly, according to the two above-discussed linear relationships, the activity (X axis in Fig. 1) and selectivity (Y axis in Fig. 1) were constrained by a new approximately linear relationship. In the desired situation, the optimal catalyst has the first dehydrogenation free energy barrier that is smaller than or at least comparable with that of pure Pt. Meanwhile, a larger difference between the desorption free energy barrier and further dehydrogenation free energy barrier is preferred. If we could accept the loss of the dehydrogenation activity by one order of magnitude compared with pure Pt, i.e. the points on the left of the rate constants k = 100 line, Pt3In seems to be the optimal catalyst with best selectivity.
1 (X = 3d metals, 4d metals, Ga, In, Sn) ratio was chosen for the screening.10,12,18 Most of the studies suggested the first or the second C–H bond cleavage of alkanes to be the rate-controlling step and the energy barrier values are almost the same for the two steps.2,8,9,12,19–24 Thus, the free energy barrier of the first dehydrogenation step was utilized to represent the activity of the PDH catalyst. Previous studies by Honkala et al. and De Chen et al. have suggested that the relative magnitude between propylene dehydrogenation and propylene desorption can be used to understand the selectivity.1,10,12 We follow a similar idea by applying the difference between C3H*6 desorption free energy barrier and further dehydrogenation free energy barrier from C3H*6 to 1-C3H*5 (a model precursor leading to coke formation) to roughly represent the selectivity. Based on the strategy mentioned above, we tested nearly 30 different bimetallic compounds for the PDH reaction and the results of our screening are illustrated in Fig. 1. Apparently, the activity (X axis in Fig. 1) and selectivity (Y axis in Fig. 1) were constrained by an approximately linear relationship, which indicates that the selectivity will decline with the rise of activity. The stronger C3H*7–Pt interaction will lead to enhanced dehydrogenation activity according to the Brønsted–Evans–Polanyi (BEP) relationship.25 The stronger C3H*7–Pt interaction accompanies the stronger C3H*6–Pt and C3H*5–Pt interactions based on the well-established scaling relationship of adsorption over transition metal surfaces, which leads to a lower free energy barrier of further dehydrogenation on the basis of the BEP relationship.26 Indeed, a positive correlation has been observed between the free energy barrier of the first dehydrogenation step and further propylene dehydrogenation free energy barriers (green line in Fig. 2). Meanwhile, strong C3H*6–Pt interaction inhibits propylene desorption, which lowers the selectivity towards the target propylene. Therefore, a negative correlation has been observed between the first dehydrogenation step free energy barrier and propylene desorption free energy barrier (red line in Fig. 2). Unsurprisingly, according to the two above-discussed linear relationships, the activity (X axis in Fig. 1) and selectivity (Y axis in Fig. 1) were constrained by a new approximately linear relationship. In the desired situation, the optimal catalyst has the first dehydrogenation free energy barrier that is smaller than or at least comparable with that of pure Pt. Meanwhile, a larger difference between the desorption free energy barrier and further dehydrogenation free energy barrier is preferred. If we could accept the loss of the dehydrogenation activity by one order of magnitude compared with pure Pt, i.e. the points on the left of the rate constants k = 100 line, Pt3In seems to be the optimal catalyst with best selectivity.
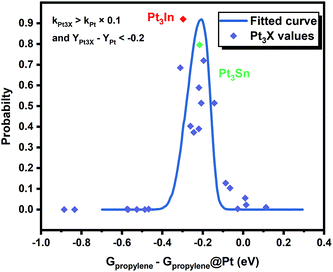
However, it is hard to judge the optimal PDH catalyst solely based on BEEF-vdW values (data points in Fig. 1) due to the intrinsic errors in functionals (GGA level DFT calculations are known to generate errors as large as 0.2 eV). Fortunately, the BEEF-vdW functional could generate an ensemble of exchange–correlation functionals to evaluate the consequence of an imperfect representation of exchange–correlation effects on the predicted surface chemistry (Section S2†).16 The errors were represented by the standard deviation of the 2000 ensemble predictions in Fig. 1 (Table S2 and Fig. S2†). Clearly, the error bars on the dehydrogenation barriers expand as large as ±0.2–0.3 eV, corresponding to about 2–3 orders of magnitude on the predicted rate constants. Therefore, we further evaluated the probability of the Pt-based bimetallic alloy surfaces having comparable activity and higher selectivity than pure Pt based on the BEEF-vdW ensemble (points in Fig. 3). For example, YPt3X − YPt < −0.2 and kPt3X > kPt × 0.1 (Y: the difference between propylene desorption free energy barrier and further dehydrogenation step free energy barrier of Pt3X, kPt3X: the rate constants of Pt3X) in Fig. 3 mean Pt3X shows better selectivity and acceptable activity. Although it seems a little arbitrary for this criterion, similar trends have been obtained if we set different criteria (Fig. S4†). Among all the tested criteria, Pt3In was always found to be the top two optimal catalysts (Table S3†), which ensures the reliability of our screening result. Previous calculations by Yang et al. suggested that Pt3Sn is an optional candidate that lowers the propylene desorption barrier and simultaneously increases the dehydrogenation transition state barrier, consistent with our screening data in Fig. 1 and 3.12
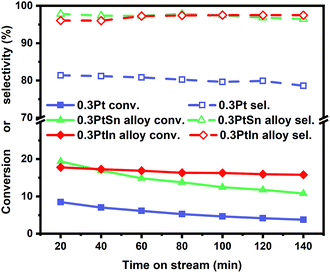
Moreover, the scaling relationships between the first dehydrogenation free energy barrier and propylene desorption free energy barrier, between the first dehydrogenation free energy barrier and further dehydrogenation free energy barrier still hold for the 2000 sets of data in the BEEF error ensemble. So, we can use propylene desorption free energy barrier as a descriptor to quickly estimate the first dehydrogenation free energy barrier and further dehydrogenation free energy barrier. Then, the probability that the activity and selectivity of a given catalyst, with any propylene desorption free energy barrier, are better than those of pure Pt under given activity and selectivity constraint conditions can be calculated (Scheme S1 in the ESI†), as shown in the fitted curve in Fig. 3. In Fig. 3, the probability reaches a maximum when the propylene desorption free energy barrier is about −0.2 eV smaller than that of pure Pt. Our calculated Pt3X values (points in Fig. 3) are almost on the fitted curve, indicating that the errors introduced by the scaling relationship are acceptable. Thus, we can estimate the probability under a specified propylene desorption free energy barrier. This can be used to discover more PDH catalysts by choosing a suitable propylene desorption free energy barrier. In order to confirm our screening study, we synthesized SiO2 supported Pt, PtIn alloy and PtSn alloy (Section S3†). As shown in Fig. 4, the propylene selectivity was dramatically increased after alloying Pt with In or Sn. At the same time, a better stability has been observed for the PtIn alloy compared with the Pt or PtSn alloy, consistent with our screening results discussed above. Note that the higher conversion of PtSn and PtIn alloys might due to the increased number of exposed Pt atoms compared with the Pt only catalyst, although the activity of individual sites is lower on the PtSn or PtIn alloy according to DFT calculations.
PDH mechanism over PtIn alloy surfaces
In the following parts, a more detailed mechanism for PtIn catalysts was explored to confirm our proposal in the screening process. The segregation energies of PtIn catalysts were calculated (Table S4†) and no segregation phenomena were found for PtIn catalysts. Moreover, an additional global optimization of PtIn catalysts using a genetic algorithm27 was done to determine the most stable PtIn catalyst structure. The homogeneous bulk alloy was found to be the most stable, which is consistent with the experimental results6,28 (Section S1†). Therefore, only homogeneous bulk alloys were taken into consideration. A series of PtIn alloys with different PtIn mole ratios and facets were chosen, i.e. Pt(211), Pt(100), Pt(111), Pt3In(211), Pt3In(100), Pt3In(111), Pt1In1(111), and PtIn2(110) (Fig. S1†). Note that previous calculations have proved that the slab surface model can well describe Pt particles larger than about 1.6 nm.29,30 In this paper, the step sites of a metal/alloy particle were represented by (211) facets, while the terrace sites are represented by (111) and (100) surfaces (Fig. S6†).23We chose a relatively simplified reaction network for the propane dehydrogenation reaction via two sequential dehydrogenation reactions (Scheme 1), which is based on the fact that C–C bond breaking needs a deeply dehydrogenated precursor, i.e. propyne (CH3CCH*).8 The surface propylene either desorbs to form gas phase propylene or further dehydrogenates and the dehydrogenation products of propylene (C3H*5) were chosen to be a model precursor for coke deposition. Pt3In(211)_Pt and Pt3In(211)_In are two possible facets of Pt3In(211). The step atoms of Pt3In(211)_Pt are all Pt atoms, while the step atoms of Pt3In(211)_In are arrayed by Pt and In one by one (Fig. S1d and e†).
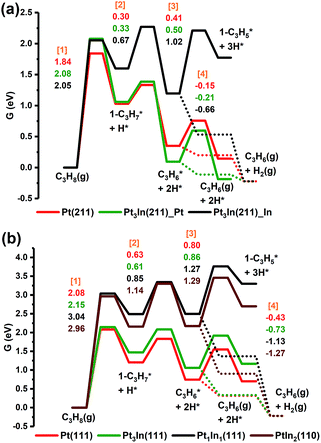
From Fig. 5a, we can see that the free energy barriers of the first dehydrogenation step over Pt(211), Pt3In(211)_Pt and Pt3In(211)_ In (1.84 eV, 2.08 eV and 2.05 eV) are almost the same. Due to the loss of gas phase entropy, the free energy barrier of the first dehydrogenation step (∼2.0 eV) is much higher than the barrier of the second dehydrogenation step (∼0.5 eV). The second and further dehydrogenation free energy barriers of Pt3In(211)_In (0.67 eV and 1.02 eV) are higher than that of Pt(211) (0.30 eV and 0.41 eV) and Pt3In(211)_Pt (0.33 eV and 0.50 eV), which indicates an activity loss and inhibition of further dehydrogenation over Pt3In(211)_In compared with that over pure Pt(211). Meanwhile, the C3H*6 desorption free energy over Pt3In(211)_In (−0.66 eV) is much exothermic than that over Pt(211) (−0.15 eV) and Pt3In(211)_Pt (−0.22 eV), which means propylene desorption is more selective over Pt3In(211)_In than that over Pt3In(211)_Pt. Because the properties of the two possible surfaces of Pt3In(211) vary greatly, the surface energies of the two possible surfaces of Pt3In(211) were calculated in order to identify the more thermodynamically stable surface.10,31 From Fig. S5a,† it can be observed that Pt3In(211)_In has lower surface energies in the whole possible range, which means Pt3In(211)_In is preferred thermodynamically. This result indicates that the undercoordinated sites of Pt tend to be partially covered by In atoms, which plays a crucial role in elucidating the improvements in propylene selectivity at step edges of a PtIn alloy particle. The situation of (100) facets is almost the same as that of (211) facets (Fig. S5b and Table S8†). The dehydrogenation activity shows a dramatic decrease when the Pt![[thin space (1/6-em)]](https://www.rsc.org/images/entities/char_2009.gif) :
:![[thin space (1/6-em)]](https://www.rsc.org/images/entities/char_2009.gif) In ratio is lower than 3
In ratio is lower than 3![[thin space (1/6-em)]](https://www.rsc.org/images/entities/char_2009.gif) :
:![[thin space (1/6-em)]](https://www.rsc.org/images/entities/char_2009.gif) 1, as reflected by the sharp lift of the first dehydrogenation barrier shown in Fig. 5b. The propylene desorption ΔG of Pt3In(111) is −0.73 eV, while the ΔG of Pt(111) is −0.43 eV. Thus, the selectivity will have an improvement when the PtIn ratio becomes 3
1, as reflected by the sharp lift of the first dehydrogenation barrier shown in Fig. 5b. The propylene desorption ΔG of Pt3In(111) is −0.73 eV, while the ΔG of Pt(111) is −0.43 eV. Thus, the selectivity will have an improvement when the PtIn ratio becomes 3![[thin space (1/6-em)]](https://www.rsc.org/images/entities/char_2009.gif) :
:![[thin space (1/6-em)]](https://www.rsc.org/images/entities/char_2009.gif) 1. Although Pt1In1(111) and PtIn2(110) have an even smaller propylene desorption ΔG than Pt3In(111) (−1.13 eV and −1.27 eV) which indicates a better selectivity, their reaction activity is much lower and the improvements in selectivity are hard to compensate for the great loss in activity. The results obtained from the route of β-type PDH reaction (C3H8 → 2-C3H*7 → C3H*6 → 2-C3H*5) are almost the same as that of the α-type PDH reaction (C3H8 → 1-C3H*7 → C3H*6 → 1-C3H*5) (Fig. S11†).
1. Although Pt1In1(111) and PtIn2(110) have an even smaller propylene desorption ΔG than Pt3In(111) (−1.13 eV and −1.27 eV) which indicates a better selectivity, their reaction activity is much lower and the improvements in selectivity are hard to compensate for the great loss in activity. The results obtained from the route of β-type PDH reaction (C3H8 → 2-C3H*7 → C3H*6 → 2-C3H*5) are almost the same as that of the α-type PDH reaction (C3H8 → 1-C3H*7 → C3H*6 → 1-C3H*5) (Fig. S11†).
Microkinetic analysis
A microkinetic analysis was constructed to describe the kinetics of the PDH reaction (Section S8†).32 In this microkinetic modeling, the steady state is calculated by a time integration method until a steady surface coverage and product pressure are reached. Meanwhile, the model coke precursor (1-C3H*5) reached a thermodynamic equilibrium with C3H*6 at the steady state, according to steady state approximation. As shown in Table 1, the propylene formation turnover frequency (TOF) of Pt3In(211)_In is about two orders of magnitude lower than that of pure Pt(211). Meanwhile, the coverage of the coke precursor of Pt(211) is about five orders of magnitude higher than that of Pt3In(211)_In, which means Pt3In(211)_In promotes anti-coking ability to a great extent. We changed the adsorption energy of our model coke precursor to represent the more stable coke precursors. In Fig. S12,† with the increase of the model coke precursor adsorption energy, the surface was gradually covered by coke. This phenomenon indicates Pt3In(211)_In might exhibit a better propylene formation performance than pure Pt(211) under real catalysis conditions due to the slower coke formation over Pt3In(211)_In, which enhances the catalyst stability consistent with our experimentally observed enhanced stability of PtIn alloy shown in Fig. 4. The situations of (100) and (111) facets are almost the same. As mentioned above, a small PtIn particle was assumed to be cuboctahedra dominated by low coordinated edge sites represented by (211) facets. Although the addition of In decreases the reactivity, the benefit brought by the selectivity finally leads to the increment in propylene formation performance at the PtIn ratio of 3![[thin space (1/6-em)]](https://www.rsc.org/images/entities/char_2009.gif) :
:![[thin space (1/6-em)]](https://www.rsc.org/images/entities/char_2009.gif) 1. Taking a higher proportion of In into consideration, Pt1In1(111) may have a good control of coke formation, but the propylene formation TOF is about several magnitudes lower than that of pure Pt and Pt3In alloy. The benefit brought by the decrement of the coke precursor may not compensate for the loss of activity. Taking all the potential energy analysis, free energy analysis and microkinetic simulation analysis into consideration, a conclusion could be made that the Pt3In catalyst may show the highest propylene formation performance under real reaction conditions. Based on the data from microkinetic analysis, the degree of rate control was calculated to identify the rate-controlling step.33,34 The rate-controlling step is defined as a non-zero XRC, which can be more than one elementary step. The larger the XRC is, the more rate-controlling the elementary reaction is. From Table 2, the first dehydrogenation step was found to be the most rate-controlling step on almost all the facets.
1. Taking a higher proportion of In into consideration, Pt1In1(111) may have a good control of coke formation, but the propylene formation TOF is about several magnitudes lower than that of pure Pt and Pt3In alloy. The benefit brought by the decrement of the coke precursor may not compensate for the loss of activity. Taking all the potential energy analysis, free energy analysis and microkinetic simulation analysis into consideration, a conclusion could be made that the Pt3In catalyst may show the highest propylene formation performance under real reaction conditions. Based on the data from microkinetic analysis, the degree of rate control was calculated to identify the rate-controlling step.33,34 The rate-controlling step is defined as a non-zero XRC, which can be more than one elementary step. The larger the XRC is, the more rate-controlling the elementary reaction is. From Table 2, the first dehydrogenation step was found to be the most rate-controlling step on almost all the facets.
| Propylene formation TOF (mol C3H6(g) per mol site per s) | Coke precursor coverage (1-C3H*5 and 2-C3H*5) | |
|---|---|---|
| Pt(211) | 1.49 × 10² | 2.14 × 10⁻⁸ |
| Pt(100) | 6.00 × 101 | 4.05 × 10⁻⁹ |
| Pt(111) | 2.61 × 100 | 1.30 × 10⁻¹⁰ |
| Pt3In(211)_In | 3.89 × 100 | 3.03 × 10⁻¹³ |
| Pt3In(100)_In | 1.82 × 10⁻¹ | 6.68 × 10⁻¹⁵ |
| Pt3In(111) | 7.64 × 10⁻¹ | 5.09 × 10⁻¹² |
| Pt1In1(111) | 5.64 × 10⁻⁶ | 1.05 × 10⁻¹⁸ |
| XRC | C3H8(g) → 1-C3H*7 | C3H8(g) → 2-C3H*7 | 1-C3H*7 → C3H*6 | 2-C3H*7 → C3H*6 | C3H*6 → C3H6(g) |
|---|---|---|---|---|---|
| Pt(211) | 0.31 | 0.69 | 0 | 0 | 0 |
| Pt(100) | 0.31 | 0.69 | 0 | 0 | 0 |
| Pt(111) | 0.74 | 0.26 | 0 | 0 | 0 |
| Pt3In(211)_In | 0.66 | 0.30 | 0.04 | 0 | 0 |
| Pt3In(100)_In | 0.30 | 0.20 | 0.21 | 0.30 | 0 |
| Pt3In(111) | 0.99 | 0 | 0 | 0 | 0 |
| Pt1In1(111) | 1.00 | 0 | 0 |
Nature of In addition
With the addition of In, both geometric and electronic effects are introduced. As discussed in Section S4 and Table S6,† the geometric effect of In is attributed to the creation of separated Pt atoms, which leads to the transformation from strong di-σ propylene adsorption mode to weak π adsorption mode. Moreover, the In atoms will cover low coordinated Pt atoms that tend to cause further dehydrogenation. This conclusion is proved by our results of surface energy and PDH mechanism calculations that step sites of thermodynamically preferred Pt3In(211) are covered by In atoms and Pt3In(211)_Pt prefers further dehydrogenation. As to the electronic effect of In, Fig. 6a shows that the d-band filling and charge density of surface Pt atoms increase with the addition of In atoms on different facets corresponding to the results of LIII-edge X-ray absorption near edge structure (XANES).6,35 To gain a better understanding of the role of In in changing the adsorption and catalytic properties of surface Pt atoms, we correlated the propylene π adsorption energy with the d-band center in Fig. 6b and found a good correlation. The lower the d-band center, the weaker the propylene adsorption energy. The addition of In lowers the d-band center of surface Pt and facilitates the desorption of propylene. Meanwhile, it brings a loss of catalytic activity for the PDH reaction.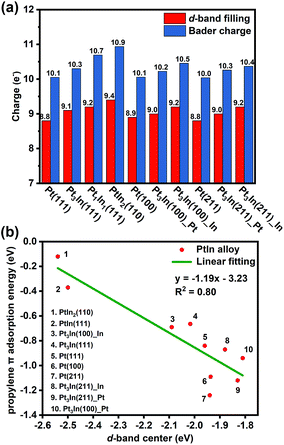 | ||
| Fig. 6 (a) The d-band filling and Bader charge analysis. (b) Correlation between the d-band center of surface Pt and propylene π adsorption energy. | ||
Conclusions
In summary, probability-based screening has been performed for the propane dehydrogenation reaction to overcome the shortcomings of the traditional computational screening process and the result shows that the PtIn catalyst is an optimal catalyst candidate among all the tested alloys. Furthermore, the uncertainty was estimated to ensure reliability when searching for an optimal catalyst and the PtIn catalyst was found lying in the ideal region all the time. Then, free energy analysis and microkinetic analysis were introduced gradually to elucidate the mechanism of propane dehydrogenation reaction. A tiny loss in catalytic activity and an excellent improvement in selectivity were found when the ratio of PtIn was 3![[thin space (1/6-em)]](https://www.rsc.org/images/entities/char_2009.gif) :
:![[thin space (1/6-em)]](https://www.rsc.org/images/entities/char_2009.gif) 1. When it comes to higher PtIn ratios, Pt1In1 and PtIn2 will suffer great loss in activity. The rate-controlling step turned out to be the first dehydrogenation step on most of the facets. The geometric role of In is not only separating the Pt atoms, but also covering the step Pt atoms while the electronic effect can be attributed to the electron transfer from In to Pt. The adsorption of propylene was found to play a key role in PDH activity and selectivity from our volcano plot and the d-band center shows great correlation with the propylene π adsorption energy, which means the d-band center can be used to seek a more precise PtIn ratio for the PDH reaction in the future.
1. When it comes to higher PtIn ratios, Pt1In1 and PtIn2 will suffer great loss in activity. The rate-controlling step turned out to be the first dehydrogenation step on most of the facets. The geometric role of In is not only separating the Pt atoms, but also covering the step Pt atoms while the electronic effect can be attributed to the electron transfer from In to Pt. The adsorption of propylene was found to play a key role in PDH activity and selectivity from our volcano plot and the d-band center shows great correlation with the propylene π adsorption energy, which means the d-band center can be used to seek a more precise PtIn ratio for the PDH reaction in the future.
Methods
Vienna ab initio simulation package (VASP) was used to perform calculations with the BEEF-vdW exchange–correlation functional.17,36–38 Valence electrons were described by using a plane-wave basis set with the cut-off energy of 400 eV. Meanwhile, core electrons were treated using the projector augmented-wave (PAW) method.39 The Monkhorst–Pack k-point grid was used to sample the Brillouin zone of the surface (Table S1†).40 The electronic occupancies were determined according to the Methfessel–Paxton scheme with an energy smearing of 0.15 eV and the total energies were evaluated by extrapolating to zero broadening. The dipole correction was included in the direction perpendicular to the slab surface. The four-layer slab was built with top two layers relaxed and the size of the slab is provided in Table S1.† All structures were optimized until the force on each atom was less than 0.02 eV Å−1.It should be noted that the BEEF-vdW exchange–correlation functional provides a quantitative description of van der Waals interactions between molecules while maintaining accurate chemisorption energy. Moreover, a large (2000 for this work) ensemble of variations around the BEEF-vdW prediction will be generated after the self-consistent DFT calculations, which can be used to assess the reliability of DFT calculations.16,17,41
In the global optimization using the genetic algorithm (GA), we optimized the structure and evaluated the associated total energies for all the possible sites found for In atoms. The GA started with an initial generation for which a population of 20 members is selected. The structures were relaxed. After each generation, the resulting total energies were classified from the lowest to the highest and the most stable systems were selected. For the same 20 population as in the initial generation, the most stable structures in all generations were selected to be the survival of the fittest. In order to increase the possibility of passing the structural information from the more stable structures, the parent structure was chosen according to roulette wheel selection using an exponential fitness function with α = 3.27
The transition states of the reactions were determined by either the climbing nudged elastic band method or the dimer method.42,43 It was ensured that the optimized structure of the transition state had only one imaginary frequency.
Conflicts of interest
There are no conflicts to declare.Acknowledgements
We thank Prof. Felix Studt for stimulating discussions. This work is financially supported by the National Science Foundation of China (No. 21506149, 21525626, 21761132023 and 21676181), and the Program of Introducing Talents of Discipline to Universities (No. B06006).References
- Z. Han, S. Li, F. Jiang, T. Wang, X. Ma and J. Gong, Nanoscale, 2014, 6, 10000–10008 RSC.
- J. J. Sattler, J. Ruiz-Martinez, E. Santillan-Jimenez and B. M. Weckhuysen, Chem. Rev., 2014, 114, 10613–10653 CrossRef CAS PubMed.
- Z. J. Zhao, C. C. Chiu and J. Gong, Chem. Sci., 2015, 6, 4403–4425 RSC.
- H. Zhu, D. H. Anjum, Q. Wang, E. Abou-Hamad, L. Emsley, H. Dong, P. Laveille, L. Li, A. K. Samal and J.-M. Basset, J. Catal., 2014, 320, 52–62 CrossRef CAS.
- G. Siddiqi, P. Sun, V. Galvita and A. T. Bell, J. Catal., 2010, 274, 200–206 CrossRef CAS.
- P. Sun, G. Siddiqi, W. C. Vining, M. Chi and A. T. Bell, J. Catal., 2011, 282, 165–174 CrossRef CAS.
- A. D. Ballarini, P. Zgolicz, I. M. J. Vilella, S. R. de Miguel, A. A. Castro and O. A. Scelza, Appl. Catal., A, 2010, 381, 83–91 CrossRef CAS.
- M. L. Yang, Y. A. Zhu, C. Fan, Z. J. Sui, D. Chen and X. G. Zhou, Phys. Chem. Chem. Phys., 2011, 13, 3257–3267 RSC.
- M.-L. Yang, J. Zhu, Y.-A. Zhu, Z.-J. Sui, Y.-D. Yu, X.-G. Zhou and D. Chen, J. Mol. Catal. A: Chem., 2014, 395, 329–336 CrossRef CAS.
- L. Nykänen and K. Honkala, ACS Catal., 2013, 3, 3026–3030 CrossRef.
- L. Nykänen and K. Honkala, J. Phys. Chem. C, 2011, 115, 9578–9586 Search PubMed.
- M.-L. Yang, Y.-A. Zhu, X.-G. Zhou, Z.-J. Sui and D. Chen, ACS Catal., 2012, 2, 1247–1258 CrossRef CAS.
- J. Greeley, T. F. Jaramillo, J. Bonde, I. B. Chorkendorff and J. K. Norskov, Nat. Mater., 2006, 5, 909–913 CrossRef CAS PubMed.
- F. Studt, F. Abild-Pedersen, T. Bligaard, R. Z. Sorensen, C. H. Christensen and J. K. Norskov, Science, 2008, 320, 1320–1322 CrossRef CAS PubMed.
- J. Greeley, I. E. Stephens, A. S. Bondarenko, T. P. Johansson, H. A. Hansen, T. F. Jaramillo, J. Rossmeisl, I. Chorkendorff and J. K. Norskov, Nat. Chem., 2009, 1, 552–556 CrossRef CAS PubMed.
- A. J. Medford, J. Wellendorff, A. Vojvodic, F. Studt, F. Abild-Pedersen, K. W. Jacobsen, T. Bligaard and J. K. Norskov, Science, 2014, 345, 197–200 CrossRef CAS PubMed.
- J. Wellendorff, K. T. Lundgaard, A. Møgelhøj, V. Petzold, D. D. Landis, J. K. Nørskov, T. Bligaard and K. W. Jacobsen, Phys. Rev. B: Condens. Matter Mater. Phys., 2012, 85, 235149 CrossRef.
- V. Stamenkovic, B. S. Mun, K. J. Mayrhofer, P. N. Ross, N. M. Markovic, J. Rossmeisl, J. Greeley and J. K. Norskov, Angew. Chem., Int. Ed., 2006, 45, 2897–2901 CrossRef CAS PubMed.
- R. D. Cortright, P. E. Levin and J. A. Dumesic, Ind. Eng. Chem. Res., 1998, 37, 1717–1723 CrossRef CAS.
- R. D. Cortright, J. M. Hill and J. A. Dumesic, Catal. Today, 2000, 55, 213–223 CrossRef CAS.
- U. Olsbye, A. Virnovskaia, Ø. Prytz, S. J. Tinnemans and B. M. Weckhuysen, Catal. Lett., 2005, 103, 143–148 CrossRef CAS.
- V. Galvita, G. Siddiqi, P. Sun and A. T. Bell, J. Catal., 2010, 271, 209–219 CrossRef CAS.
- J. Zhu, M.-L. Yang, Y. Yu, Y.-A. Zhu, Z.-J. Sui, X.-G. Zhou, A. Holmen and D. Chen, ACS Catal., 2015, 5, 6310–6319 CrossRef CAS.
- A. Hook, J. D. Massa and F. E. Celik, J. Phys. Chem. C, 2016, 120, 27307–27318 CAS.
- R. A. van Santen, M. Neurock and S. G. Shetty, Chem. Rev., 2010, 110, 2005–2048 CrossRef CAS PubMed.
- F. Abild-Pedersen, J. Greeley, F. Studt, J. Rossmeisl, T. R. Munter, P. G. Moses, E. Skulason, T. Bligaard and J. K. Norskov, Phys. Rev. Lett., 2007, 99, 016105 CrossRef CAS PubMed.
- H. Yildirim, A. Kinaci, Z. J. Zhao, M. K. Chan and J. P. Greeley, ACS Appl. Mater. Interfaces, 2014, 6, 21141–21150 CAS.
- F. B. Passos, D. A. G. Aranda and M. Schmal, J. Catal., 1998, 178, 478–488 CrossRef CAS.
- L. Li, A. H. Larsen, N. A. Romero, V. A. Morozov, C. Glinsvad, F. Abild-Pedersen, J. Greeley, K. W. Jacobsen and J. K. Norskov, J. Phys. Chem. Lett., 2013, 4, 222–226 CrossRef CAS PubMed.
- I. V. Yudanov, M. Metzner, A. Genest and N. Rösch, J. Phys. Chem. C, 2008, 112, 20269–20275 CAS.
- N. Moll, A. Kley, E. Pehlke and M. Scheffler, Phys. Rev. B: Condens. Matter Mater. Phys., 1996, 54, 8844–8855 CrossRef CAS.
- Z.-J. Zhao, Z. Li, Y. Cui, H. Zhu, W. F. Schneider, W. N. Delgass, F. Ribeiro and J. Greeley, J. Catal., 2017, 345, 157–169 CrossRef CAS.
- C. T. Campbell, Top. Catal., 1994, 1, 353–366 CrossRef CAS.
- C. Stegelmann, A. Andreasen and C. T. Campbell, J. Am. Chem. Soc., 2009, 131, 8077–8082 CrossRef CAS PubMed.
- W. Tang, E. Sanville and G. Henkelman, J. Phys.: Condens. Matter, 2009, 21, 084204 CrossRef CAS PubMed.
- J. J. Mortensen, K. Kaasbjerg, S. L. Frederiksen, J. K. Norskov, J. P. Sethna and K. W. Jacobsen, Phys. Rev. Lett., 2005, 95, 216401 CrossRef CAS PubMed.
- G. Kresse and J. Furthmüller, Comput. Mater. Sci., 1996, 6, 15–50 CrossRef CAS.
- G. Kresse and J. Hafner, Phys. Rev. B: Condens. Matter Mater. Phys., 1994, 49, 14251–14269 CrossRef CAS.
- G. Kresse and D. Joubert, Phys. Rev. B: Condens. Matter Mater. Phys., 1999, 59, 1758–1775 CrossRef CAS.
- H. J. Monkhorst and J. D. Pack, Phys. Rev. B: Solid State, 1976, 13, 5188–5192 CrossRef.
- R. Christensen, H. A. Hansen and T. Vegge, Catal. Sci. Technol., 2015, 5, 4946–4949 CAS.
- G. Henkelman, B. P. Uberuaga and H. Jónsson, J. Chem. Phys., 2000, 113, 9901–9904 CrossRef CAS.
- G. Henkelman and H. Jónsson, J. Chem. Phys., 1999, 111, 7010–7022 CrossRef CAS.
Footnote |
| † Electronic supplementary information (ESI) available: Calculation details. See DOI: 10.1039/c8sc00802g |
| This journal is © The Royal Society of Chemistry 2018 |

